Article

Improving Electric Power Stability and Efficiency Using an Integrated Control System for Refrigerated Containers

Eco Friendly Propulsion System Technology Team, Korea Marine Equipment Research Institute, 28-36, Yusangongdan 4-gil, Yangsan-si 50592, Republic of Korea
J. Mar. Sci. Eng. 2024, 12(9), 1624; https://doi.org/10.3390/jmse12091624
Submission received: 21 August 2024 / Revised: 8 September 2024 / Accepted: 10 September 2024 / Published: 12 September 2024
(This article belongs to the Special Issue Advanced Technologies for New (Clean) Energy Ships)

Abstract

:
In this study, a method is proposed to minimize electrical load fluctuations and improve the efficiency of engine generator operation by managing refrigerated ship containers through an integrated control system. The proposed system actively controls the electrical load by assigning operational priorities based on cargo temperature deviations to existing independently operated refrigerated containers, ensuring that they operate only within the available power of the engine generator. As a result, the average specific fuel oil consumption can be reduced. A 70 h simulation of the refrigerated containers, a power system, and an integrated control system demonstrated in MATLAB/Simulink 2021b that the magnitude of electrical load fluctuations decreases from 37.6% to 9.6% of the engine generator’s rated power compared with the conventional operation of refrigerated containers. In addition, a 1.88% fuel saving is realized.

1. Introduction

Climate change has caused a global crisis, which is accelerating at an alarming rate, prompting various research fields to address this problem [1,2,3]. The International Maritime Organization (IMO) strives to reduce greenhouse gas emissions from ships by enforcing regulations discussed in the Energy Efficiency Design Index (EEDI) and Energy Efficiency Existing Ship Index (EEXI) [4,5,6]. Therefore, ship operators are looking for solutions to improve the energy efficiency of their ships and comply with IMO regulations [1,3,7,8,9].
Various types of container cargo are loaded onto container ships, among which refrigerated containers require a continuous power supply to maintain a cargo temperature suitable for preservation [10]. The independent operation of refrigerant cycles in refrigerated containers causes intermittent and sudden electrical load fluctuations in a ship’s power system [11,12]. In contrast to land-based power systems, a ship’s power system typically comprises multiple engine generators as power sources [13,14,15]. Therefore, intermittent electrical load fluctuations tend to compromise the stability of the ship’s power system and decrease power generation efficiency. This, in turn, reduces the ship’s energy efficiency [16].
This study is based on the idea that sudden power-load fluctuations and prediction uncertainties can be controlled if independently operated refrigerated containers can be managed in an integrated manner. Through this approach, this study aims to efficiently manage the engine generator load and reduce fuel consumption, thereby improving the energy efficiency of the ship.
The existing studies and literature were reviewed to verify the feasibility and limitations of the initial idea. Considerable research has been conducted on methods for maintaining the temperature of refrigerated containers and increasing their efficiency. Kan and Filina-Dawidowicz conducted studies on the rate of temperature increase based on cargo placement [17,18]. Zili explored heat management improvements by using a mist injection cooling system [19]. Sørensen researched energy savings using an MPC method [20]. Nel conducted studies to enhance efficiency by improving air circulation inside refrigerated containers [21]. Budiyanto investigated the correlation between the energy consumption and surface temperature of refrigerated containers [22]. In addition, Budiyanto conducted a study on achieving energy savings by installing a roof shade over refrigerated containers [23]. However, these studies focused on the performance improvement and efficiency enhancement of refrigerated containers. Still, they were limited in addressing the overall cargo management and control methods, such as those applicable to ships.
An additional literature review revealed that previous studies focused on improving energy efficiency through the management and integrated control of refrigerated cargo. Van Duin conducted a study to reduce the energy peaks caused by refrigerated containers [24]. Iris and Lam investigated the effective control of refrigerated containers by integrating smart grid technology with energy management systems [25]. Zhang studied improvements in economic efficiency through rational cargo management in maritime cold chains [26]. Mao investigated berth allocation and management for the effective loading of refrigerated containers [27]. However, these studies have limitations in identifying improvements through the integrated management of the energy efficiency of refrigerated containers during long voyages.
Furthermore, numerous studies have been aimed at enhancing the efficiency of refrigerated containers using cold energy [28,29] and refrigerated containers and logistics chains [30,31,32,33,34]. However, these studies did not provide insight into the management of refrigerated containers from the perspective of an integrated ship control system. To efficiently operate refrigerated containers on ships, it is vital to ensure that individual refrigerated cargo does not exceed the allowable temperature ranges, does not surpass the operational limits of the generators, and allows the engine generators to operate efficiently. However, meeting these requirements is a challenge.
Therefore, based on the lack of existing knowledge regarding implementing an integrated ship control system to operate refrigerated containers, a method is proposed to minimize electrical load fluctuations and operate engine generators in a high-efficiency range by managing refrigerated ship containers using an integrated control system.

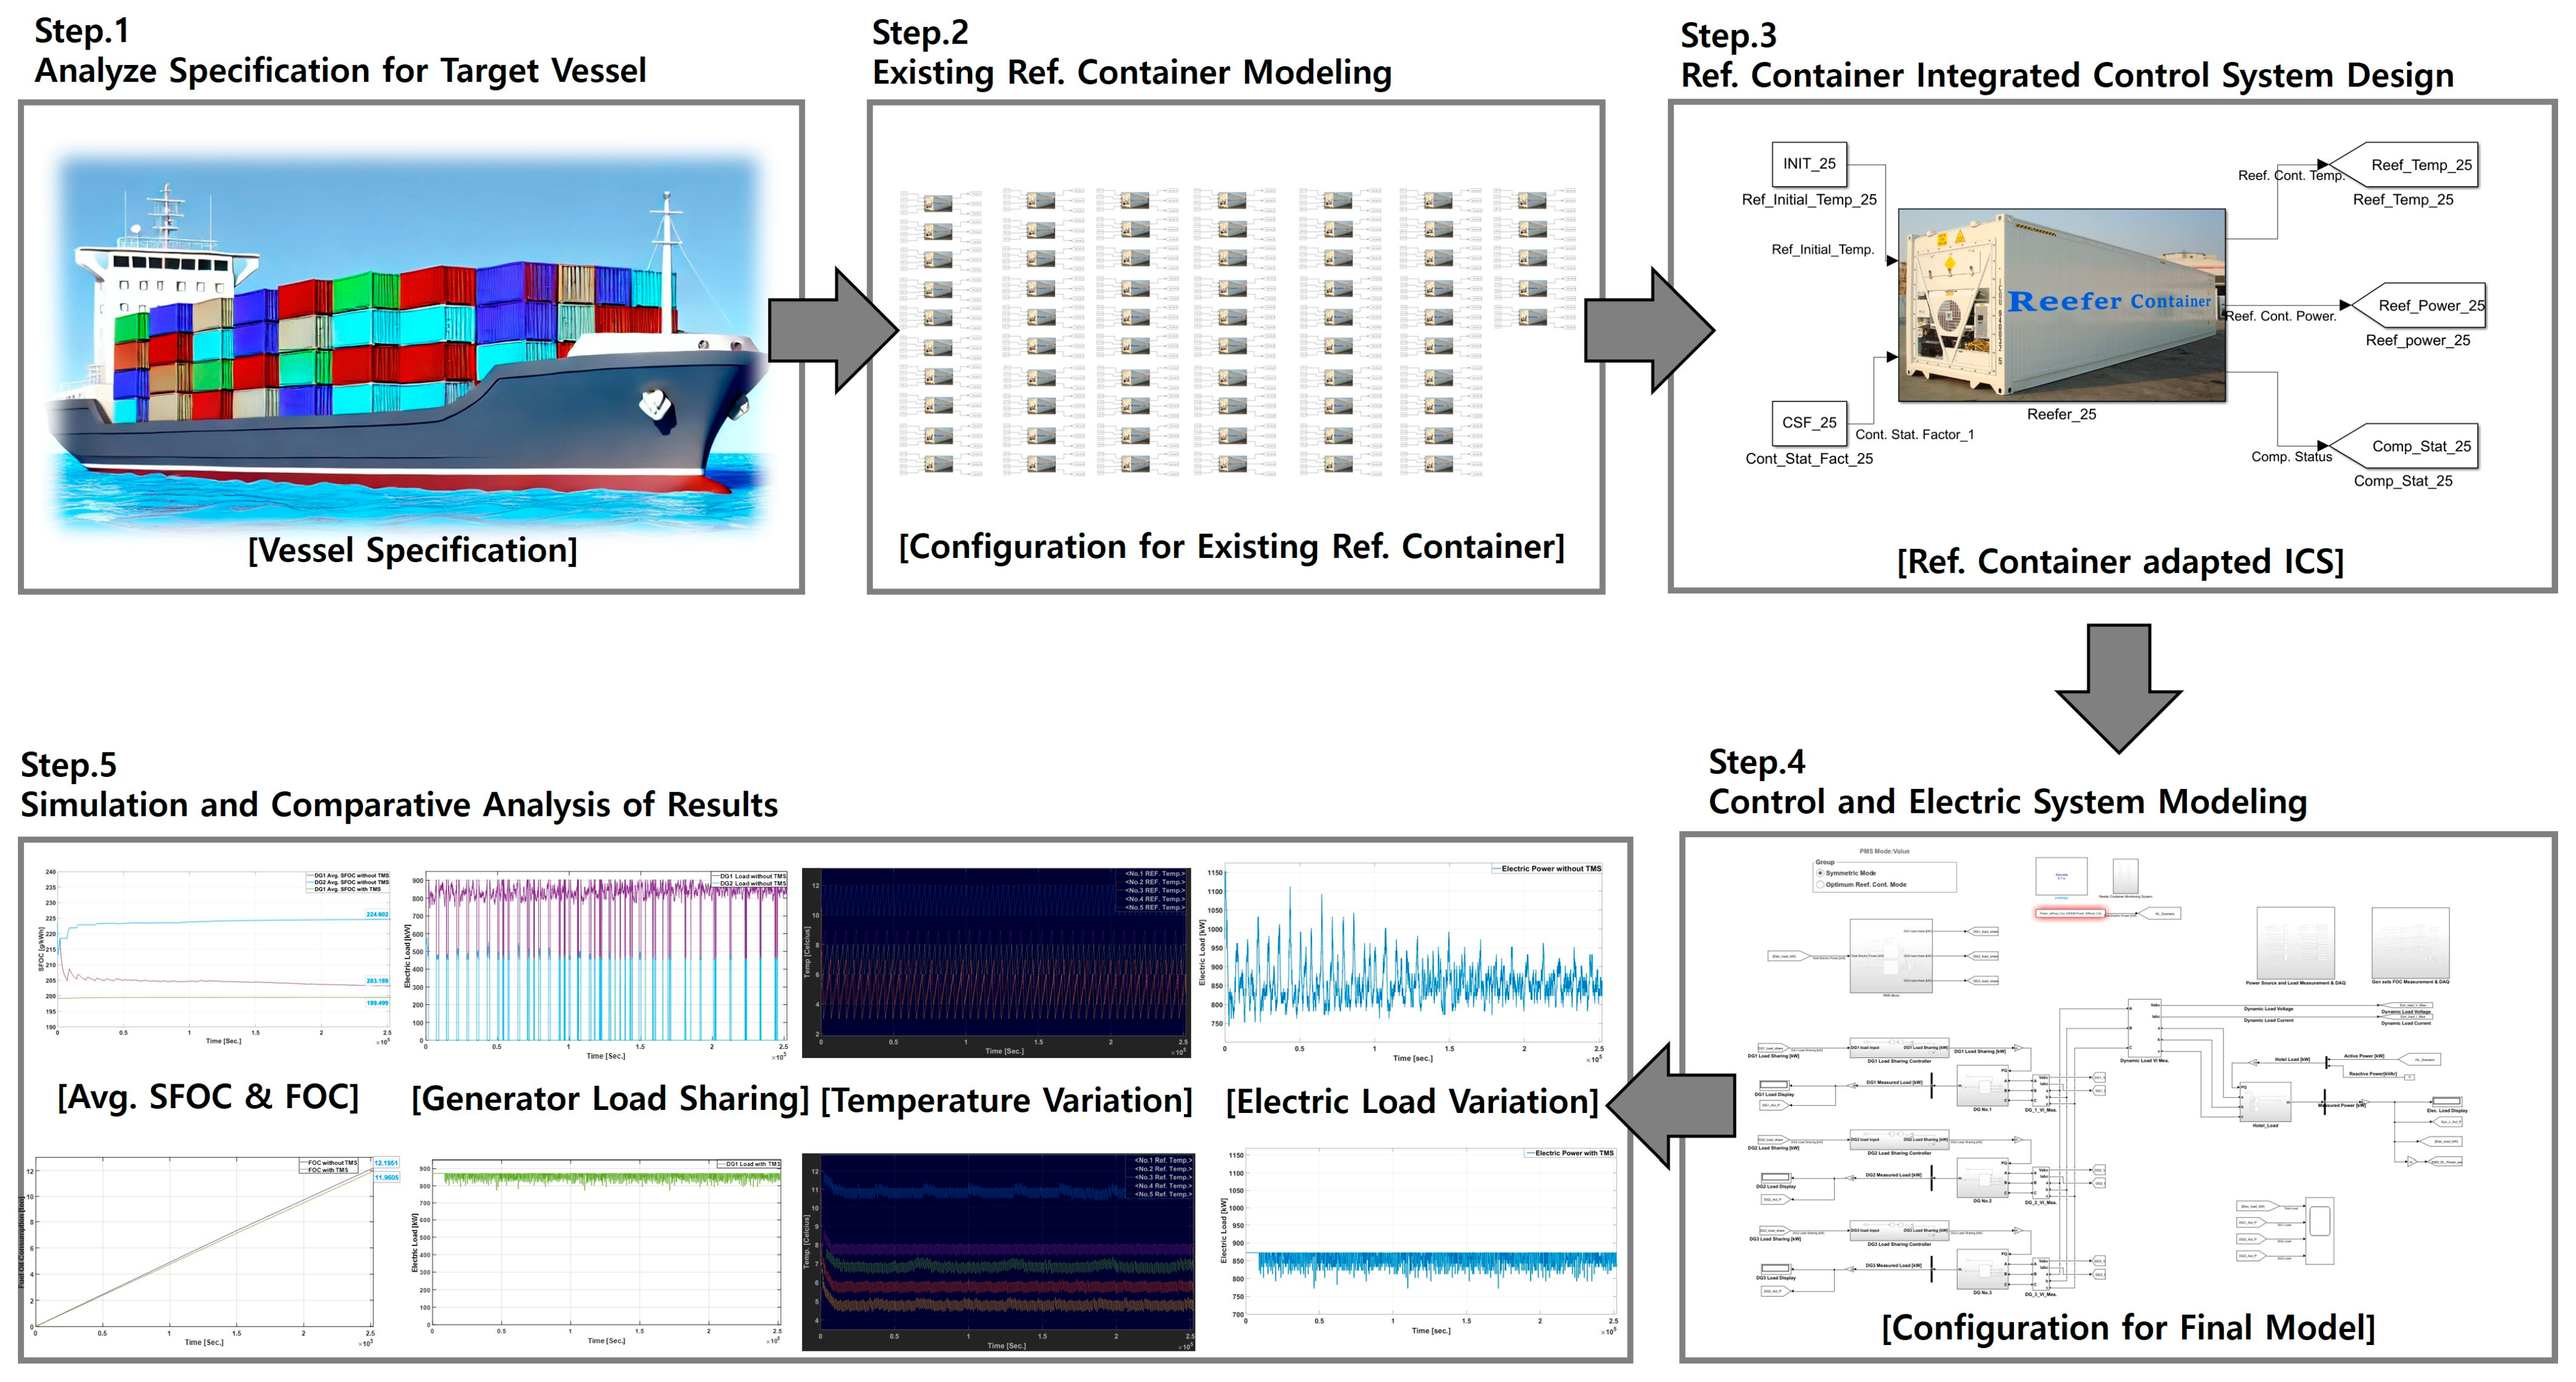
2. Materials and Methods

As shown in Figure 1, the proposed integrated control system for refrigerated containers was designed and verified using several steps. First, the specifications of refrigerated containers and the power system installed on actual container ships were analyzed. Furthermore, an overall framework for comparing and verifying the integrated control system for refrigerated containers was designed. Second, modeling and simulations were conducted to confirm the electrical load fluctuations caused by the irregular operation of existing refrigerated containers. Third, the effectiveness of overcoming existing problems was verified by designing and simulating the proposed integrated control system for refrigerated containers. Fourth, improvements in energy efficiency and power stability were confirmed using a simulation linked to the power system of an actual ship. Finally, the utility of the proposed integrated control system was confirmed by a comparative analysis of the simulation results of the conventional operation method for refrigerated containers and the proposed integrated control system.

2.1. Analysis of Specifications and Framework Design of the Target Container Ship

The specifications of actual ships were analyzed, and an overall framework was designed to model the integrated control system for refrigerated containers and the power system. Table 1 presents an electric load analysis, which includes the power-load analysis data based on the specifications and operating modes of the ship.
Based on the data presented in Table 1, the ship’s power system is configured with three generators, dynamic power loads that vary according to the operating scenarios, and simplified refrigerated containers. The overall framework was designed by adding an integrated control system for refrigerated containers that interfaces with data from existing ship power control systems and refrigerated containers.

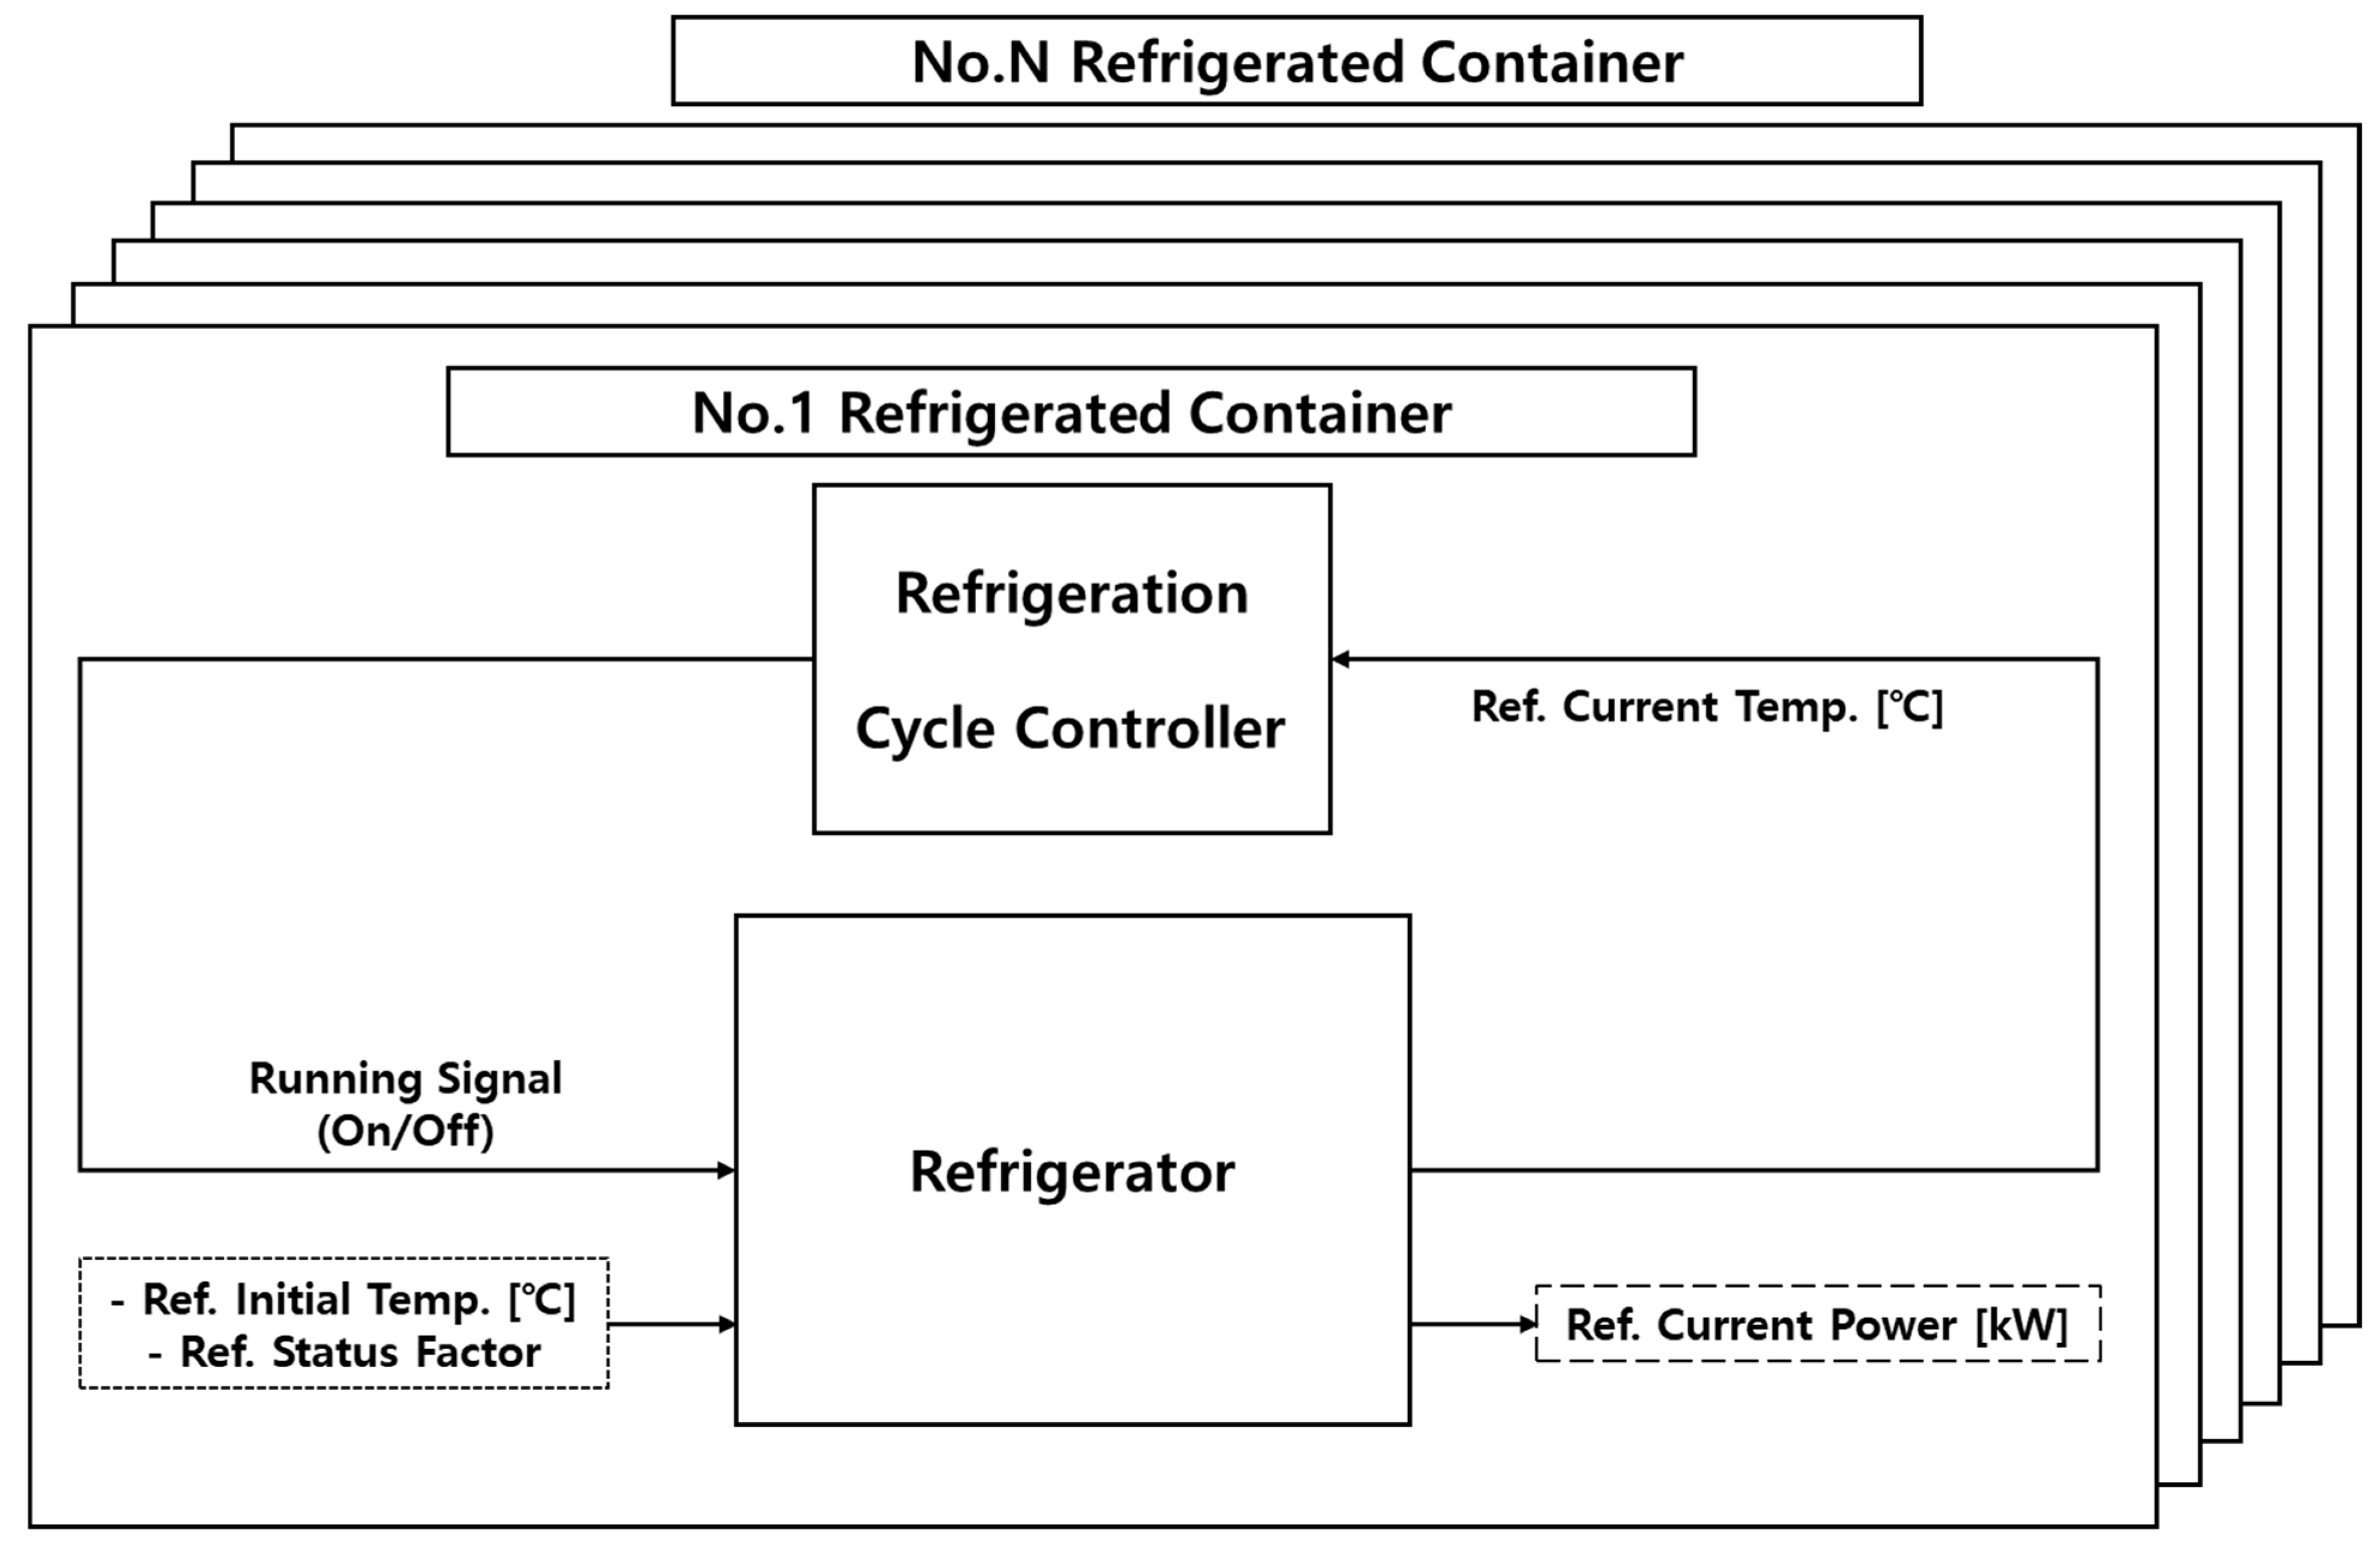
2.2. Operating Method of Conventional Refrigerated Container Model

To maintain the cargo temperature, the refrigerated containers have a set start and stop temperature for the refrigerant cycle. During the refrigerant cycle, the compressor compresses the refrigerant, leading to increased power consumption by the refrigerated container [35]. According to the analysis of existing literature and technical data on refrigerated containers, the power consumption of a typical 20 FT refrigerated container is 2.5 kW when the refrigerant compressor is not running and 12.5 kW when it is running [11,24]. The duration for which the internal temperature of the refrigerated container is maintained depends on various factors, such as the insulation condition of the container, solar radiation, and the arrangement of the refrigerated cargo [30,36,37]. The model was simplified to model the load variability of refrigerated containers based on the measured temperature maintenance and refrigerant cycle operation times of the target ship. It was found that an average of approximately 50 min was required for the refrigerant cycle to move from the stop temperature to the start temperature, and the average operating time of the refrigerant cycle was approximately 10 min. Additionally, various factors that contribute to the temperature increase of refrigerated containers, such as external air temperature, exposure to sunlight, wind, and the thermal conductivity of container materials, as well as factors that directly affect temperature reduction, including compressor performance, the type and amount of refrigerant, and heat exchanger status, were considered as a constant referred to as the status factor (SF). This allows the refrigerated containers to exhibit different characteristics, closely resembling real-world conditions, and thereby cause variations in power consumption. Based on the above information, Equations (1) and (2) were derived to determine the temperature of the refrigerated container over time.
R e f . T e m p   @   n o   c y c l e = L a s t   T e m p + t × 2 S F 60 × 50 ,
R e f . T e m p   @   c y c l e = L a s t   T e m p + t × 2 S F 60 × 10 ,
In the refrigerated container model, the temperature increases linearly over time, according to Equation (1), when the refrigerant cycle does not operate. When the start temperature of the refrigerant cycle is reached, the temperature subsequently decreases linearly, according to Equation (2), until the stop temperature of the refrigerant cycle is reached. In addition, the model is set to consume 12.5 kW of power when the refrigerant cycle is operating and 2.5 kW of power when not in operation. This modeling approach was applied to a maximum loadable number of 65 refrigerated containers on an actual ship, as shown in Figure 2.

2.3. Validation for Modeled Refrigerated Containers

To verify the proper functioning of the MATLAB/Simulink model based on Equations (1) and (2), a simulation was performed by applying the variables to the model using the reference data from the literature [24], as shown in Table 2.
The simulation results, compared with the reference graphs from the literature, are presented in Figure 3.
In the reference graph, the temperature fluctuates between 10.2 °C and 10.5 °C, while in the test model, it varies according to the CST and CTT values. Additionally, both graphs show that the power increases to 12.5 kW when the temperature decreases, and 2.5 kW is consumed during the temperature rises. However, there is a difference in the time scale of temperature fluctuation between the two graphs. This can be interpreted as a result of the test model being based on the actual ship data, whereas the reference literature data were measured at the terminal.
In conclusion, the generated model effectively demonstrates the potential for power irregularities in the ship’s power system depending on the operational time of the refrigerated containers.

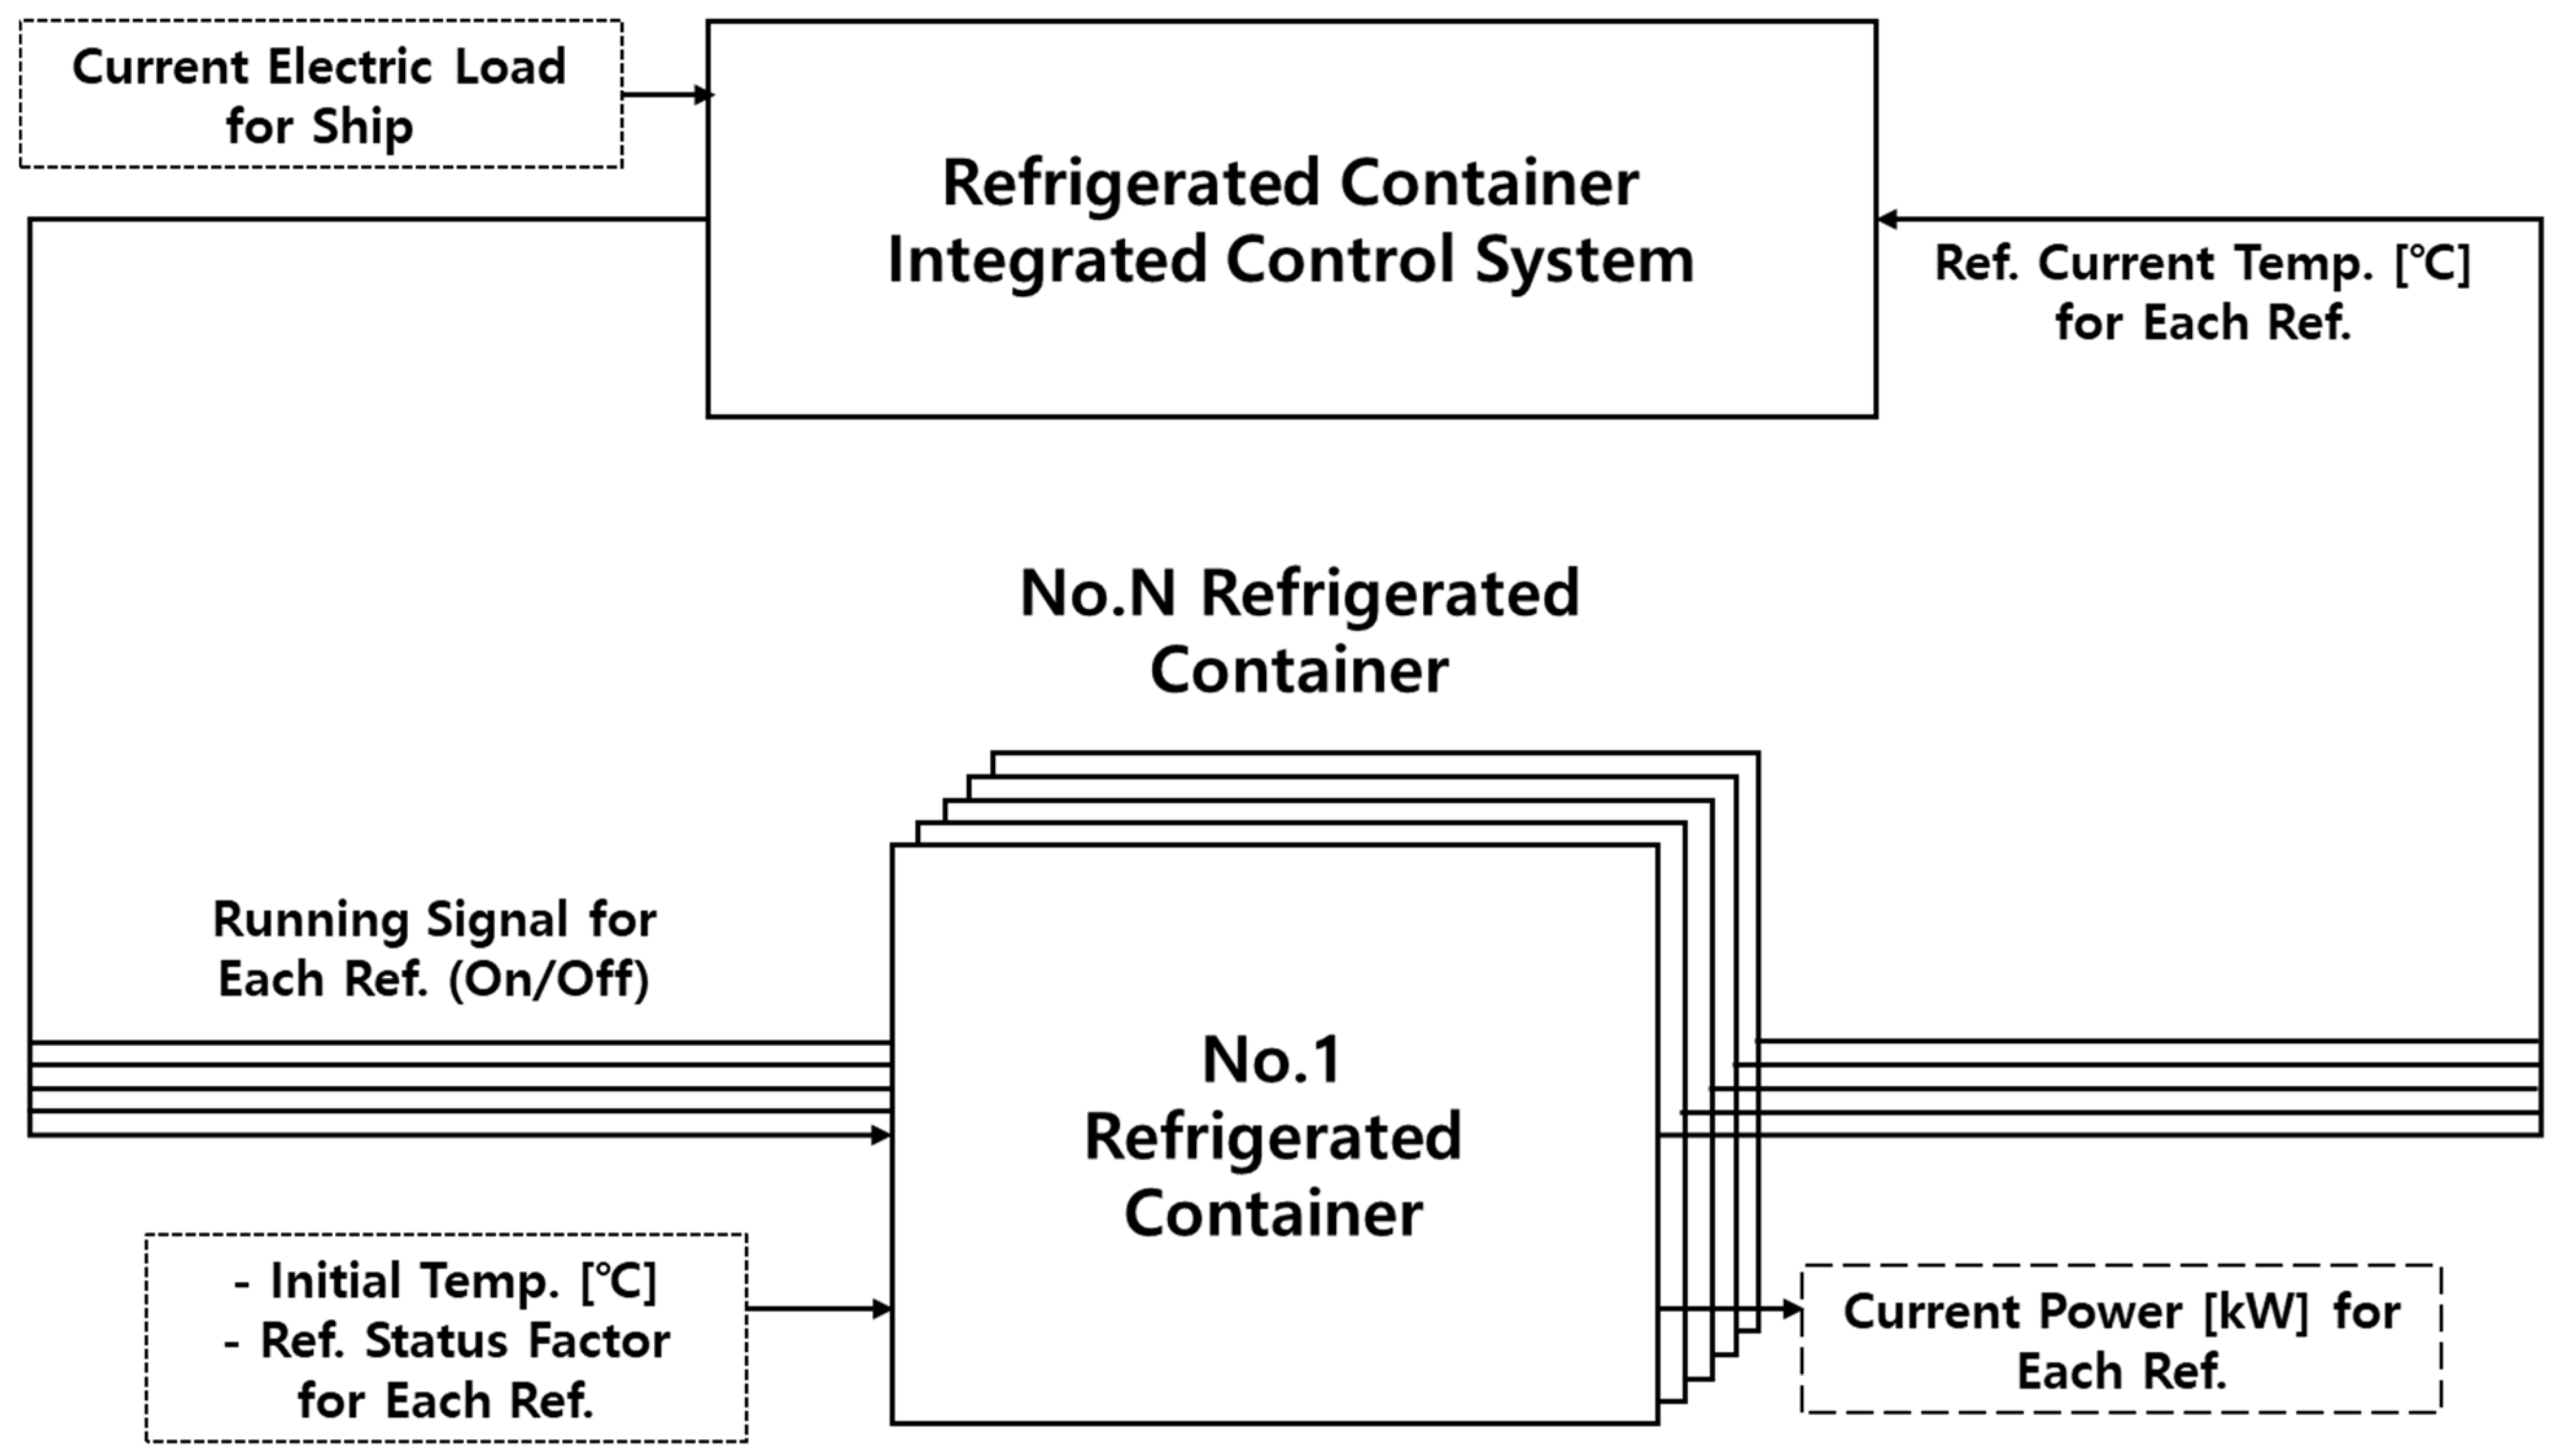
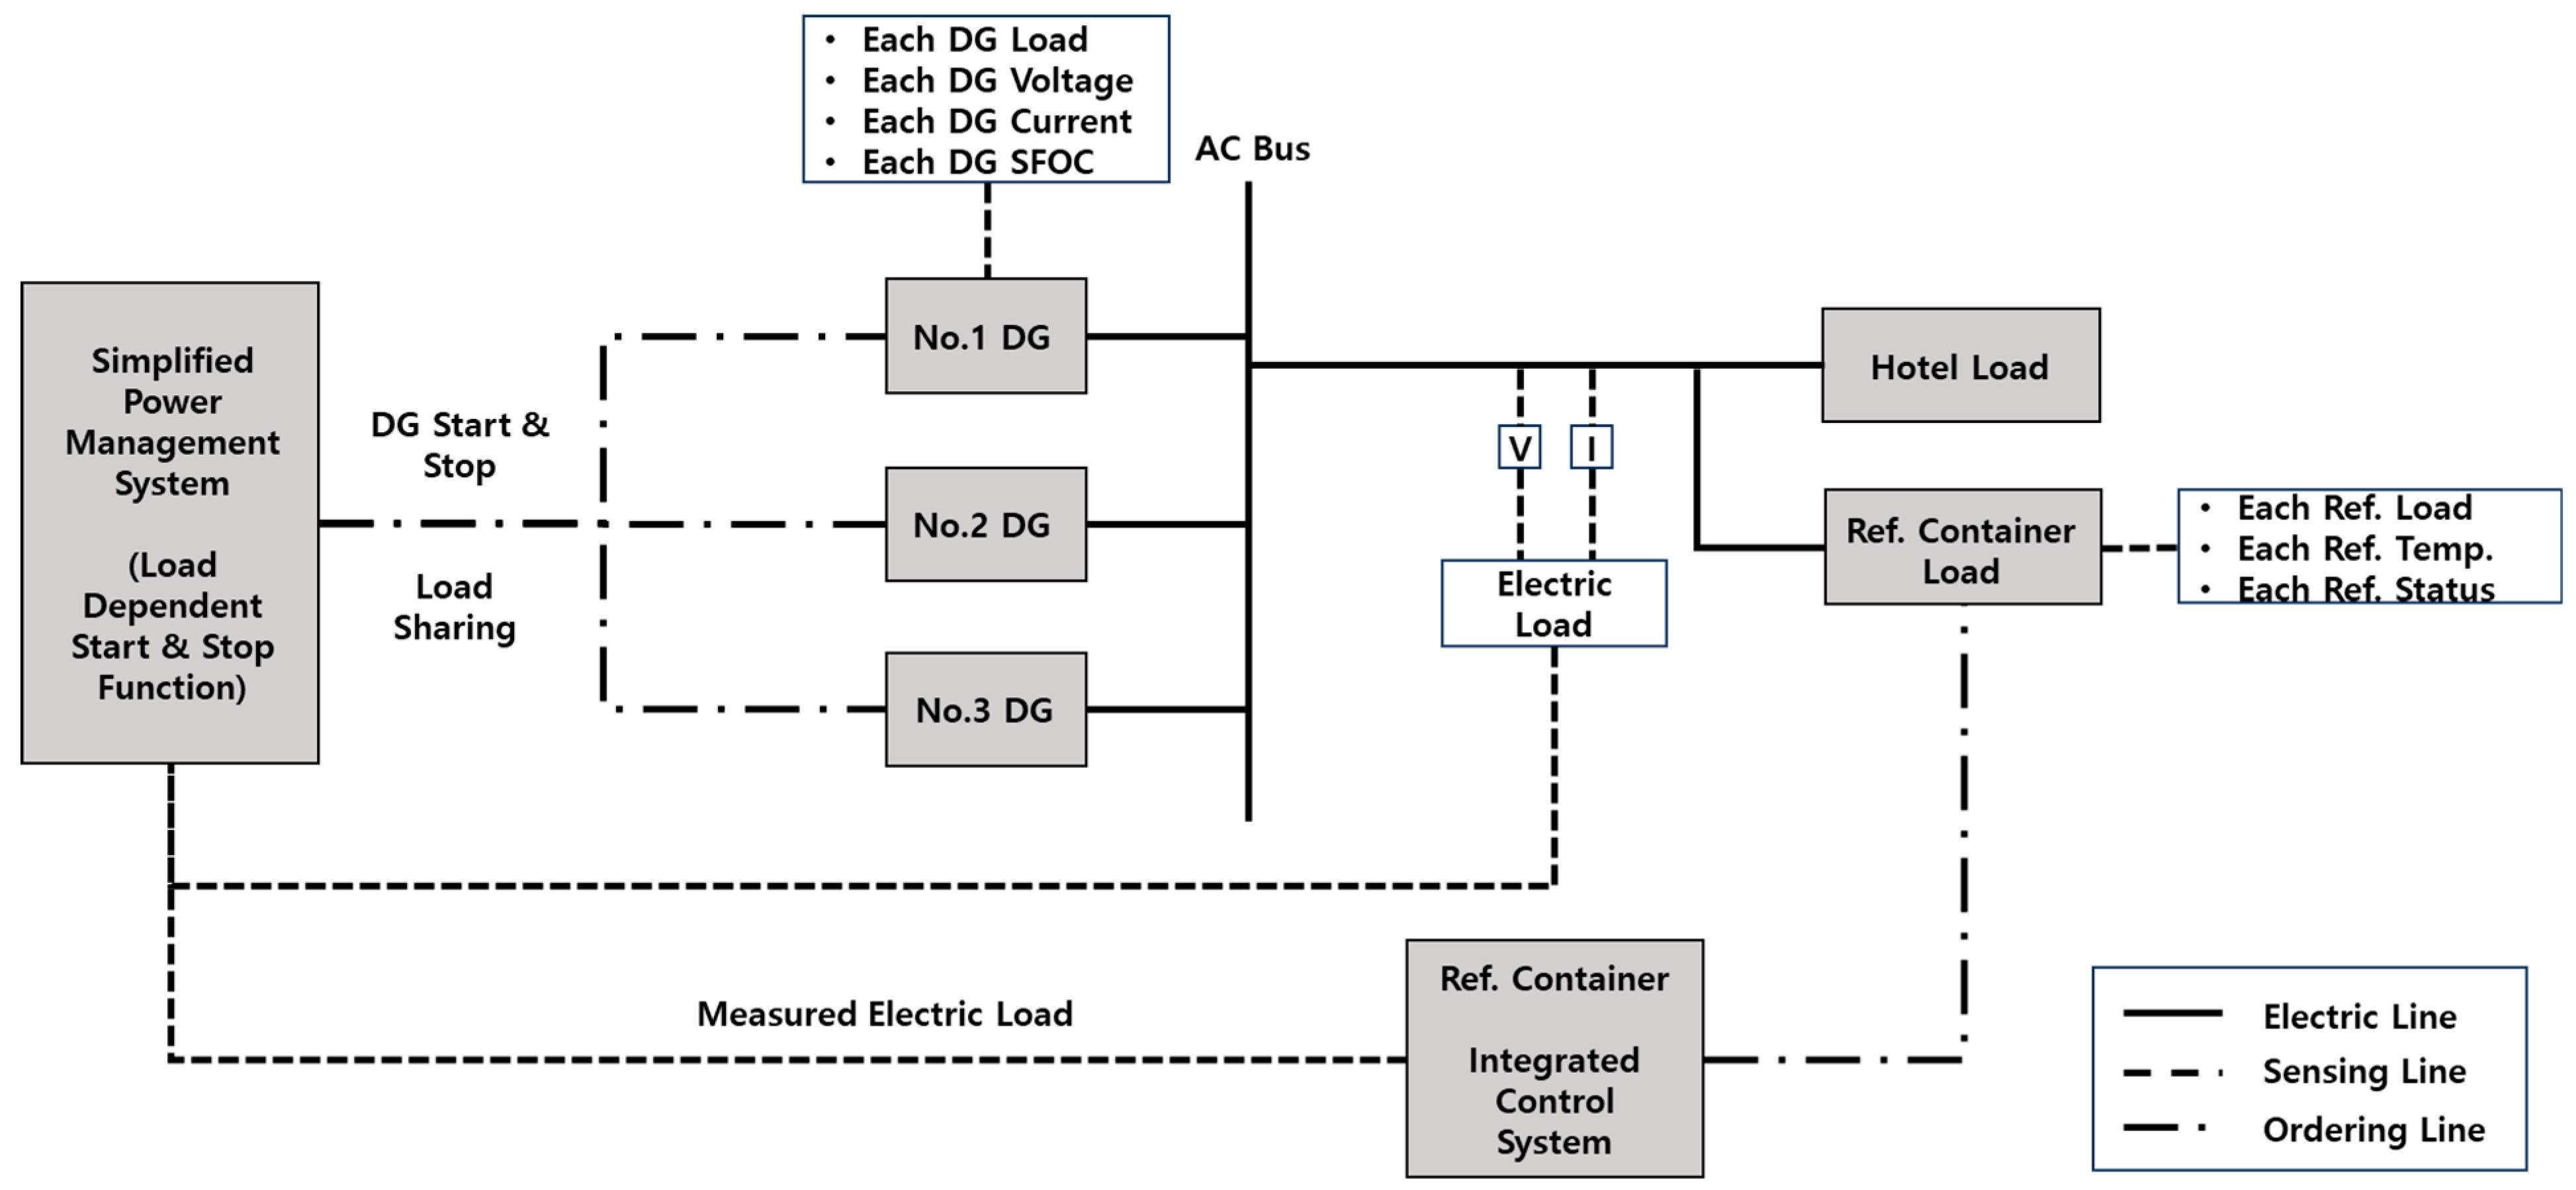
2.4. Proposed Integrated Control System for Refrigerated Containers

The proposed integrated control system centrally controls the operations of refrigerated containers. For this purpose, the integrated control system inputs the start and stop temperatures of the refrigerant cycle for each refrigerated container and monitors the temperature of the containers and the power load of the power generation system in real time. The integrated control system operates under two conditions. First, it ensures that the total power load does not exceed the safety load, preventing the engine generator from operating in a low-efficiency range. Second, it maintains the internal temperature of each refrigerated container within the start and stop temperatures of the refrigerant cycle to preserve the freshness of the cargo. To prevent all refrigerated containers from operating simultaneously and allow for sequential operations based on priority, the system performs calculations based on Equation (3). Priority is determined by evaluating how close the real-time temperature of each container is to the refrigerant cycle operation start point.
% T = T e m p   @   c u r r e n t C T T C S T C T T × 100 ,
T e m p   @   c u r r e n t = c u r r e n t   R e f .   T e m p e r a t u r e ,
C S T = R e f .   c y c l e   s t a r t   T e m p e r a t u r e ,
C T T = R e f .   c y c l e   s t o p   T e m p e r a t u r e
Figure 4 shows the DG SFOC curve for the target vessel, and it can be observed that efficiency is high at loads above 75%.
Furthermore, to ensure the efficient operation of the engine generator as well as the safety of the power system, the integrated control system issues refrigerant cycle operation commands to individual refrigerated containers based on the priority of the %T value within the power-load margin defined by Equation (4).
D G   m a r g i n = 1064 D G   r a t e d   p o w e r × 0.82 S a f e t y   F a c t o r = 872.48
The system is designed such that the operation ceases when container in which the refrigerant cycle operates reaches the average %T. Figure 5 shows the configuration diagram of the 65 refrigerated containers operated by the integrated control system.
The ICS receives the temperature and power load of individual refrigerated containers and issues operation and stop commands to each refrigerated container based on the proposed algorithm.

2.5. Ship Power System and Power Management System

To ensure the stability of the system in response to power-load fluctuations, a power management system that controls the operation and shutdown of individual engine generators and manages load sharing was modeled for the power system of the target container ship, as shown in Figure 6. The power management system simulates the load start and stop functions, which are crucial for preventing blackouts, by controlling the number of operating engine generators according to the specified power load. It also simulates the load-sharing function to ensure an even load distribution during parallel operation.
The power system comprises engine generators, a main bus, and a power-load fluctuation module. Engine generators can start, stop, and share loads according to the commands from the power management system. The load fluctuation module was modeled to include the base load of the ship and the power load generated by the refrigerated containers, allowing for time-based load fluctuations. In addition, the specific fuel oil consumption (SFOC) of the engine generators was calculated based on their loads and fuel consumption over the operation period. The system also allowed the monitoring of the voltage, current, and power levels of each bus during the simulation period.

3. Results

3.1. Comparison of Power-Load Variability According to the Operating Methods of Refrigerated Containers

A simulation was conducted to compare the load variability between the conventional operating method for refrigerated containers and the proposed operating method. For the maximum loadable 65 refrigerated containers on the target ship, the initial temperature, refrigerant cycle start temperature, refrigerant cycle stop temperature, and status factor were set as listed in Table 3. The same data were applied to both comparison models. The simulation results, which included an additional 580 kW power load during navigation from the ship’s electric load analysis (ELA), are shown in Figure 6.
With the conventional operating method of refrigerated containers, the independent operation of individual containers results in a load variability ranging from 750 kW to 1150 kW as shown by the blue curve in Figure 7. This range corresponds to approximately 37.6% of the rated load of the engine generator. In addition, owing to the power management system (PMS), the second generator operated more than 50 times during the simulation period when the power load exceeded 904.4 kW, which is more than 85% of the rated capacity.
With the proposed operating method for refrigerated containers, the load variability was controlled by the integrated control system (ICS) and ranged from 770 kW to 872 kW. This range corresponds to 9.6% of the rated load of the engine generator. In addition, during the simulation period, the total power load did not exceed the DG margin set within the ICS.

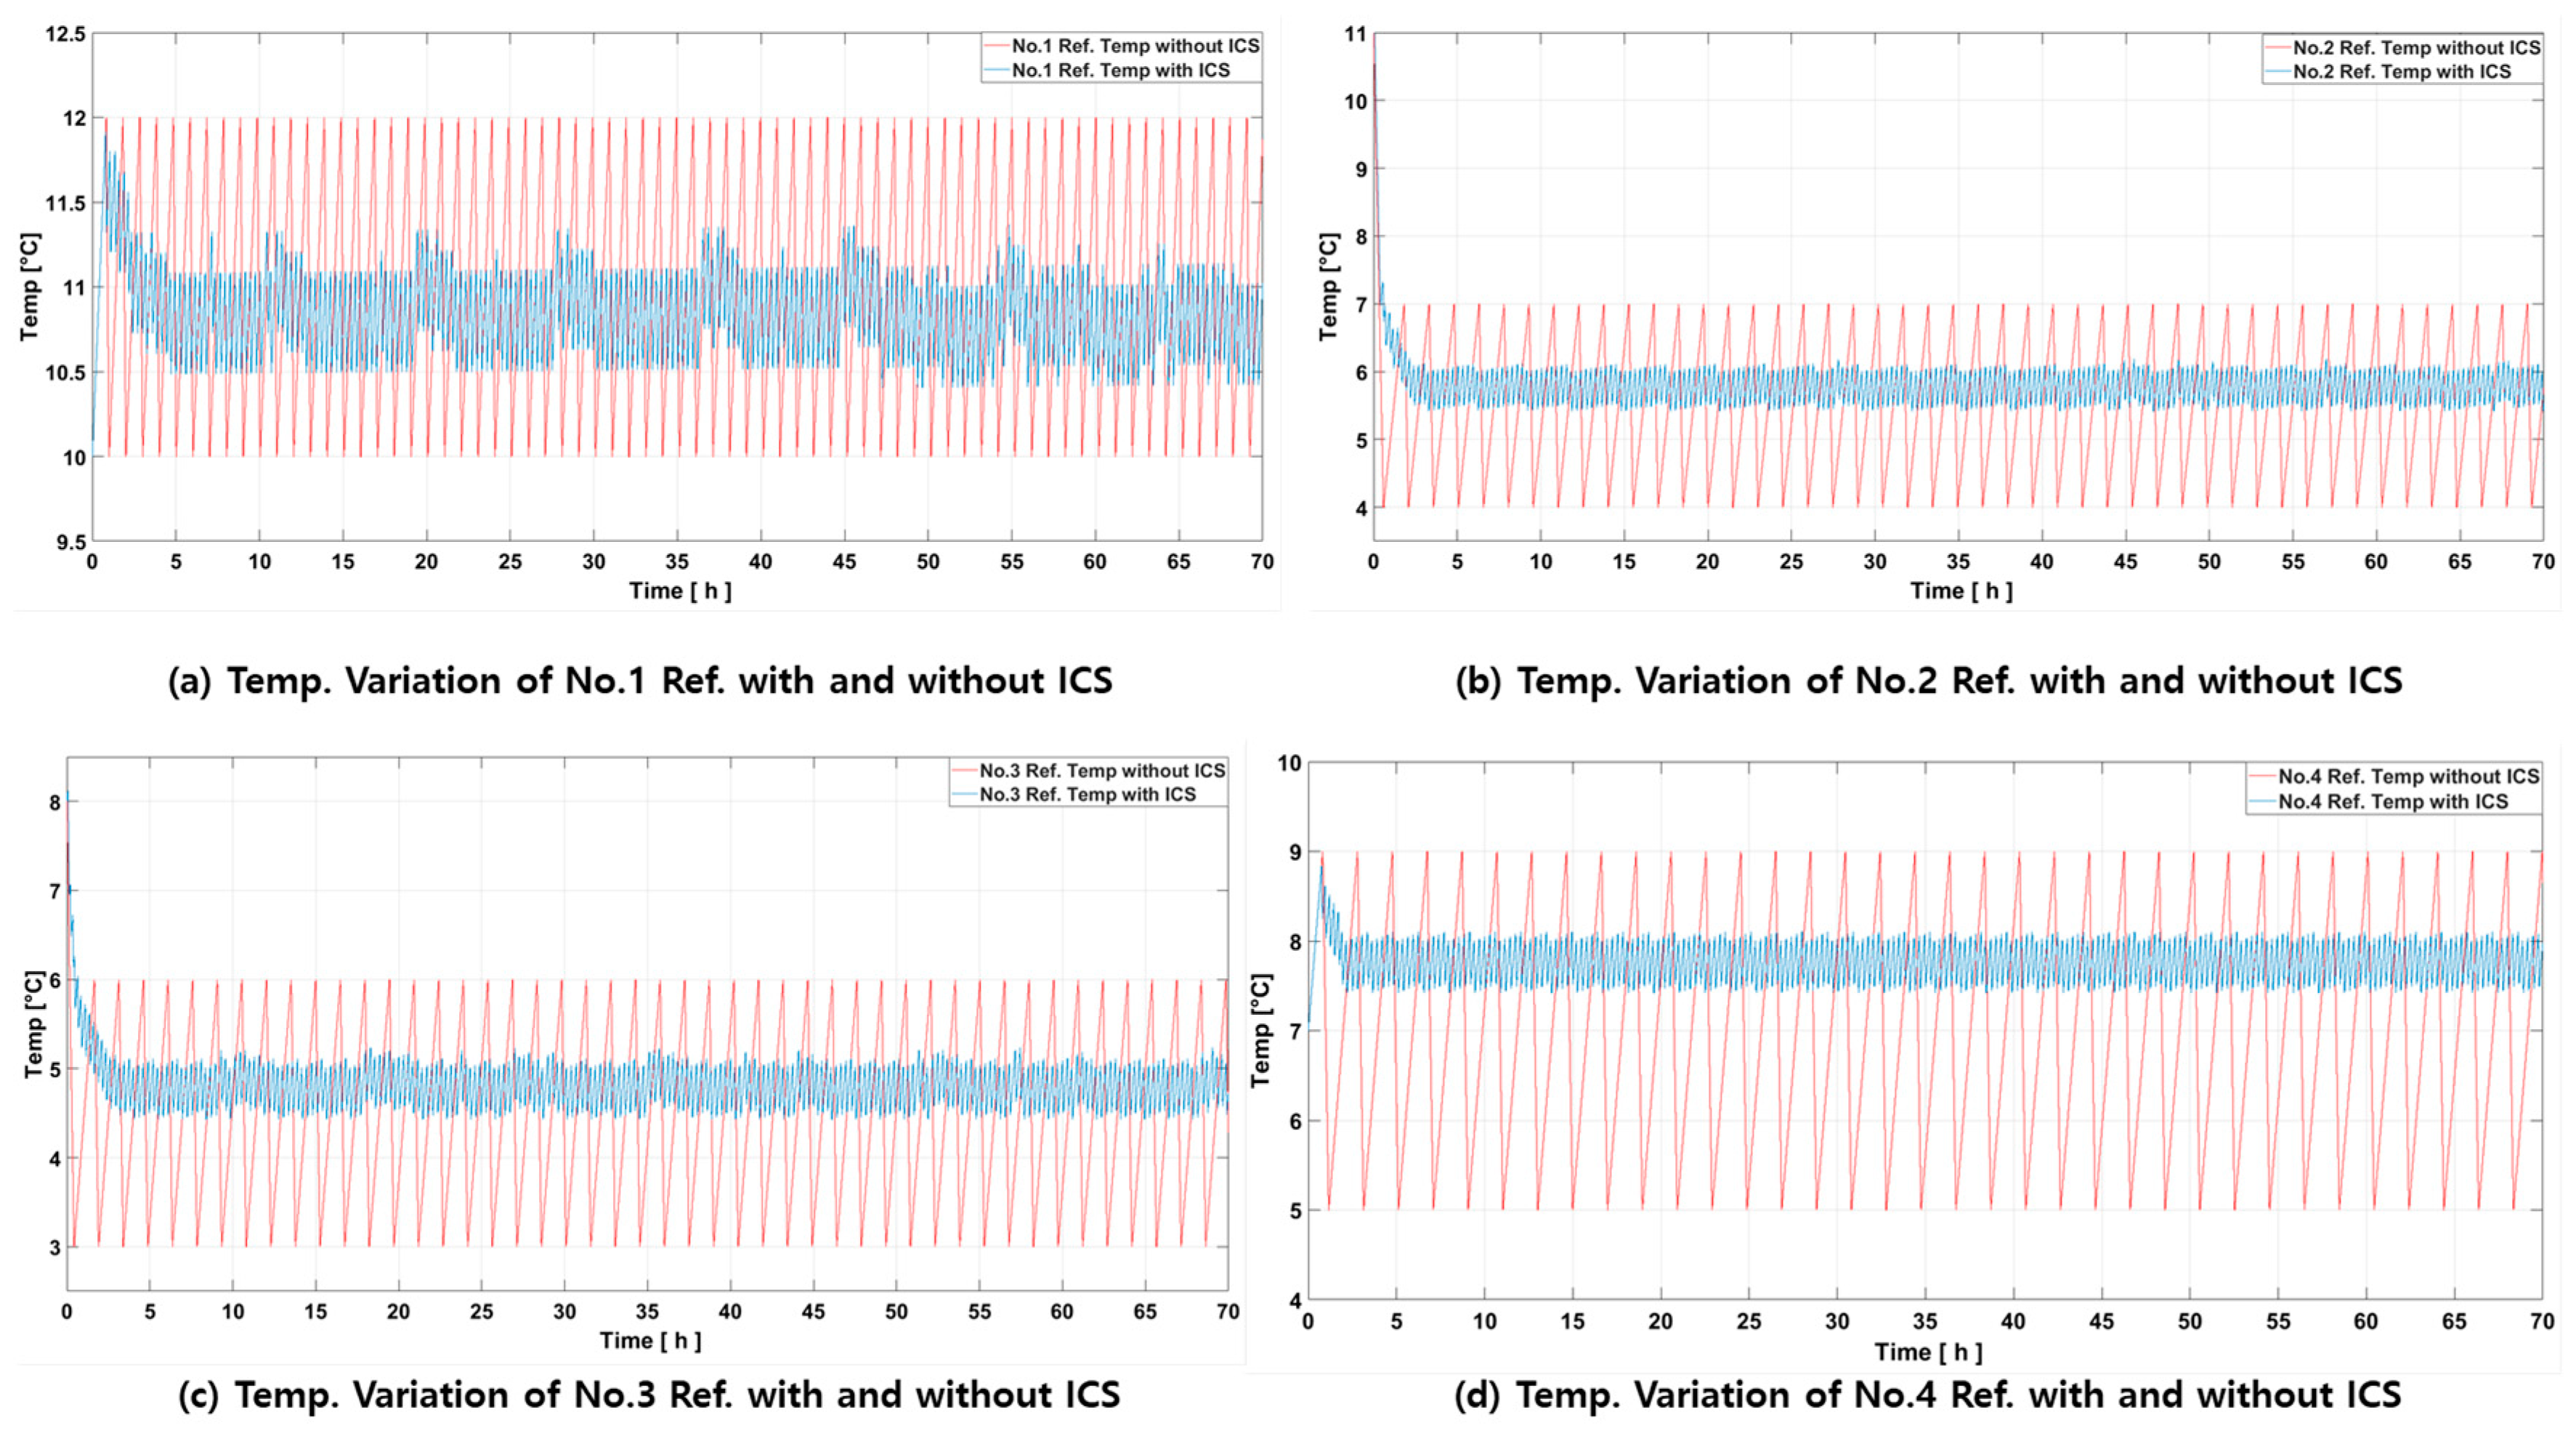
3.2. Comparison of Internal Container Temperatures According to the Operating Methods of Refrigerated Containers

The internal cargo temperatures reported in Ref. Containers No. 1 to No. 4 were compared based on different operating methods.
With the conventional independent operation method for refrigerated containers, the refrigerant cycle operated based on the temperature set in the container controller, as shown by the red curve in Figure 8. This results in internal temperature changes. The temperature was varied, reaching a maximum value of CST and the minimum value of CTT, as shown in Table 3.
The internal temperatures in Ref. Containers No. 1 to No. 4 when operated by the ICS are shown by the blue curve in Figure 8. The graph indicates that the containers were operated considering the overall electrical load of the ship and the temperature deviation range of the container cargo according to the designed ICS control logic. The internal temperatures of the individual containers did not exceed the CST-to-CTT temperature range specified in Table 3.

3.3. Comparison of Individual Container Power-Load Fluctuations According to the Operating Methods of Refrigerated Containers

Figure 9 shows that the electrical load fluctuations in Ref. Containers No. 1 to No. 4 were based on different operating methods. The graphs indicate that the refrigerant cycle operation is more frequent when the containers are operated by the ICS.

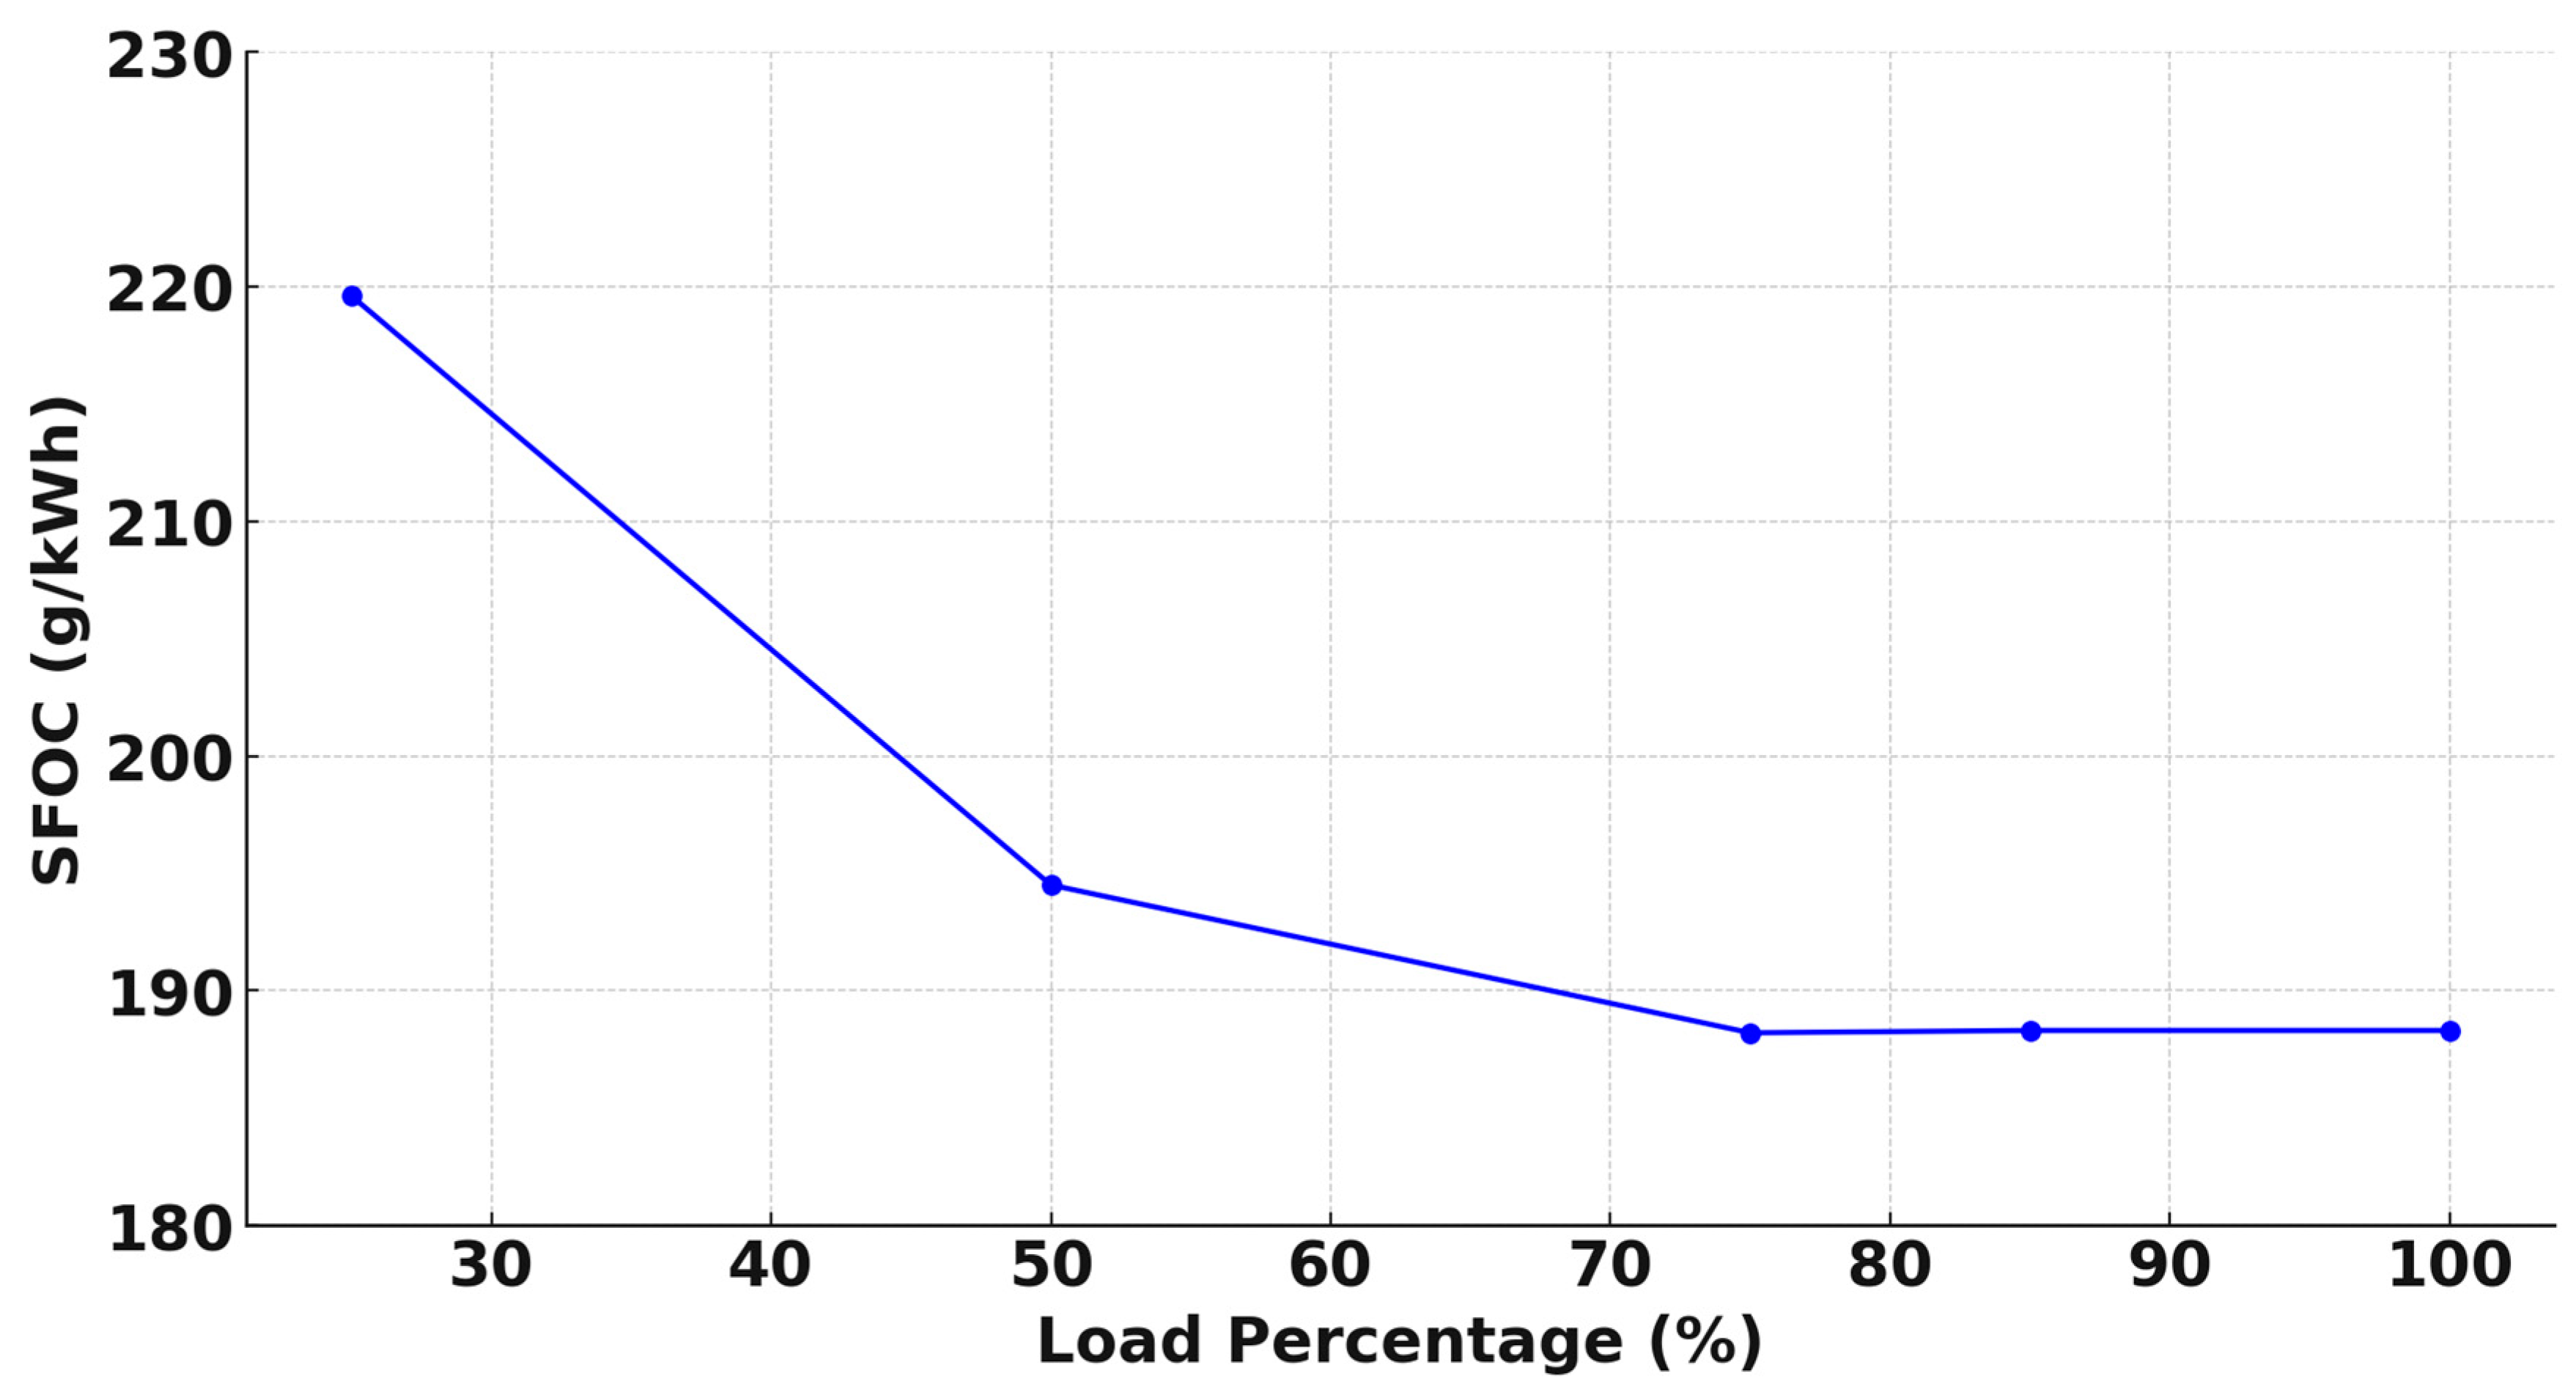
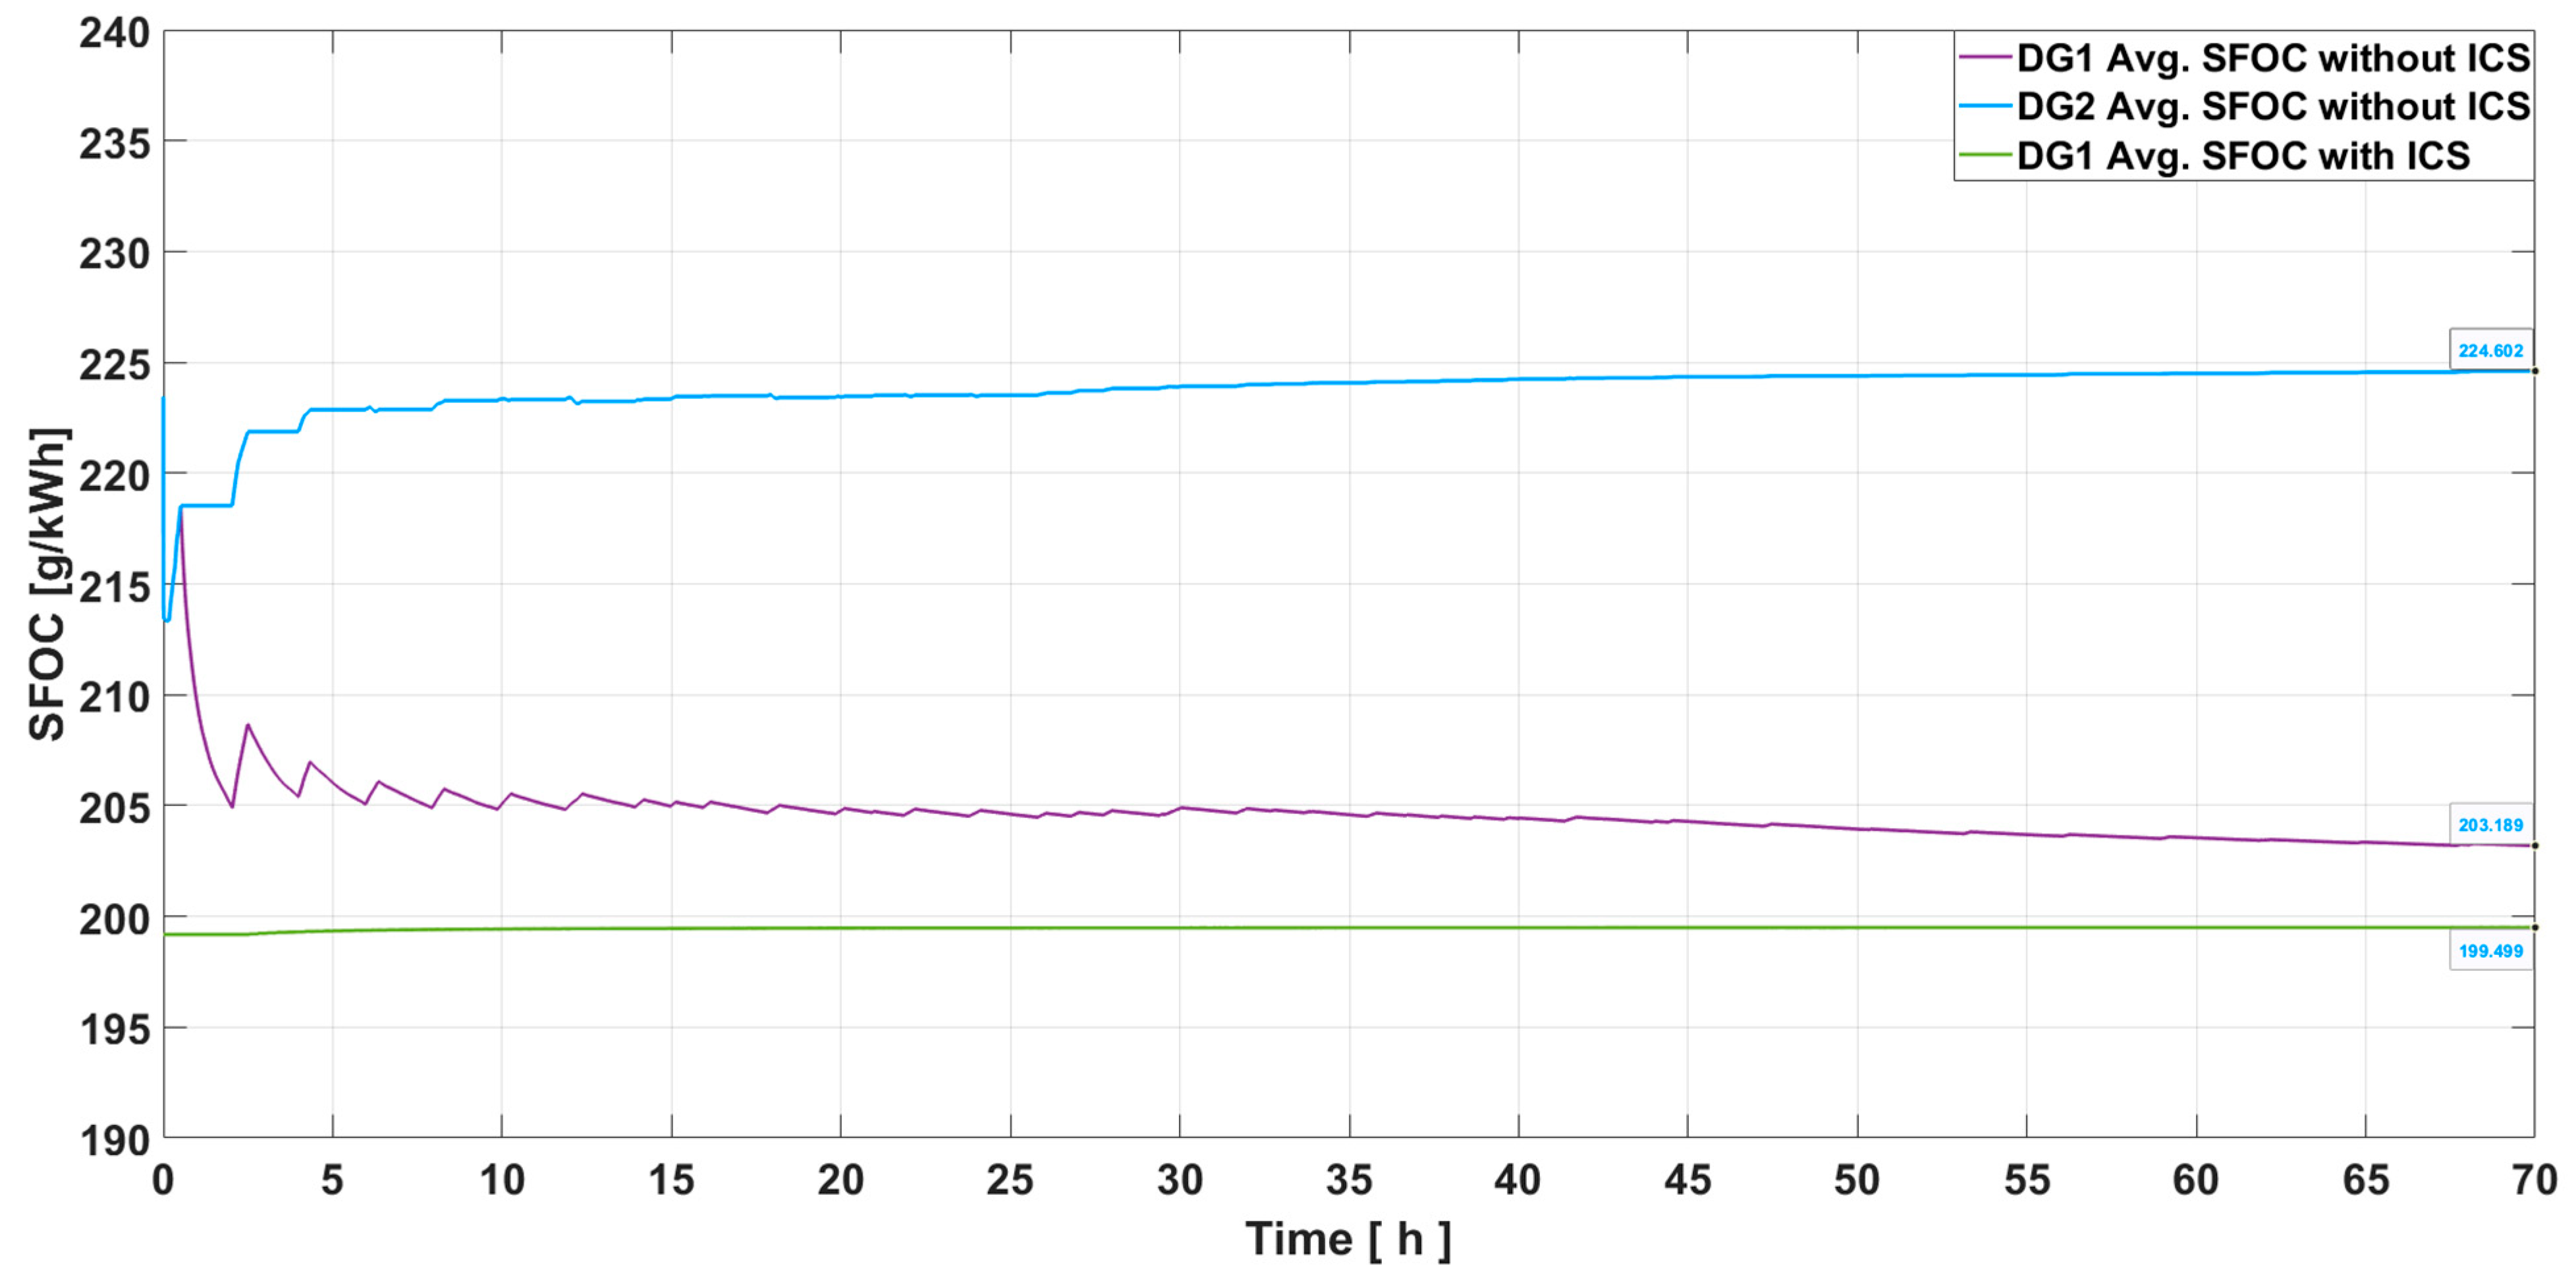
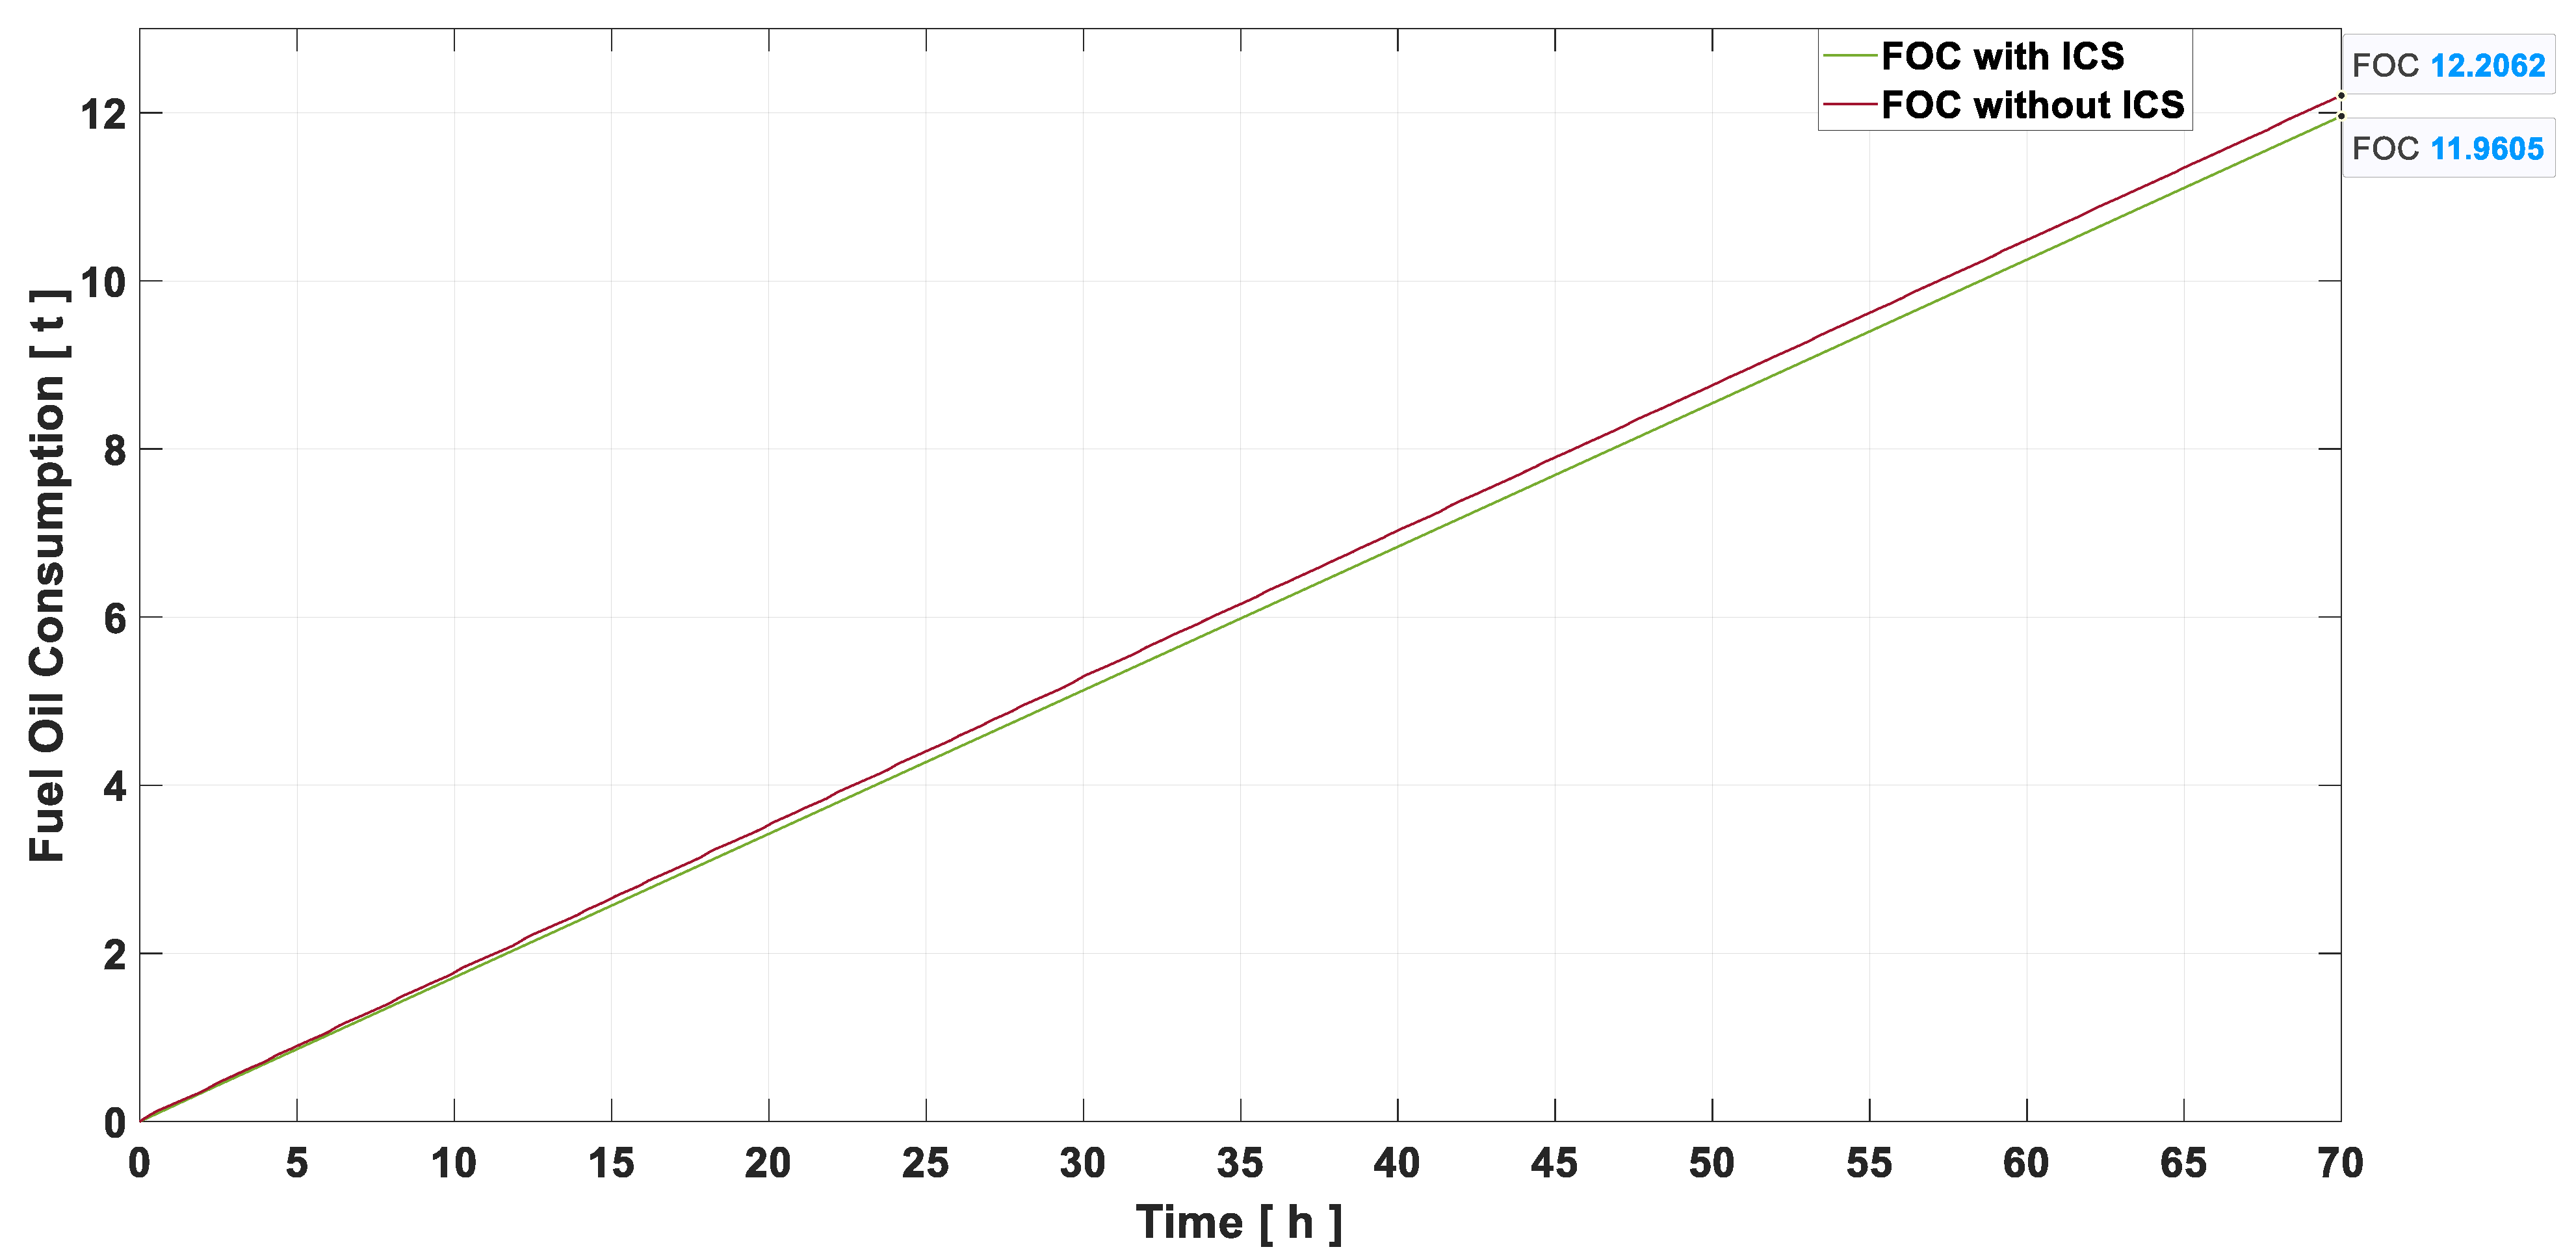
3.4. Comparison of Diesel Generator Load and Fuel Consumption According to the Operating Methods of Refrigerated Containers

Figure 10 shows the electrical load fluctuations of DG No. 1 and No. 2 operated by the ship’s electrical load according to the conventional operating method of refrigerated containers, as well as the load fluctuations of DG No. 1 with the application of the ICS. When the ICS is not applied, it is observed that the electrical load exceeds 85% of the safe load of a single generator, prompting the standby generator to operate in parallel. Consequently, each DG unit shares 50% of the total electrical load, which leads to operation under conditions where the SFOC is less efficient.
The electric load fluctuations of DG No. 1 when the electric load of the ship was stably controlled by the ICS are shown by the green curve in Figure 10. The standby DG did not operate because the total electrical load did not exceed the load-dependent start setting of the PMS. In addition, it can be observed that during the simulation period, the engine generator operates within the range 75–80% of the rated capacity, which is a high-efficiency range for the engine generator.
Figure 11 shows the average SFOC of the DG with and without the application of the ICS. It can be observed that the average SFOC of No. 1 DG with the ICS applied is 4.3 g/kWh lower than that of No. 1 DG without the ICS applied.
This result is due to the DGs operating in a low-efficiency range when the ICS is not applied.
The fuel consumption of the generators over the simulation period is shown in Figure 12. It was found that applying the ICS can reduce fuel consumption by 0.24 tons over the entire 70 h simulation period.
This result is also attributed to the fact that, when the ICS is applied, the power system operates the DGs within a high-efficiency range.

4. Discussion

4.1. Improved Power Stability of Container Ships Achievable by ICS

Because ships operate with independent power systems, sudden electrical load fluctuations can lower power quality and increase the risk of blackouts [38,39,40]. Container ships are particularly prone to sudden electrical load fluctuations owing to the independent operation of refrigerated container cargo. This study demonstrated that the proposed ICS can minimize electric fluctuations and enable the planned operation of power sources by integrating refrigerated cargo containers. By integrating the functions of the ICS into the PMS, it is possible to manage and control all major individual electric loads on the ship from a single system, thereby contributing to further improvements in power stability and planning.

4.2. Improvement of Ship Energy Efficiency by ICS

To address the climate crisis, ships must use fuel as efficiently as possible to minimize greenhouse gas emissions. The ICS can play a role in improving the energy efficiency of ships. By enabling the adjustment of onboard electrical loads, the ICS allows engine generators to operate within high-efficiency ranges, thereby reducing fuel consumption. In addition, optimizing the combustion of engines can reduce exhaust emissions [41]. Furthermore, by operating power sources in a planned manner, the unnecessary parallel operation of DGs can be avoided, leading to reduced operating hours and maintenance costs as well as decreased fatigue for ship engineers.

4.3. Control Performance for Maintaining the Temperature of Refrigerated Cargo

The CST and CTT applied to the operation of existing refrigerated containers represent the upper and lower temperature limits of the internal refrigerated cargo, respectively. The ICS proposed in this study was controlled based on the temperature deviations between the CST and CTT of individual containers. This allows the temperature variations of the refrigerated cargo to be smaller than those in conventional refrigerated container operations and can follow the midpoint of the operating range. Given that a high proportion of refrigerated cargo containers consists of food, such improvements in temperature variations can contribute to maintaining the freshness and quality of food.

4.4. Limitations and Future Research

This study focused on modeling a 1000 TEU-class vessel rather than the more recent trend of 10,000 TEU-class or larger container ships, which may limit its reflection of current industry trends. Additionally, the ship’s power load exhibits dynamic characteristics due to various equipment consuming power in addition to refrigerated containers. Nevertheless, this study confirms that the proposed operation method for refrigerated containers can lead to more efficient power control. In future studies, this approach can be applied to larger vessels and further validated by incorporating additional dynamic power loads.
Because this study was conducted via simulations, further verification with actual ships or land-based facilities is required. To validate the effectiveness of the proposed method, it is necessary to design hardware and develop software for refrigerated containers that allow external control of the refrigerant cycle operation. Further technological development is required to integrate this control with a higher-level PMS. However, as this does not involve changing the functions of the existing PMS or introducing a new concept of refrigerated containers, significant investment and technological development for commercialization are not anticipated. Furthermore, this could be linked to studies on IoT-connected refrigerated container status monitoring and other related research [30,42].

5. Conclusions

This study addresses the compromising onboard electrical power stability and reduced power generation efficiency owing to the independent operation of refrigerated containers on ships. The simulations verified that an integrated control system, which includes an algorithm that sequentially operates refrigerated containers requiring refrigerant cycle operation within an available electric power margin, functions effectively. The results are summarized as follows.
  • Using the conventional operating method of refrigerated containers, the load fluctuation of an engine generator of the target ship was 37.6% of the rated capacity. However, with the proposed ICS, the load fluctuation was reduced to 9.6%, thereby enhancing the stability of the power system.
  • The conventional operating method increased the load and fluctuations that exceeded the standby generator operation settings of the PMS, resulting in more than 50 instances of standby generator operation and shutdowns during the simulation period. In contrast, no standby generator operations or shutdowns occurred with the proposed ICS.
  • Both the conventional and ICS-based refrigerated container operations maintained the internal cargo temperature within the set limits; however, the temperature variation range of the refrigerated cargo with the ICS was lower.
  • The conventional operating method resulted in a higher SFOC owing to the power-load instability and parallel operation with the standby engine generator. However, the proposed ICS allows operation in a lower fuel consumption range, with the average SFOC of No. 1 DG showing a difference of 4.3 g/kWh during the simulation period.
  • The application of the proposed ICS resulted in a fuel saving of 0.24 tons over the 70 h simulation period compared to the conventional method, corresponding to a 1.88% improvement in fuel consumption for power generation.

Funding

This research was supported by Korea Planning & Evaluation Institute of Industrial Technology (KEIT) funded by the Ministry of Commerce Industry and Energy (RS-2024-00432064).

Institutional Review Board Statement

Not applicable.

Informed Consent Statement

Not applicable.

Data Availability Statement

Data presented in this article are available on request from the corresponding author.

Conflicts of Interest

The author declares no conflicts of interest.

Abbreviations

MPC: model predicted control; DG: diesel generator, ICS: integrated control system for a refrigerated container, CST: refrigeration cycle start temperature, CTT: refrigeration cycle stop temperature, SFOC: specific fuel oil consumption, IoT: internet of things, SF: status factor for a refrigerated container, Ref.: refrigerated container.

References

  1. Lu, Y.; Gu, Z.; Liu, S.; Wu, C.; Shao, W.; Li, C. Research on main engine power of transport ship with different bows in ice area according to EEDI regulation. J. Mar. Sci. Eng. 2021, 9, 1241. [Google Scholar] [CrossRef]
  2. Ren, H.; Ding, Y.; Sui, C. Influence of EEDI (Energy Efficiency Design Index) on ship–engine–propeller matching. J. Mar. Sci. Eng. 2019, 7, 425. [Google Scholar] [CrossRef]
  3. Hasan, S.R.; Karim, M.M. Proposed inland oil tanker design in Bangladesh focusing CO2 emission reduction based on revised EEDI parameters. J. Mar. Sci. Eng. 2020, 8, 658. [Google Scholar] [CrossRef]
  4. Bayraktar, M.; Yuksel, O. A scenario-based assessment of the energy efficiency existing ship index (EEXI) and carbon intensity indicator (CII) regulations. Ocean Eng. 2023, 278, 114295. [Google Scholar] [CrossRef]
  5. Bayramoğlu, K. The effects of alternative fuels, cruising duration and variable generators combination on exhaust emissions, energy efficiency existing ship index (EEXI) and carbon intensity rating (CII). Ocean Eng. 2024, 302, 117723. [Google Scholar] [CrossRef]
  6. Lee, S.-S. Analysis of the effects of EEDI and EEXI implementation on CO2 emissions reduction in ships. Ocean Eng. 2024, 295, 116877. [Google Scholar] [CrossRef]
  7. Liu, J.; Qu, J.; Feng, Y.; Zhu, Y.; Wu, Y. Improving the Overall Efficiency of Marine Power Systems through Co-Optimization of Top-Bottom Combined Cycle by Means of Exhaust-Gas Bypass: A Semi Empirical Function Analysis Method. J. Mar. Sci. Eng. 2023, 11, 1215. [Google Scholar] [CrossRef]
  8. Díaz-Secades, L.A.; González, R.; Rivera, N.; Quevedo, J.R.; Montañés, E. Parametric study of organic Rankine working fluids via Bayesian optimization of a preference learning ranking for a waste heat recovery system applied to a case study marine engine. Ocean Eng. 2024, 306, 118124. [Google Scholar] [CrossRef]
  9. Roh, G.; Kim, H.; Jeon, H.; Yoon, K. Fuel consumption and CO2 emission reductions of ships powered by a fuel-cell-based hybrid power source. J. Mar. Sci. Eng. 2019, 7, 230. [Google Scholar] [CrossRef]
  10. Gospić, I.; Glavan, I.; Poljak, I.; Mrzljak, V. Energy, economic and environmental effects of the marine diesel engine trigeneration energy systems. J. Mar. Sci. Eng. 2021, 9, 773. [Google Scholar] [CrossRef]
  11. Fitzgerald, W.B.; Howitt, O.J.; Smith, I.J.; Hume, A. Energy use of integral refrigerated containers in maritime transportation. Energy Policy 2011, 39, 1885–1896. [Google Scholar] [CrossRef]
  12. Binqadhi, H.; Hamanah, W.M.; Shafiullah, M.; Alam, M.S.; AlMuhaini, M.M.; Abido, M.A. A Comprehensive Survey on Advancement and Challenges of DC Microgrid Protection. Sustainability 2024, 16, 6008. [Google Scholar] [CrossRef]
  13. Guo, X.; Lang, X.; Yuan, Y.; Tong, L.; Shen, B.; Long, T.; Mao, W. Energy management system for hybrid ship: Status and perspectives. Ocean Eng. 2024, 310, 118638. [Google Scholar] [CrossRef]
  14. Ma, S.; Ding, Y.; Liu, G.; Sui, C.; Xiang, L. Effects of adverse sea conditions on the dynamic performance of a cruise ship integrated power system. Ocean Eng. 2024, 310, 118715. [Google Scholar] [CrossRef]
  15. Jeon, H.; Park, K.; Kim, J. Comparison and verification of reliability assessment techniques for fuel cell-based hybrid power system for ships. J. Mar. Sci. Eng. 2020, 8, 74. [Google Scholar] [CrossRef]
  16. Lucà Trombetta, G.; Leonardi, S.G.; Aloisio, D.; Andaloro, L.; Sergi, F. Lithium-ion batteries on board: A review on their integration for enabling the energy transition in shipping industry. Energies 2024, 17, 1019. [Google Scholar] [CrossRef]
  17. Kan, A.; Wang, T.; Zhu, W.; Cao, D. The characteristics of cargo temperature rising in reefer container under refrigeration-failure condition. Int. J. Refrig. 2021, 123, 1–8. [Google Scholar] [CrossRef]
  18. Filina-Dawidowicz, L.; Filin, S.; Wojnicz, L.; Miłek, D.; Grzelak, P. Energy-efficient maritime transport of refrigerated containers. Procedia Comput. Sci. 2022, 207, 3572–3581. [Google Scholar] [CrossRef]
  19. Yang, Z.; Lian, Z.; Xiong, J.; Miao, Z.; An, Y.; Chen, A. Feasibility study on applying the mist-spraying cooling to improve the capacity of ultra-large container ships for loading reefers. Ocean Eng. 2018, 163, 377–390. [Google Scholar] [CrossRef]
  20. Sørensen, K.K.; Stoustrup, J.; Bak, T. Adaptive MPC for a reefer container. Control Eng. Pract. 2015, 44, 55–64. [Google Scholar] [CrossRef]
  21. Nel, M.; Goedhals-Gerber, L.L.; van Dyk, E. A comparison of different technologies to improve temperature control in refrigerated containers: A table grape export case. Heliyon 2024, 10, e25988. [Google Scholar] [CrossRef] [PubMed]
  22. Budiyanto, M.A.; Zhafari, F. Simulation study using building-design energy analysis to estimate energy consumption of refrigerated container. Energy Procedia 2019, 156, 207–211. [Google Scholar] [CrossRef]
  23. Budiyanto, M.A.; Fernanda, H.; Shinoda, T. Effect of azimuth angle on the energy consumption of refrigerated container. Energy Procedia 2019, 156, 201–206. [Google Scholar] [CrossRef]
  24. van Duin, J.R.; Geerlings, H.H.; Verbraeck, A.A.; Nafde, T.T. Cooling down: A simulation approach to reduce energy peaks of reefers at terminals. J. Clean. Prod. 2018, 193, 72–86. [Google Scholar] [CrossRef]
  25. Iris, Ç.; Lam, J.S.L. Optimal energy management and operations planning in seaports with smart grid while harnessing renewable energy under uncertainty. Omega 2021, 103, 102445. [Google Scholar] [CrossRef]
  26. Zhang, X.; Lam, J.S.L.; Iris, Ç. Cold chain shipping mode choice with environmental and financial perspectives. Transp. Res. Part D Transp. Environ. 2020, 87, 102537. [Google Scholar] [CrossRef]
  27. Mao, A.; Yu, T.; Ding, Z.; Fang, S.; Guo, J.; Sheng, Q. Optimal scheduling for seaport integrated energy system considering flexible berth allocation. Appl. Energy 2022, 308, 118386. [Google Scholar] [CrossRef]
  28. Ahn, J.; Park, S.H.; Jeong, J.; Lee, S.; Ryu, J.; Park, J. Eco-efficient marine power system with cooled air ventilation by waste LNG cold energy for reefer holds in an ultra-large container ship. J. Clean. Prod. 2021, 322, 129037. [Google Scholar] [CrossRef]
  29. Yousefzadeh, M.; Lenzen, M.; Tyedmers, E.K.; Ali, S.H. An integrated combined power and cooling strategy for small islands. J. Clean. Prod. 2020, 276, 122840. [Google Scholar] [CrossRef]
  30. Tang, P.; Postolache, O.A.; Hao, Y.; Zhong, M. Reefer container monitoring system. In Proceedings of the 2019 11th International Symposium on Advanced Topics in Electrical Engineering (ATEE), Bucharest, Romania, 28–30 March 2019; pp. 1–6. [Google Scholar]
  31. Haass, R.; Dittmer, P.; Veigt, M.; Lütjen, M. Reducing food losses and carbon emission by using autonomous control–A simulation study of the intelligent container. Int. J. Prod. Econ. 2015, 164, 400–408. [Google Scholar] [CrossRef]
  32. Defraeye, T.; Verboven, P.; Opara, U.L.; Nicolai, B.; Cronjé, P. Feasibility of ambient loading of citrus fruit into refrigerated containers for cooling during marine transport. Biosyst. Eng. 2015, 134, 20–30. [Google Scholar] [CrossRef]
  33. Zhang, X.; Lam, J.S.L. Shipping mode choice in cold chain from a value-based management perspective. Transp. Res. Part E Logist. Transp. Rev. 2018, 110, 147–167. [Google Scholar] [CrossRef]
  34. Budiyanto, M.A.; Shinoda, T. The effect of solar radiation on the energy consumption of refrigerated container. Case Stud. Therm. Eng. 2018, 12, 687–695. [Google Scholar] [CrossRef]
  35. Pei, R.; Xie, J.; Zhang, H.; Sun, K.; Wu, Z.; Zhou, S. Robust multi-layer energy management and control methodologies for reefer container park in port terminal. Energies 2021, 14, 4456. [Google Scholar] [CrossRef]
  36. Issa, S.; Lang, W. Airflow simulation inside reefer containers. In Dynamics in Logistics: Proceedings of the 4th International Conference LDIC, 2014 Bremen, Germany; Springer: Berlin/Heidelberg, Germany, 2014; pp. 303–311. [Google Scholar]
  37. Sørensen, K.K.; Nielsen, J.D.; Stoustrup, J. Modular simulation of reefer container dynamics. Simulation 2014, 90, 249–264. [Google Scholar] [CrossRef]
  38. Roh, C.; Jeon, H.-m.; Kim, S.-w.; Kim, J.-s.; Lee, N.-y.; Song, S.-w. Optimal Hybrid Pulse Width Modulation for Three-Phase Inverters in Electric Propulsion Ships. Machines 2024, 12, 109. [Google Scholar] [CrossRef]
  39. Luo, Y.; Fang, S.; Niu, T.; Chen, G.; Liao, R. Power-characterized shipboard hybrid energy storage system management for dynamic positioning. Ocean Eng. 2024, 298, 117256. [Google Scholar] [CrossRef]
  40. Gao, F.; Brodtkorb, A.H.; Zadeh, M.; Mo, S.M. Power management and optimization of marine hybrid propulsion systems: A combinator surface methodology. Ocean Eng. 2024, 309, 118354. [Google Scholar] [CrossRef]
  41. Wu, S.; Li, T.; Chen, R.; Huang, S.; Xu, F.; Wang, B. Transient Performance of Gas-Engine-Based Power System on Ships: An Overview of Modeling, Optimization, and Applications. J. Mar. Sci. Eng. 2023, 11, 2321. [Google Scholar] [CrossRef]
  42. Putra, A.P.; Yusro, M.; Diamah, A. Prototype of a monitoring system for temperature, humidity, and location of reefer container based on IoT. In Proceedings of the 2022 International Conference on Informatics Electrical and Electronics (ICIEE), Yogyakarta, Indonesia, 5–7 October 2022; pp. 1–5. [Google Scholar]
Figure 1. Design and verification process of proposed ref. container integrated control system.
Jmse 12 01624 g001
Figure 2. Configuration for existing ref. container model.
Jmse 12 01624 g002
Figure 3. Comparison of temperature and power variations between the reference model and test model.
Jmse 12 01624 g003
Figure 4. DG SFOC curve for target vessel.
Jmse 12 01624 g004
Figure 5. Configuration for ref. container with integrated control system.
Jmse 12 01624 g005
Figure 6. Configuration for electrical system with control and monitoring system.
Jmse 12 01624 g006
Figure 7. Result for electrical power variation with and without ICS.
Jmse 12 01624 g007
Figure 8. Temperature variation with and without ICS.
Jmse 12 01624 g008
Figure 9. Each ref. container power variation with and without ICS.
Jmse 12 01624 g009
Figure 10. Load variation for No. 1 and 2 DG with and without ICS.
Jmse 12 01624 g010
Figure 11. Average SFOC for DGs.
Jmse 12 01624 g011
Figure 12. Fuel oil consumption for each case.
Jmse 12 01624 g012
Table 1. Specification for target vessel.
1006 TEU Container Vessel
Max. 20 Feet. Ref. Container Quantity is 65 [EA]
Electric System
Power SourceDG ModelDG Fuel TypeCapability [kVA]Power
Factor
Voltage
[V]
Quantity
Diesel
Generator
MAN E&S
23/30 H
MGO10640.854503
Electrical Load Analysis
Navigation ModeSeagoingManeuveringCargo HandlingIn PortMano. With Thruster
Power [kW]580.9753.3608.6496.9746.9
Table 2. Data for literature and test models.
Reference Data from the Literature [24]
DimensionsInitial temperature before plug-inSet pointAllowed temperature, upper limitAllowed temperature, lower limitAuxiliary powerCooling power
Values10.2 °C10 °C10.5 °C9.5 °C2.5 kW10 kW
Parameter for Test Model
DimensionsInitial temperature before plug-inSet pointAllowed temperature, upper limit (CST)Allowed temperature, lower limit (CTT)Power when CTT StatusPower when CST Status
Values10.2 °C-10.5 °C9.5 °C2.5 kW12.5 kW
Table 3. Parameter for each ref. container model.
Ref. No.Initial Temp. [°C]CST [°C]CTT [°C]SF
11012101.00
211740.99
38630.98
47950.98
55860.97
691070.96
79970.98
891060.96
911530.96
1012970.97
119640.97
129730.98
13111080.99
145740.95
1512840.96
165850.97
177510.98
187520.98
198950.95
206620.99
215840.97
225510.99
235950.97
248621.00
256640.96
2691070.96
2771070.98
286750.96
298640.95
3081060.97
3120−50.95
32−1−2−80.96
33−10−50.97
342−3−71.00
35−1−1−50.97
36−20−40.96
371−1−70.97
38−1−1−50.96
392−1−50.98
40120−40.99
41512100.99
427740.98
4310630.97
4410950.97
457860.98
4681070.99
478971.00
4881061.00
493530.95
507970.95
5130−50.98
52−3−2−80.96
53−60−50.95
54−2−3−70.95
550−1−50.96
5600−40.97
57−4−1−70.98
58−2−1−50.99
59−3−1−50.99
60−20−41.00
613640.97
6251060.98
63−10−50.96
64−4−2−80.97
65−30−50.98
Disclaimer/Publisher’s Note: The statements, opinions and data contained in all publications are solely those of the individual author(s) and contributor(s) and not of MDPI and/or the editor(s). MDPI and/or the editor(s) disclaim responsibility for any injury to people or property resulting from any ideas, methods, instructions or products referred to in the content.

