Article

Modeling the Impacts of Land Reclamation on Sediment Dynamics in a Semi-Enclosed Bay

1
First Institute of Oceanography, Ministry of Natural Resources, Qingdao 266061, China
2
Key Laboratory of Coastal Science and Integrated Management, Ministry of Natural Resources, Qingdao 266061, China
3
College of Marine Geosciences, Ocean University of China, Qingdao 266061, China
4
Key Laboratory of Marine Geology and Metallogeny, Ministry of Natural Resources, Qingdao 266061, China
*
Author to whom correspondence should be addressed.
J. Mar. Sci. Eng. 2024, 12(9), 1633; https://doi.org/10.3390/jmse12091633
Submission received: 31 July 2024 / Revised: 4 September 2024 / Accepted: 5 September 2024 / Published: 13 September 2024

Abstract

:
Semi-enclosed bays are significantly influenced by the interactions between land and sea, as well as human activities. One notable human activity, land reclamation, impacts water exchange within these bays. However, the variability of sediment transport and cross-bay transport following reclamation remains poorly understood. This study aims to enhance the understanding of sediment dynamics and the responses of cross-bay transport to reclamation. A well-validated three-dimensional numerical model was developed in the Laizhou Bay (LB). Following reclamation, tidal currents suspended sediment concentration, and erosion increased seaward, while these factors decreased landward. In LB, surface and bottom subtidal currents flowed in opposite directions, with the direction of volume transport primarily determined by bottom currents. In the western LB, volume and sediment transport exhibited an anticyclonic pattern, with pronounced seasonal variations observed elsewhere. During summer, volume and sediment transport predominantly occurred from the northeast to the southwest. In winter, volume transport in northern LB was directed westward, while it was eastward in the southern part; sediment transport was primarily eastward. Advection played a significant role in sediment transport dynamics. The pathway of cross-bay sediment transport was primarily located in the central part of the bay. Notably, the cross-bay sediment transport flux in winter was approximately 3.5 times greater than in summer, with reclamation resulting in a reduction in cross-bay transport flux by about 22.17%.

1. Introduction

Land reclamation projects represent a method by which humans expand land area through the process of filling in bodies of water. In response to the rapid economic development occurring in China’s coastal regions, land reclamation activities have been implemented at an accelerated pace in these areas. Such projects can facilitate urban development, port construction, and the planning of industrial zones. However, they also pose potential risks to the ecological environment, marine life, and the coastline’s resilience against disasters [1].
Bays and coastal areas, owing to their unique geographical environments, are typical regions where socio-economic, resource endowment, and ecological contradictions are particularly pronounced. These areas are also significantly impacted by both climate change and human activities [2]. Reclamation efforts have led to substantial alterations in coastline and bay morphology, exhibiting clear temporal and spatial variations. Such activities have directly modified the shape and length of coastlines; bays and coastal areas thus transition from undergoing naturally evolving processes to becoming an artificial architectural form [3]. In this context, tidal amplitude, tidal prism, and water exchange capacity have all undergone changes. Simulation results from Tokyo Bay indicated that following land reclamation, the water area in the bay decreased by 20%, while current velocity and water retention time decreased by 20% and 35%, respectively [4]. As the hydrodynamic conditions evolved, sediment transport and seabed thickness were also affected. Extensive field observations and numerical simulations have been employed to investigate sediment dynamics in bays and coastal areas. The increased current velocity after reclamation enhanced suspended sediment concentration (SSC) [5,6], but may have also led to reduced current velocity and decreased SSC in certain localized regions [7,8]. Regarding sediment erosion and deposition, some researchers have argued that reclamation can induce estuarine siltation or tidal flat progradation. A one-dimensional numerical model in the Scheldt Estuary demonstrated that reclamation and dam construction resulted in increased tidal velocity, alongside a reduced predominance of flood tidal currents, which in turn enhanced tidal flat siltation [9]. Sedimentological studies have demonstrated that over the past fifty years, the average sediment accumulation rate in the Nakdong Estuary of South Korea has ranged from 2 to 6 cm per year. This accumulation was largely attributed to the construction of estuarine dams and land reclamation activities. The primary mechanism for sediment deposition in the central estuary has been identified as the disparity in sediment magnitude between the upper and lower stream [10,11]. Certain restoration projects have been effective in blocking sediment export while simultaneously protecting marshes from wave erosion [12]. Research conducted along Chinese coasts has indicated that land reclamation has led to a landward transport of sediments, with tidal flats continually adjusting their morphology and possibly giving rise to new types of tidal flats in proximity [13]. Conversely, some studies have suggested that in tidal flats adjacent to dykes, increased current velocities and wave conditions have resulted in reduced deposition rates and diminished sediment preservation, ultimately leading to erosion of these tidal flats [14,15]. Similarly, land reclamation near the Ems Estuary has led to a decrease in tidal flats, attributed to a reduction in the deposition of fine-grained sediments [5]. The alterations in seabed erosion and deposition resulting from reclamation activities may also induce changes in geomorphology. For instance, the decadal evolution of estuarine channels due to the reclamation of secondary basins in the Western Scheldt Estuary has caused lateral channel displacement triggered by the closure of these basins [16]. Variations in sediment dynamics and responses to seabed erosion and deposition linked to reclamation projects are influenced by the types of reclamation undertaken, as well as local coastal morphology and hydrodynamic conditions. However, common impacts of reclamation include a reduced tidal prism and diminished water exchange capacity [17].
Laizhou Bay (LB) is a typical semi-enclosed bay located on the eastern shelf of China, positioned in the northwest of the Shandong Peninsula and adjacent to the southern Bohai Sea (Figure 1a). Since the Yellow River began flowing into the Bohai Sea in 1855, it has transported substantial amounts of freshwater and terrestrial materials into the adjacent seas, with a significant portion entering LB. This bay is one of the earliest regions in China to have engaged in reclamation activities, which include the construction of salt fields, aquaculture dikes, port docks, and artificial islands. Among these, the most notable are the dikes built to block tidal currents and sediment outside Guangli Port and Weifang Port in southwestern LB. These dikes form a dual-dike encircled port layout, extending more than 10 km into the sea (Figure 1b). From 1968 to 2015, the area reclaimed in LB reached nearly 1201.7 km2 [18]. Previous studies assessing the impact of reclamation have primarily concentrated on tidal current velocity, tidal prism, and water exchange [19,20]. These investigations have enhanced our understanding of the hydrodynamic effects of reclamation in bays. However, the absence of long-term field observations on sediment processes and sediment transport models has resulted in a lack of detailed research regarding the effects of sediment dynamics as well as seabed erosion and deposition in LB. Additionally, LB serves as a crucial place for the long-distance transport of sediment from the Yellow River into the open sea [21,22,23]. Consequently, changes in sediment transport patterns before and after reclamation are likely to influence sediment transport from the Yellow River across the bay and into the Yellow Sea. Therefore, it is imperative to intensify research on the alterations in sediment flux associated with reclamation activities.
In this paper, we established a well-validated high-resolution coupled hydrodynamic-sediment model in LB to investigate the impacts of reclamation projects in semi-enclosed bays on hydrodynamics and sediment dynamics. We analyze the dominant mechanisms of sediment transport before and after reclamation and explore the patterns of material transport as well as changes in cross-bay sediment flux.

2. Materials and Methods
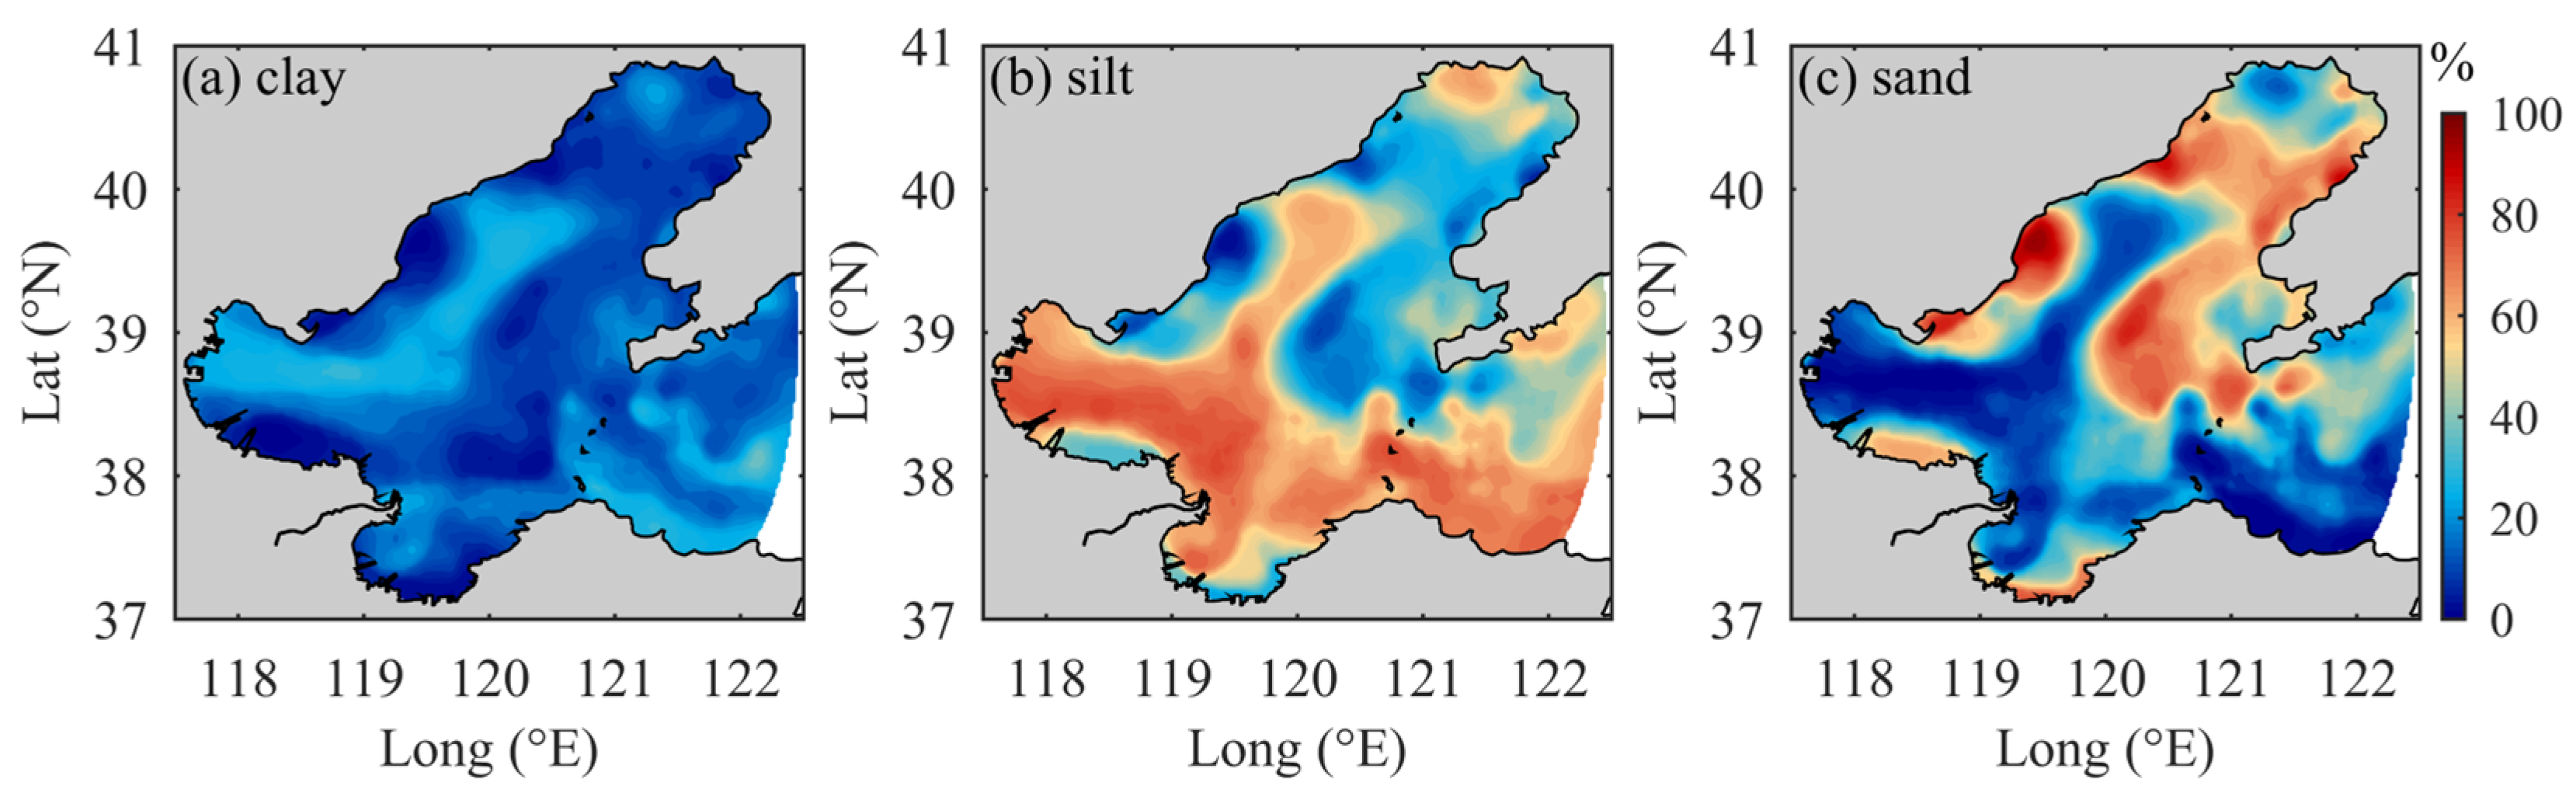
2.1. Study Area

LB has a surface area of approximately 6060 km2 and an average water depth of less than 10 m, characterized by numerous shoals located in the western and southern regions of the bay. The landforms and seabed sediment types exhibit significant variation between the eastern and western parts of LB. The western terrain is predominantly flat, with finer seabed sediments primarily composed of silt, silty sand, and sandy silt. In contrast, the eastern region experiences more pronounced fluctuations in water depth, featuring sandy coastlines and coarser-grained seabed sediments (Figure 2). The tidal dynamics in Laizhou Bay are largely influenced by the M2 constituent, which results in an average tidal range of approximately 0.9 m and tidal current velocities between 0.1 and 0.2 m/s [24,25]. During winter, the predominant wave direction is northeast, with an average wave height of about 0.6 m, whereas in summer, the wave direction shifts to the south [26]. The seabed sediments in LB are primarily sourced from the Yellow River and smaller coastal rivers. Sediment transport is mainly facilitated by advection due to tidal currents, along with the redistribution of resuspended sediments from the seabed [27].

2.2. Model Description

The hydrodynamic and sediment models were based on the unstructured-grid finite-volume coastal ocean model (FVCOM), which utilized unstructured triangular grids in the horizontal direction and sigma coordinate transformations in the vertical direction. The numerical method implemented is the finite-volume approach, enabling simulations of three-dimensional primitive equations at the free surface. FVCOM has been widely applied in studies of estuaries, coastal seas, and continental shelves [28,29,30,31,32,33,34,35]. The sediment model, FVCOM-SED, is based on the community sediment transport model (CSTM) developed by the United States Geological Survey (USGS) and other relevant researchers. It calculates sediment transport using a conservation of mass finite-volume method and incorporates processes such as suspended and bed load calculations, bed erosion, and deposition [31,35]. The wave model is based on the simulating waves nearshore (SWAN) model [36,37,38,39,40,41,42]. The wave model represents the characteristics of surface waves by solving the wave balance equation, accounting for energy dissipation due to white-capping, bottom friction, triad and quadruplet wave–wave interactions, and depth-induced breaking in shallow waters.
Based on the collected coastline, bathymetry, river, ocean, and meteorological data, a three-dimensional high-resolution numerical model covering LB was established, which encompassed the entire Bohai Sea and adjacent seas (Figure 1c). The coastline data were digitized from Landsat satellite imagery. The bathymetry data originated from Chinese coastal sea chart database in 2020. The open boundary of the model is located in the north of the Yellow Sea, with enhanced resolution near LB, ranging from 200 to 500 m horizontally and divided into 9 uniform sigma layers vertically. The initial temperature and salinity were provided by large-scale simulations from the East China Seas model [43]. The conditions at the open boundary were determined by tidal and current conditions, also provided by the East China Seas model. The meteorological data (wind, atmospheric pressure, temperature, relative humidity, short- and long-wave radiation, evaporation, and precipitation) were derived from the ERA5 dataset. The Yellow River’s discharge and sediment load were obtained from the Bulletin of Chinese River Sediment. The sediments were divided into three components: clay, silt, and sand (Figure 2). The initial seabed component was set based on the survey results of seabed sediments in the Bohai Sea. The main sediment parameters (Table 1) were calibrated using measured data and previous simulation results [31,35,43]. The model used a cold-start calculation, with the internal and external time steps set to 9 s and 3 s, respectively. The SWAN model and FVCOM model used the same grid, and the wave simulation results from this model provided wave conditions (including significant wave height, wave period, wave direction, and bottom-wave orbital velocity) for the three-dimensional sediment transport model. These conditions were used to calculate the wave–current-coupling bottom shear stress. The simulations were conducted over the same period as the field observations, using collected in situ data and satellite-derived results from LB to validate the currents, sediments, waves, and temperatures, respectively. In situ data in LB (Figure 1b) were used to validate the currents and sediments, while the validation of waves and temperature utilized data from the Jason and MODIS satellites, respectively.

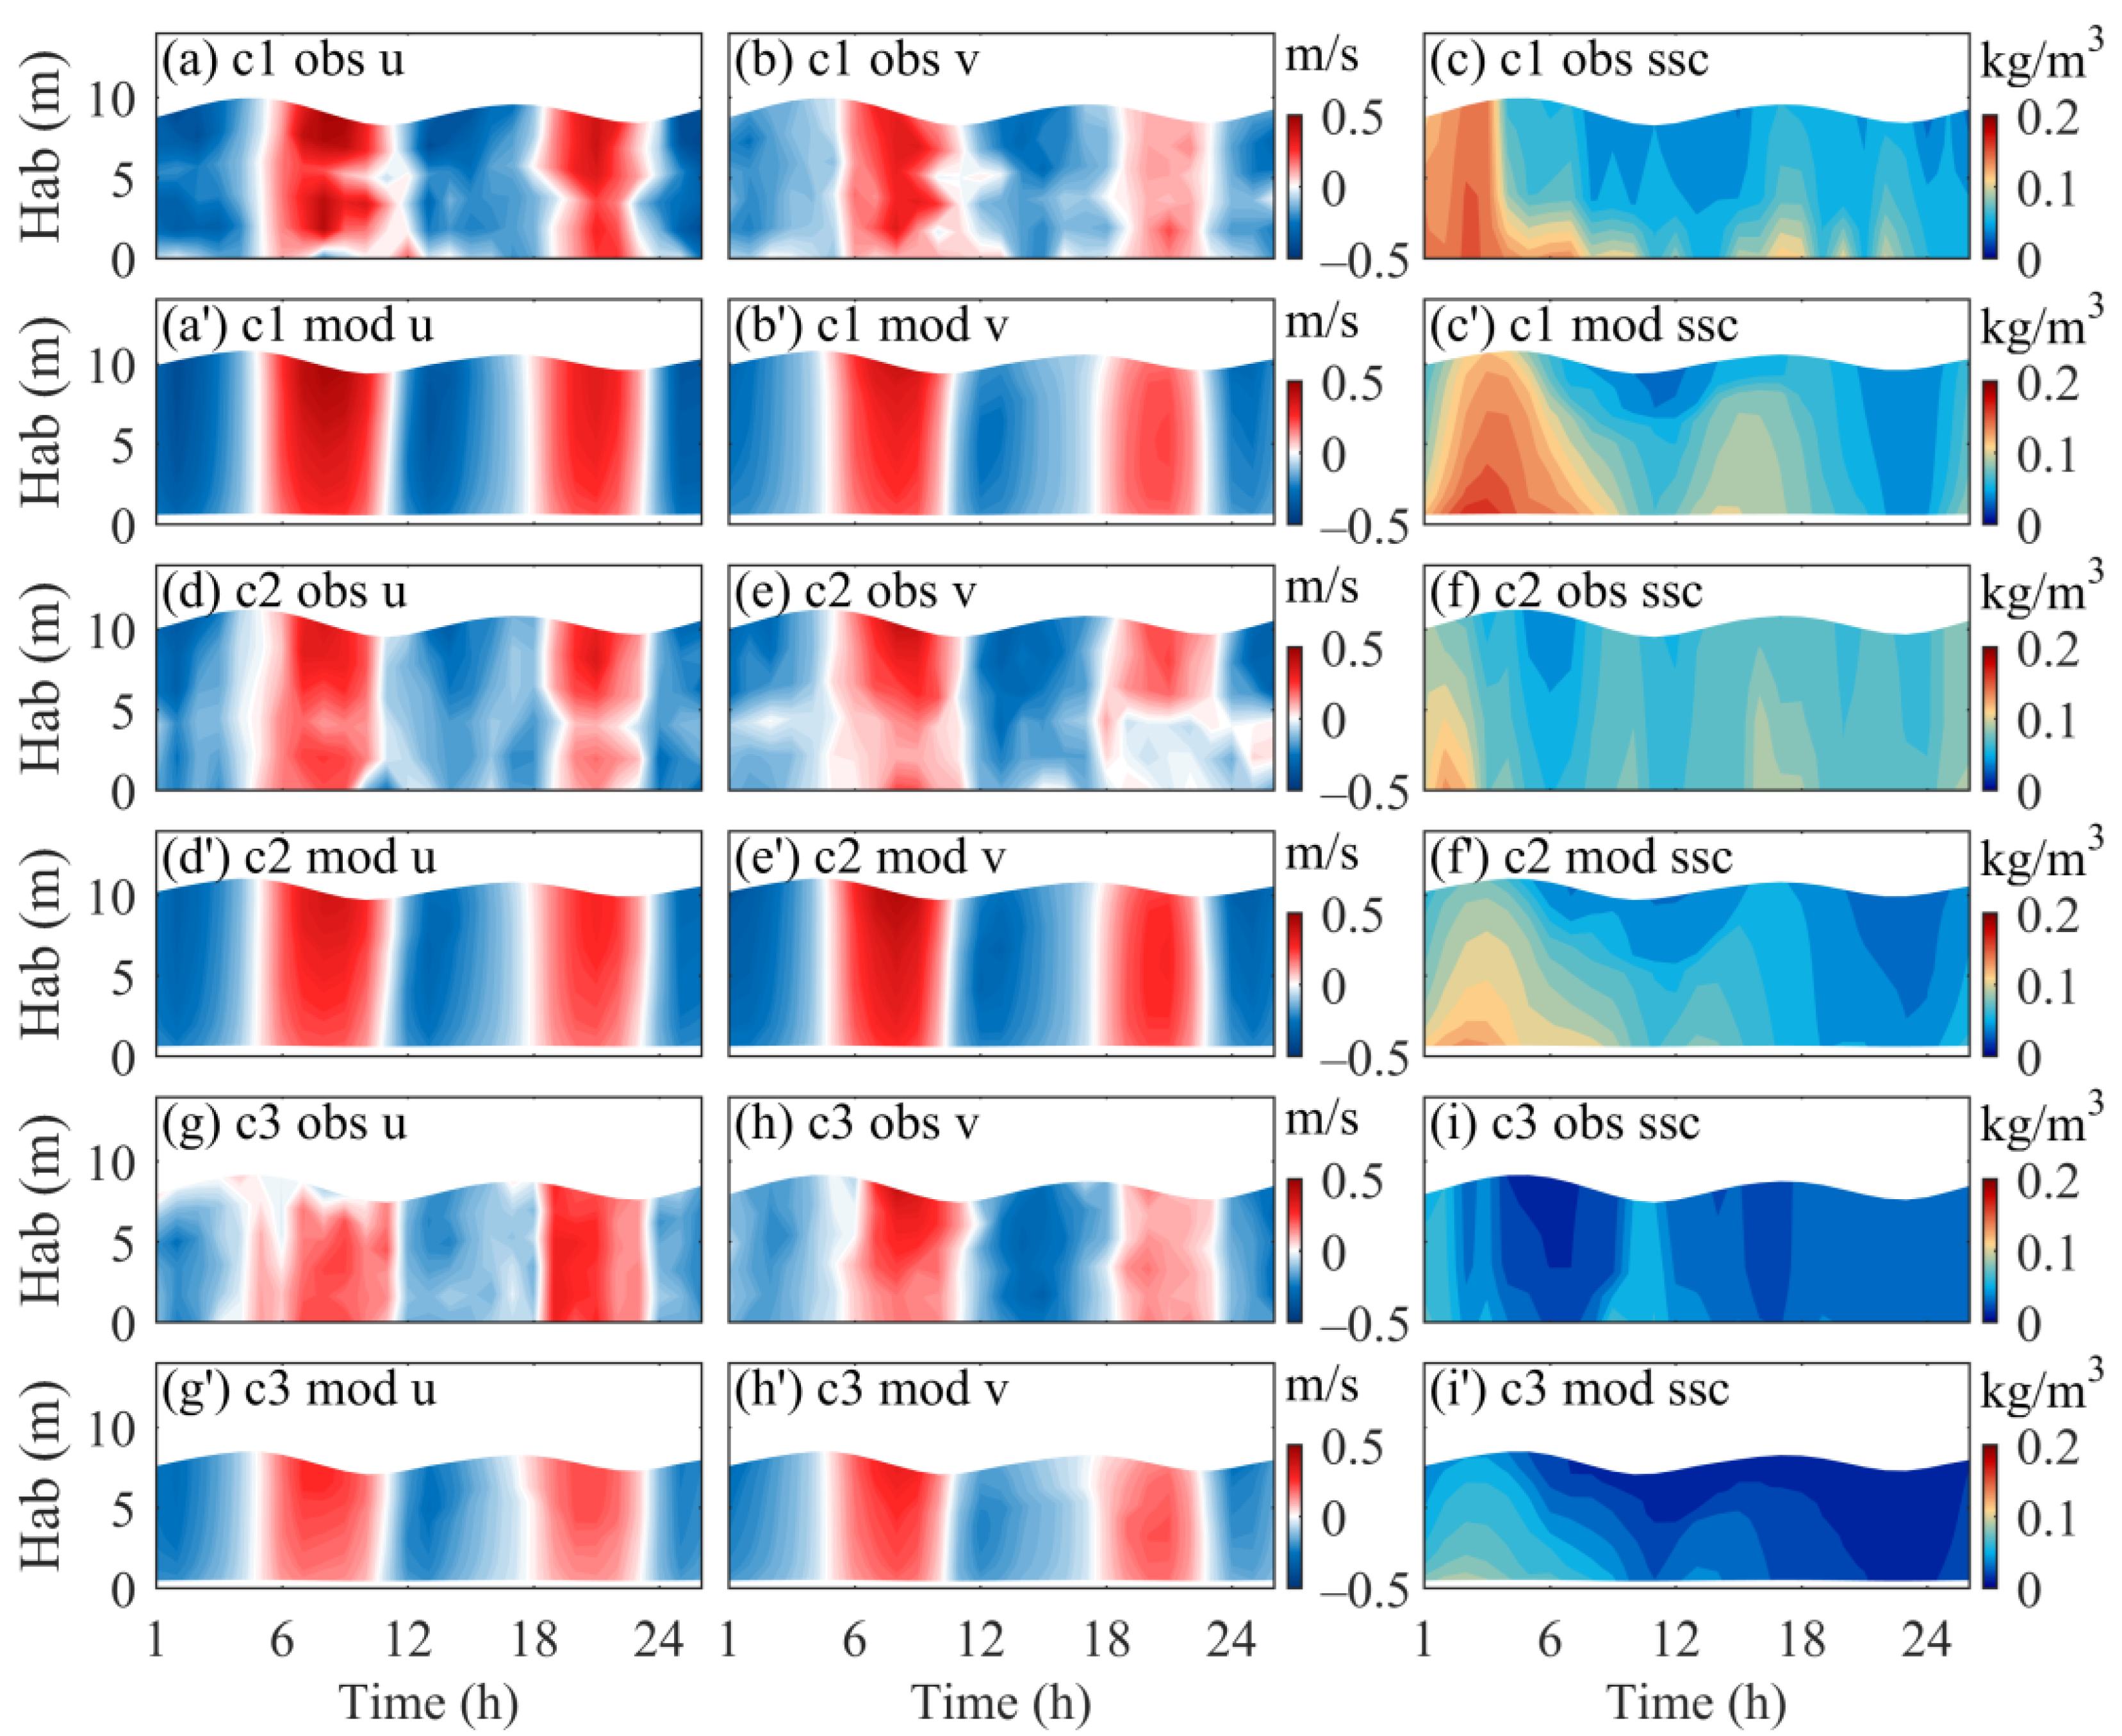
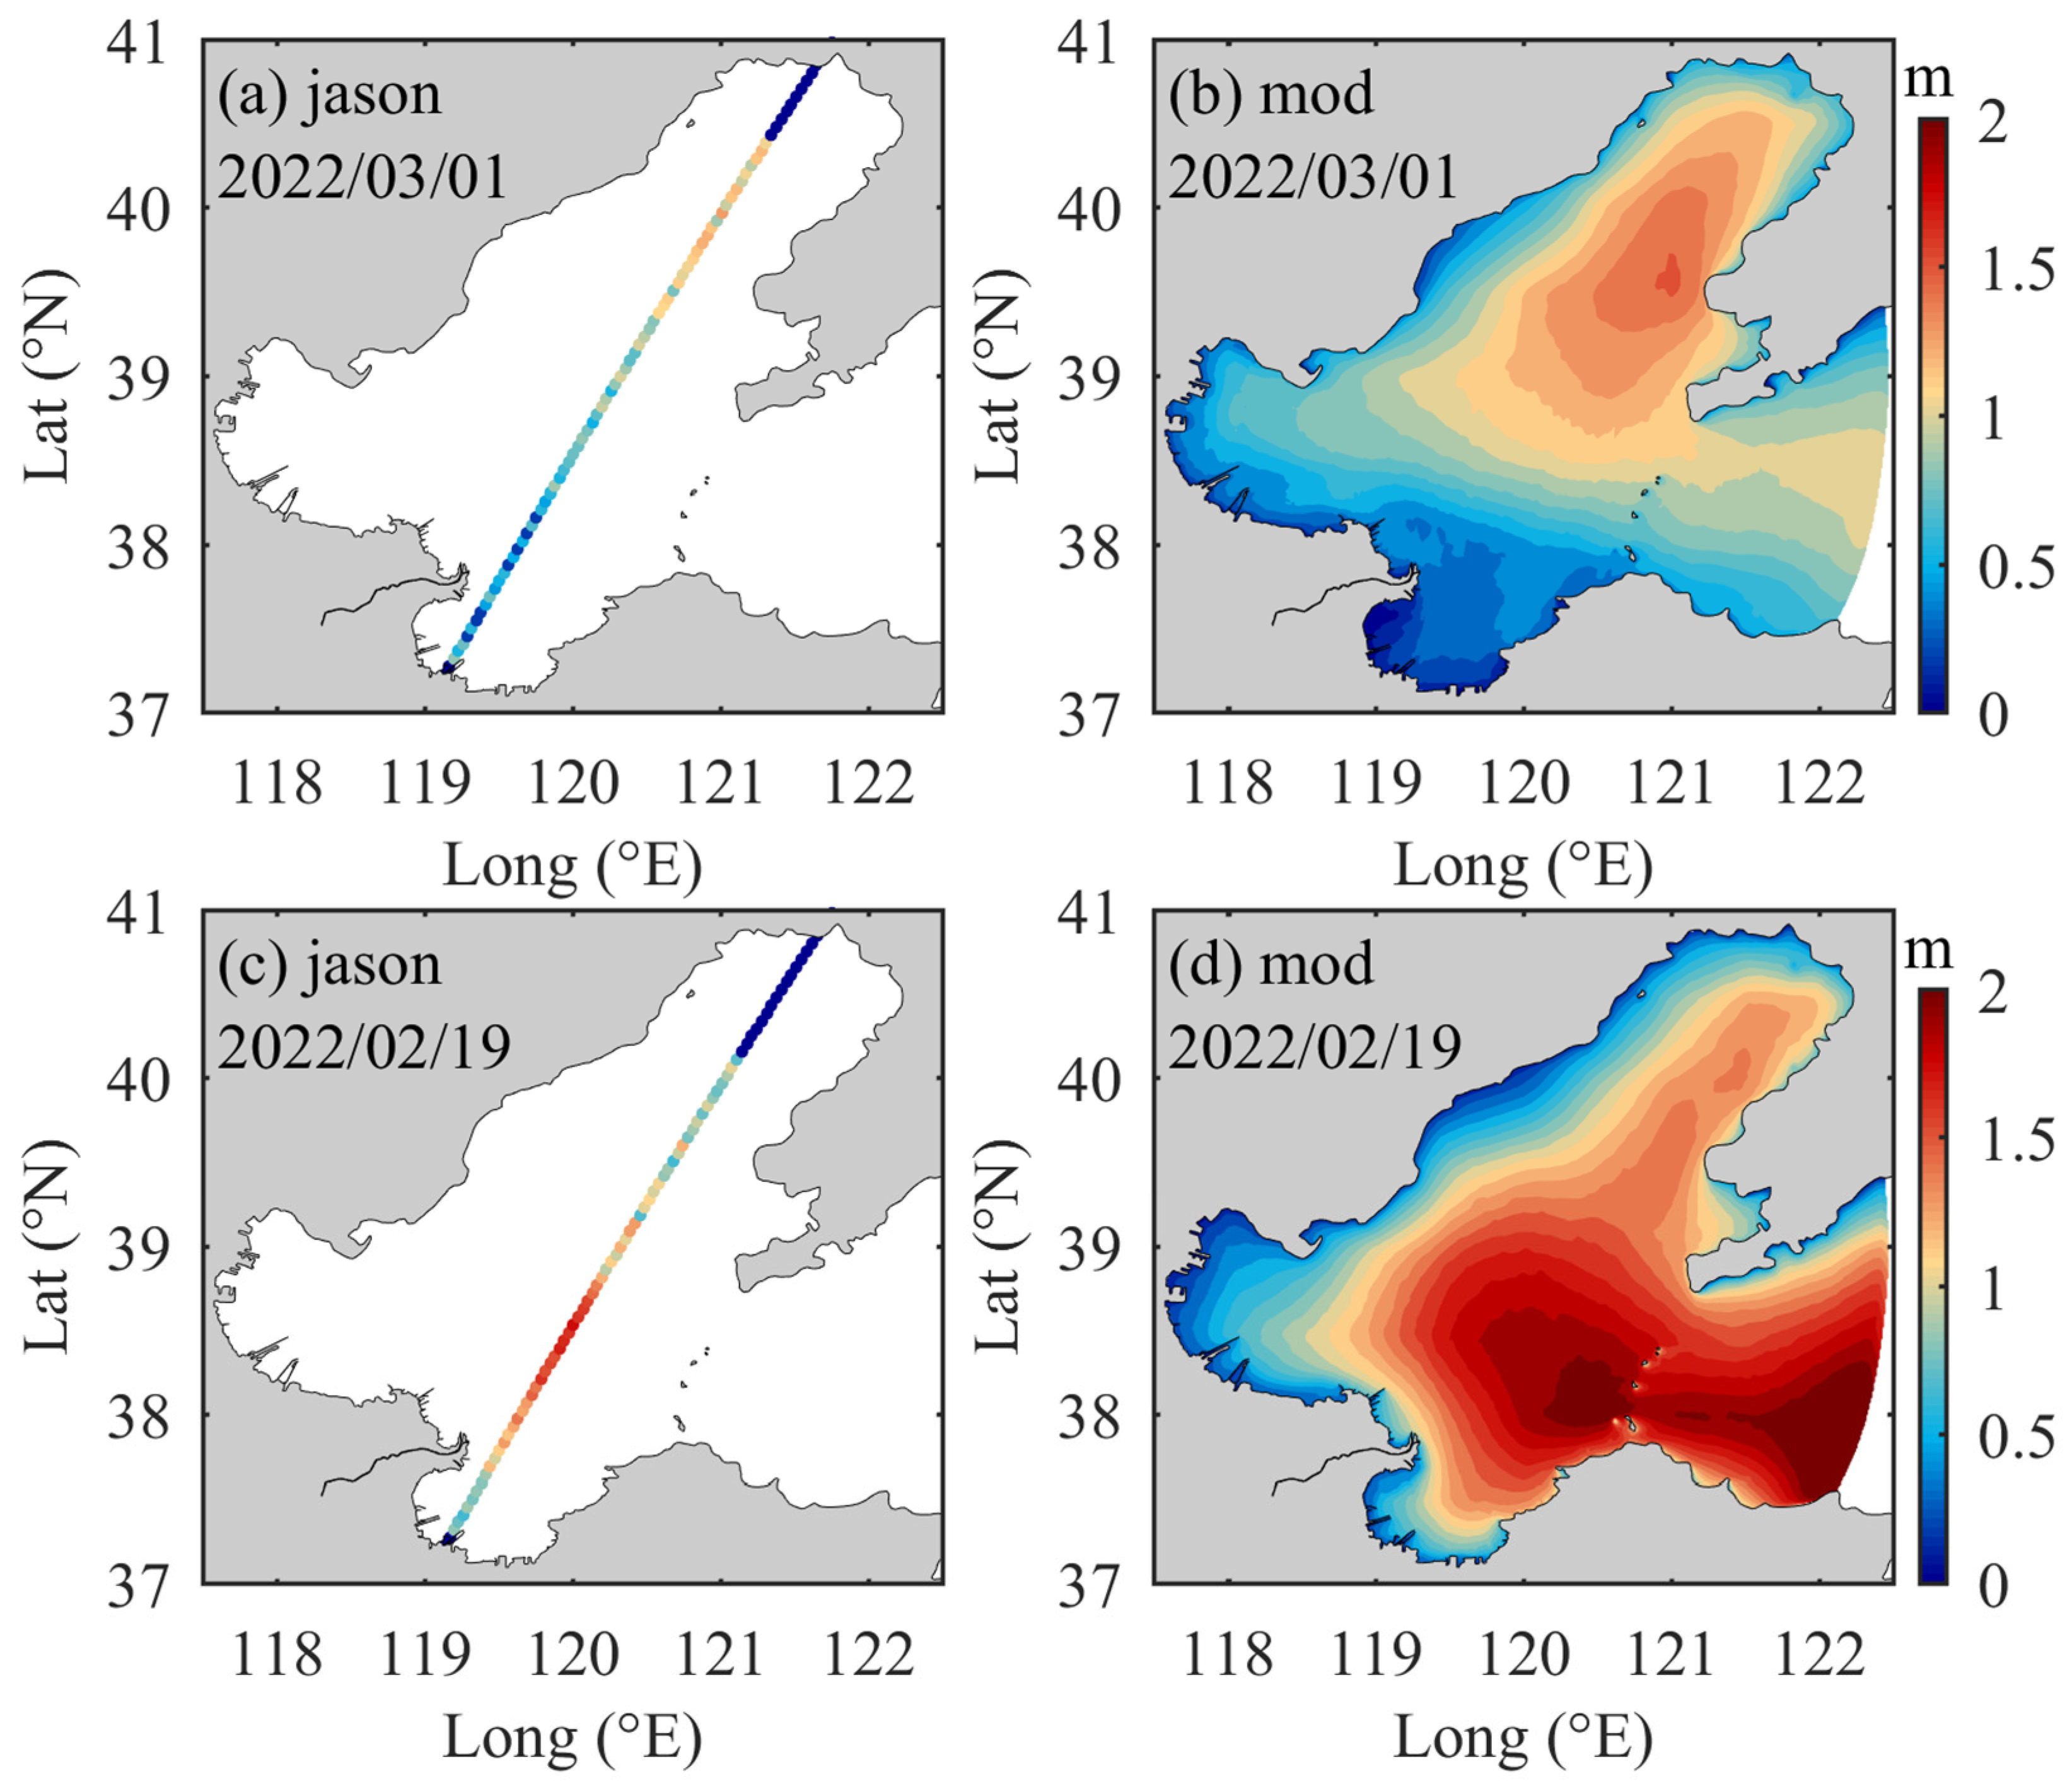
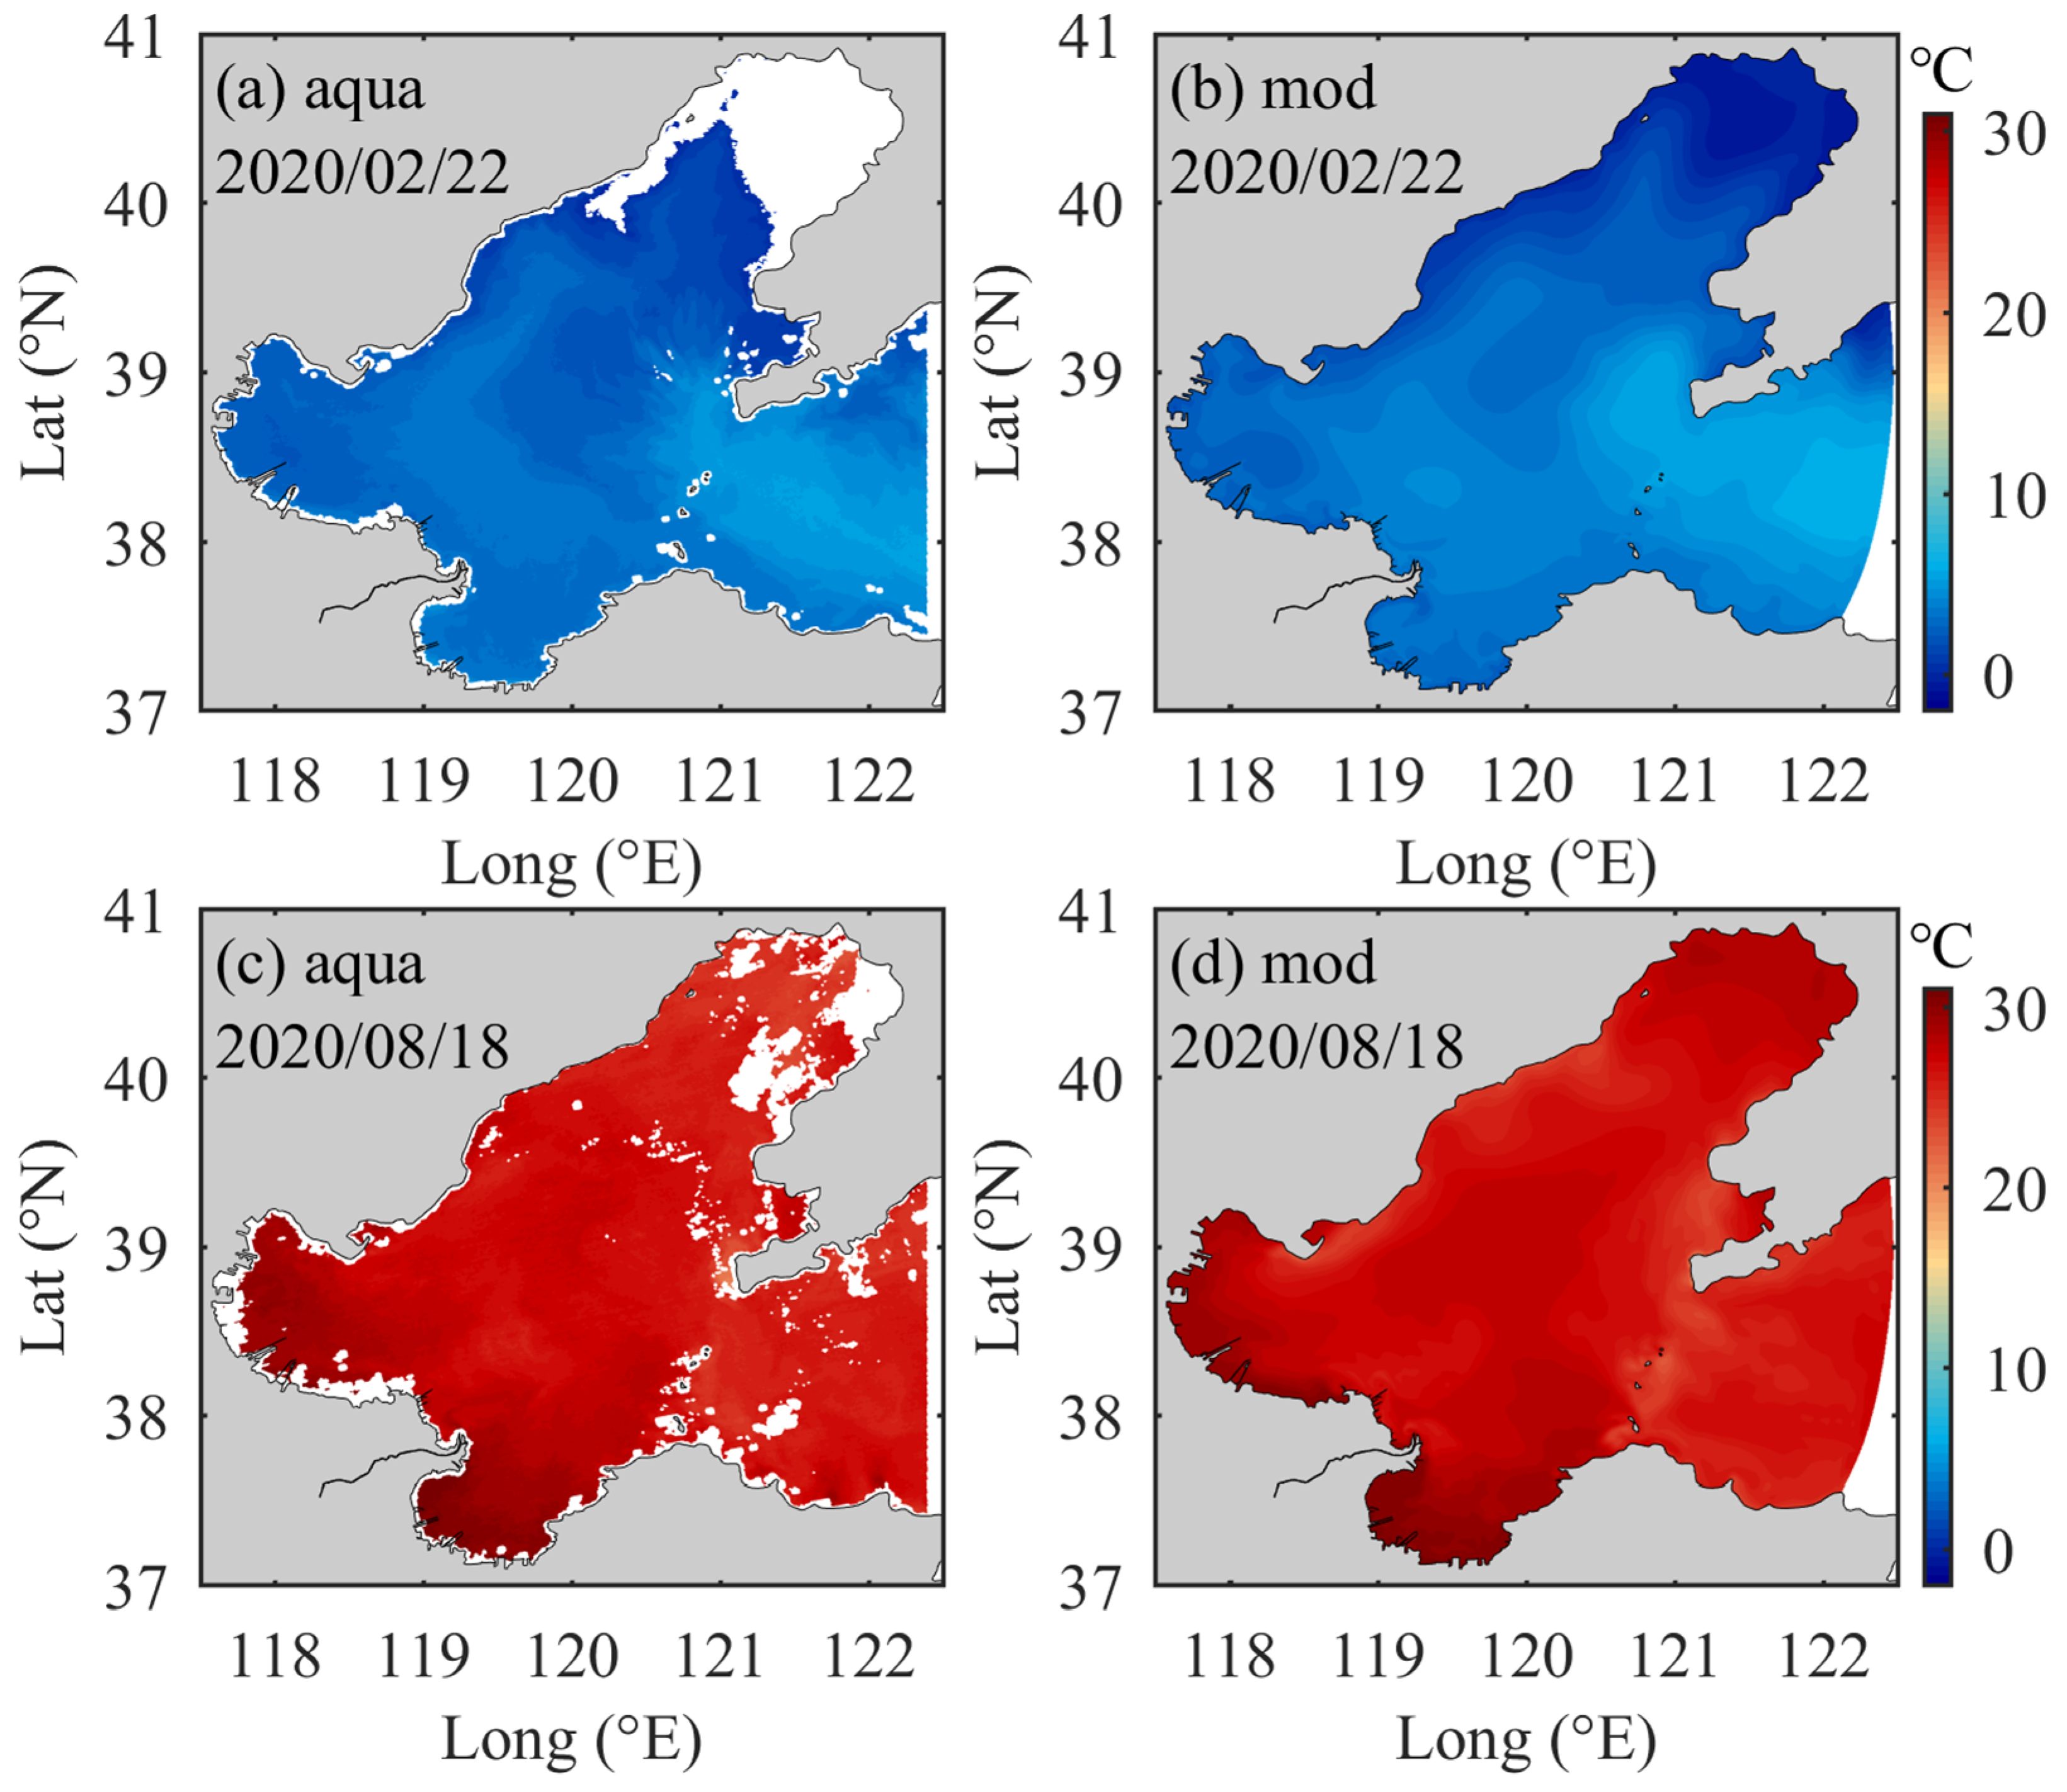
2.3. Model Validation

The validation of the modeled tidal currents and suspended sediments is presented in Figure 3, which demonstrates that the simulation results accurately reflect the variations in tidal currents and SSC due to tidal fluctuations. The simulation outcomes for both currents and sediments showed a high degree of agreement with the measured results in terms of magnitude and phase. The accuracy of the simulation was assessed using the correlation coefficient (R2), root-mean-square error (RMSE), and skill score (SS). The magnitude and phase of the currents closely matched the three observed datasets, with R2 values exceeding 0.84, RMSE values below 0.10 m, and SS values greater than 0.45. The validation results for currents were superior to those for sediments (Table 2), with discrepancies potentially arising from the lower spatial resolution of the wind data and the complexity of the seabed sediment types. Nevertheless, the overall simulation accuracy remained acceptable. The wave simulation results, when compared with the Jason satellite data, indicated that the wave model effectively reproduced the characteristics of both normal wind-induced waves (Figure 4a,b) and extreme wind-induced waves (Figure 4c,d). Furthermore, the simulated summer and winter sea surface temperatures (SST) in LB, when compared to MODIS retrieval results, exhibited a comparable spatial distribution and magnitude (Figure 5). Typically, summer temperatures were higher than those in winter, with the southern Bohai Sea displaying a higher SST than the northern region. Notably, during winter, the nearshore SST was found to be greater than that of the offshore areas, while a similar trend was observed in summer, where the nearshore SST also exceeded that of the offshore regions. The three-dimensional coupled hydrodynamics-sediment numerical model developed in this study effectively reproduced the hydrodynamic, hydrological, and sediment dynamic processes in the study area, providing a solid foundation for future research on sediment dynamics in LB.

2.4. Numerical Experiments

The ten-year ERA5 meteorological dataset, covering the period from 2011 to 2020, was averaged to generate climatological data, thereby eliminating extreme weather conditions for two numerical experiments. The coastlines of LB in 2020 and 1990 were utilized in Experiment 1 (Exp1) and Experiment 2 (Exp2), respectively. The remaining boundary conditions, including water depth and meteorological parameters, were kept consistent across both experiments. Hydrodynamic and sediment characteristics, along with wave parameters, were calculated under climatological weather conditions. This methodology facilitated a comprehensive investigation of sediment dynamics, particularly in response to reclamation activities in the LB.
To quantitatively analyze the changes in material transport due to reclamation, water volume and sediment fluxes were calculated based on the model results as follows:
F w = 1 T 0 T h ζ v d z d t F S = 1 T 0 T h ζ v c d z d t
Fw and Fs are the water volume and sediment flux (m3/s and kg/s), respectively, T is the statistical time (s), h is the local water depth (m), ζ is the water level (m), v is the current velocity (m/s), and c is the SSC (kg/m3).

2.5. Calculation of Sediment Term

Sediment particles undergo suspension, transport, and settling processes in response to changes in hydrodynamics. To identify the primary driving processes causing changes in SSC in the three-dimensional sediment transport equation, depth-integrated erosion, deposition, and advection terms over a time period were calculated as follows:
A d v = 0 T h ζ u x c + v y c d z d t
E r o = 0 T m 1 p τ b τ c e τ c e d t ,     τ b τ c e 0 ,     τ b < τ c e
D e p = 0 T c b w b τ c e τ b τ c e d t ,     τ b τ c e 0 ,     τ b > τ c e
Adv, Ero, and Dep represent the advection, erosion, and deposition terms (kg/m2), respectively. t is the time (s), h is the depth (m), ζ is the water level (m), c is the SSC (kg/m3), cb is the near-bottom SSC (kg/m3). u and v are the east and west component velocities (m/s), respectively, m is the erosion rate (kg/m2/s), p is the porosity of the sediment, τb and τce are the bottom shear stress and critical shear stress (N/m2), respectively, and wb is the bottom sediment settling velocity (m/s).

3. Results

3.1. Hydrodynamic Characteristics Change

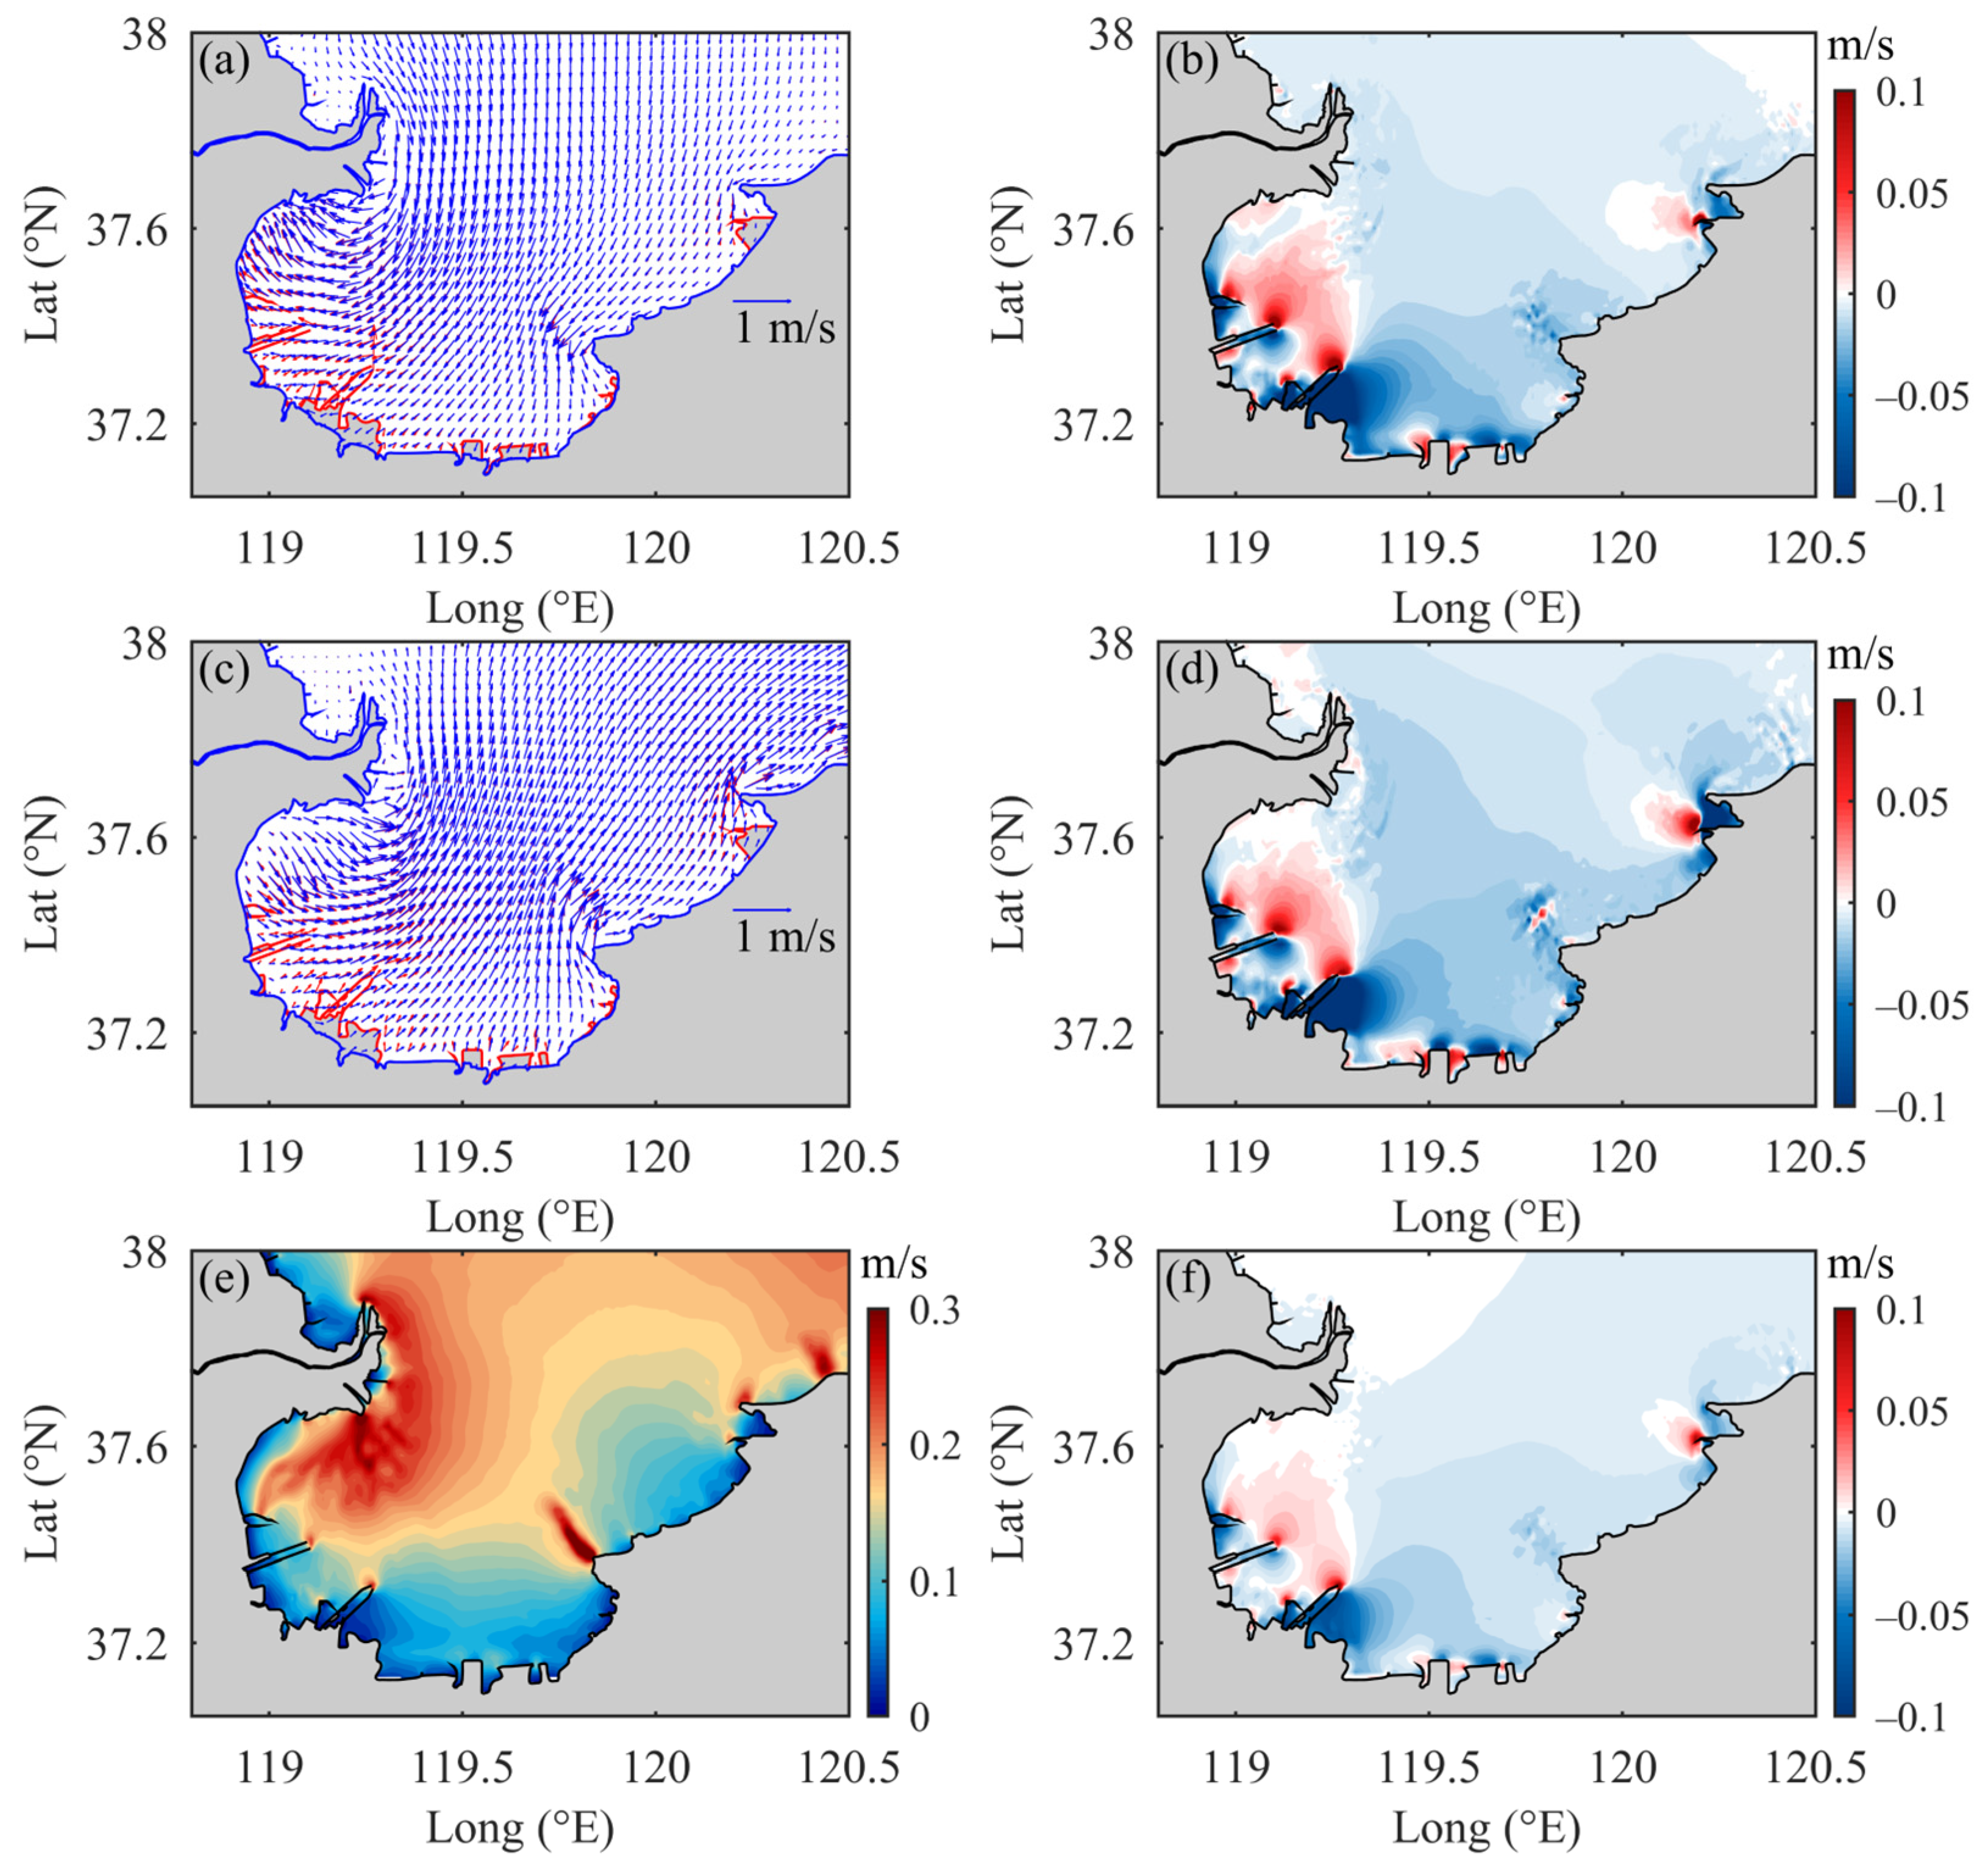
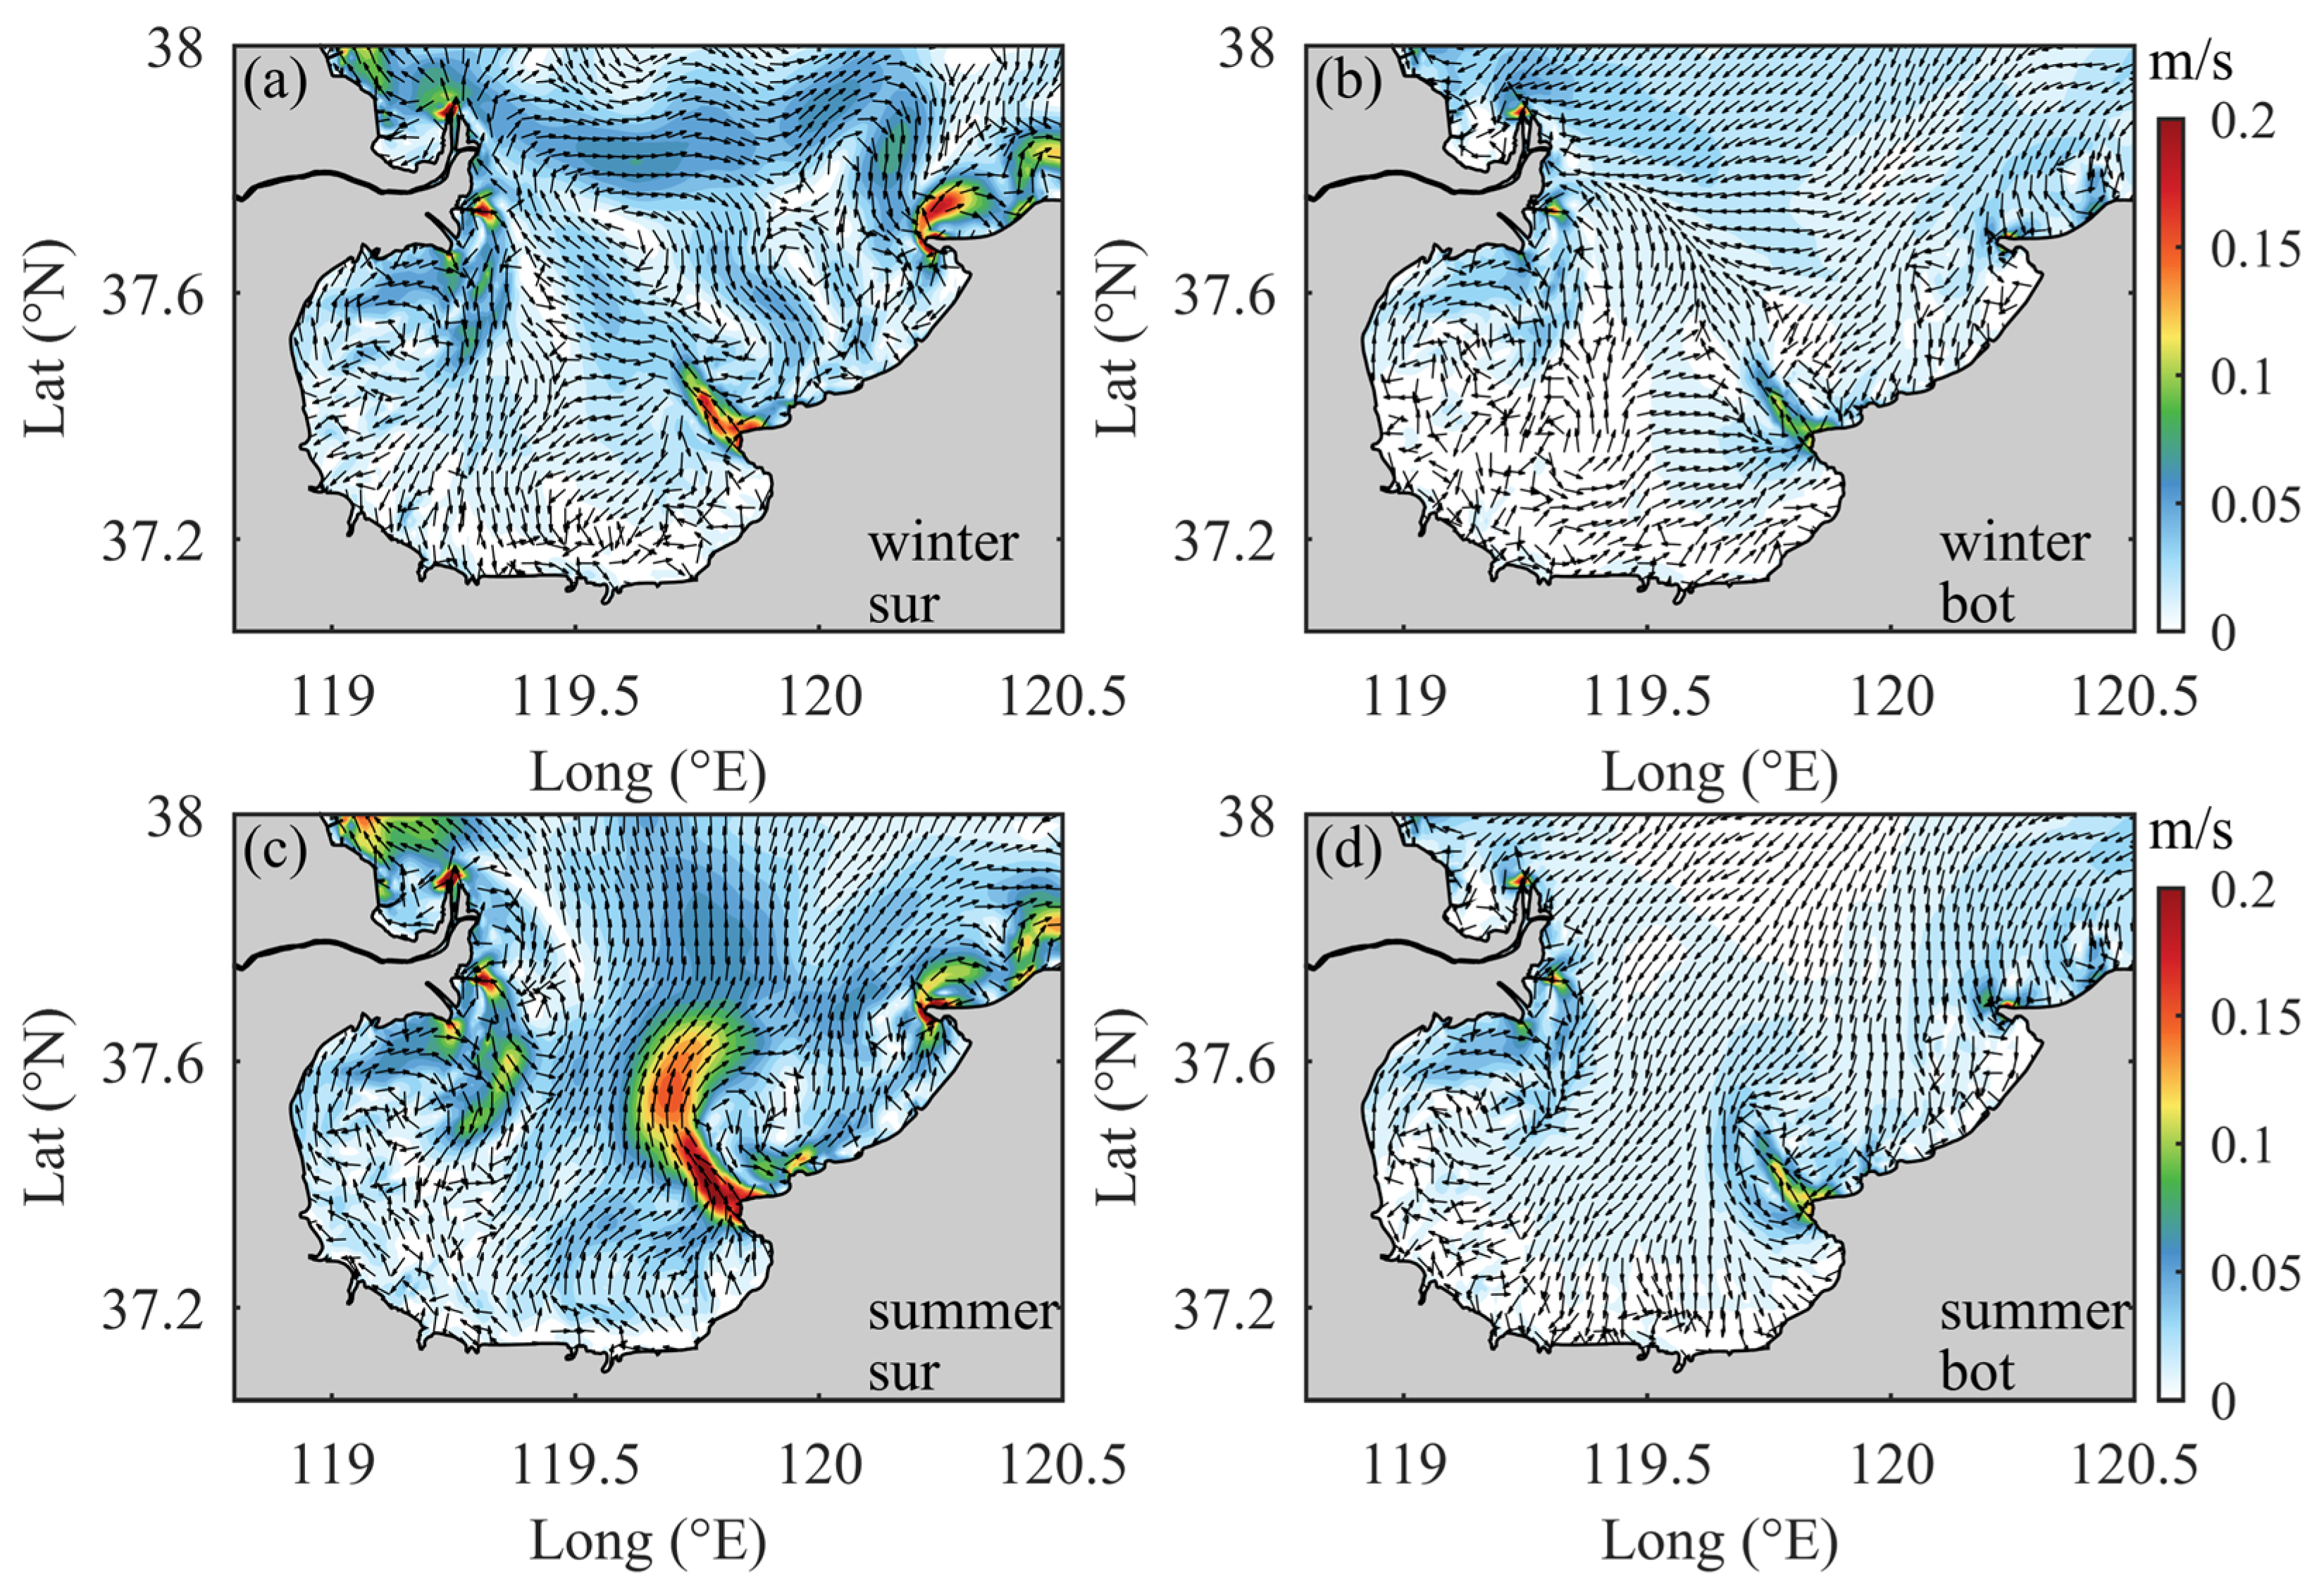
3.1.1. Tidal Current

Tidal currents, a significant component of oceanic currents, play a crucial role in the resuspension and transport of seabed sediments. Therefore, understanding the alterations in tidal dynamics is essential prior to examining sediment transport influenced by land reclamation activities. Generally, tidal currents were stronger near the Yellow River Estuary (YRE), ranging from 0.2 to 0.3 m/s (marked in Figure 1a), around the Diaolong mouth and Longkou to the east (exceeding 0.3 m/s, marked in Figure 1b) and in the northern regions of the bay (ranging from 0.1 to 0.2 m/s), while they were relatively weaker near southern LB (Figure 6e). Following reclamation, tidal resuspension in most areas of LB decreased, with the most significant reduction occurring along the southeastern coast of the dike outside Weifang Port (marked in Figure 1b), where the decline exceeded 0.1 m/s. In contrast, the western and eastern parts of LB exhibited increased tidal currents, particularly in the southwestern regions adjacent to the dikes and the eastern section of the artificial island near Longkou, where the velocity at the end of the dikes increased by over 0.1 m/s (Figure 6b,d,f). The overall direction of tidal currents experienced a slight shift, exhibiting a clockwise deviation of 5 to 30° in the western areas (Figure 6a,c). The regions characterized by significant changes in tidal dynamics were closely associated with artificial structures related to land reclamation, predominantly marked by enhanced current velocities seaward and reduced velocities landward.

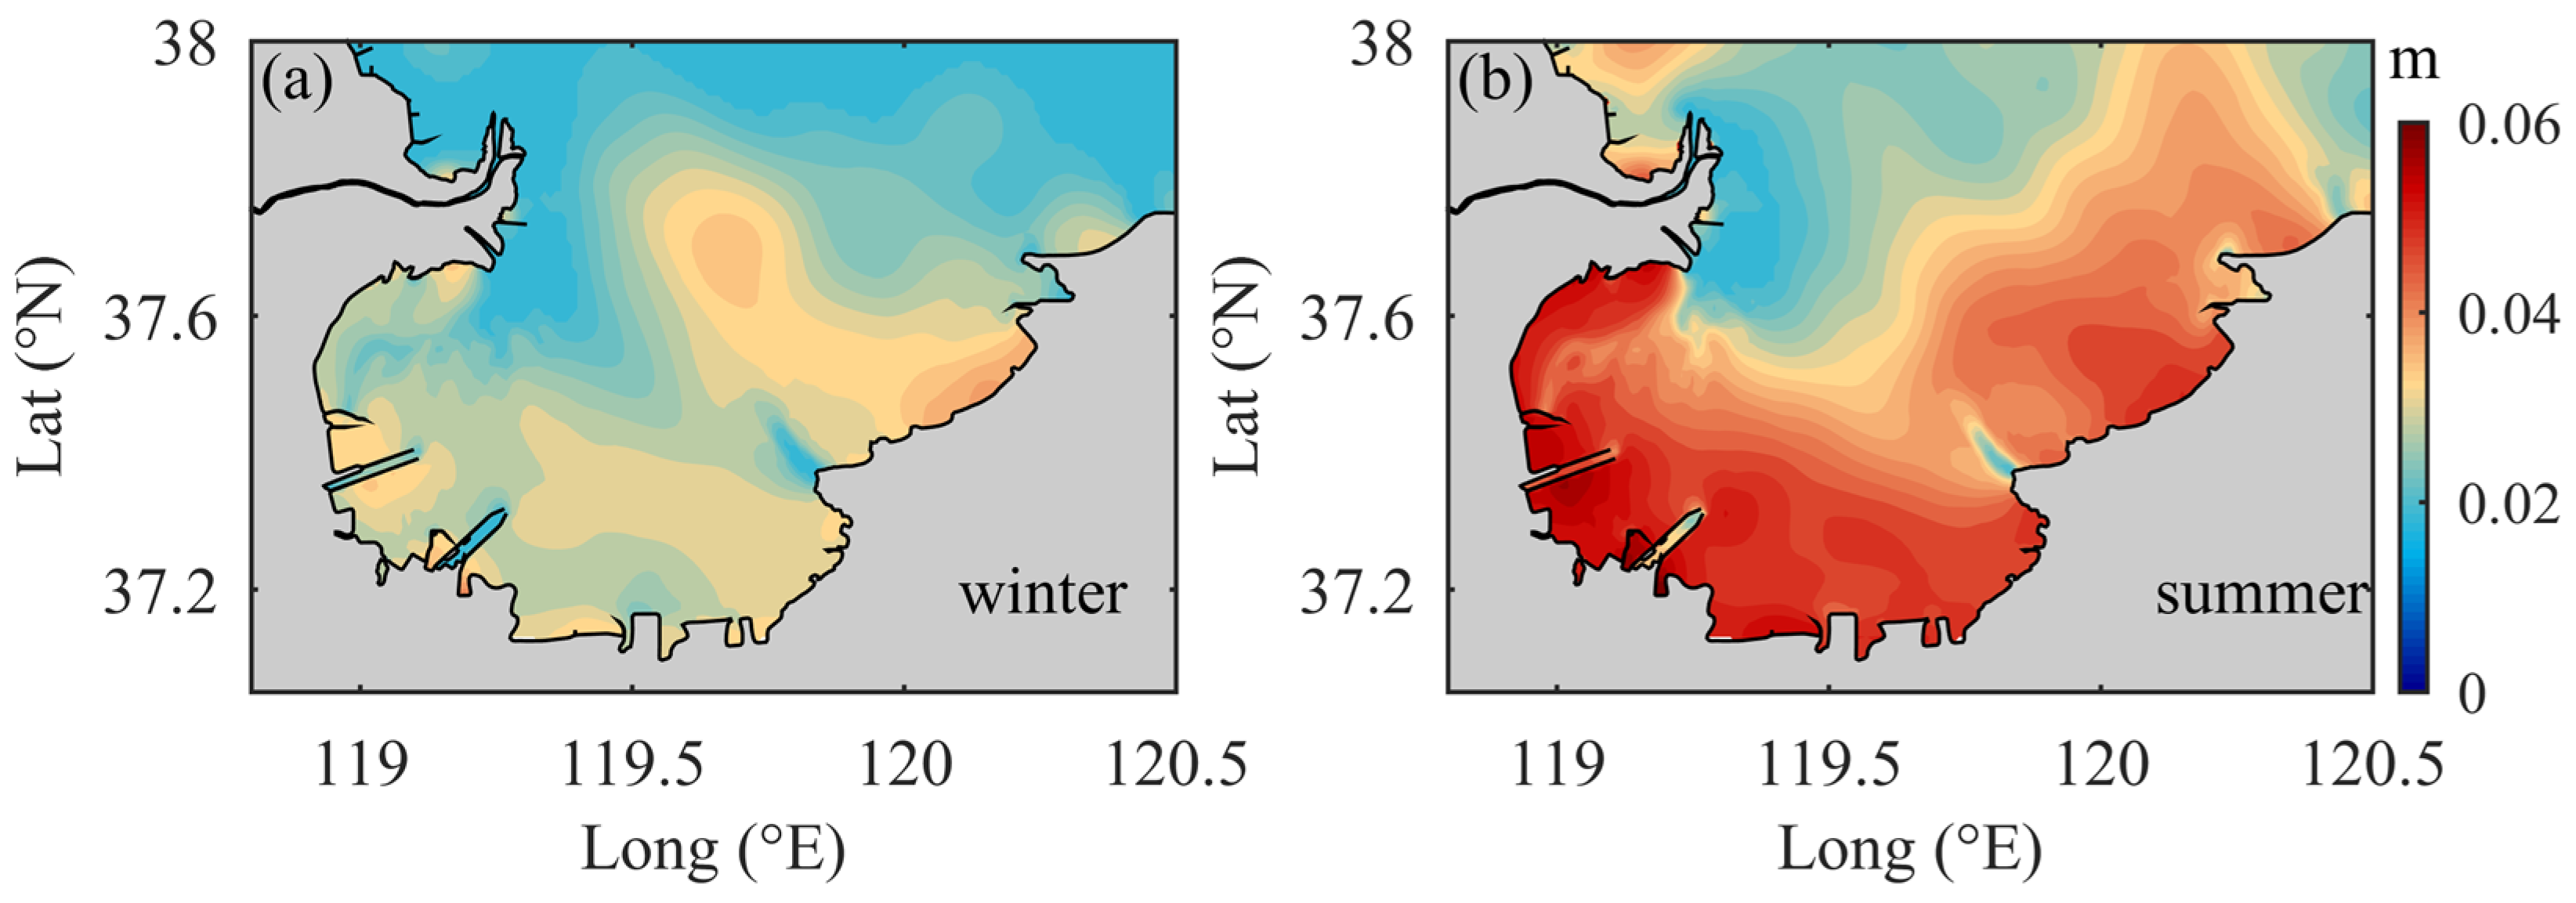
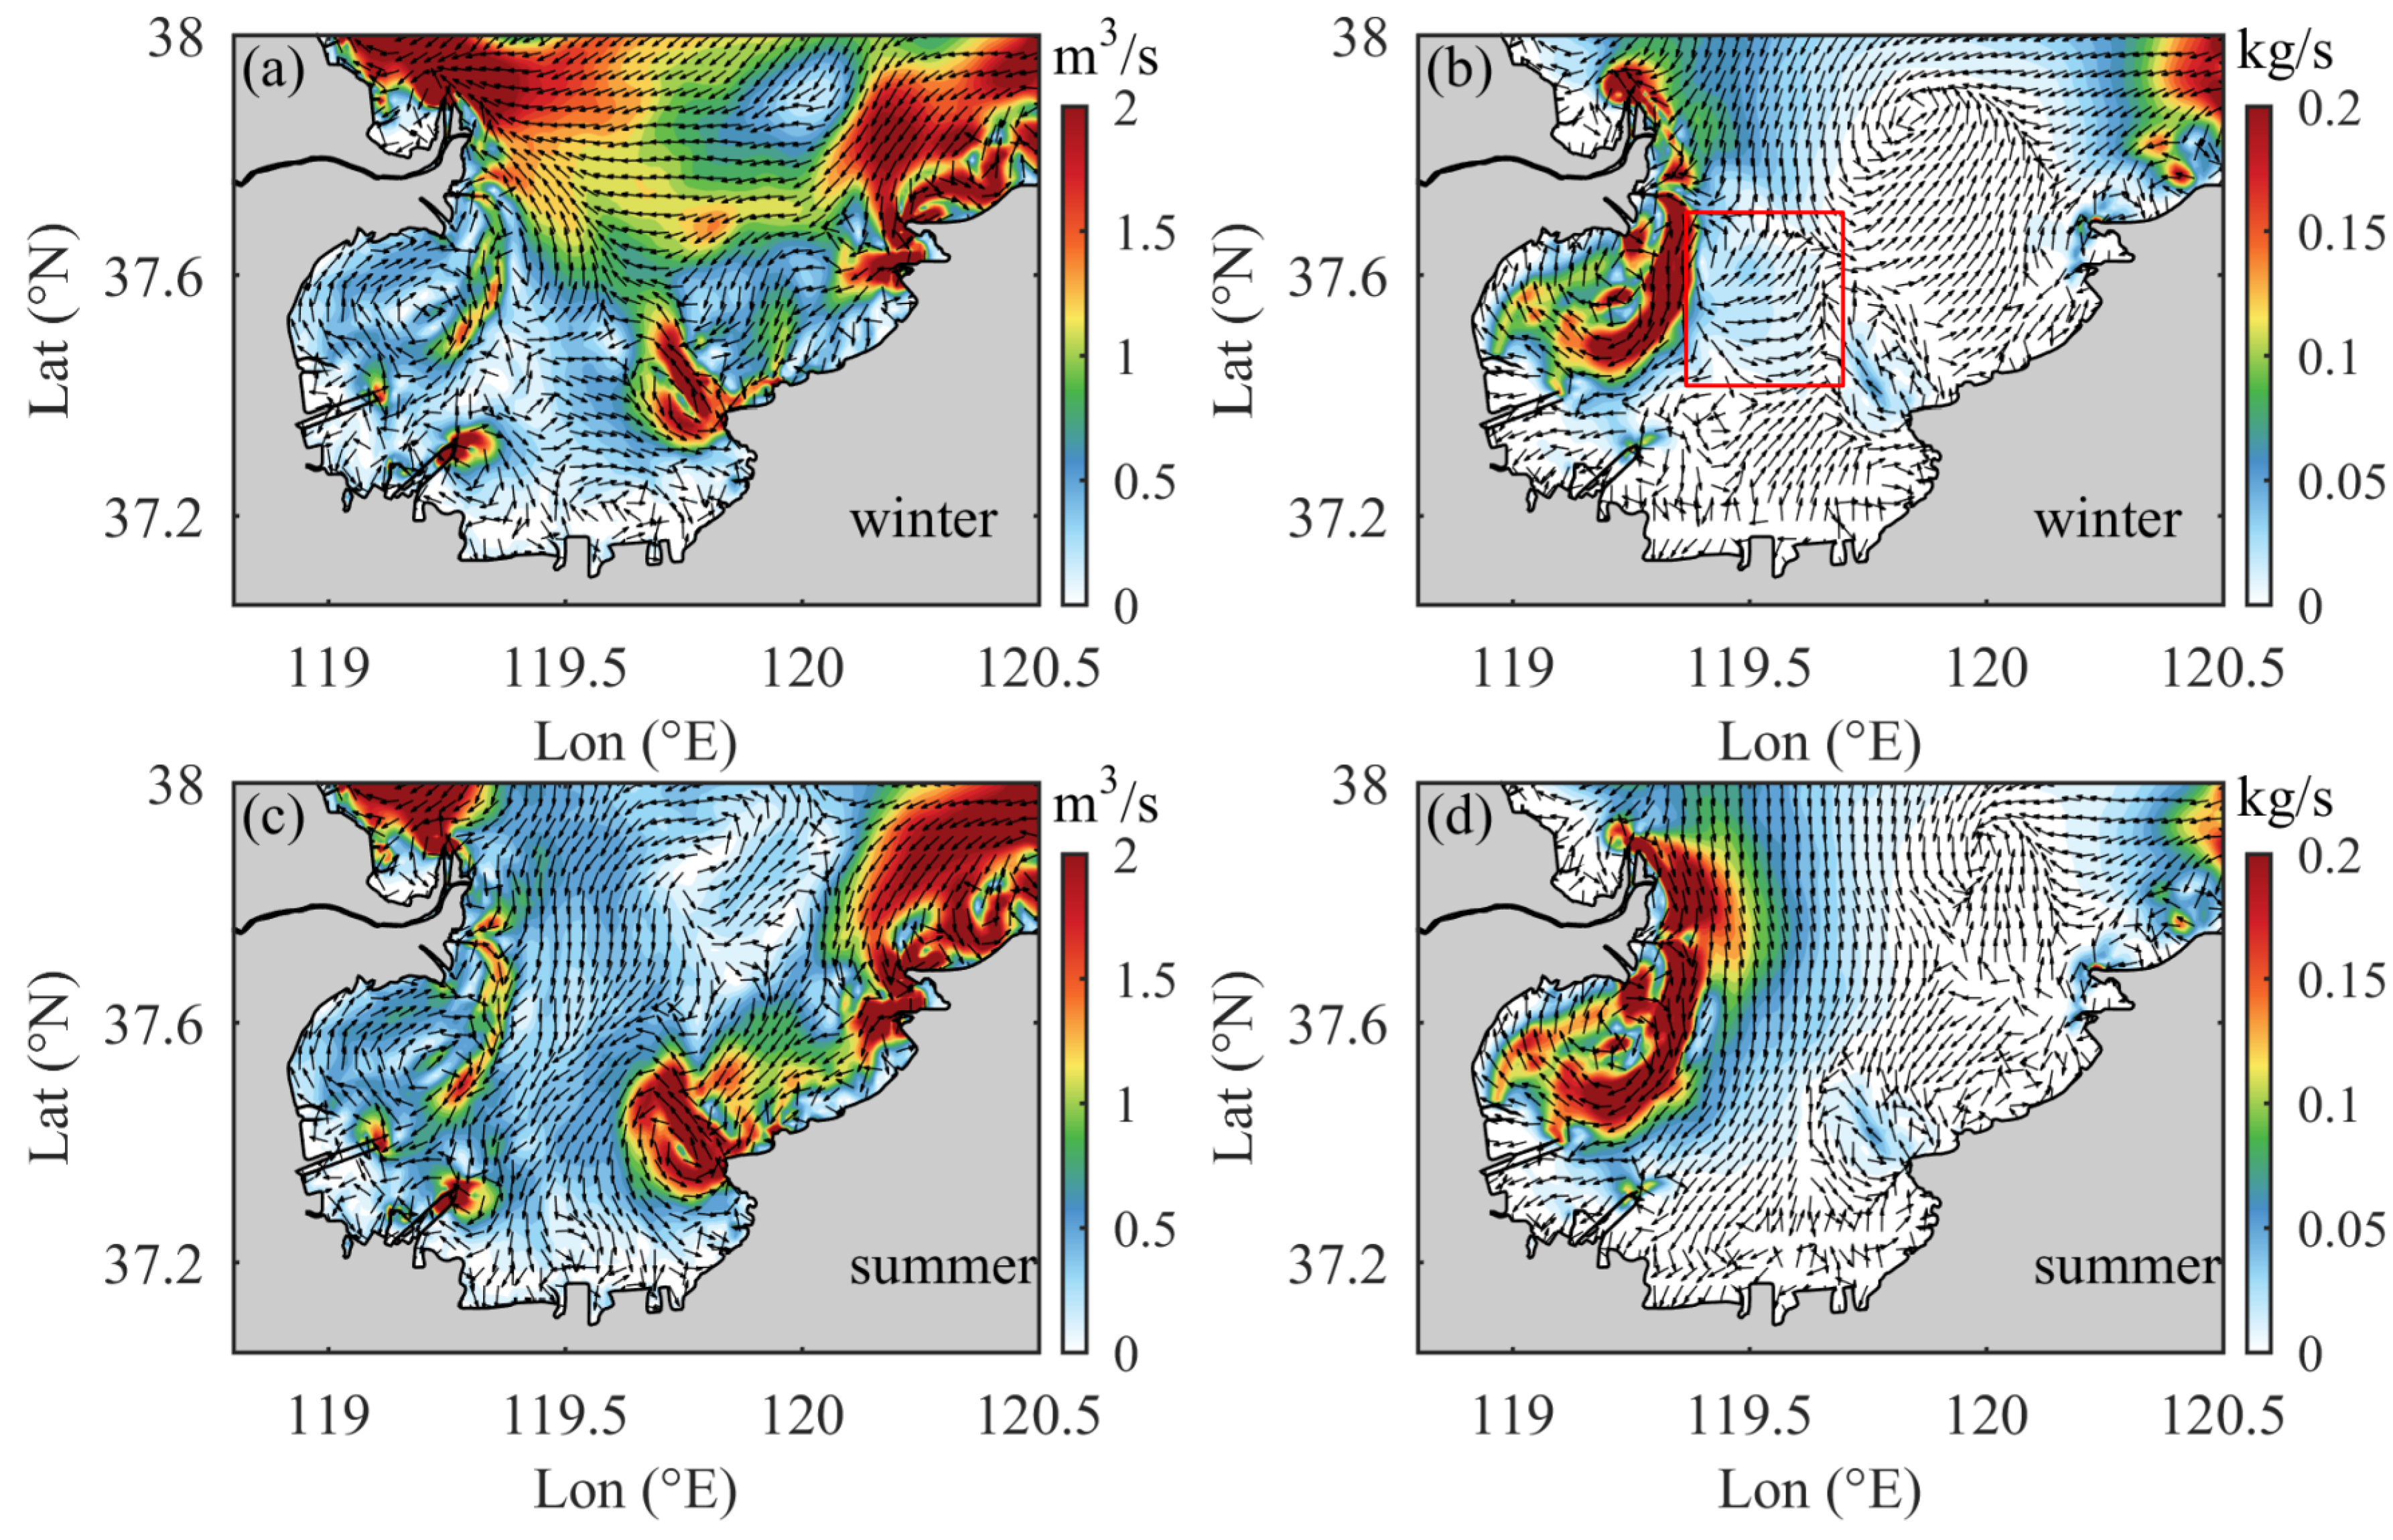
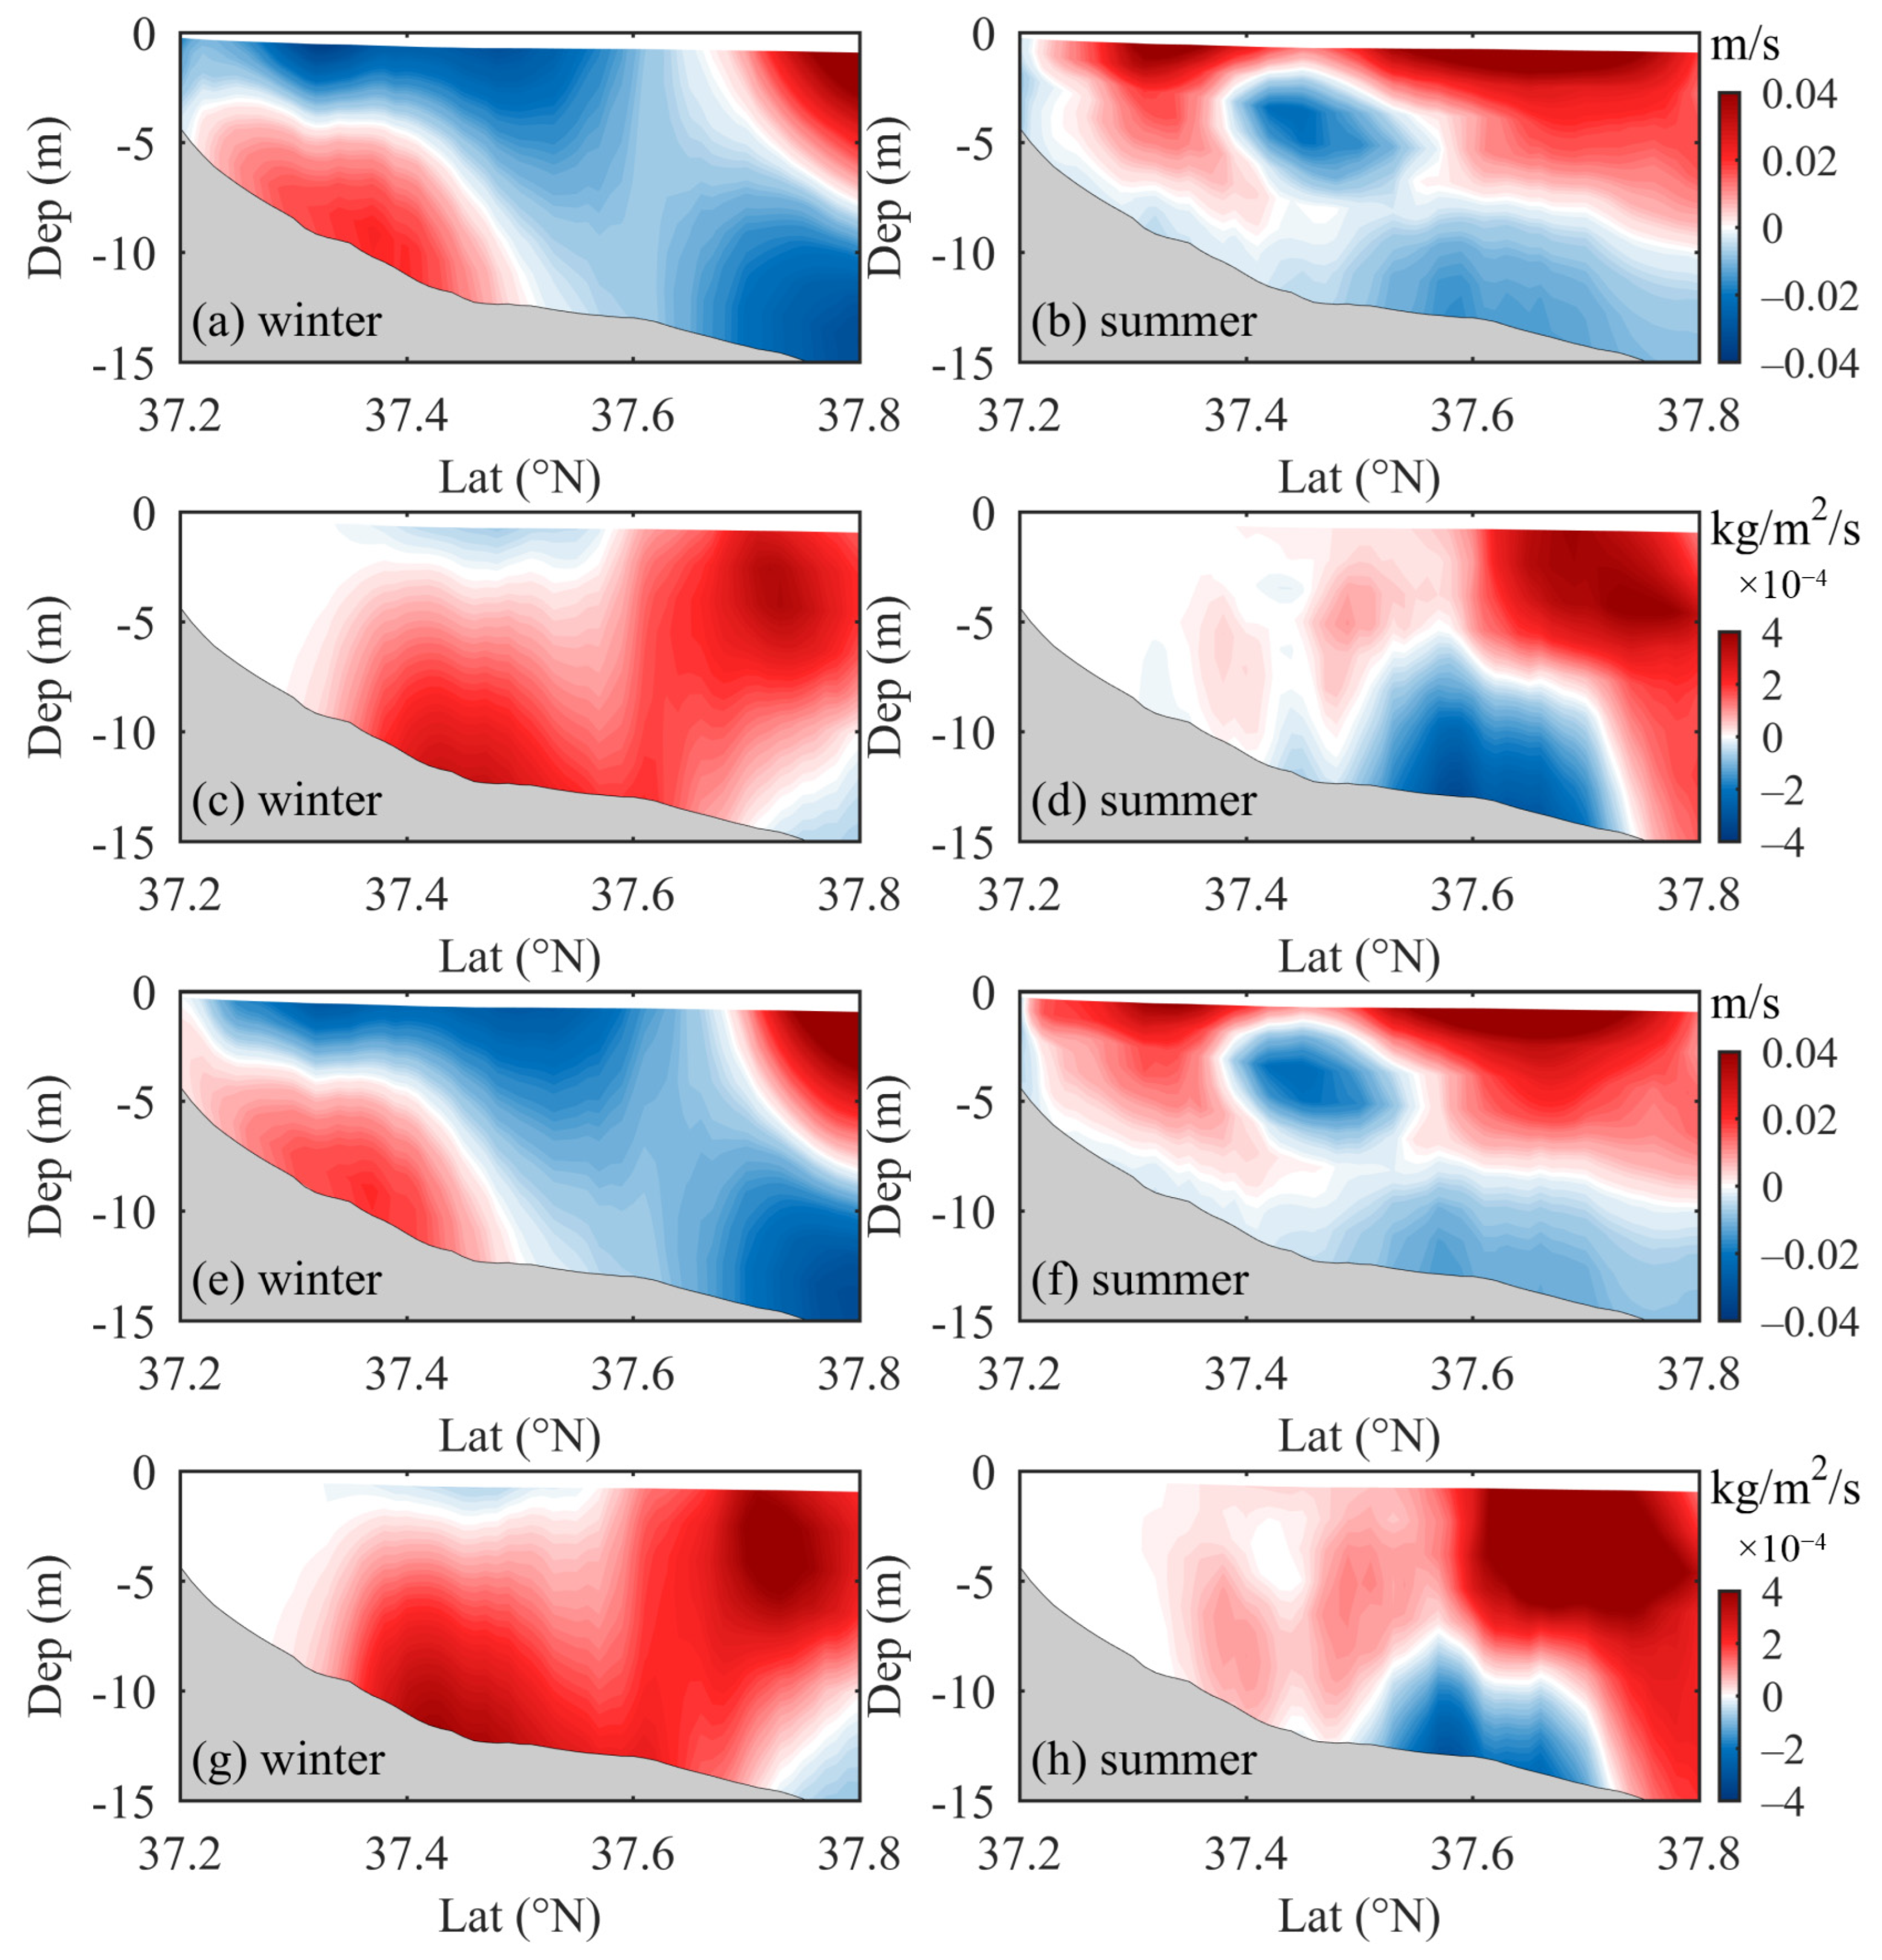
3.1.2. Subtidal Current

Fluctuations in tidal currents can significantly impact the resuspension and transport of seabed sediment, with subtidal currents serving as a crucial factor in this process. Our observations indicated that areas with high subtidal current velocities are predominantly located on the southeastern side of YRE, at the terminus of the dikes near southwestern LB, and in the eastern regions surrounding Diaolong mouth and Longkou. In LB, subtidal currents were stronger at the surface than at the bottom, exhibiting contrasting flow directions between these layers. A stable anticyclonic eddy has been identified in western LB (Figure 7a). During winter, the primary subtidal currents in the surface layer of LB flowed in an anticyclonic manner (Figure 7a), with water in the northern regions predominantly moving eastward, while the southern regions experienced westward flow; the opposite direction was observed in the bottom layer (Figure 7a,b). In contrast, during summer, the dominant current direction in both the surface and bottom layers shifted from southwest to northeast (Figure 7c,d). Overall, subtidal currents in LB exhibited distinct seasonal patterns, with both the winter and summer periods characterized by stratified structures and opposing current directions at the surface and bottom. Similar phenomena have been documented in simulations of summer circulations within the Bohai Sea, as noted in previous research [24,44,45], where factors such as winds, tides, and density gradients are recognized as influential driving forces. Despite enhanced vertical mixing in winter, a notable vertical shear persisted, suggesting that the compensatory characteristics of bottom water, driven by surface wind-induced currents, may account for this phenomenon. Figure 8 illustrated the current pattern of LB prior to reclamation. Overall, the alterations in the structure of subtidal currents before and after reclamation were relatively minor across most regions of LB. However, a significant change in current directions and an increase in current strength were observed near the ends of the dikes in southwestern LB, attributed to the redirection effect of the dikes.
This study combines simulated sea surface height (SSH) data to analyze the formation mechanisms of subtidal currents in LB. Generally, the SSH in the southern region of LB was higher than that in the northern region. In winter, northwest winds drove the accumulation of seawater primarily in the south and east; however, lower water temperatures resulted in reduced SSH in these areas (Figure 9a). In summer, south winds led to a northward accumulation of water to some extent, yet the SSH still exhibited a pattern of high values in the south and low values in the north due to the elevated water temperatures in the southern region (Figure 9b). The observed differences in SSH distribution gave rise to geostrophic currents. Consequently, the subtidal currents in most areas of LB flowed along the contour lines of SSH and exhibited quasi-geostrophic behaviors.

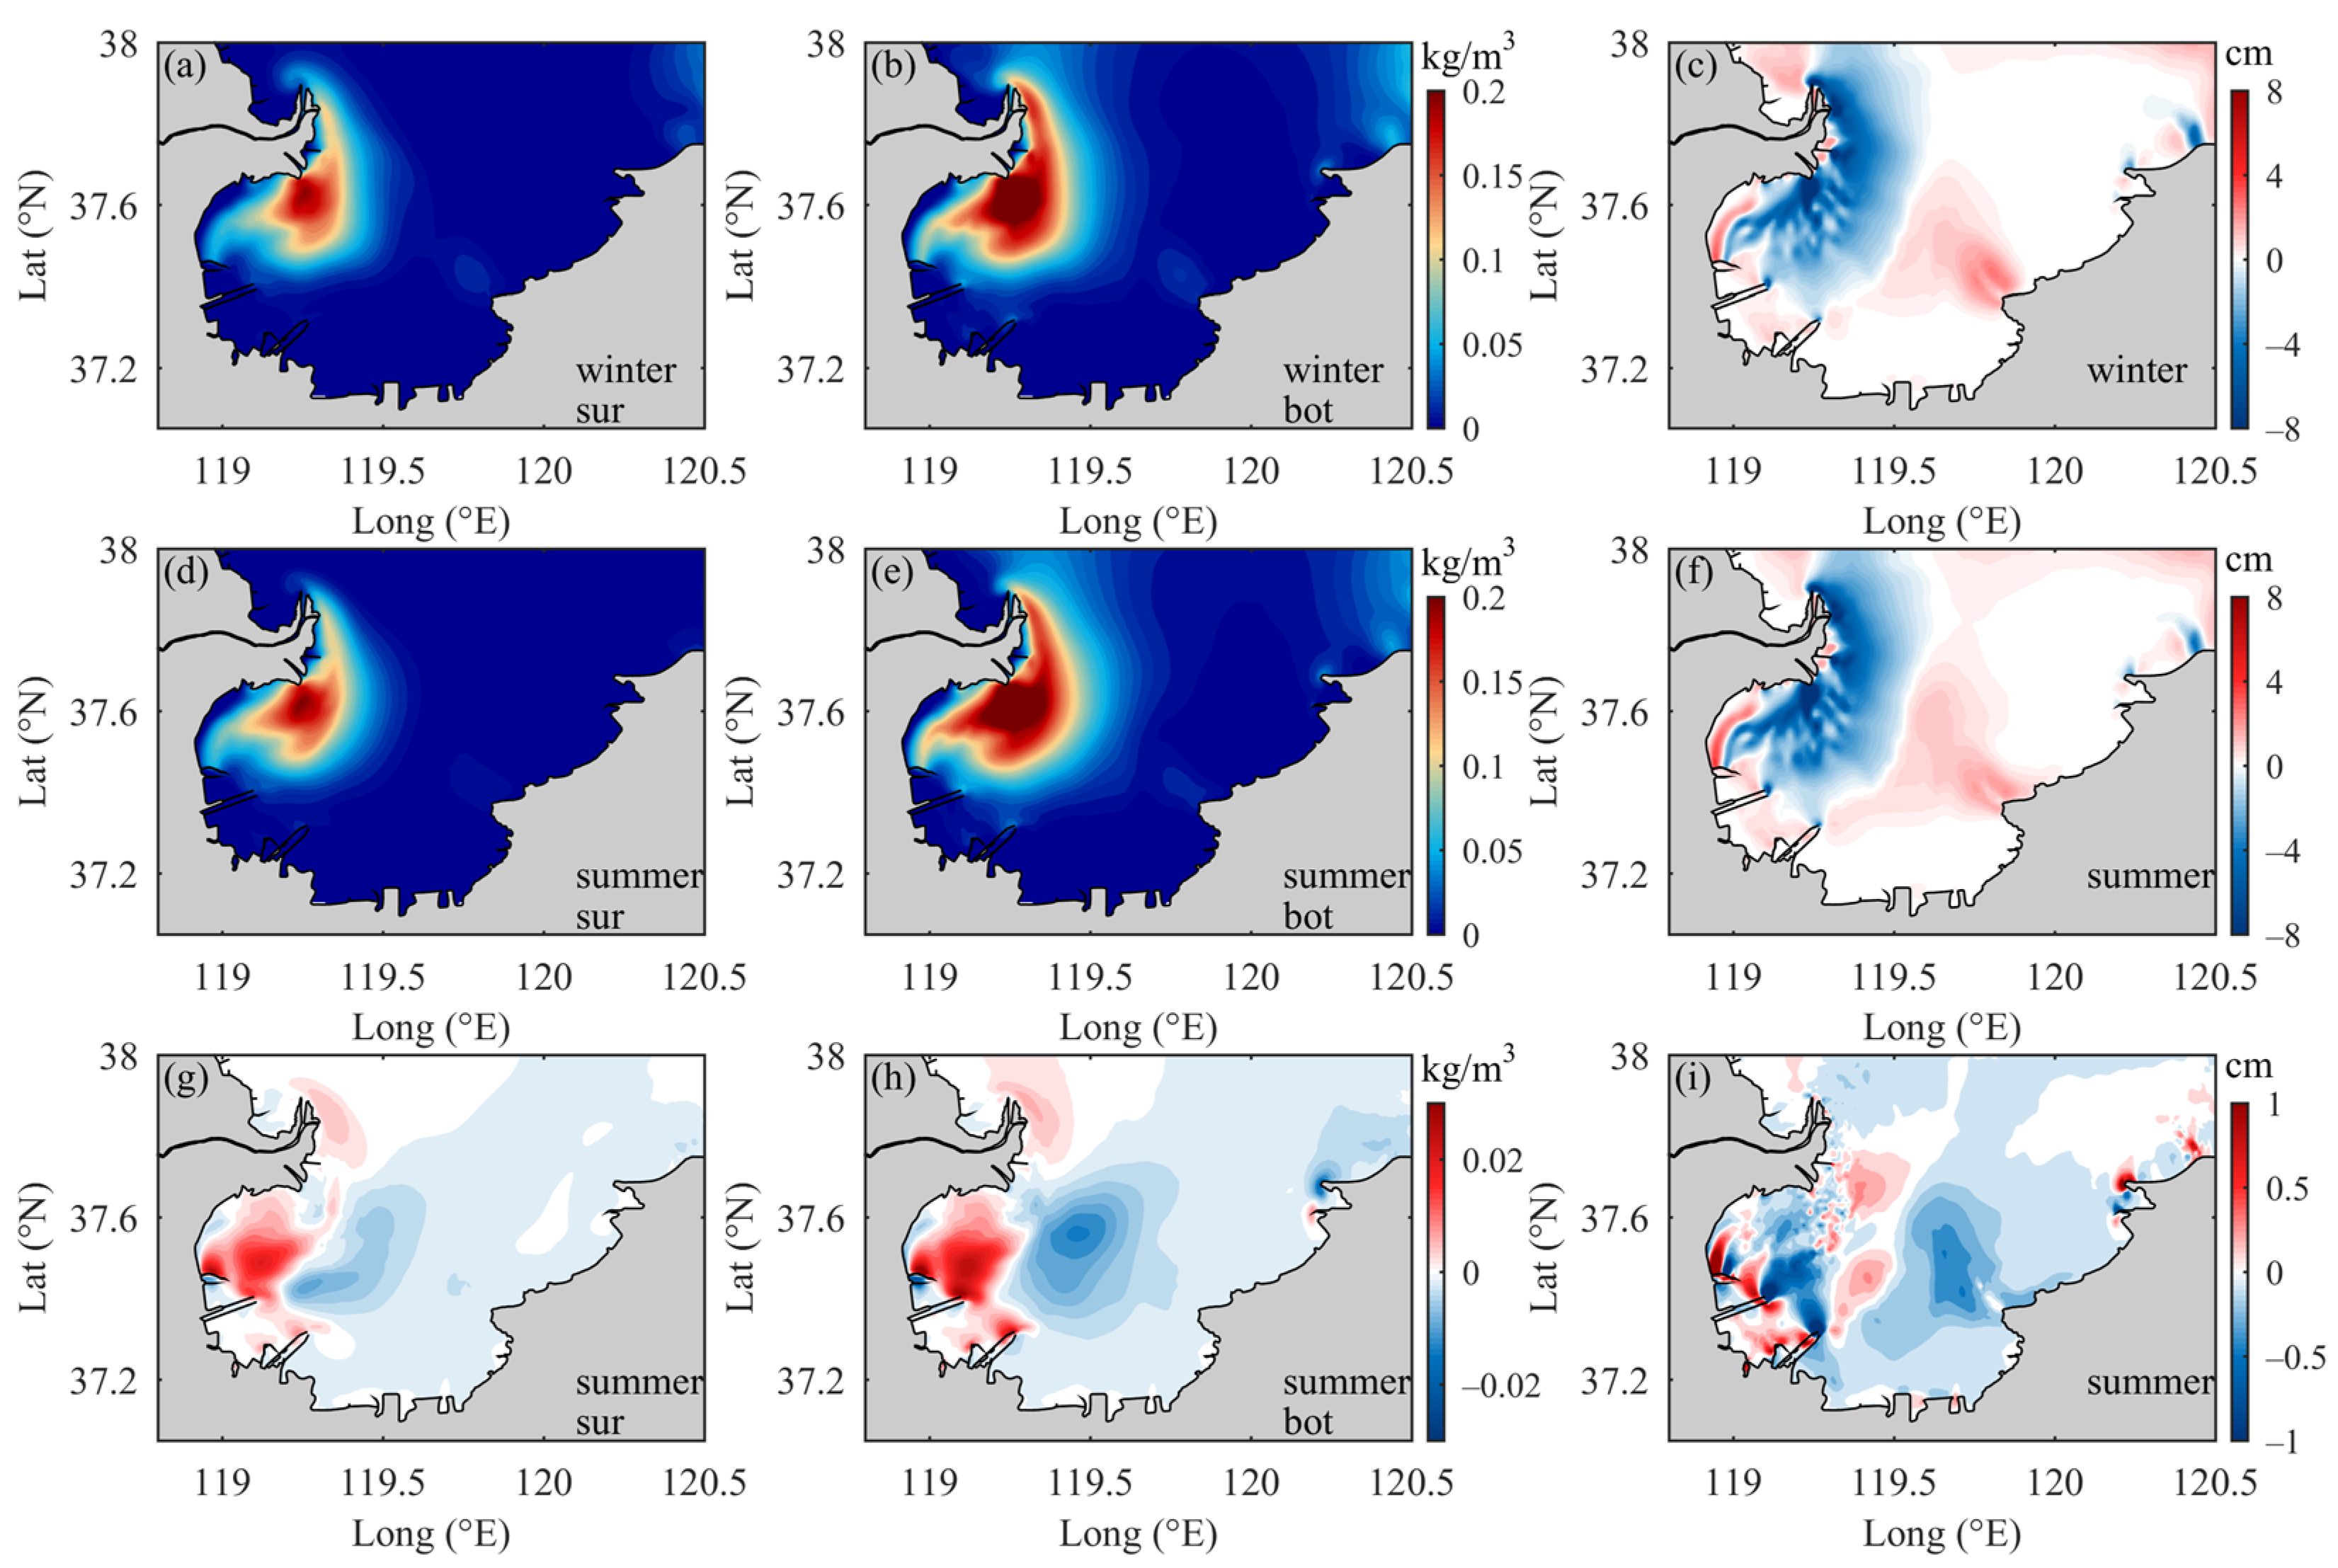
3.2. Responses of Suspended Sediment and Bed Thickness

Winter storms and strong winds play a significant role in the resuspension of seabed sediments and the enhancement of SSC in the Bohai Sea [46,47,48,49]. Numerical experiments utilized climatological wind fields without accounting for storm wave-induced resuspension, resulting in a lack of pronounced seasonal variations in SSC. However, clear spatial variations in SSC were observed (Figure 10). SSC was found to be higher at the bottom layer compared to the surface layer, with elevated concentrations near the Yellow River Estuary (YRE) relative to other areas. The peak concentration, exceeding 0.3 kg/m3, was recorded at southern Qingshuigou (as indicated in Figure 1b), primarily due to vigorous tidal currents that promote sediment resuspension in this region (Figure 10e). Although tidal currents were stronger during the Diaolong month (marked in Figure 1b), the seabed sediments in southeastern LB were coarser and more resistant to resuspension [50], leading to lower SSC levels. Corresponding to the SSC distribution, areas of high concentration extending from the YRE region to the dikes in southwestern LB represent the predominant erosion zones within LB, characterized by monthly erosion thicknesses ranging from 2 to 7 cm. In contrast, deposition was observed along the western coast of LB and in the eastern regions, with the western coast exhibiting deposition thicknesses of 1 to 3 cm (Figure 10c,f).
Given the minor seasonal variations in SSC and changes in seabed thickness under climatological conditions, summer simulation results were selected for comparing scenarios before and after reclamation. Following reclamation, SSC increased in the western part of LB, with the most significant increases occurring near the dikes, where the rise exceeded 0.02 kg/m3. Conversely, SSC decreased in other regions, with the most substantial reductions observed in the central area of the bay (Figure 10g,h). As discussed in Section 3.1.1, the primary factor contributing to the increased SSC was attributed to the elevated current velocity, particularly at the ends of the dikes in the western LB. The effects of reclamation on seabed thickness are illustrated in Figure 10i, revealing the most pronounced changes in the southwestern LB, where intensified erosion occurred on the seaward side of the dikes, accompanied by increased deposition on the landward side, paralleling the alterations in tidal current velocity.

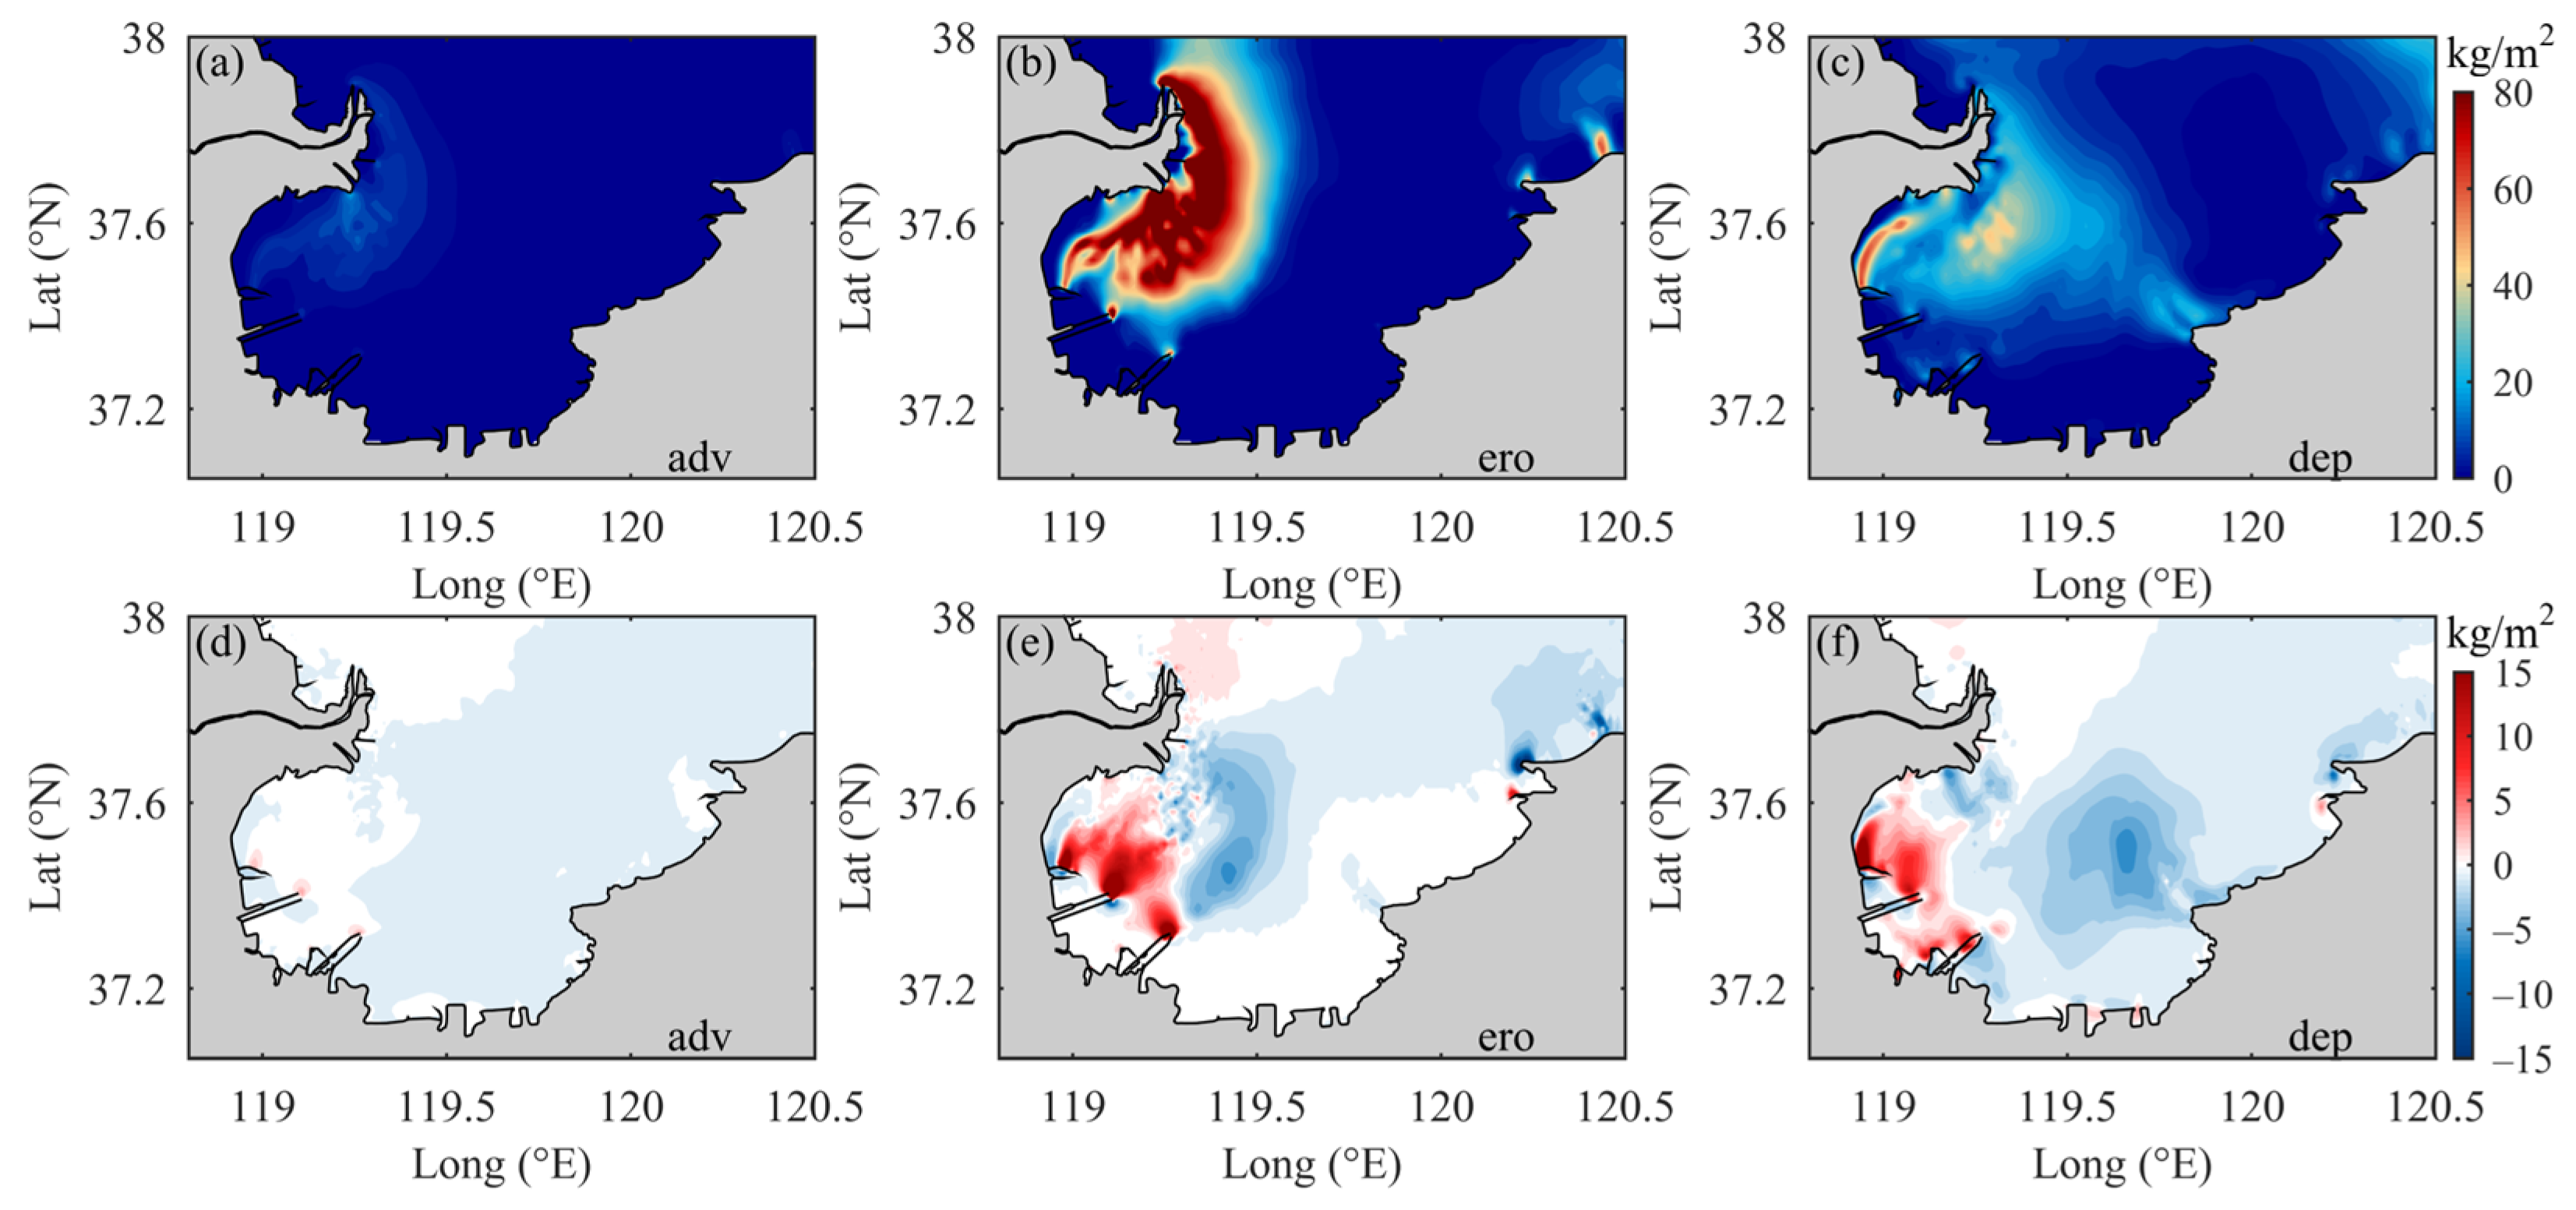
3.3. Sediment Term Analysis

Similar to the comparison with SSC, the results over one month during the summer were averaged for comparisons before and after reclamation. The primary sediment dynamics were driven by erosion and deposition processes in LB, while the advection process was relatively weak (Figure 11a–c). Spatially, the advection and erosion processes occurred near the YRE and the dikes in southwestern LB. In contrast to erosion, the primary areas of deposition were distributed from the western coast of LB to the Diaolong mouth off the eastern coast. Following reclamation, there was an increase in erosion processes, particularly at the ends of the dikes, alongside a decrease in central LB (Figure 11e). Areas experiencing significant changes in deposition processes overlapped with regions of erosion; however, a certain degree of displacement was also observed. In comparison to the erosion and deposition processes, the magnitude of changes in the advection processes was relatively small due to reclamation, primarily evident in an increase at the ends of the dikes and a decrease in other areas (Figure 11d). Considering the analysis results from Section 3.2, the region of change in the erosion processes closely aligned with that of the SSC changes (Figure 10h), further confirming that changes in SSC due to reclamation were primarily driven by alterations in the erosion process, with the deposition process playing a secondary role.

3.4. Volume and Sediment Transport

Significant spatiotemporal variations in volume and sediment transport were observed in LB (Figure 12). In winter, the northern LB predominantly transported water westward, while the southern LB flowed eastward. The volume of water transport in the northern and eastern LB was greater than that in the southern and western parts (Figure 12a). During summer, volume transport primarily occurred from the northeast to the southwest, with the volume in the eastern LB exceeding that in the western part (Figure 12c). Compared to winter, the northern LB exhibited a notably larger volume of water transport during summer. Regions near YRE, Diaolong mouth, and Longkou were characterized by vigorous water transport. The direction of volume transport was mainly influenced by bottom water in most areas of LB (Figure 7b,d). In contrast, the pattern of sediment transport diverged markedly from that of volume transport. The most significant sediment transport was observed near YRE, predominantly following an anticyclonic pattern. Abrupt changes in SSC and current near the southwest LB also led to a distinct shift in sediment transport direction. In winter, sediment transport was primarily eastward in the central and eastern parts of the bay. The direction of volume transport was inconsistent with that of sediment transport in the northern and eastern parts, where water volume transport was westward (Figure 12b). During summer, the direction of sediment transport was mainly from the northeast to the southwest, mirroring the trends in volume transport (Figure 12d). Sediments off Diaolong mouth were transported from southeast to northwest, obstructing material exchange between the two sides.
The difference between volume and sediment transport in LB was more pronounced during winter (Figure 12a,c). In contrast to volume transport, high-concentration sediments in the western LB were more likely to be transported across the bay (Figure 12b). Figure 12b and Figure 13c clearly illustrate that the primary cross-bay transport pathway is located between 37.3 and 37.7° N. The characteristics of material transport across this section indicate that the vertical shear of subtidal currents and sediment transport in summer were stronger than in winter (Figure 13). Prior to reclamation, the cross-bay sediment transport flux in winter was approximately 3.5 times greater than that in summer (Table 3). After reclamation, while the location of the cross-bay transport pathway in winter remained unchanged, the transport flux decreased by about 22.17% due to reductions in tidal current velocity and SSC. Additionally, the trend of eastward transport in summer significantly weakened, with a corresponding strengthening of westward transport in waters shallower than 5 m near 37.6° N (Figure 13d). Overall, reclamation has a detrimental effect on material transport from LB out of the bay.

4. Discussion

4.1. Potential Mechanisms Controlling Sediment Transport

The research findings of this study indicate that reclamation projects in LB significantly impact hydrodynamics and sediment dynamics, leading to alterations in tidal currents, residual currents, and SSC in proximity to the project areas, which in turn affect sediment transport patterns. Tidal currents served as the primary driving force for sediment transport [51,52,53]. Specifically, tidal currents facilitated the resuspension of seabed sediments while also influencing the horizontal transport of suspended sediment. The simulation results revealed that the most substantial changes in tidal currents occurred in the southwestern region of LB, particularly near the dikes of Guangli Port and Weifang Port, where increased current velocity on the seaward side of the dikes was primarily attributed to the jet effect. Conversely, current velocity on both sides of the dikes weakened due to shielding effects (Figure 6f). Notably, the variations in SSC near the dikes did not entirely correspond with the changes in tidal currents. In the coastal areas southwest of LB, a decrease in current velocity was evident; however, no significant reduction in SSC was observed in these regions. Given the composition of seabed sediments (Figure 2), it is speculated that this discrepancy may arise from the predominance of coarse-grained sediments along the southwest coast of LB, which are less susceptible to stirring. This coarse-grained area extends from the southwest coast to the east coast (Figure 2c). Although the reduction in current velocity in the central part of LB was less pronounced than that near the southwestern dikes, the sediment types in this area are primarily fine-grained silt and clay (Figure 2b), resulting in a more notable decrease in SSC. When examining the impact of reclamation on hydrodynamics and sediment dynamics, it is essential to consider the spatial variation in seabed sediment types. This variation can result in inconsistent responses in both hydrodynamics and sediment dynamics.
Advection and tidal pumping are the two dominant mechanisms for suspended sediment transport in many marine environments. Advection is primarily controlled by subtidal currents, whereas tidal pumping is mainly influenced by the exchange of resuspended sediments between different regions and the asymmetric sediment transport occurring within the tidal cycle. Tidal pumping facilitates the offshore transport of high-concentration nearshore sediments [54,55,56]. Previous field observations in LB have demonstrated that both advection and tidal pumping are significant mechanisms controlling suspended sediment transport in the bay, with advection playing a more prominent role [27]. The simulated direction of sediment transport in most areas of LB closely resembled the direction of bottom subtidal currents, underscoring the substantial contribution of advection. However, the variation in sediment transport direction in the northern and eastern parts of the bay during winter, as compared to water volume transport, may be influenced by tidal pumping effects.

4.2. Implications

Understanding the sediment dynamics resulting from reclamation in semi-closed bays is crucial for guiding nearshore port construction, coastal restoration, and water quality management decisions. The morphological changes induced by land reclamation are particularly pronounced near port projects or artificial structures, potentially compromising the safety of these installations. Accurate predictions of sediment deposition and distribution within coastal zones, under varying hydrodynamic conditions, provide a scientific foundation for the timely implementation of preventive measures. Various design schemes can be employed to assess the impact of reclamation in modeling efforts, and reasonable restoration projects can be developed to protect the coast from erosion [12]. While the settling of sediments limits their long-distance transport over short durations, dissolved substances, such as nutrients and dissolved organic matter, as well as phytoplankton in the water column, may respond more rapidly to land reclamation. The implications of land reclamation extend to dissolved substances, highlighting its significant effects on the water quality and ecological environment of the bay, which are critical for effective management and regulation.

4.3. Limitations and Future Works

This paper established a numerical model based on the coastline of LB in 1990 and 2020. The primary aim of this study was to investigate the sediment dynamic response and mechanisms resulting from reclamation activities. Over the past 30 years, alterations in the sediment load of the Yellow River and human interventions have led to corresponding changes in the water depth of LB. Variations in water depth subsequently affect bottom friction, tidal amplitude, and current velocity [57,58,59]. When both the changes in coastline and water depth are incorporated into the model, the resulting hydrodynamic and sediment responses become more complex. Therefore, it is essential to include realistic water depth in the model to accurately reproduce the hydrodynamic and sediment transport characteristics during historical periods. Furthermore, this study indicated that, in the absence of extreme weather conditions, sediments in LB can be transported eastward across the bay during winter; however, they typically do not cross 120.2° E (Figure 12b). Land reclamation significantly influences hydrodynamics and sediment transport in its vicinity and also plays a considerable role in long-distance sediment transport within the bay. Previous research has confirmed the critical contribution of winter storms to sediment transport from the Bohai Sea to the Yellow Sea [23,60,61], and the combined effects of winter storms and land reclamation on volume and sediment transport will be further investigated.

5. Conclusions

This study, based on a coupled hydrodynamic-sediment model validated by field observations in a semi-enclosed bay, reproduced the hydrodynamics and sediment dynamics under climatological weather conditions and assessed the impacts of land reclamation projects. The reclamation process resulted in an increase in tidal current velocity, enhanced erosion, and elevated SSC on the seaward side of the dikes in southwestern LB, while simultaneously reducing current velocity and SSC in other areas. Additionally, reclamation intensified the subtidal current around the dikes, leading to abrupt changes in current direction. Within LB, the subtidal current exhibited vertical shear across different seasons, with opposing current directions observed at the surface and bottom layers. The primary direction of water volume transport in most areas was influenced by the circulation structure of the lower layer. A stable anticyclonic structure in the western part of the bay governed the direction of water volume and sediment transport in that region, whereas transport patterns and seasonal variations were markedly different in other areas of LB. During summer, water and sediment were predominantly transported from northeast to southwest. In contrast, during winter, water from the northern region flowed westward while the southern part flowed eastward, with the main direction of sediment transport directed eastward, effectively crossing the bay. Advection was found to play a crucial role in sediment transport, with the primary transport pathway situated in the central part of the bay. Notably, the cross-bay sediment transport flux in winter was approximately 3.5 times greater than that in summer, and following reclamation, the winter cross-bay sediment transport flux decreased by about 22.17%.

Author Contributions

Conceptualization, Y.Z., J.D. and Y.W.; methodology, Y.Z.; data curation, Y.Z., H.M., P.Z. and S.J.; visualization, Y.Z. and G.X.; supervision, J.D. and Y.W.; project administration, J.D., Y.W., P.L. and W.G.; writing—original draft preparation, Y.Z. and J.D.; writing—review and editing, Y.Z. and J.D. All authors have read and agreed to the published version of the manuscript.

Funding

This research was funded by the National Key Research and Development Program of China (No. 2020YFA0607900, 2022YFC3106100), the Open Research Fund of Key Laboratory of Coastal Science and Integrated Management, Ministry of Natural Resources (No. 2024COSIM02), the Natural Science Foundation of the China and Shandong Province Joint Funds (No. U1706214), the General Program of Natural Science Foundation of Shandong Province (No. ZR2020MD063), and the Youth Program of Natural Science Foundation of Shandong Province (No. ZR2013DQ025).

Institutional Review Board Statement

Not applicable.

Informed Consent Statement

Not applicable.

Data Availability Statement

The data presented in this study are only available on request from the corresponding author due to privacy issues.

Acknowledgments

The numerical model was carried out at the High-Performance Scientific Computing and System Simulation Platform of Laoshan Laboratory and Marine Big Data Center of Institute for Advanced Ocean Study of Ocean University of China.

Conflicts of Interest

The authors declare no conflicts of interest.

References

  1. Wang, W.; Liu, H.; Li, Y.; Su, J. Development and management of land reclamation in China. Ocean Coast. Manag. 2014, 102, 415–425. [Google Scholar] [CrossRef]
  2. Mentaschi, L.; Vousdoukas, M.I.; Pekel, J.F.; Voukouvalas, E.; Feyen, L. Global long-term observations of coastal erosion and accretion. Sci. Rep. 2018, 8, 12876. [Google Scholar] [CrossRef] [PubMed]
  3. Li, X.; Damen, M.C.J. Coastline change detection with satellite remote sensing for environmental management of the Pearl River Estuary, China. J. Mar. Syst. 2010, 82, S54–S61. [Google Scholar] [CrossRef]
  4. Okada, T.; Nakayama, K.; Takao, T.; Furukawa, K. Influence of freshwater input and bay reclamation on long-term changes in seawater residence times in Tokyo bay, Japan. Hydrol. Process. 2011, 25, 2694–2702. [Google Scholar] [CrossRef]
  5. van Maren, D.S.; Oost, A.P.; Wang, Z.B.; Vos, P.C. The effect of land reclamations and sediment extraction on the suspended sediment concentration in the Ems Estuary. Mar. Geol. 2016, 376, 147–157. [Google Scholar] [CrossRef]
  6. Cheng, Z.; Jalon-Rójas, I.; Wang, X.H.; Liu, Y. Impacts of land reclamation on sediment transport and sedimentary environment in a macro-tidal estuary. Estuar. Coast. Shelf Sci. 2020, 242, 106861. [Google Scholar] [CrossRef]
  7. Chen, P.; Sun, Z.; Zhou, X.; Xia, Y.; Li, L.; He, Z.; Wang, R.; Xie, H. Impacts of coastal reclamation on tidal and sediment dynamics in the Rui’an coast of China. Ocean Dyn. 2021, 71, 323–341. [Google Scholar] [CrossRef]
  8. Zhang, R.; Chen, Y.; Chen, P.; Zhou, X.; Wu, B.; Chen, K.; Sun, Z.; Yao, P. Impacts of tidal flat reclamation on suspended sediment dynamics in the tidal-dominated Wenzhou Coast, China. Front. Mar. Sci. 2023, 10, 1097177. [Google Scholar] [CrossRef]
  9. Van der Spek, A. Tidal asymmetry and long-term evolution of Holocene tidal basins in The Netherlands: Simulation of palaeo-tides in the Schelde estuary. Mar. Geol. 1997, 141, 71–90. [Google Scholar] [CrossRef]
  10. Williams, J.R.; Dellapenna, T.M.; Lee, G.-H. Shifts in depositional environments as a natural response to anthropogenic alterations: Nakdong Estuary, South Korea. Mar. Geol. 2013, 343, 47–61. [Google Scholar] [CrossRef]
  11. Williams, J.; Lee, G.-H.; Shin, H.-J.; Dellapenna, T. Mechanism for sediment convergence in the anthropogenically altered microtidal Nakdong Estuary, South Korea. Mar. Geol. 2015, 369, 79–90. [Google Scholar] [CrossRef]
  12. Vona, I.; Gray, M.; Nardin, W. The Impact of Submerged Breakwaters on Sediment Distribution along Marsh Boundaries. Water 2020, 12, 1016. [Google Scholar] [CrossRef]
  13. Lee, H.J.; Ryu, S.O. Changes in topography and surface sediments by the Saemangeum dyke in an estuarine complex, west coast of Korea. Cont. Shelf Res. 2008, 28, 1177–1189. [Google Scholar] [CrossRef]
  14. Liang, H.; Kuang, C.; Olabarrieta, M.; Song, H.; Ma, Y.; Dong, Z.; Han, X.; Zuo, L.; Liu, Y. Morphodynamic responses of Caofeidian channel-shoal system to sequential large-scale land reclamation. Cont. Shelf Res. 2018, 165, 12–25. [Google Scholar] [CrossRef]
  15. Cox, J.R.; Leuven, J.R.F.W.; Pierik, H.J.; van Egmond, M.; Kleinhans, M.G. Sediment deficit and morphological change of the Rhine–Meuse river mouth attributed to multi-millennial anthropogenic impacts. Cont. Shelf Res. 2022, 244, 104766. [Google Scholar] [CrossRef]
  16. Nnafie, A.; VanOyen, T.; DeMaerschalck, B.; vanderVegt, M.; Wegen, M.v.d. Estuarine Channel Evolution in Response to Closure of Secondary Basins: An Observational and Morphodynamic Modeling Study of the Western Scheldt Estuary. J. Geophys. Res. Earth Surf. 2018, 123, 167–186. [Google Scholar] [CrossRef]
  17. Byun, D.S.; Wang, X.H.; Holloway, P.E. Tidal characteristic adjustment due to dyke and seawall construction in the Mokpo Coastal Zone, Korea. Estuar. Coast. Shelf Sci. 2004, 59, 185–196. [Google Scholar] [CrossRef]
  18. Xu, Y.; Gao, H.; Wei, X.; Zhu, J. The Effects of Reclamation Activity and Yellow River Runoff on Coastline and Area of the Laizhou Bay, China. J. Ocean Univ. China 2021, 20, 729–739. [Google Scholar] [CrossRef]
  19. Liu, X.; Feng, X.; Liu, J. Hydrodynamic evolution characteristics of southwest Laizhou Bay under the effect of port construction. Mar. Sci. 2016, 40, 138–145, (In Chinese with English abstract). [Google Scholar]
  20. Nie, C.; Wu, Y.; Zhu, J.; Xu, Y.; Du, P.; Wang, H. Numerical study on hydrodynamic effects of coastline changes in southwestern Laizhou Bay. Mar. Environ. Sci. 2023, 42, 228–236, (In Chinese with English abstract). [Google Scholar]
  21. Lu, J.; Qiao, F.L.; Wang, X.H.; Wang, Y.G.; Teng, Y.; Xia, C.S. A numerical study of transport dynamics and seasonal variability of the Yellow River sediment in the Bohai and Yellow seas. Estuar. Coast. Shelf Sci. 2011, 95, 39–51. [Google Scholar] [CrossRef]
  22. Bian, C.; Jiang, W.; Greatbatch, R.J. An exploratory model study of sediment transport sources and deposits in the Bohai Sea, Yellow Sea, and East China Sea. J. Geophys. Res. Ocean. 2013, 118, 5908–5923. [Google Scholar] [CrossRef]
  23. Wang, C.; Liu, Z.; Harris, C.K.; Wu, X.; Wang, H.; Bian, C.; Bi, N.; Duan, H.; Xu, J. The Impact of Winter Storms on Sediment Transport Through a Narrow Strait, Bohai, China. J. Geophys. Res. Ocean. 2020, 125, e2020JC016069. [Google Scholar] [CrossRef]
  24. Wu, W.; Zhai, F.; Liu, C.; Gu, Y.; Li, P. Three-dimensional structure of summer circulation in the Bohai Sea and its intraseasonal variability. Ocean Dyn. 2023, 73, 679–698. [Google Scholar] [CrossRef]
  25. Li, Y.; Zhang, H.; Tang, C.; Zou, T.; Jiang, D. Influence of rising sea level on tidal dynamics in the Bohai Sea. J. Coast. Res. 2016, 74, 22–31. [Google Scholar] [CrossRef]
  26. Lv, X.; Yuan, D.; Ma, X.; Tao, J. Wave characteristics analysis in Bohai Sea based on ECMWF wind field. Ocean Eng. 2014, 91, 159–171. [Google Scholar] [CrossRef]
  27. Xie, B.; Bao, R.; Yin, D.; Zhu, L.; Hu, R.; Cai, W.; Liu, T.; Lin, C.; Lu, P. The spatio-temporal distribution and transport of suspended sediment in Laizhou Bay: Insights from hydrological and sedimentological investigations. Front. Earth Sci. 2022, 10, 994258. [Google Scholar] [CrossRef]
  28. Chen, C.; Qi, J.; Li, C.; Beardsley, R.C.; Lin, H.; Walker, R.; Gates, K. Complexity of the flooding/drying process in an estuarine tidal-creek salt-marsh system: An application of FVCOM. J. Geophys. Res. Ocean. 2008, 113, C07052. [Google Scholar] [CrossRef]
  29. Ge, J.; Shen, F.; Guo, W.; Chen, C.; Ding, P. Estimation of critical shear stress for erosion in the Changjiang Estuary: A synergy research of observation, GOCI sensing and modeling. J. Geophys. Res. Ocean. 2015, 120, 8439–8465. [Google Scholar] [CrossRef]
  30. Chen, C.; Gao, G.; Zhang, Y.; Beardsley, R.C.; Lai, Z.; Qi, J.; Lin, H. Circulation in the Arctic Ocean: Results from a high-resolution coupled ice-sea nested Global-FVCOM and Arctic-FVCOM system. Prog. Oceanogr. 2016, 141, 60–80. [Google Scholar] [CrossRef]
  31. Cong, S.; Wu, X.; Ge, J.; Bi, N.; Li, Y.; Lu, J.; Wang, H. Impact of Typhoon Chan-hom on sediment dynamics and morphological changes on the East China Sea inner shelf. Mar. Geol. 2021, 440, 106578. [Google Scholar] [CrossRef]
  32. Jeong, J.-S.; Woo, S.-B.; Lee, H.S.; Gu, B.-H.; Kim, J.W.; Song, J.I. Baroclinic Effect on Inner-Port Circulation in a Macro-Tidal Estuary: A Case Study of Incheon North Port, Korea. J. Mar. Sci. Eng. 2022, 10, 392. [Google Scholar] [CrossRef]
  33. Deb, M.; Kirby, J.T.; Abdolali, A.; Shi, F. A surface porosity approach for eliminating artificial ponding in coastal salt marsh simulations. Coast. Eng. 2023, 179, 104246. [Google Scholar] [CrossRef]
  34. Zhong, Y.; Zhang, J.; Song, D.; Zhao, Y.; Liu, Y.; Wu, W.; Qiao, L. Numerical study of hydrodynamic effects on Manila clam population distribution and transport in the Southwest Laizhou Bay, China. Sci Total Env. 2023, 865, 161214. [Google Scholar] [CrossRef] [PubMed]
  35. Tang, B.; Zhang, F.; Jia, J.; Feng, Z.; Tang, J.; Xing, F.; Wang, Y.P. The Role of Tropical Cyclone on Changjiang River Subaqueous Delta Geomorphology: A Numerical Investigation of Tropical Cyclone Danas (2019). J. Geophys. Res. Ocean. 2023, 128, e2022JC019190. [Google Scholar] [CrossRef]
  36. Booij, N.; Ris, R.C.; Holthuijsen, L.H. A third-generation wave model for coastal regions: 1. Model description and validation. J. Geophys. Res. Ocean. 1999, 104, 7649–7666. [Google Scholar] [CrossRef]
  37. Rusu, L.; Guedes Soares, C. Modelling the wave–current interactions in an offshore basin using the SWAN model. Ocean Eng. 2011, 38, 63–76. [Google Scholar] [CrossRef]
  38. Suzuki, T.; Zijlema, M.; Burger, B.; Meijer, M.C.; Narayan, S. Wave dissipation by vegetation with layer schematization in SWAN. Coast. Eng. 2012, 59, 64–71. [Google Scholar] [CrossRef]
  39. Amarouche, K.; Akpınar, A.; Bachari, N.E.I.; Çakmak, R.E.; Houma, F. Evaluation of a high-resolution wave hindcast model SWAN for the West Mediterranean basin. Appl. Ocean Res. 2019, 84, 225–241. [Google Scholar] [CrossRef]
  40. Abu Zed, A.A.; Kansoh, R.M.; Iskander, M.M.; Elkholy, M. Wind and wave climate southeastern of the Mediterranean Sea based on a high-resolution SWAN model. Dyn. Atmos. Ocean. 2022, 99, 101311. [Google Scholar] [CrossRef]
  41. Zhang, W.; Zhao, H.; Chen, G.; Yang, J. Assessing the performance of SWAN model for wave simulations in the Bay of Bengal. Ocean Eng. 2023, 285, 115295. [Google Scholar] [CrossRef]
  42. Rogers, W.E.; Hwang, P.A.; Wang, D.W. Investigation of wave growth and decay in the SWAN model: Three regional-scale applications. J. Phys. Oceanogr. 2003, 33, 366–389. [Google Scholar] [CrossRef]
  43. Zhong, Y.; Qiao, L.; Song, D.; Ding, Y.; Xu, J.; Xue, W.; Xue, C. Impact of cold water mass on suspended sediment transport in the South Yellow Sea. Mar. Geol. 2020, 428, 106244. [Google Scholar] [CrossRef]
  44. Zhou, F.; Huang, D.; Xue, H.; Xuan, J.; Yan, T.; Ni, X.; Zeng, D.; Li, J. Circulations associated with cold pools in the Bohai Sea on the Chinese continental shelf. Cont. Shelf Res. 2017, 137, 25–38. [Google Scholar] [CrossRef]
  45. Mou, L.; Niu, Q.; Xia, M. The roles of wind and baroclinic processes in cross-isobath water exchange within the Bohai Sea. Estuar. Coast. Shelf Sci. 2022, 274, 107944. [Google Scholar] [CrossRef]
  46. Yang, Z.; Ji, Y.; Bi, N.; Lei, K.; Wang, H. Sediment transport off the Huanghe (Yellow River) delta and in the adjacent Bohai Sea in winter and seasonal comparison. Estuar. Coast. Shelf Sci. 2011, 93, 173–181. [Google Scholar] [CrossRef]
  47. Jia, Y.; Zhang, L.; Zheng, J.; Liu, X.; Jeng, D.-S.; Shan, H. Effects of wave-induced seabed liquefaction on sediment re-suspension in the Yellow River Delta. Ocean Eng. 2014, 89, 146–156. [Google Scholar] [CrossRef]
  48. Li, P.; Chen, S.; Ji, H.; Ke, Y.; Fu, Y. Combining Landsat-8 and Sentinel-2 to investigate seasonal changes of suspended particulate matter off the abandoned distributary mouths of Yellow River Delta. Mar. Geol. 2021, 441, 106622. [Google Scholar] [CrossRef]
  49. Zhu, Z.; Du, X.; Liang, B.; Wang, L.; Song, Y.; Li, P.; Fan, Y.; Bian, S.; Wang, Y.; Zhang, Y.; et al. Simulating liquefaction-induced resuspension flux in a sediment transport model. Water Res 2024, 261, 122057. [Google Scholar] [CrossRef]
  50. Qin, Y.-C.; Mei, X.; Jiang, X.; Luan, X.; Zhou, L.; Zhu, X. Sediment provenance and tidal current-driven recycling of Yellow River detritus in the Bohai Sea, China. Mar. Geol. 2021, 436, 106473. [Google Scholar] [CrossRef]
  51. Blondeaux, P.; Vittori, G. Flow and sediment transport induced by tide propagation: 1. The flat bottom case. J. Geophys. Res. Ocean. 2005, 110, C07020. [Google Scholar] [CrossRef]
  52. Bever, A.J.; MacWilliams, M.L. Simulating sediment transport processes in San Pablo Bay using coupled hydrodynamic, wave, and sediment transport models. Mar. Geol. 2013, 345, 235–253. [Google Scholar] [CrossRef]
  53. Luo, Z.; Zhu, J.; Wu, H.; Li, X. Dynamics of the Sediment Plume Over the Yangtze Bank in the Yellow and East China Seas. J. Geophys. Res. Ocean. 2017, 122, 10073–10090. [Google Scholar] [CrossRef]
  54. Scully, M.E.; Friedrichs, C.T. Sediment pumping by tidal asymmetry in a partially mixed estuary. J. Geophys. Res. Ocean. 2007, 112, C07028. [Google Scholar] [CrossRef]
  55. Becherer, J.; Flöser, G.; Umlauf, L.; Burchard, H. Estuarine circulation versus tidal pumping: Sediment transport in a well-mixed tidal inlet. J. Geophys. Res. Ocean. 2016, 121, 6251–6270. [Google Scholar] [CrossRef]
  56. Kim, S.I.; Seo, J.Y.; Park, J.-H.; Kim, P.J.; Kim, I.G.; Kim, K.M.; Ha, H.K. Imbalance of sediment transport in a meso-tidal bay: Effect of tidal pumping and residual circulation. Front. Mar. Sci. 2024, 11, 1362583. [Google Scholar] [CrossRef]
  57. Noss, C.; Lorke, A. Roughness, resistance, and dispersion: Relationships in small streams. Water Resour. Res. 2016, 52, 2802–2821. [Google Scholar] [CrossRef]
  58. Dyakonova, T.; Khoperskov, A. Bottom friction models for shallow water equations: Manning’s roughness coefficient and small-scale bottom heterogeneity. J. Phys. Conf. Ser. 2018, 973, 012032. [Google Scholar] [CrossRef]
  59. Rivière, P.; Treguier, A.M.; Klein, P. Effects of bottom friction on nonlinear equilibration of an oceanic baroclinic jet. J. Phys. Oceanogr. 2004, 34, 416–432. [Google Scholar] [CrossRef]
  60. Qiao, L.; Zhong, Y.; Wang, N.; Zhao, K.; Huang, L.; Wang, Z. Seasonal transportation and deposition of the suspended sediments in the Bohai Sea and Yellow Sea and the related mechanisms. Ocean Dyn. 2016, 66, 751–766. [Google Scholar] [CrossRef]
  61. Liu, X.; Qiao, L.; Li, G.; Zhong, Y.; Miao, H.; Hu, R. Discontinuity of sediment transport from the Bohai Sea to the open sea dominated by the wind direction. Estuar. Coast. Shelf Sci. 2023, 293, 108486. [Google Scholar] [CrossRef]
Figure 1. Study area and model mesh: (a) Bohai Sea; (b) Laizhou Bay (LB); (c) entire model grid after reclamation; (d) model grid in LB after reclamation; (e) entire model grid before reclamation; (f) model grid in LB before reclamation. Black and blue solid lines in (a,b) are the coastlines in LB before and after reclamation. Black dots in (b) are observation stations. Red solid line in (b) was used for calculating cross-bay sediment flux.
Jmse 12 01633 g001
Figure 2. Fractions of three seabed sediment classes in the sediment model.
Jmse 12 01633 g002
Figure 3. Comparisons between the observed and modeled u and v current velocities and suspended sediment concentration (SSC): (ai) observed results; (a’i’) modeled results.
Jmse 12 01633 g003
Figure 4. Comparisons between the Jason and modeled significant wave height: (a,c) Jason results; (b,d) modeled results.
Jmse 12 01633 g004
Figure 5. Comparisons between the MODIS and modeled sea surface temperature: (a,c) MODIS results; (b,d) modeled result.
Jmse 12 01633 g005
Figure 6. Tidal current change: (a,c) peak flood and ebb current; (b,d) current velocity differences in peak flood and ebb before and after reclamation; (e) monthly averaged tidal current velocity; (f) monthly averaged tidal current velocity differences before and after reclamation. The blue and red solid lines in (a,c) represent the coastlines after and before reclamation, respectively. The blue and red vectors in (a,c) represent the current after and before reclamation, respectively.
Jmse 12 01633 g006
Figure 7. Monthly averaged subtidal current after reclamation: (a,b) surface and bottom current in winter; (c,d) surface and bottom current in summer. Arrows indicate current direction.
Jmse 12 01633 g007
Figure 8. Monthly averaged subtidal current before reclamation: (a,b) surface and bottom current in winter; (c,d) surface and bottom current in summer. Arrows indicate current direction.
Jmse 12 01633 g008
Figure 9. Monthly averaged sea surface height after reclamation: (a) winter; (b) summer.
Jmse 12 01633 g009
Figure 10. Monthly averaged SSC and seabed thickness change: (ac) surface and bottom SSC and seabed thickness in winter; (df) surface and bottom SSC and seabed thickness in summer; (gi) SSC and seabed thickness differences after and before reclamation.
Jmse 12 01633 g010
Figure 11. Monthly averaged sediment term change: (ac) advection, erosion, and deposition terms after reclamation (df) advection, erosion, and deposition terms differences after and before reclamation.
Jmse 12 01633 g011
Figure 12. Monthly averaged water and sediment flux after reclamation: (a,b) water and sediment flux in winter; (c,d) water and sediment flux in summer. Arrows indicate flux direction. Red box in (b) indicates cross-bay transport pathway.
Jmse 12 01633 g012
Figure 13. Monthly averaged cross-bay current and sediment flux change: (a,c) cross-bay current and sediment flux in winter after reclamation; (b,d) cross-bay current and sediment flux in summer after reclamation; (eh) results before reclamation. The positive numbers represent eastward, while the negative numbers represent westward.
Jmse 12 01633 g013
Table 1. The main parameters used in the sediment model.
ParameterClaySiltSand
Median grain size (mm)0.0040.020.25
Density (kg/m3)265026502650
Settling velocity (mm/s)0.030.601.30
Erosion rate (kg/m2/s)7 × 10−57 × 10−57 × 10−5
Critical shear stress (N/m2)0.230.091.30
Porosity (%)0.500.450.30
Table 2. Correlation coefficient, root-mean-square error, and skill score of three stations.
Parameterc1c2c3
R2RMSESSR2RMSESSR2RMSESS
U0.960.080.850.950.070.830.890.080.73
V0.900.080.640.930.100.450.840.090.68
SSC0.740.020.450.710.020.420.590.020.31
Table 3. Cross-bay sediment flux change (kg/s).
Numerical ExperimentsWinterSummer
Before reclamation510.98208.97
After reclamation397.69−30.20
Disclaimer/Publisher’s Note: The statements, opinions and data contained in all publications are solely those of the individual author(s) and contributor(s) and not of MDPI and/or the editor(s). MDPI and/or the editor(s) disclaim responsibility for any injury to people or property resulting from any ideas, methods, instructions or products referred to in the content.

