Article

Design and Implementation of Energy Management System Based on Spring Boot Framework

College of Electronic Information and Optical Engineering, Nankai University, Tianjin 300350, China
*
Author to whom correspondence should be addressed.
Information 2021, 12(11), 457; https://doi.org/10.3390/info12110457
Submission received: 28 September 2021 / Revised: 3 November 2021 / Accepted: 3 November 2021 / Published: 4 November 2021
(This article belongs to the Special Issue Computer, Software Engineering and Applications)

Abstract

:
This paper designs and implements an energy management system based on the Spring Boot framework. The system mainly includes three layers, which are the data collection layer, the business logic layer, and the display interface layer from bottom to top. The data collection layer is based on the RS-485 electrical standard and the MODBUS communication protocol. The two protocols connect all energy consumption monitoring points into a mixed topology communication network in the enterprise. The programs in the data collection layer poll each energy consumption monitoring point in the network to collect the data and transmit to the business logic layer. The business logic layer is developed on the basis of the Spring Boot framework and mainly includes two parts: the MySQL database and Tomcat server. In the MySQL database, the stored data are horizontally split according to the time column and stored in different data tables. The split of data reduces the load of a single data table and improves the query performance of the database. The Tomcat server is built into the Spring Boot framework to provide a basic environment for system operation. The Spring Boot framework is the core component of the system. It is responsible for collecting, storing, and analyzing data from energy consumption monitoring points, receiving and processing data requests from the display interface layer. It also provides standard data interfaces to the external programs. The display interface layer is developed on the basis of the Vue framework and integrated into the Spring Boot framework. The display layer combines an open-source visualization chart library called ECharts to provide users with a fully functional and friendly human–computer interaction interface. Through the calculation of hardware and software costs, considering the personnel cost in different regions, the total cost of the energy management system can be estimated. The cost of construction was approximately 210,000 USD in this paper. Since the system was actually deployed in a manufacturing company in December 2019, it has been operating stably for more than 600 days.

1. Introduction

Energy is the lifeblood of the national economy and the foundation of industrial development. Modern enterprises, especially the manufacturing industry, consume huge amounts of energy such as water and electricity in the process of production. These high-energy-consuming enterprises have to pay high energy costs each year, but the energy utilization rate cannot be effectively improved. The high energy cost not only affects the energy conservation and consumption reduction, but also weakens the market competitiveness of the enterprise [1]. It is of great significance to establish an energy management system and fully control the total energy consumption of the enterprise to improve the energy utilization rate [2]. In the power market, there are large fluctuations in the demand for electrical energy at different times, which causes a huge load on the power system. Demand response [3] has become an important part of the smart grid system. The energy management system can calculate and analyze the energy consumption of the enterprise to determine the peak and valley period of energy consumption. The enterprise can dynamically adjust the production plan according to the analysis, cut the peak, and flatten the valley, further reducing energy costs and increasing corporate profits. At the same time, the system also helps to achieve a balance between energy supply and demand, as well as to ensure the stability of the power market.
In the mid-1960s, Japan first began to research and develop energy management systems, which were mainly used in iron and steel plants around the country [4]. The early energy management system was relatively small and simple in function. It was mainly used for the collection and monitoring of energy consumption data and the control of equipment. In developed countries represented by the United States and Germany, the industrial and social systems attach great importance to energy consumption measurement and control, and many companies have their own mature energy management systems. The Ford Company (USA), General Motors Company (USA), and Siemens Company (Germany) have established their own unique energy consumption management platforms and have obtained great benefits in terms of energy saving and consumption reduction [5]. China’s energy management system started in the 1980s [6]. China National Heavy-Duty Truck, Shanghai Automotive, and other manufacturing companies are actively building energy management systems, collecting, processing, and analyzing the energy consumption data of the enterprises. These companies also gradually constructed energy management centers and carried out energy consumption optimization work. After more than 30 years of development, the energy management situation has been greatly improved.
In the traditional energy measurement and management systems, the energy consumption of various areas and equipment relies on manual observation and recording. The energy consumption of some areas and equipment can only be estimated, and the error of data recording is extremely large. The data are manually copied after being summarized, and the transmission is seriously delayed. It is also hard to detect and deal with abnormal situations in time such as water leakage and electric leakage [7]. Manually recorded data are mainly handwritten and stored on paper, resulting in many inconveniences in the periodic analysis of regional energy consumption.
With the development of modern Internet technology, technologies such as servers and databases have gradually been applied to the industrial field [8]. People hope to be free from heavy meter-reading tasks and realize remote automatic collection and storage of energy consumption data, which will make energy consumption data timely and accurate, thus effectively preventing late reporting, underreporting, and fraudulent data. Enterprise managers can complete complex calculation tasks with the help of computers, conduct a comprehensive analysis of energy consumption data, find problems in time, and rectify them, ultimately improving energy utilization.
Focusing on the above problems, this paper designs and implements an energy management system based on the Spring Boot framework. The system combines modern Internet technology and industrial data collection technology to integrate data collection, data storage, real-time monitoring, energy consumption analysis, consumption forecasting, etc. The functions realize the management and control of the energy consumption in the enterprise, so as to accurately manage and analyze the energy consumption of each region and each production process, as well as provide a reliable and scientific basis for the enterprise managers to formulate energy-saving plans.

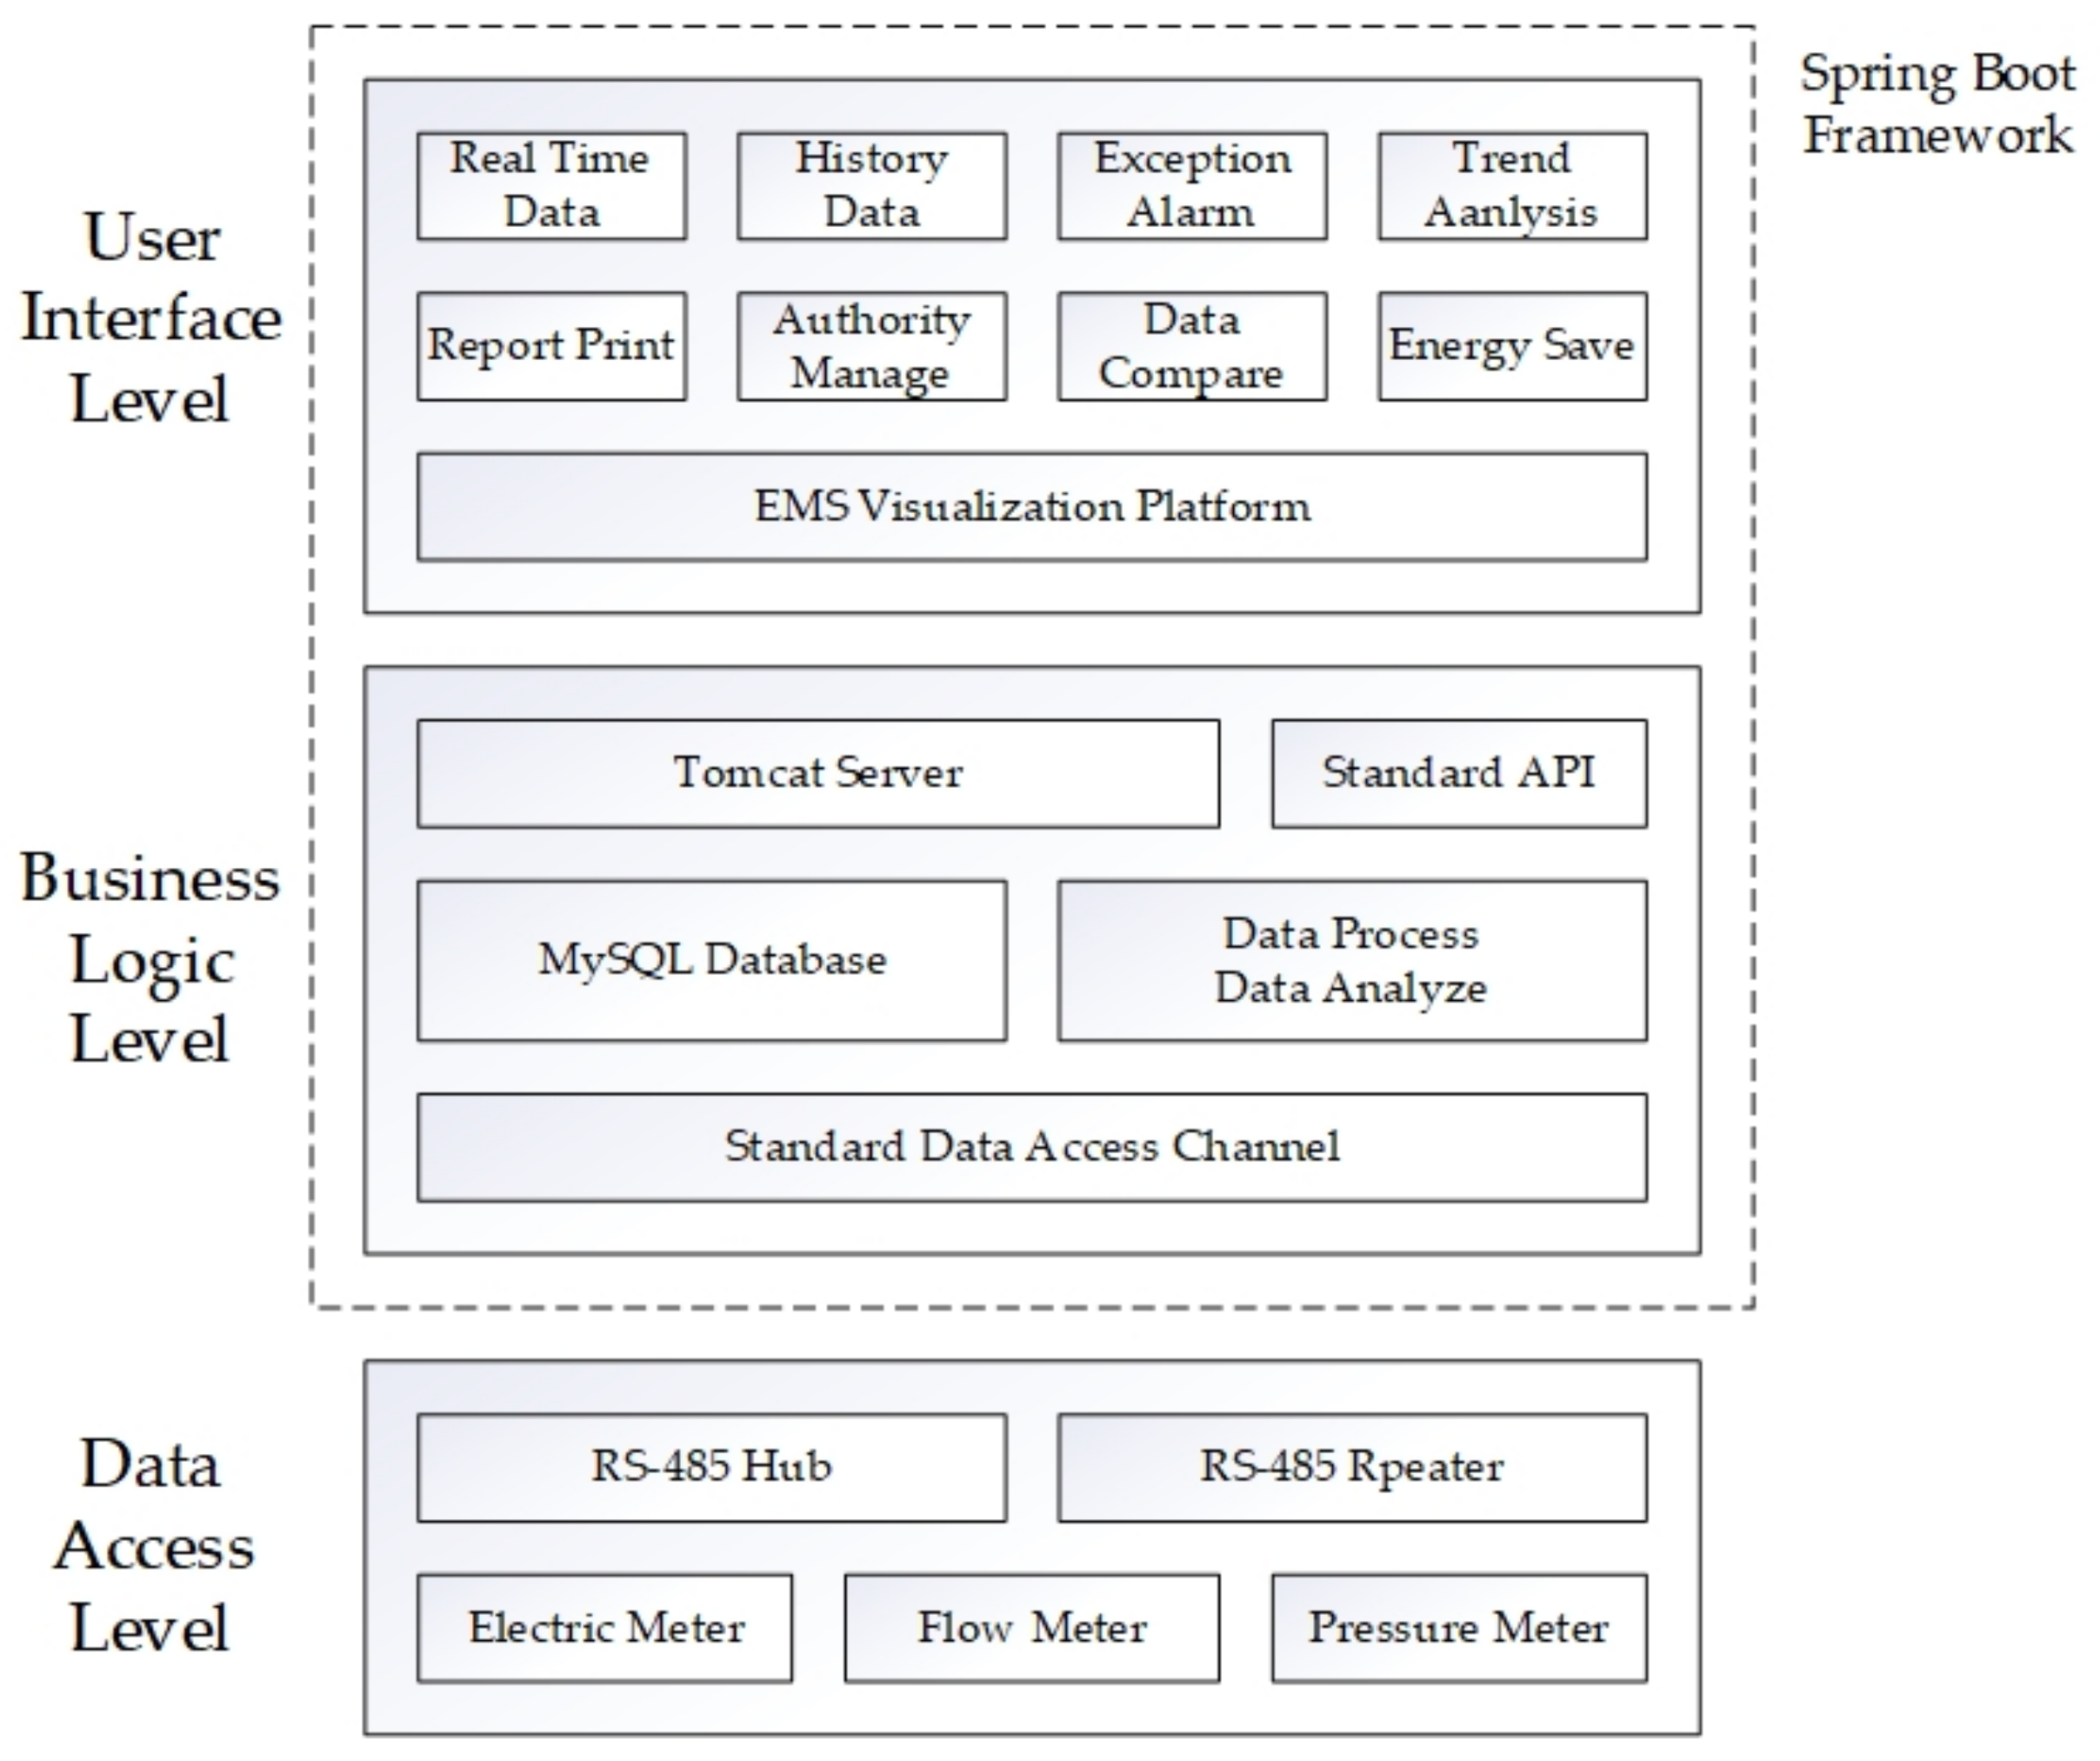
2. Design of System Architecture

The energy management system designed in this paper is based on the Spring Boot framework and integrates the MySQL database and the Vue front-end framework. The system design follows the three-tier architecture principle [9] and consists of three layers: from bottom to top, the data collection layer, business logic layer, and display interface layer. The overall system architecture is shown in Figure 1.
In the overall system architecture shown in Figure 1, the data collection layer connects all energy consumption monitoring points into a communication network, polls every node for collecting the original data, and transmits the data to the business logic layer. The business logic layer parses the received data and stores it in the database. After the calculation and analysis, the Tomcat server can provide data services for the display interface layer. The display interface layer is used to display the results of data analysis and provide a human–computer interaction interface. Both the display interface layer and the business logic layer are constructed by the Spring Boot framework.

2.1. Data Collection Layer

Many energy consumption monitoring points are set up in the enterprise and production areas to monitor the energy consumption of the area or production facilities. Each energy consumption monitoring point is equipped with at least one standard measuring device, such as electric energy meters, flow meters, and totalizers. The electric energy meter is used to monitor the consumption of electric energy, voltage value, and electric current of the area or equipment. The flow meter is used to monitor the instantaneous flow and the cumulative flow of water. The totalizer is used to monitor the instantaneous flow rate, cumulative flow rate of steam or compressed air, and the temperature and pressure of the gas. Energy consumption monitoring points and standard measuring devices can accurately reflect the energy consumption of enterprise and production facilities; hence, they are widely used.
RS-485 is an electrical interface standard which is widely used in physical layer connections in the industrial control field [10]. RS-485 usually uses two signal lines, A and B, adopts differential signal transmission, works in half-duplex mode, and has a maximum transmission distance of 1200 m. RS-485 supports multipoint connection, and it has the characteristics of high transmission rate and good anti-noise interference performance. MODBUS-RTU is an open serial communication protocol, which has now become an industry standard for communication protocols. It is also a widely used communication protocol between industrial electronic devices [11]. The MODBUS-RTU protocol is based on the master/slave architecture. The master sends requests to slaves, and the slaves respond to the master with their own data. The MODBUS-RTU protocol stipulates the data format of the requests and responses and uses CRC to ensure the correctness and integrity of the data.
The data collection layer uses the RS-485 bus to connect all energy consumption monitoring points into a mixed topology node communication network [12]. The communication network combines a bus topology and a star topology. The node communication network is shown in Figure 2.
In the communication network shown in Figure 2, several communication nodes and repeaters are connected to the RS-485 bus, and all communication nodes share the RS-485 common bus. The bus-type topology is simple and has high reliability. The failure of a single node will not affect the communication between the bus and other nodes. The bus is convenient to connect new communication nodes or repeaters. The main function of the repeater is to enhance the transmission signal, extend the transmission distance, and ensure the stability and integrity of the signal during long-distance transmission. Each repeater on the bus serves as the central node of the star network and can be connected to multiple communication nodes. Repeaters are mainly used in energy monitoring groups far away from the bus. The RS-485 hub is the collection terminal of the communication network. The collection terminal is connected to a computer or server through a serial converter which can convert the RS-485 interface to an RS-232 or USB interface.
The collection terminal is the only master station in the communication network, and the other nodes are slave stations. Every slave station has a unique MODBUS address to distinguish it from other slave stations. The repeater is only used to enhance and forward signals; it is not used as a communication node. According to the data format specified in the MODBUS protocol, the collection terminal sends requests to the communication network to collect the data of the slave station with the specified address. All slave stations receive the request. If its own address is different from the address in the request, the request is ignored by the slave station. If the address is the same, the slave station returns its own data to the collection terminal. The collection terminal polls all nodes one by one to collect the data in the network. The collection terminal is directly controlled by the computer. The system verifies the data returned to ensure the Integrity. If the verification fails or the return times out, the data are discarded and the request is retransmitted. If failure occurs again, the system skips the node and logs the time of occurrence.

2.2. Business Logic Layer

The business logic layer was constructed using the Spring Boot framework, and it mainly includes two parts: the database and the server. The database is used to store energy consumption data and user information. The program running in the server calculates and analyzes the data, provides data services for the display interface layer, and provides standard data interfaces for other users or systems.

2.2.1. Design of the Database

Database design refers to the design and optimization of the logical mode and physical structure of the database under a given application environment. It establishes a database and application system to effectively store and manage data [13]. The data in the database are organized, described, and stored according to a certain data model. This results in several advantages such as less redundancy, higher independence, and easy scalability.
MySQL is a relational database management system [14]. This database is small and easy to install and maintain. MySQL is open-source and free, with popular architectures such as LAMP and LNMP. The MySQL database has become the first choice of enterprise users because of its excellent performance and stable service. An E-R (entity relationship) diagram [15] is used to describe the relationship between entity types, attributes, and connections. The E-R diagram is a method of describing conceptual models to facilitate the design of the logical structure of the database. The main entities in this paper’s database are users, the energy consumption monitoring point, and its data. Figure 3 shows the connections between entities. The field designs of the energy consumption monitoring point ant its data are shown in Table 1.
In order to ensure the continuity and accuracy of the energy data in the enterprise, the data collection layer collects data from the node communication network 24 h a day. In the actual operation of the system, it is found that RS-485 communication completes the data collection of one node in an average of 2 s. Calculated in this way, 43,200 records are generated every day, 1,296,000 records are generated every month, and 15,768,000 records are generated every year. Under the premise that the design life of the system is 20 years, it will generate billions of data. Storing such a large amount of data in a single data table will seriously affect the read and write performance of the database.
The split of a data table [16] means that the data stored in a single data table is distributed to multiple data tables according to a certain dimension, so as to reduce the load of a single data table and improve the performance. Common database splitting methods include vertical splitting and horizontal splitting. Vertical splitting is to split a table with many attributes into different tables according to different attributes. The structure of each table after splitting is different, and there is at least one column of intersection between each table. Horizontal splitting refers to splitting a table into multiple tables on the basis of a certain field and according to certain rules. The structure of each table is the same after splitting, but the data of each table are different and there is no intersection.
The database designed in this paper adopted a horizontal split method. The data in the data table were split according to the field of time. Whenever the value of the time column entered a new month, the data were put into a new table. This method realized a data table split by month based on the time field. For example, the data of the year 2020 were scattered into 12 tables. Table 2 shows the data volume of each table and the error rate.
In Table 2, the data table data_202005 stores the data of May 2020. The table has a total of 1,285,634 records. The time value of the first record is “1 May 2020 00:00:00” and the time value of the last record is “31 May 2020 23:59:58”. The data table data_202006 has a total of 1,293,600 records, of which the time value of the first record is “1 June 2020 00:00:00”. A total of 12 tables were established in 2020, and each table corresponds to one month’s data. The data volume of each month is less than the estimated maximum data volume of 1,296,000. Taking into account the power outage and computer restart in the enterprise, the maximum data volume error rate is 0.49%, which belongs to the normal range. In the actual operation of the system, the horizontal split of the data table reduces the data load of a single table, keeps the data volume of each table at the million level, and ensures the speed of data query. The system is able to withstand high concurrency and maintain high stability.

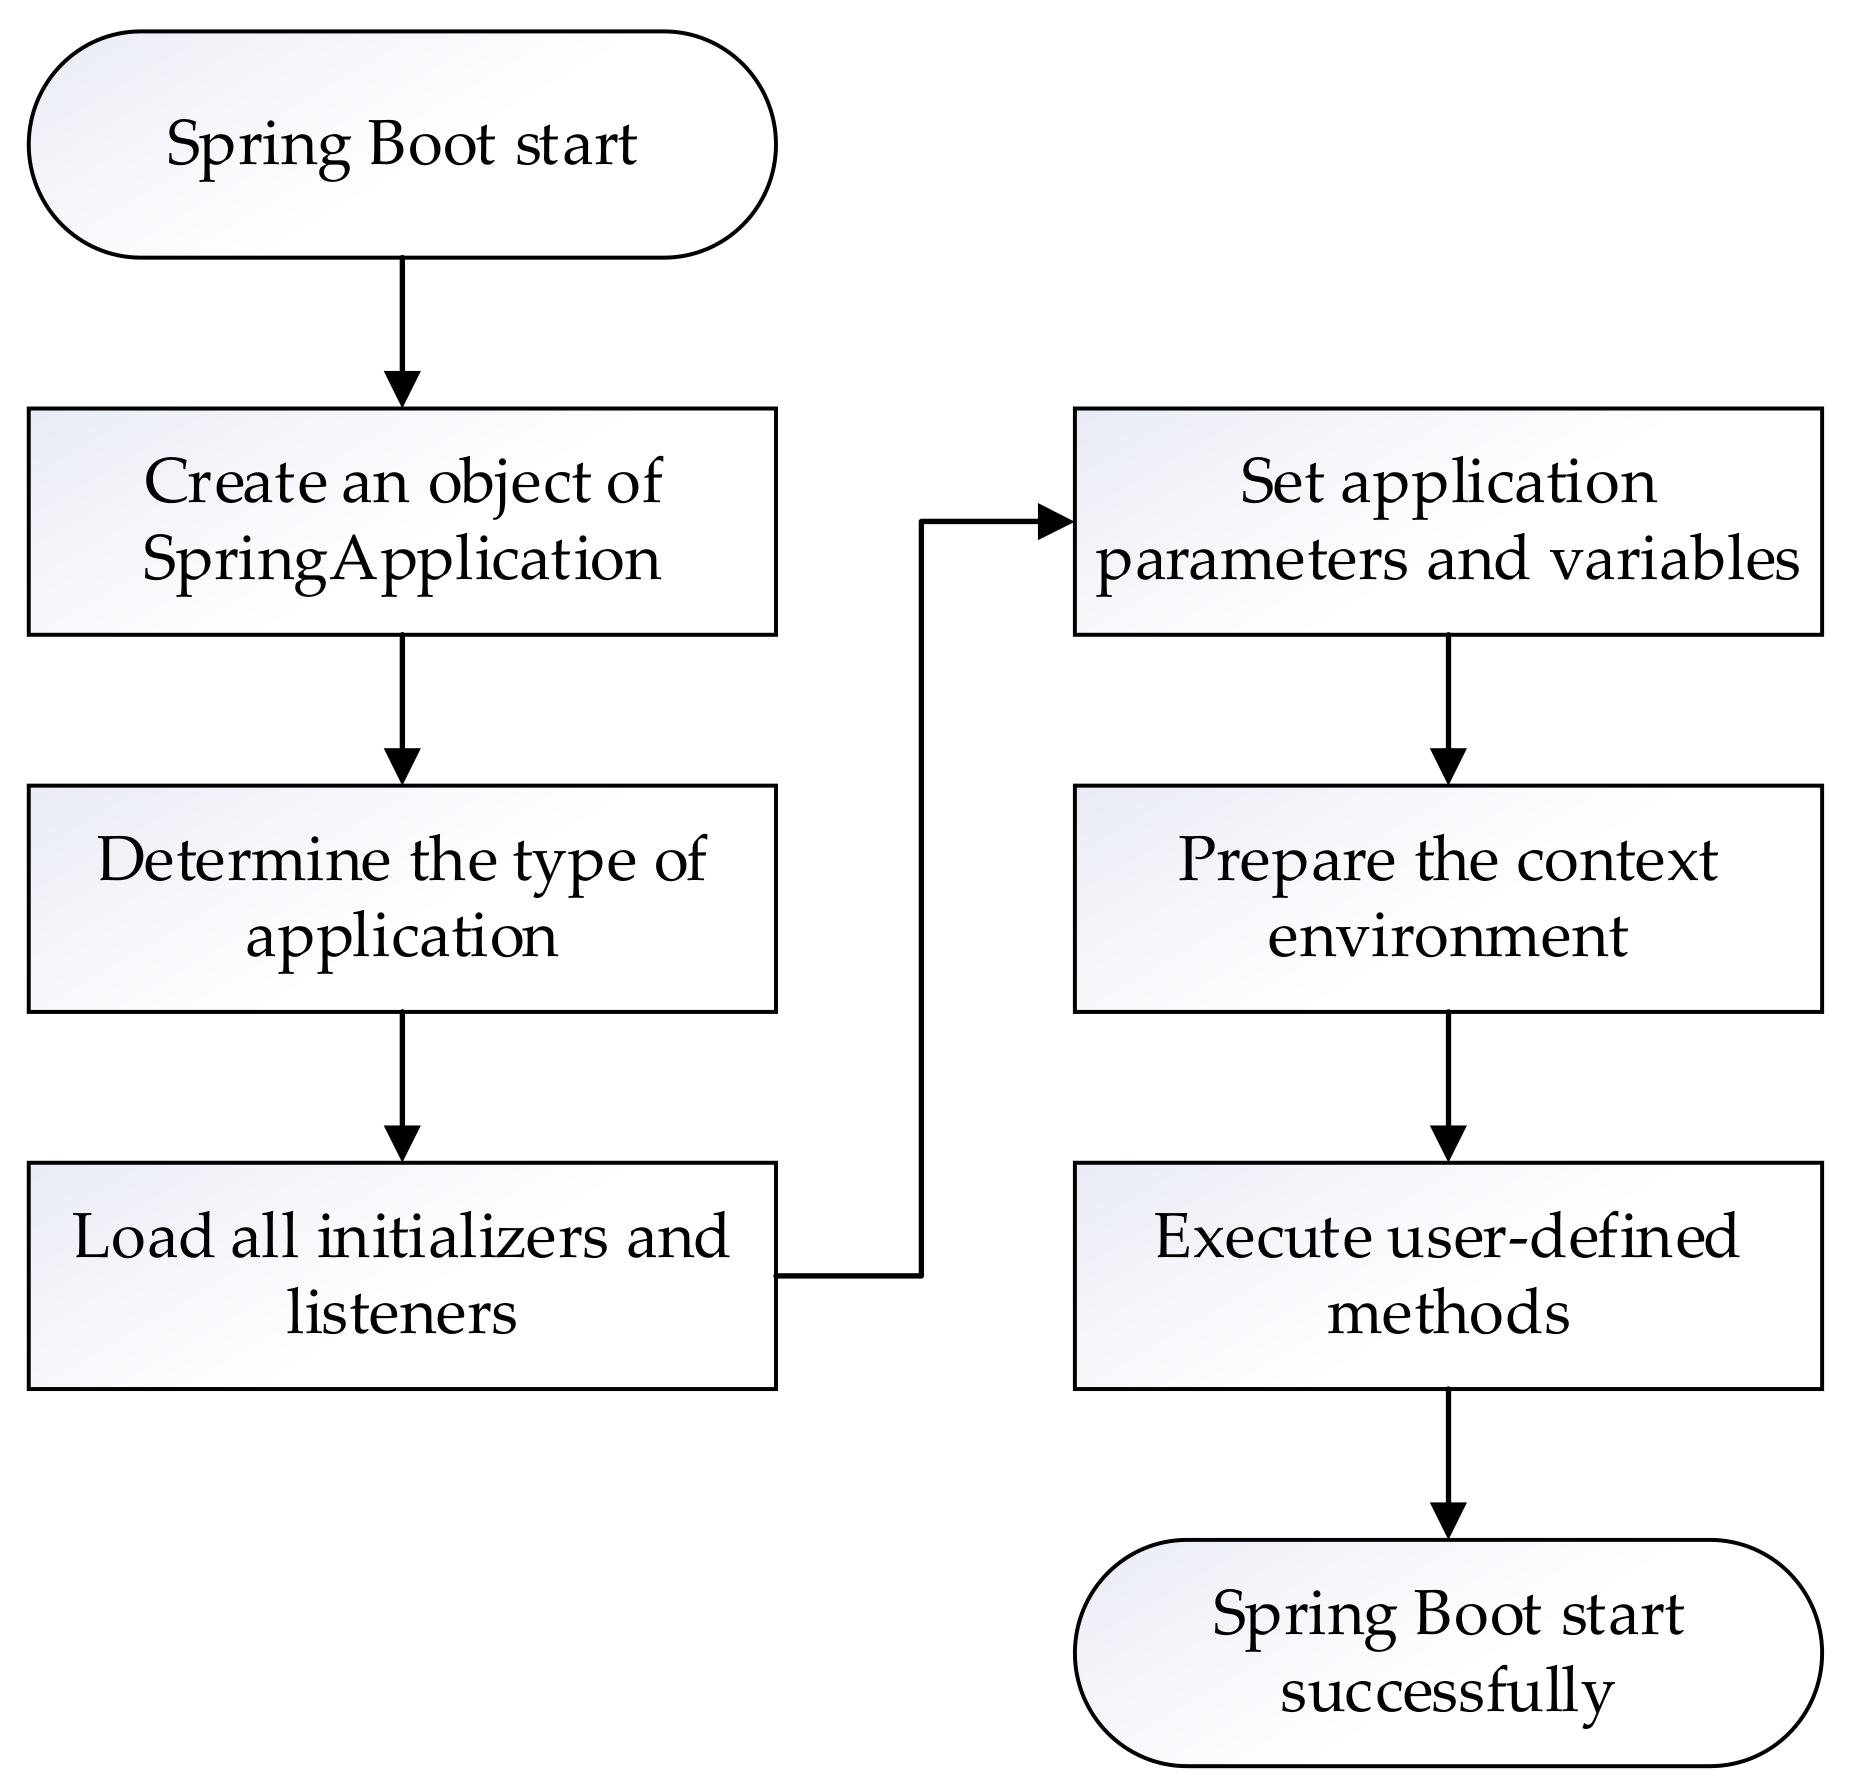
2.2.2. Application of Spring Boot Framework

In the business logic layer, the Spring Boot framework is the core component, which is responsible for collecting, storing, and analyzing data from the data collection layer. It also receives and processes data requests from the display interface layer, as well as provides standard data interface to the external programs.
The Spring Boot framework [17] is a subproject under the Spring project and is currently the most popular Java enterprise-level development framework. The Tomcat server is integrated inside the Spring Boot framework, which can be run directly without deployment. The Spring Boot framework abandons the cumbersome XML configuration files in the traditional framework and is developed on the basis of annotations. Development based on annotations simplifies the configuration and greatly reduces the difficulty of development. When integrating third-party frameworks, Spring Boot can automatically configure and manage dependencies, allowing developers to focus on the design and implementation of business logic. Figure 4 shows the main steps of a Spring Boot application startup process.
From Figure 4, we can analyze the main steps of the Spring Boot application startup process.
  • The system looks for the annotation named @SpringBootApplication and creates an in-stance object of SpringApplication as the main entrance of the program;
  • The type of application is determined (a web application in this case);
  • All initializers and all listeners are loaded;
  • Application parameters and environment variables are set;
  • The context environment is prepared. This is the core step of the Spring Boot framework startup. The dependencies of third-party libraries, automatic configuration, and the startup of the built-in server Tomcat are established in this step;
  • User-defined methods are executed. This marks the completion of the Spring Boot application before normal work can begin.
In step 3, the Spring Boot framework loads all listeners. The listeners can listen to the data request from the front end, forward the request to the handler, and call the user-defined business processing function to respond to the request. In step 5, the Spring Boot framework starts the built-in Tomcat server, provides a basic operating environment, and loads third-party libraries and frameworks. The Vue front-end framework in the interface display layer is integrated in this step. In step 6, the Spring Boot application executes user-defined methods to complete multiple tasks such as database reading and writing, data processing, and performing timing tasks. At this point, a Spring Boot application is started successfully.
The powerful features of Spring Boot provide developers with great convenience. The data query function is taken as an example. First, we add the annotation “@RestController” to the public class DataController to indicate that the class is a control class. Then, we add the annotation “@RequestMapping(“/getDataById/{id}”)” to the method public String getDataById (@PathVariable Integer id) in the class. The Spring Boot framework automatically maps to the corresponding method according to the address of the request url, extracts the parameter id in the url, and provides it to the method for internal use. Finally, we write a specific business logic code in the method body, e.g., executing SQL statements and returning the queried data in the form of a string. The development of the function of data query according to the id is completed. In the Spring Boot framework, all configurations are in a file named application.yaml, i.e., the database driver, login name, and password. The framework automatically loads the configuration file and establishes a database connection. Developers only need to write SQL statements to complete data query.

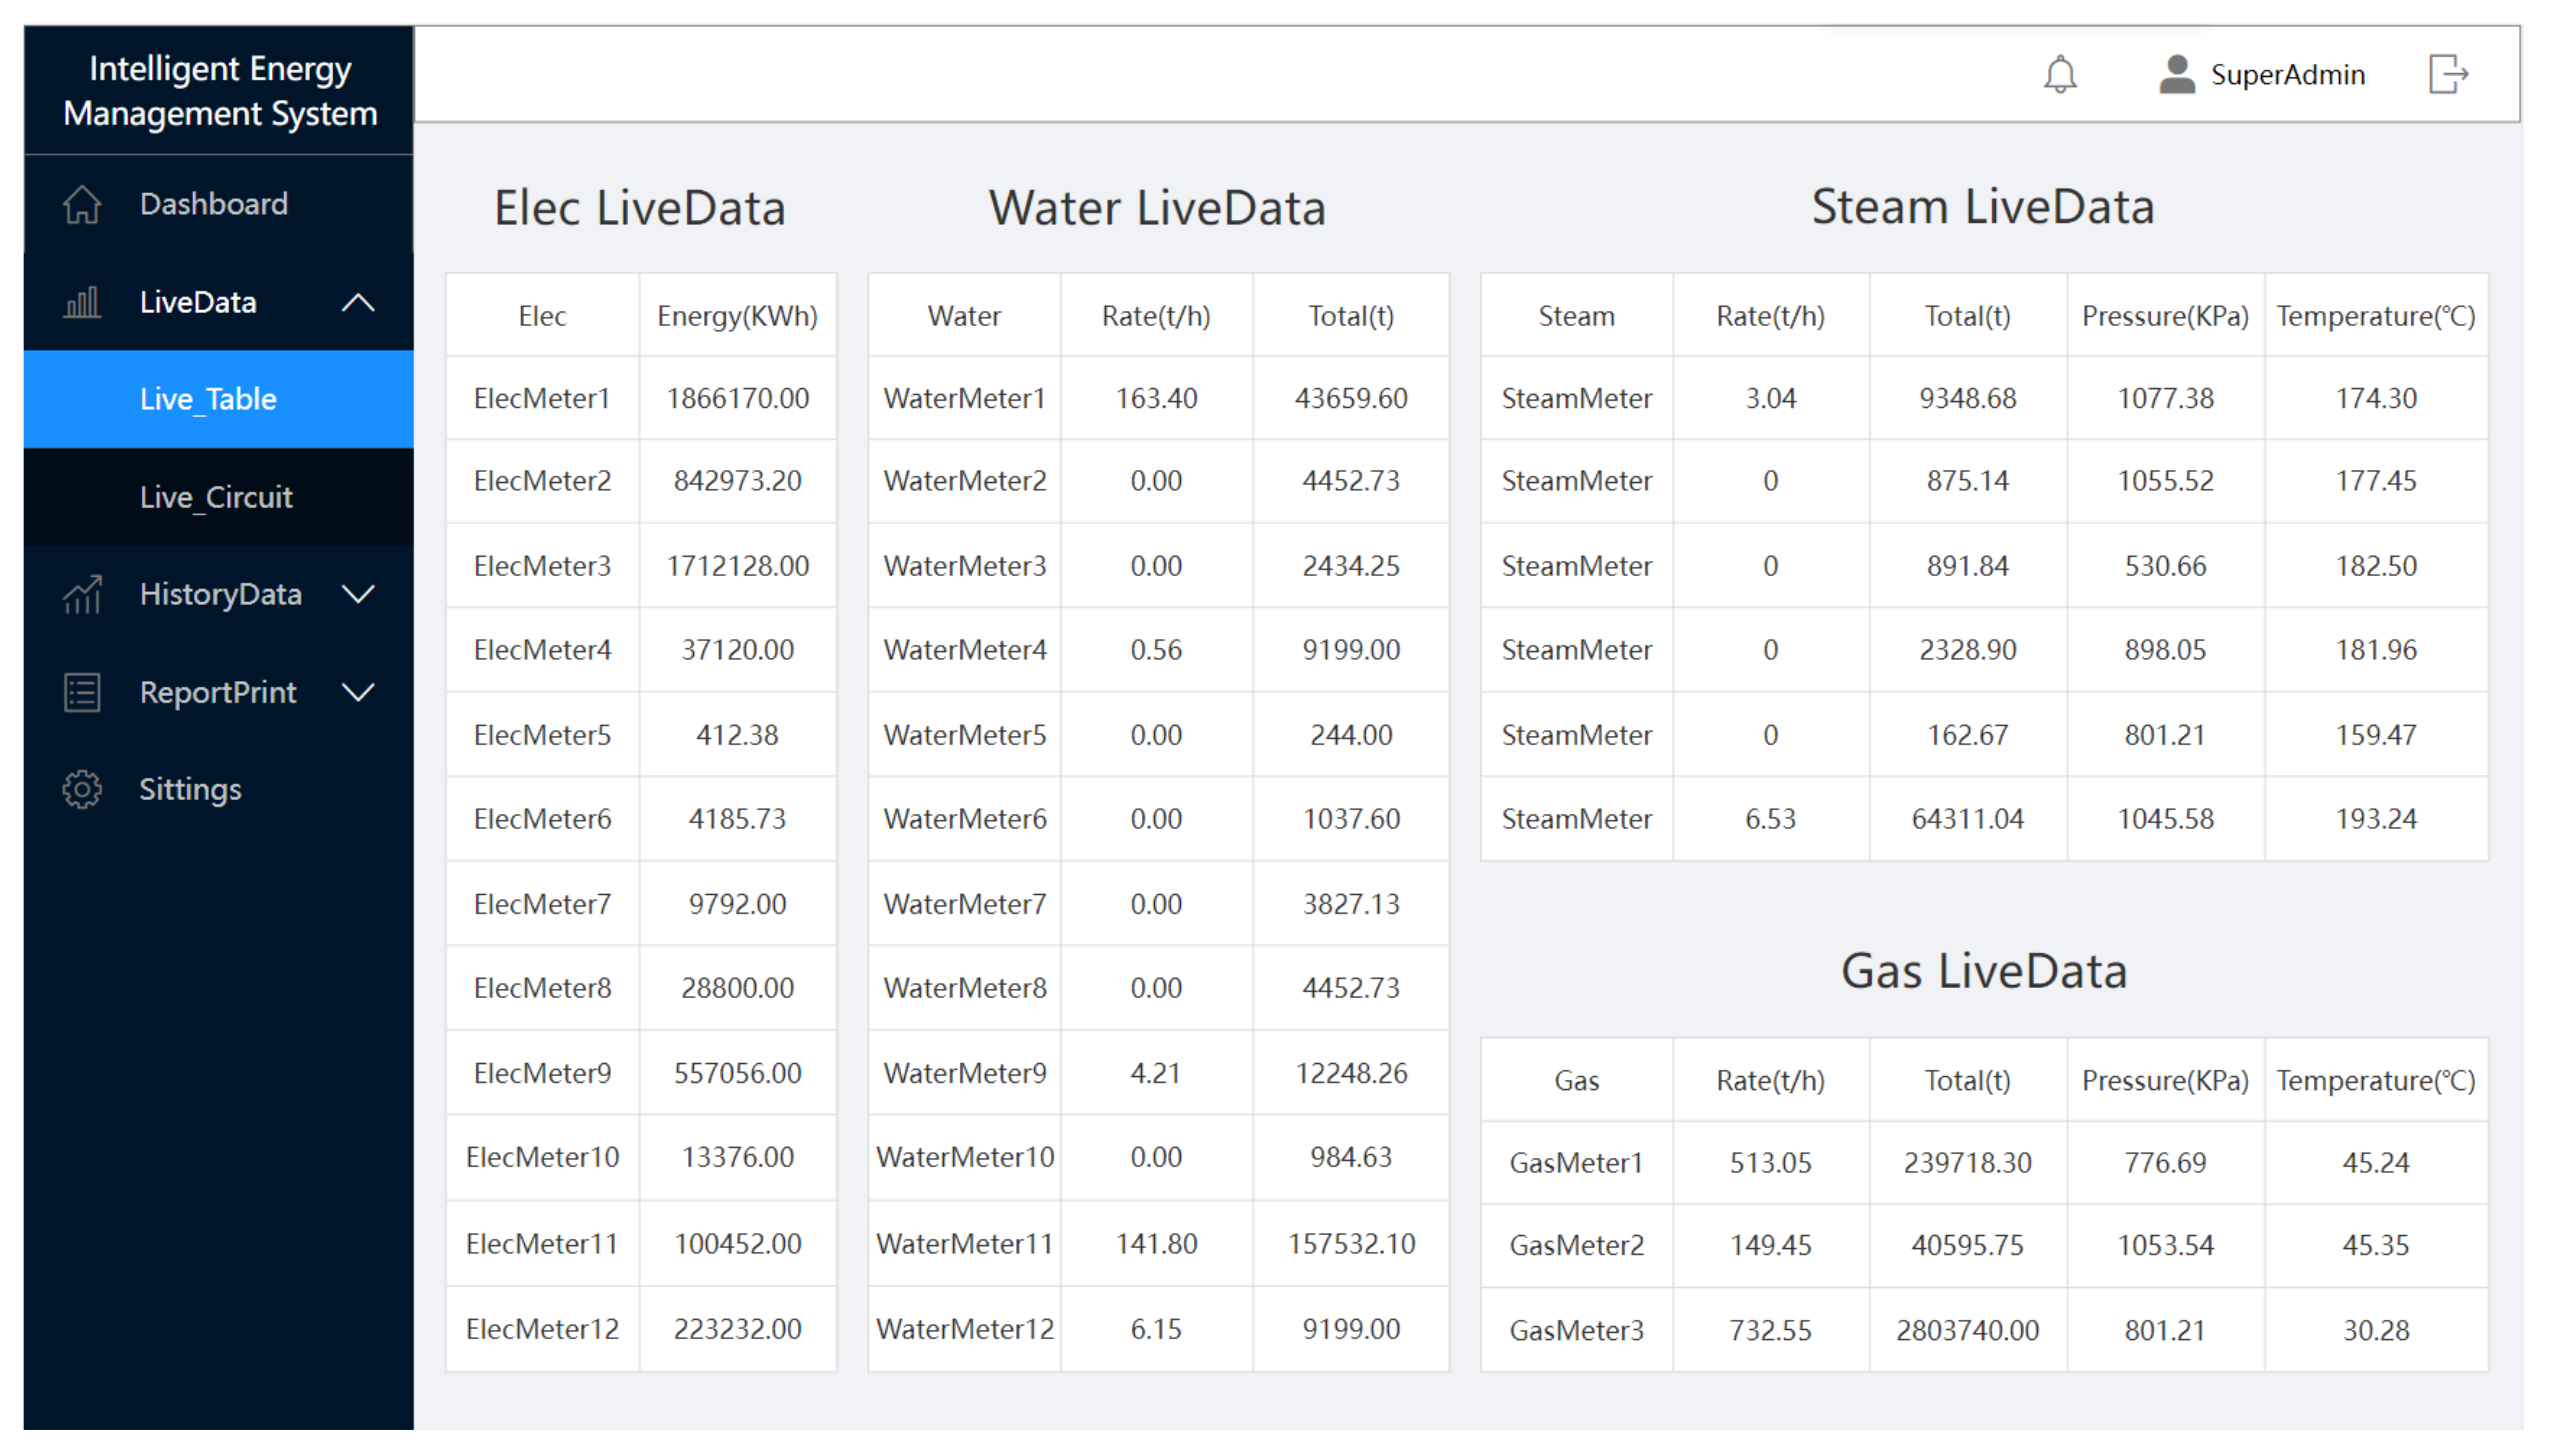
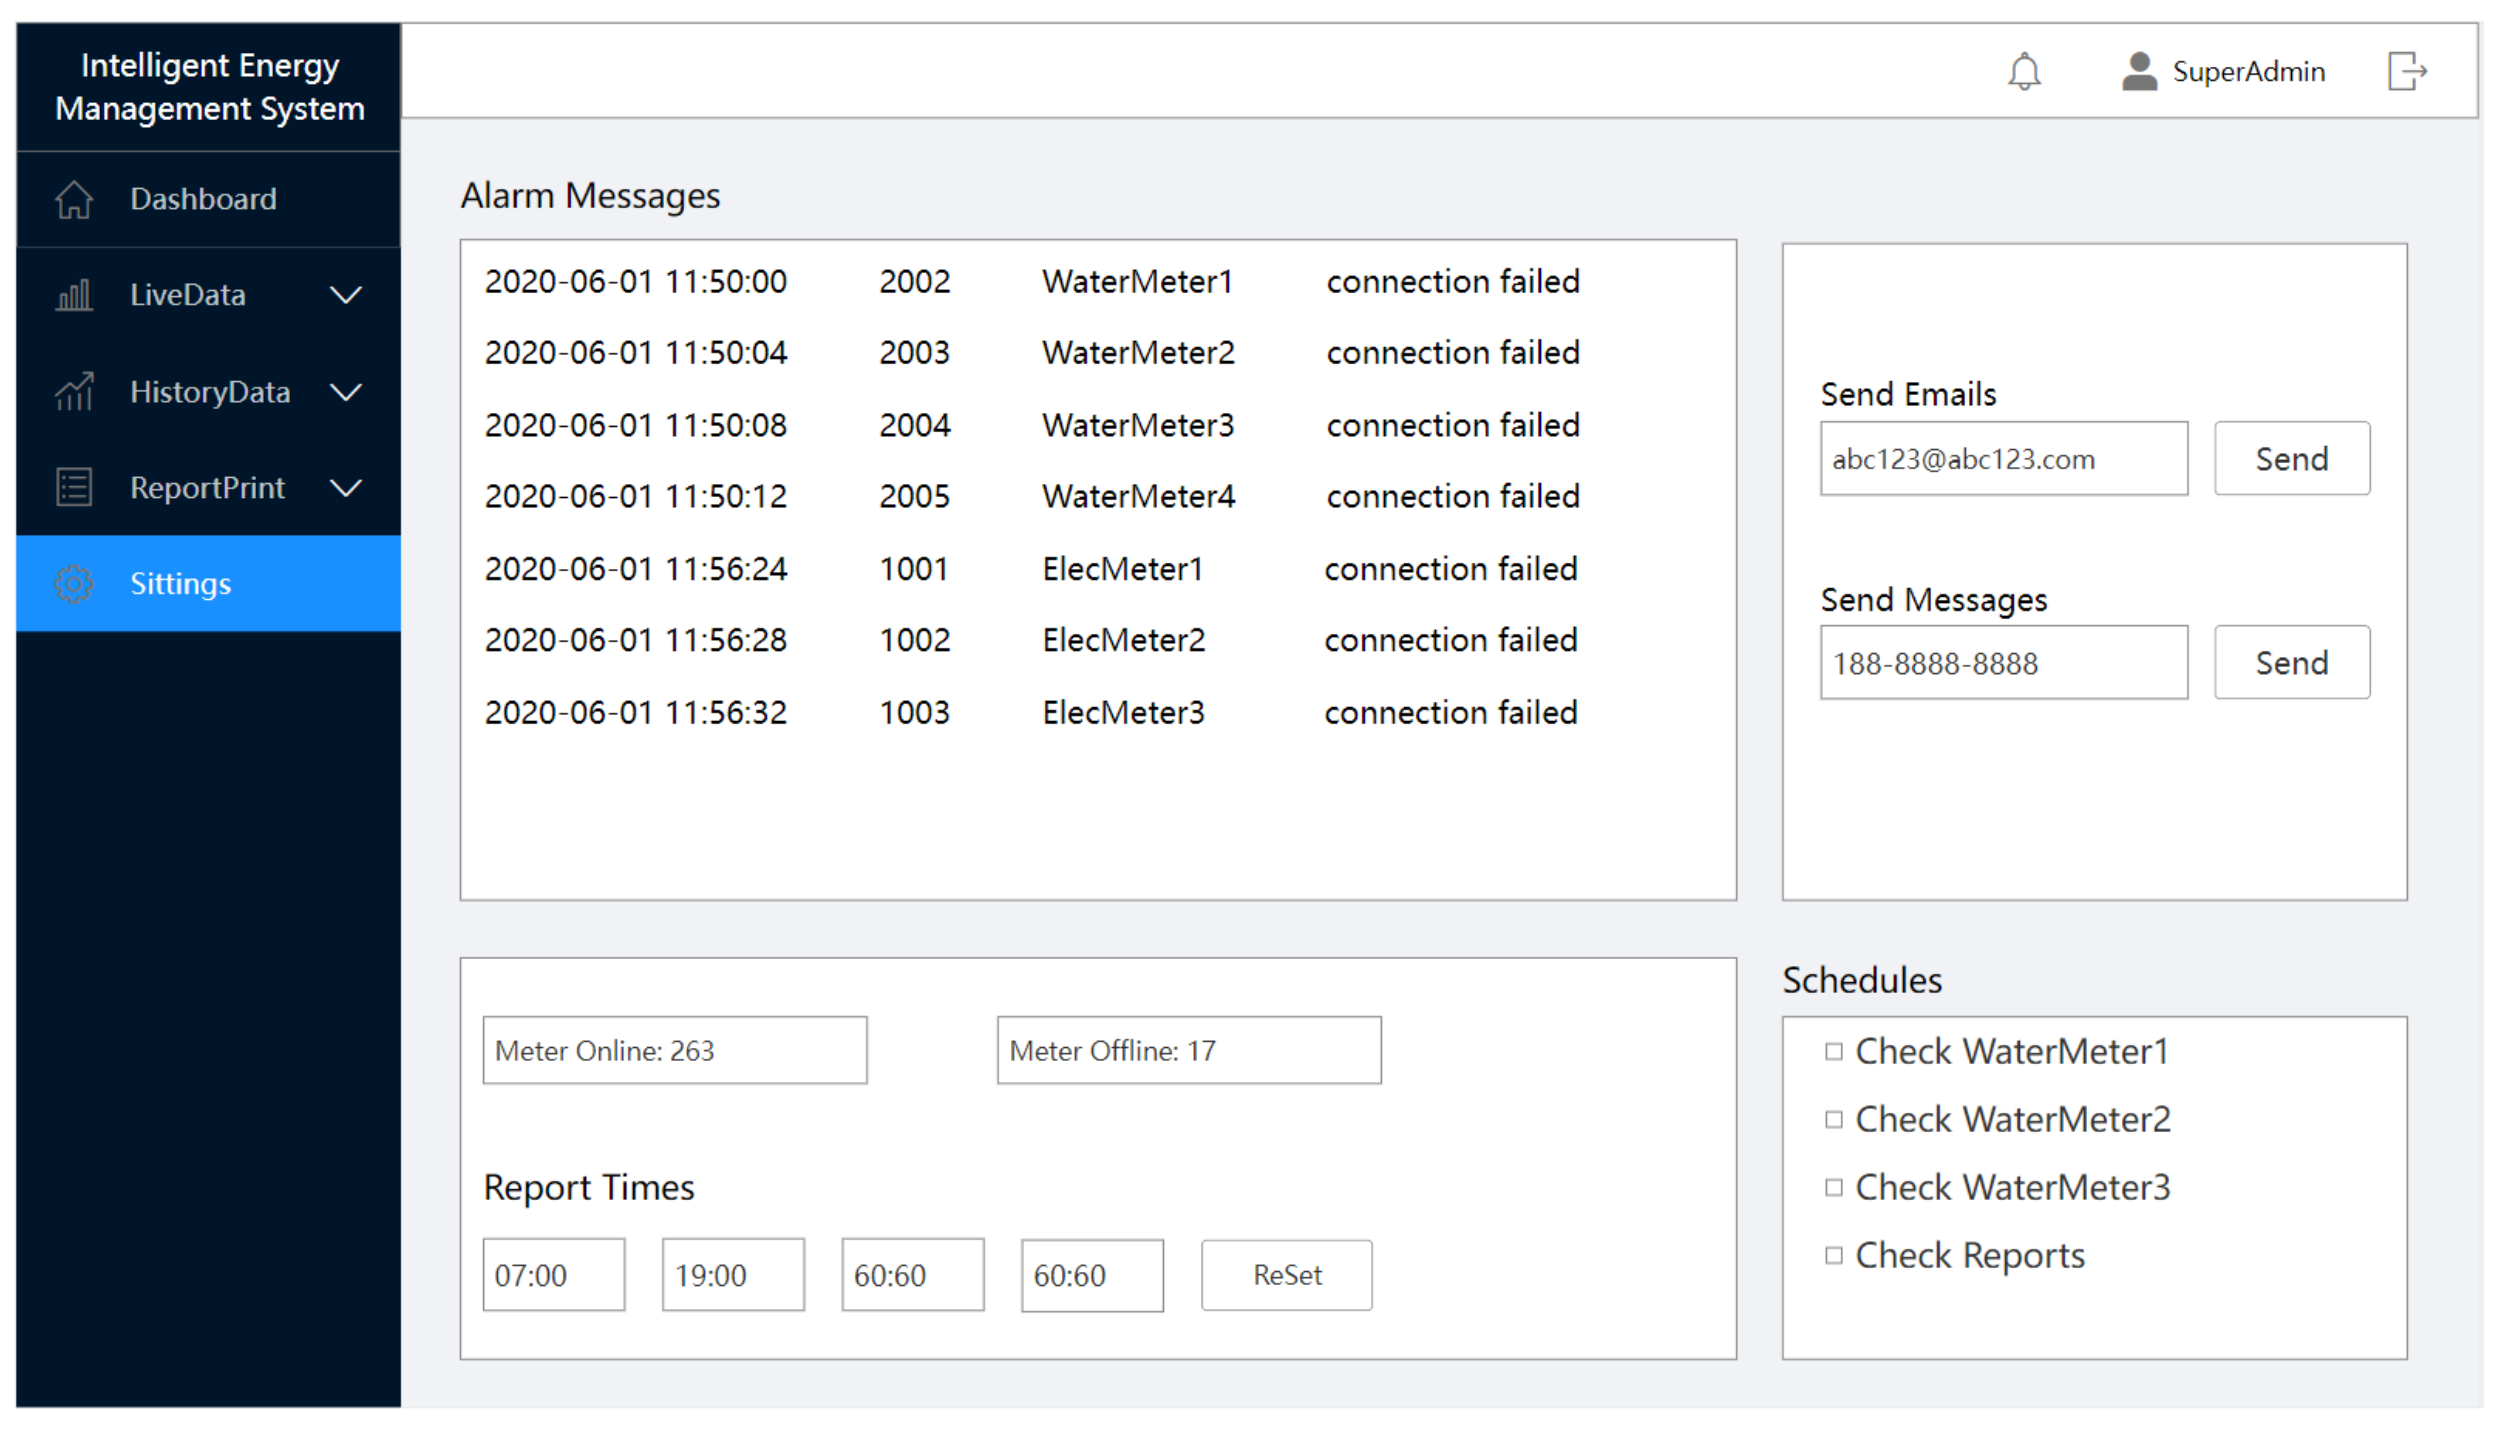
2.3. Display Interface Layer

The display interface layer is used to display the data analysis results of the business logic layer. This layer realizes several functions such as login, registration, and query. It also provides a human–computer interaction interface. The display layer is developed on the basis of the Vue framework, combined with the ECharts, an open-source visualization chart library, to provide users with a set of front-end display interfaces with complete functions and convenient operation.
Vue is a progressive framework for building user interfaces [18]. Unlike other monolithic frameworks, Vue is designed from the ground up to be incrementally adoptable. It is not only easy to use, but also easy to integrate with third-party libraries or existing projects. According to the design idea of MVVM (model–view–viewmodel), Vue realizes the two-way binding of data and view, reduces the coupling degree of each part, and is more flexible to use. The Vue framework can be directly integrated into the Spring Boot framework, and the Spring Boot framework can help complete automatic configuration. Figure 5 is a schematic diagram of the MVVM mode of the Vue framework.
ECharts is an open-source visualization library based on JavaScript [19], covering various industry charts. It can run smoothly on desktop and mobile terminals, and it is compatible with multiple browsers. The introduction of ECharts is simple. Through the setting of configuration items, you can control the data presentation and visual effects. ECharts realizes the interaction between users and data through rich components and highly personalized visualization solutions, thereby enhancing users’ ability to acquire knowledge and optimize data analysis.
This system uses the Vue front-end framework and ECharts to design the web display interface of the energy management system. In the B/S architecture, the web interface can be accessed by a browser, with a rich interface and convenient operation.

2.4. Development Cost Calculation

The display interface layer is used to display the data analysis results of the business logic layer. This layer realizes several functions such as login, registration, and query. It also provides a human–computer interaction interface.
In the data collection layer, the energy consumption monitoring point and the node communication network are composed of various hardware equipment, and the construction cost is relatively high. In the energy consumption monitoring point, the cost of one electric energy meter is about 300 USD. The flow meters are available in large and small diameters. The costs are 400 and 250 USD, respectively. The cost of one totalizer is approximately 150 USD. In the node communication network, the twisted pair shielded wire used for connection is 30 USD per 100 m. The price of hubs and repeaters is approximately 100 and 50 USD, respectively.
In the enterprise, a total of 196 electric energy meters, 84 flow meters including 57 large-diameter and 27 small-diameter meters, and 52 totalizers are deployed. The total cost is about 101,150 USD. The total cost of hubs, repeaters, and twisted pair shielded cables is approximately 55,000 USD.
In the data collection layer, the cost of hardware equipment is difficult to reduce and, thus, it costs a lot of money. We hope that, at the software level, we can appropriately reduce costs while ensuring safety and functionality. Therefore, the open-source framework represented by Spring Boot has come into focus. The business logic layer and the display interface layer make extensive use of various open-source frameworks and components. MySQL is a high-performance open-source database, and the Spring Boot framework is also the most popular Java enterprise-level development framework. Vue and Echarts are also widely used front-end open-source frameworks. Whether using Spring Boot or Vue, technically, you can get substantial support and assistance from the community. In particular, the Spring Boot framework has been maintained and updated by the authorities in the past 10 years to ensure security and stability. In these two layers, the cost of system construction mainly comes from hiring developers and software debugging and maintenance.
Taking into account the differences in different regions and the length of the construction period, the cost of hiring workers and developers is quite different. In this project, the personnel cost was approximately 50,000 USD. The construction cost of the entire energy management system was approximately 210,000 UAD.

3. System Operation and Analysis

The energy management system was officially deployed in a manufacturing enterprise in December 2019 and has been operating stably for more than 600 days. Figure 6 shows the large-screen display interface of the energy management system.
Because it is outside of the actual production environment, it is impossible to obtain the latest data. The data in the figure are simulated values in a laboratory environment. In Figure 6, the main interface shows the consumption of electricity, water, and steam in the enterprise. It also displays the electricity consumption in different months and the proportion of energy consumption in the main area. A brief alarm message is displayed in the lower left corner of the interface. The large-screen display interface is mainly used by visitors to determine the energy management of the enterprise.
Figure 7 shows the backend interface of the energy management system.
From Figure 7, we can see today’s energy consumption, yesterday’s energy consumption, and the cumulative energy consumption of this month in the enterprise. At the same time, we can view the daily consumption within a certain period of time by setting the time range. The ranking on the right is the energy consumption monitoring points with the most usage during the time period and their usage. The background interface of the energy management system provides data visualization and analysis functions for enterprise managers.
Figure 8 shows the real-time data interface.
From Figure 8, we can see the real-time data of the energy consumption monitoring points in the production area. The electric energy monitoring points display the electricity consumption, the water and steam energy consumption monitoring points display the instantaneous flow and cumulative flow, and the steam and compressed air energy consumption monitoring points also record pressure and temperature.
Figure 9 shows the historical data query interface. Water consumption is taken as an example. In this interface, you can query the water consumption of a single or multiple energy consumption monitoring points.
Figure 10 shows the settings interface. In this interface, all alarm messages are shown and can be sent to a specific email or phone. Managers can change the times that reports are automatically printed.

4. Conclusions

This paper designed and implemented an energy management system based on the Spring Boot framework, which has run stably for more than 600 days in the actual production environment. The system has a three-tier architecture: from bottom to top, data collection layer, business logic layer, and display interface layer. The data collection layer monitors all energy consumption monitoring points in the enterprise in real time, ensuring the integrity and continuity of the data. In the business logic layer, the database is split horizontally, which greatly reduces the data load of a single table. The maximum data storage capacity of a single table is 1,296,000, and the data query efficiency is extremely high. The Spring Boot framework can provide stable data services, making it easy to maintain and extend functions. At the display interface layer, the display interface developed using Vue and ECharts is rich in functions and easy to operate. The various functions of the system can operate normally and stably, which provides convenience for the management and control of enterprise energy consumption. For the cost of construction, the hardware cost is based on the quantity and price of the device, and the personnel cost is based on the working hours. Accordingly, the total cost of the energy management system can be estimated. In this paper, the total cost of construction was approximately 210,000 USD.
The system is currently deployed in the internal server of the enterprise, and the energy management interface can only be accessed by computers in the same local area network. In the future, the system can be deployed in a cloud server, and mobile phone-side adaptation and enhanced identity authentication can be implemented to realize any device to access and manage the system anytime and anywhere. For the node communication network, wireless transmission technology such as 5G will be adopted in the future, and data will be directly transmitted to the server in the cloud to reduce the local residence time of data and avoid possible data injection and tampering. For the data security issues of cloud deployment, in the future, in addition to relying on Spring Boot’s security framework and regular database backups, the system will enhance the identity authentication of logged in users, record the user’s IP address and sensitive operation behavior, and perform data transmission during transmission. The secondary encryption increases the difficulty of data cracking, thereby improving the stability of the communication network and the data security of the cloud system.

Author Contributions

F.Z. and G.S. conceptualized the research; F.Z. implemented the experimental design; B.Z. and L.D. conducted data analysis; F.Z. wrote the first draft; B.Z. reviewed and edited the paper; G.S. acquired funding. All authors have read and agreed to the published version of the manuscript.

Funding

This work was supported by the Tianjin Science and Technology Major Project and Engineering (No.18ZXRHNC00140) and Tianjin Key Laboratory of Optoelectronic Sensor and Sensor Network Technology.

Institutional Review Board Statement

Not applicable.

Informed Consent Statement

Not applicable.

Data Availability Statement

Not applicable, the study does not report any data.

Conflicts of Interest

The authors declare no conflict of interest.

References

  1. Wei, J.Y.; Zhao, X.Y.; Sun, X.S. The evaluation model of the enterprise energy efficiency based on DPSR. Environ. Sci. Pollut. Res. 2019, 26, 16835–16846. [Google Scholar] [CrossRef] [PubMed]
  2. Goncalves, V.S.; Jose, M. Energy management system iso 50001:2011 and energy management for sustainable development. Energy Policy 2019, 133, 110868. [Google Scholar]
  3. Irtija, N.; Sangoleye, F.; Tsiropoulou, E.E. Contract-Theoretic Demand Response Management in Smart Grid Systems. IEEE Access 2020, 8, 184976–184987. [Google Scholar] [CrossRef]
  4. Yu, M.; Yue, G.; Song, J.; Pang, X. Research on intelligent city energy management based on internet of things. Clust. Comput. 2019, 22, S8291–S8300. [Google Scholar] [CrossRef]
  5. Raji, M.N.; Maksimovi, R.M.; Milosavljevi, P.; Pavlovi, D. Energy Management System Application for Sustainable Development in Wood Industry Enterprises. Sustainability 2019, 12, 76. [Google Scholar] [CrossRef] [Green Version]
  6. Jia, B. Research and Application of Small Area Energy Management System. Master′s Thesis, Shandong University, Jinan, China, 8 June 2020. [Google Scholar]
  7. Sa, A.; Thollander, P.; Rafiee, M. Industrial Energy Management Systems and Energy-Related Decision-Making. Energies 2018, 11, 2784. [Google Scholar] [CrossRef] [Green Version]
  8. Choi, J.S. Energy Management Agent Frameworks: Scalable, Flexible, and Efficient Architectures for 5G Vertical Industries. IEEE Ind. Electron. Mag. 2021, 15, 62–73. [Google Scholar] [CrossRef]
  9. Barabanova, I.A.; Kravets, O.J.; Tkalich, S.A.; Muting, D.I. Analysis of the intermediate layer work in the three-tier architecture “client-server” of automation engineering problems. IOP Conf. Ser. Mater. Sci. Eng. 2019, 537, 032011. [Google Scholar]
  10. Zhao, Y.J.; Ma, J.N.; Li, S.J.; Li, J. Design of Modbus Wireless Communication System Based on Remote Data Transmission. In Proceedings of the 2016 International Forum on Mechanical, Control and Automation, Shenzhen, China, 30–31 December 2016. [Google Scholar]
  11. Yue, G. Design of Intelligent Monitoring and Control System Based on Modbus. In Proceedings of the 5th International Conference on Communication, Image and Signal Processing, Chengdu, China, 13–15 November 2020. [Google Scholar]
  12. Wang, S.; You, H.; Yue, Y.; Cao, L. A novel topology optimization of coverage-oriented strategy for wireless sensor networks. Int. J. Distrib. Sens. Netw. 2021, 17. Available online: https://journals.sagepub.com/doi/full/10.1177/1550147721992298 (accessed on 2 November 2021). [CrossRef]
  13. Yang, Y.; Mei, Z.; Zheng, B.; Qiu, S. Design of Enterprise Management System Based on Edge Computing Architecture. Mob. Inf. Syst. 2021, 2021, 5512958. [Google Scholar]
  14. Eyada, M.; Saber, W.; Genidy, M.; Amer, F. Performance Evaluation of IoT Data Management Using MongoDB Versus MySQL Databases in Different Cloud Environments. IEEE Access 2020, 8, 110656–110668. [Google Scholar] [CrossRef]
  15. Ordonez, C.; Al-Amin, S.T.; Bellatreche, L. An ER-Flow Diagram for Big Data. In Proceedings of the 2020 IEEE International Conference on Big Data (Big Data), Atlanta, GA, USA, 10–13 December 2020; Available online: https://www.webofscience.com/wos/alldb/full-record/WOS:000662554705140 (accessed on 2 November 2021).
  16. Liu, T.Y. Design and Implementation of Distributed Mall Based on SSM. Master′s Thesis, China University of Geosciences, Beijing, China, May 2020. [Google Scholar]
  17. Miao, K.H.; Li, J.; Hong, W.X.; Chen, M.T. A Microservice-Based Big Data Analysis Platform for Online Educational Applications. Sci. Program. 2020, 2020, 6929750. Available online: https://www.hindawi.com/journals/sp/2020/6929750/ (accessed on 2 November 2021). [CrossRef]
  18. Li, M.H.; Hu, J.H.; Lin, X.W. The Development of Web Application Front-End of Intelligent Clinic Based on Vue.js. In Proceedings of the 2019 Chinese Intelligent Automation Conference, Nanjing, China, 20–22 September 2019; Lecture Notes in Electrical Engineering. Available online: https://link.springer.com/chapter/10.1007/978-981-32-9050-1_77 (accessed on 2 November 2021).
  19. Ban, X.J.; Wang, B.; Cheng, C.X.; Taghzouit, S. Iron and Steel Enterprises Big Data Visualization Analysis Based on Spark. In Proceedings of the 15th International Conference on Cooperative Design, Visualization and Engineering, Hangzhou, China, 21–24 October 2018; Lecture Notes in Computer Science. Available online: https://link.springer.com/chapter/10.1007%2F978-3-030-00560-3_39 (accessed on 2 November 2021).
Figure 1. Overall system architecture.
Information 12 00457 g001
Figure 2. Communication network architecture.
Information 12 00457 g002
Figure 3. Connections between entities.
Information 12 00457 g003
Figure 4. The startup process of the Spring Boot application.
Information 12 00457 g004
Figure 5. Schematic diagram of MVVM mode of Vue framework.
Information 12 00457 g005
Figure 6. The large-screen display interface.
Information 12 00457 g006
Figure 7. Backend interface.
Information 12 00457 g007
Figure 8. Real-time data interface.
Information 12 00457 g008
Figure 9. Historical data query interface.
Information 12 00457 g009
Figure 10. Settings interface.
Information 12 00457 g010
Table 1. Design of fields in data table.
FieldsTypeRemarks
idint (4)Unique number
namevarchar (50)Name of meter
addressint (4)Modbus address
typeint (4)Type of meter
timedatetime (0)Data collection time
ratedecimal (18.2)Instantaneous flow
totaldecimal (18.2)Cumulative flow
temperaturedecimal (18.2)Temperature
pressuredecimal (18.2)Pressure
Table 2. Data volume and error rate of 12 data tables in 2020.
Data TablesData VolumeError Rate
data_2020011,293,3990.20%
data_2020021,293,8520.17%
data_2020031,292,9640.23%
data_2020041,294,0020.15%
data_2020051,289,6340.49%
data_2020061,293,6000.19%
data_2020071,292,6460.26%
data_2020081,294,8920.09%
data_2020091,293,9960.15%
data_2020101,294,2680.13%
data_2020111,293,9830.16%
data_2020121,294,1030.15%
Publisher’s Note: MDPI stays neutral with regard to jurisdictional claims in published maps and institutional affiliations.

