Article

An Effective Ensemble Automatic Feature Selection Method for Network Intrusion Detection

School of Cyber Science and Engineering, Zhengzhou University, Zhengzhou 450001, China
*
Author to whom correspondence should be addressed.
Information 2022, 13(7), 314; https://doi.org/10.3390/info13070314
Submission received: 14 May 2022 / Revised: 21 June 2022 / Accepted: 24 June 2022 / Published: 27 June 2022
(This article belongs to the Topic Big Data and Artificial Intelligence)

Abstract

:
The mass of redundant and irrelevant data in network traffic brings serious challenges to intrusion detection, and feature selection can effectively remove meaningless information from the data. Most current filtered and embedded feature selection methods use a fixed threshold or ratio to determine the number of features in a subset, which requires a priori knowledge. In contrast, wrapped feature selection methods are computationally complex and time-consuming; meanwhile, individual feature selection methods have a bias in evaluating features. This work designs an ensemble-based automatic feature selection method called EAFS. Firstly, we calculate the feature importance or ranks based on individual methods, then add features to subsets sequentially by importance and evaluate subset performance comprehensively by designing an NSOM to obtain the subset with the largest NSOM value. When searching for a subset, the subset with higher accuracy is retained to lower the computational complexity by calculating the accuracy when the full set of features is used. Finally, the obtained subsets are ensembled, and by comparing the experimental results on three large-scale public datasets, the method described in this study can help in the classification, and also compared with other methods, we discover that our method outperforms other recent methods in terms of performance.

1. Introduction

As technology advances, there are even more devices connected to the Internet and data traffic on the network increases. This results in the Internet facing an increased attack surface, increasing the possibility that the network will be destroyed and that this threat will always be present [1]. The resulting risk of property damage and information leakage caused by cyberattacks is becoming an important issue in need of a solution [2]. Intrusion detection systems (IDSs) can identify network attacks, including unauthorized access, denial of service attacks, etc. [3].
Anomaly-based detection, misuse-based detection, and hybrid detection are the most common types of intrusion detection systems [4,5]. Traditionally, anomaly detection and misuse detection have been studied from two perspectives [6]. Anomaly-based detection first establishes a normal network access pattern and then accesses that are found to be different from the normal pattern are judged to be anomalous. An anomaly-based IDS has the advantage of being able to detect known attacks and 0-day attacks, and the disadvantage is the high false alarm rate [7]. The misuse-based intrusion detection technique compares the behavior of an attacker trying to compromise the system with the activity behavior of a known user. It compiles a library of known malicious characteristics, which may then be compared to detect known assaults [8]. An IDS that is based on misuse does not produce a huge false-positive rate, but it does not discover new attacks and the feature database needs to be continuously updated [4].
As the network traffic continues to increase, the amount of data generated is getting enormous, which increases the computational cost to some extent [9]. Furthermore, the data contain redundant and irrelevant information, resulting in lower classification accuracies and more false positives [10]. The process of selecting the most useful features for a model is known as feature selection. It reduces the dimensionality and computational cost of the data and improves the classifier’s performance, and it is more useful for visualization and human understanding [10,11].
Currently, the main feature selection methods are based on filtered, wrapped, and embedded methods [19]. The filtered method calculates the correlations between both features and labels, as well as between features, before ranking the features and selecting the top-ranked features as feature subsets [10]. Meanwhile, the wrapped method is a model-based feature selection, which optimizes the search subset by evaluating the objective function of the model to obtain the best subset [12]. The advantage of the filtered approach is that it is computationally efficient while not relying on a specific classification algorithm; the disadvantage is that the performance is slightly worse [13]. Wrapped methods have the advantage of good performance but require a search of the feature space and face the problem of a long search time [14]. Embedded methods combine the classification process with the feature selection process [15] and perform feature selection along with classification, depending on the specific classification algorithm. Moreover, ensemble feature selection models can address the bias of individual methods for feature evaluation and enhance the performance of feature subsets [16,17,18,19,20,21].
This paper designs a novel intrusion detection framework that removes irrelevant and redundant features to improve the model detection accuracy and reduce the training time. The following is a list of our contributions.
  • This paper proposes an automatic feature selection method and designs a hybrid normalized score of mixed (NSOM) for the comprehensive evaluation of a subset performance. This method is able to select feature subsets dynamically and overcome the drawback of fixed thresholds.
  • In this paper, an ensemble feature selection method is designed to improve the performance of feature subsets in classification by the intersection and union of different subsets.
  • The methodologies designed in this paper are validated on the UNSW-NB15, CIC-IDS2017, and CSE-CIC-IDS2018 datasets and compared with the latest results. The outcomes of the experiments suggest that our framework can produce better results.
The remainder of this work is constructed as follows. The development of the research on feature selection-based intrusion detection systems is presented in the Section 2. The method proposed in this research is detailed in full in the Section 3. The Section 4 contains the experimental results and analyses. In the Section 5, a summary of the entire article is presented.

2. Related Work

In intrusion detection systems, as network attacks become more complex and network traffic features become more numerous, it is easy to fall into dimensional disasters [10,22]. Selection is the method of determining a subset of features from the initial feature set that can be classified correctly [23] by minimizing the number of features, decreasing the computation time, and increasing model accuracy.
Bansal et al. [24] used XGBoost for data classification, and the experimental results on the CIC-IDS2017 dataset showed that XGBoost was more accurate than other methods. Fitni et al. [25] used the Spearman correlation coefficient to select important features from the CSE-CIC-IDS2018 dataset and achieved an accuracy of 98.8% on the integrated model. Lin et al. [26] utilized a Long Short Term Memory Network (LSTM) with the attention mechanism incorporated to identify attacks and imbalance processing using SMOTE and achieved 96.2% accuracy on the CSE-CIC-IDS2018 dataset.
A wrapped method based on a swarm intelligence search was also applied to choose the greatest subset. Chaouki et al. [27] applied a genetic algorithm to determine the optimal subset, and experiments on the KDD CUP99 and UNSW-NB15 datasets showed that the performance after feature reduction remained essentially the same as the original features. Zhou et al. [28] combined correlation and bat optimization to classify using an ensemble classifier with multi-classification accuracies of 99.81% on the NSL-KDD dataset, 99.52% on the AWID dataset, and 99.89% on the CIC-IDS2017 dataset. Nazir et al. [29] proposed a taboo search–random forest (TS-RF)-based wrapped feature selection method, which can minimize the number of features and the number of false alarms while improving the classification accuracy. On multiple datasets, Farahani et al. [30] suggested a Cross-Correlation (CCFS)-based feature selection method, which was compared to the Cuttlefish optimization method and mutual information, and the method achieved better results in several metrics, such as accuracy and precision. Benmessahel et al. [31] combined the locust swarm optimization (LSO) algorithm with a feedforward neural network. This contributed to improving the algorithm convergence speed and reducing the possibility of falling into local optima, achieving detection rates of 99.33% and 89.83% on the NSL-KDD and UNSW-NB15 datasets, respectively. Vijayanand et al. [32] proposed a genetic algorithm-based selection method that achieves better results for the evaluation of the CIC-IDS2017 dataset by selecting the important features of each class of attacks.
For filtered and embedded methods, there are no clear criteria for determining the subset size or threshold. On the KDD CUP99 dataset, Akashdeep et al. [33] selected features based on information gain and relevancy. Then, the features were divided into a group of 10 by importance and taken as merged and intersected sets, respectively. Finally, they achieved better results in the attack classes. Selvakumar et al. [34] combined filtered and wrapped methods on the KDD Cup99 dataset and finally used the selected 10 features to improve the detection performance while reducing the computation time. Kshirsagar et al. [35] combined information gain and correlation by selecting 0, 0.25, and 0.5 thresholds, union features greater than 0.5, intersecting features between 0.25 and 0.5, removing features less than 0.25, and finally merging to obtain the selected subset. Krishnaveni et al. [21] used a univariate integrated feature selection technique combined with the majority voting for validation on the NSL-KDD dataset, based on 10–100% of the different proportions selected for the experiment, and the accuracy and stability were improved. Osanaiye et al. [20] used a multi-filtered approach to obtain different feature sequences and then selected the features in the top third of the different approaches. Finally, based on the number of occurrences of the features, a subset of features with at least three occurrences was obtained. Muthamil et al. [36] first used multiple methods for selection and then selected the features that were selected no less than three times as the input to the later classifier. Bhatia et al. [37] selected the top one-third of features from different methods on the NSL-KDD dataset and then combined them. Finally, the number of features was then reduced to 10 by determining the best features subset according to the ant colony algorithm. Although the above studies clarify the criteria for selecting subsets, they are not yet uniform, so metrics are needed to measure subset sizes comprehensively.
The ensemble approach achieves better performance by integrating the results of multiple feature selection methods. Binbusayyis et al. [21] first selected the respective subset of features using four filtered methods and then combined the features that were selected more than three times to form a new subset, achieving an experimental accuracy of 95.87% on the UNSW-NB15 dataset and 99.88% on the CIC-IDS2017 dataset. Femi et al. [38] combined the CfsSubsetEval correlation model, the genetic algorithm-based wrapper model, and the rule-based model serially. The final selected subset was input to an artificial neural network (ANN) for classification. On the UNSW-NB15 dataset, the accuracy was 98.8%. Karna et al. [39] used mutual information, Chi-square, and Pearson correlation coefficients to combine a more stable subset of features. It achieved 99.16% accuracy on the CIC-IDS2017 dataset using 25 features. Shubhra et al. [40] used the maximum correlation–minimum redundancy algorithm (mRMR), joint mutual information (JMI), and maximization of mutual information (CMIM) to select the top features and then combined them into a new feature subset using frequency voting on the CIC-IDS2017 dataset with an accuracy of 99.25%. Leevy et al. [41] evaluated seven methods and finally selected features that appeared more than twice in these seven subsets, achieving a classification F1 score of 95.68% using LightGBM on the CSE-CIC-IDS2018 dataset. Ensemble feature selection methods are all used to achieve stronger and more stable classification results by integrating various feature selection approaches’ outcomes, where different integration strategies can also have an impact on the classification results.

3. Materials and Methods

To increase the intrusion detection system’s identification capability and efficiency, an ensemble automatic feature selection method (EAFS) is designed in this paper. The importance or ranking of each feature is initially calculated using various base approaches in feature selection, and then the features are added to the subset sequentially according to their importance. An NSOM is designed to evaluate the subset performance comprehensively. After obtaining a subset for each method, the final feature subset is obtained by ensembling the methods. Figure 1 illustrates the designed intrusion detection framework, which consists of four main components.
  • Data pre-processing: converting the raw data into the data format required by the classifier, as well as performing a series of operations such as numerical and normalization of the data;
  • Feature selection: to remove irrelevant and redundant features and improve model performance, we implement an ensemble automatic feature selection method;
  • Classifier training: to test the efficiency of the proposed strategy, RF and DT classifiers are trained using selected subsets;
  • Attack identification: to verify the effectiveness and generalization of the method, we test it on multiple intrusion detection public datasets using a 5-fold cross-validation method.

3.1. Benchmark Dataset

The UNSW-NB15 dataset [42] is a collection of network traffic from the University of New South Wales in Australia, and it contains a relatively complete set of normal activities and nine types of attack activities. The dataset has a total of 47 feature variables, and the last two columns are binary and multi-categorical labels, respectively.
The CIC-IDS2017 dataset [43] was collected by the Canadian Institute for Cybersecurity Research at the end of 2017. The dataset includes the most recent cyberattacks, close to real-world data. A total of seven types of attacks are implemented. The dataset has a total of 2,830,743 records, each containing 78 different features.
The CSE-CIC-IDS2018 dataset [43] is collected on a larger network than the IDS2017 dataset, with a sample size of 10 million, and contains a more comprehensive set of attack types. It contains seven attack scenarios. A total of 83 statistical features are generated, such as duration, the number of packets, bytes, packet length, etc. Table 1 shows the distribution of the three datasets mentioned above.

3.2. Data Pre-Processing

Numeric and character-based features are included in the intrusion detection dataset, and some features contain infinite and missing values. Because most machine learning and deep learning methods can only work with numerical data, it is necessary to convert non-numerical features in the dataset to numerical features so that they can be analyzed and processed efficiently using methods such as machine learning [44].
For the three features of “proto”, “state”, and “service” in the UNSW-NB15 dataset, the category features are sequential integers. The timestamp data in the CSE-CIC-IDS2018 dataset is removed.
Meanwhile, noise and duplicate data exist in the dataset. In the CIC-IDS-2017 dataset, there are two identical columns, Fwd Header Length and Fwd Header Length.1, and this paper removes the column feature of Header Length.1. For the CSE-CIC-IDS-2018 dataset, there are 4 features in the file “Thuesday-20-02-2018_TrafficForML_CICFlowMeter.csv”, which are Flow ID, Src IP, Src Port, and Dst IP, but there are no such features in other files, so we will delete them for consistency.
Observing the dataset reveals that there are missing values and infinity values in the file, which will directly affect the subsequent data processing. In this paper, missing values are filled with 0, while infinity values are substituted with the column’s maximum value plus one.
It also uses standardization techniques to standardize the data to a uniform range and accelerate the data convergence [45]. As shown in Equation (1), the feature values are scaled to a distribution with a mean of 0 and a standard deviation of 1 using this method.
x = x μ σ ,
where x is the initial value, x is the standardized value, and μ and σ are the mean and standard deviation, respectively.

3.3. Feature Selection

In this paper, we compare the Pearson correlation coefficient (PCC), mutual information (MI), mRMR, ET, and XGBoost algorithms, respectively. Among them, Pearson correlation coefficient, MI, and mRMR are filtered methods, which can quickly obtain the importance of features by calculating the relationship between features and labels; ET and XGBoost methods are embedded methods, which depend on classification algorithms to quickly evaluate the performance of subsets. Filtered and embedded methods can reduce computational costs when performing feature selection and are more efficient when extended to high-dimensional datasets [16,17,18,19,20,21].
In the designed model, firstly, it calculates the variance of each feature, removes those with zero variance as they are not beneficial for classification [27,46], and keeps those with relatively high variance for the next step of feature selection. Then, it calculates the feature importance for each method and saves them in the list in descending order of importance. Thirdly, the prediction accuracy ACC for all features is calculated, which is used to limit the size of the subset; this is the reason that if the accuracy of a subset is worse than the accuracy using all features, then its performance is unlikely to be optimal. In the fourth step, based on the ranked list, features are added to the subset sequentially using the forward floating search method, starting with the most important features, and the performance of each subset is evaluated until ACC is reached. The NSOM is meant to evaluate subset performance by integrating three independent sub-objectives: subset accuracy, subset number of features, and subset training time. Finally, the target subset is determined by having the highest NSMO. Algorithm 1 uses a single feature selection approach to calculate each characteristic’s importance and rank them in descending order. The automatic feature selection method’s pseudo-code is Algorithm 2.
Algorithm 1 Feature ranking algorithm
1:
Input: The training set F = f i , i = 1 , 2 , , I , i is the number of features; Feature selection method FS
2:
Output: The ranked subset of features F r a n k
3:
for i = 1 to I do
4:
   Var = VarianceThreshold(F)
5:
   if  F i = 0  then
6:
      F = Remove F i from F
7:
   end if
8:
end for
9:
Initialize FS Method
10:
Fit F S F
11:
Get F i m p       # Get the important of each feature
12:
F r a n k = s o r t e d ( F i m p )
13:
return F r a n k
Algorithm 2 Automatic feature selection algorithm
1:
Input: F r a n k , Feature ranked list; N is total numbers of features; ACC is original accuracy.
2:
Output: Feature subset F
3:
for F i in F r a n k  do
4:
   if  f s a c c < ACC then
5:
      add F i into F s e l e c t e d
6:
     evaluate F s e l e c t e d get a c c i , t i m e i , n u m i
7:
     add a c c i to f s a c c
8:
     add t i m e i to f s t i m e
9:
     add n u m i to f s n u m
10:
   end if
11:
end for
12:
output f s a c c , f s t i m e and f s n u m
13:
a c c N = normalization( f s a c c )
14:
t i m e N = normalization( f s t i m e )
15:
n u m N = normalization( f s n u m )
16:
s c o r e t e m p = 0
17:
for i = 1 in range(len( f s a c c )) do
18:
   according Equation (2), calculate s c o r e i
19:
   if  s c o r e i > s c o r e t e m p  then
20:
      s c o r e t e m p = s c o r e i
21:
     F = F r a n k [ : i ]
22:
   end if
23:
end for
24:
return F
In evaluating the subset performance, this paper does not use the commonly used evaluation functions because they tend to measure only a single metric. To consider the performance of subsets comprehensively, this paper designs a normalized score of mixed, which contains the accuracy of a subset’s classification, the number of features in a subset, and the training time of a subset. Firstly, classification accuracy is a metric that is available for every evaluation function. In addition, feature selection’s objective is to use as few features as feasible to improve classification performance, so the number of features is included in the evaluation function in this study, hoping to reduce the number of features in the subset. For classifiers, facing a large amount of data often consumes a lot of time to train, so while reducing the number of features, this paper considers the training time of the classifier to reduce the time cost. The NSOM designed in this paper is shown in Equation (2).
NSOM = F S _ a c c N α · F S _ n u m N β · F S _ t i m e N ,
where α and β are the weight coefficients between [0,1], respectively; F S _ a c c N , F S _ n u m N , and F S _ t i m e N are the normalized subset accuracy, the number of features contained in the subset, and the training time, respectively. After normalizing NSOM, it takes values between [0,1]. The closer the NSOM is to 1, the greater the subset’s performance.
The optimal subset of features for each method is obtained after processing by Algorithm 2. However, there is a certain bias in the importance of individual methods for different features, which affects the final classification effect. The subsets derived from multiple feature selection approaches are combined in this article using an ensemble strategy to eliminate this bias. Given F as a dataset, each sample in F has m features and a category label. Two feature selection meta-approaches are chosen after assessing the performance of several methods, and let the sequence obtained by the ith method for the features in order of importance be F i = a i 1 , a i 2 , , a i m , then for the intersection of two feature subsets, defined as follows: F i n t e r = F 1 F 2 , for the union of two feature subsets is defined as F u n i o n = F 1 F 2 . By combining the feature subsets, F(inter) contains some important features commonly recognized by both methods, and F(union) contains features that can be more effective by combining, and the effectiveness of the methods is verified on decision trees and random forests classification algorithms.

4. Results and Analysis

4.1. Experimental Environment and Setup

The algorithm process designed in this paper is based on a Python implementation using the scikit-learn toolkit to simulate experiments on a machine with an Intel(R) Core™ i9-9900KF CPU at 3.6GHz. The UNSW-NB15, CIC-IDS2017, and CSE-CIC-IDS2018 datasets were used to test the model’s performance. The number of samples in the dataset used in the experiments ranges from millions to tens of millions, covering different kinds of attacks, which are in line with modern real-network scenarios and can be a good evaluation of an IDS performance. All experimental results in this work are acquired using 5-fold cross-validation to avoid the impact of randomness on the results.

4.2. Evaluation Metrics

The evaluation metrics used in this paper include accuracy (Acc), detection rate (DR), F1 score, and false alarm rate (FAR). The metrics are calculated as shown in Equations (3)–(6).
Acc = T P + T N T P + T N + F P + F N ,
Precision = T P T P + F P ,
DR = R e c a l l = T P T P + F N ,
F 1 = 2 Pr e c i s i o n Re c a l l Pr e c i s i o n + Re c a l l ,
FAR = F P F P + T N ,

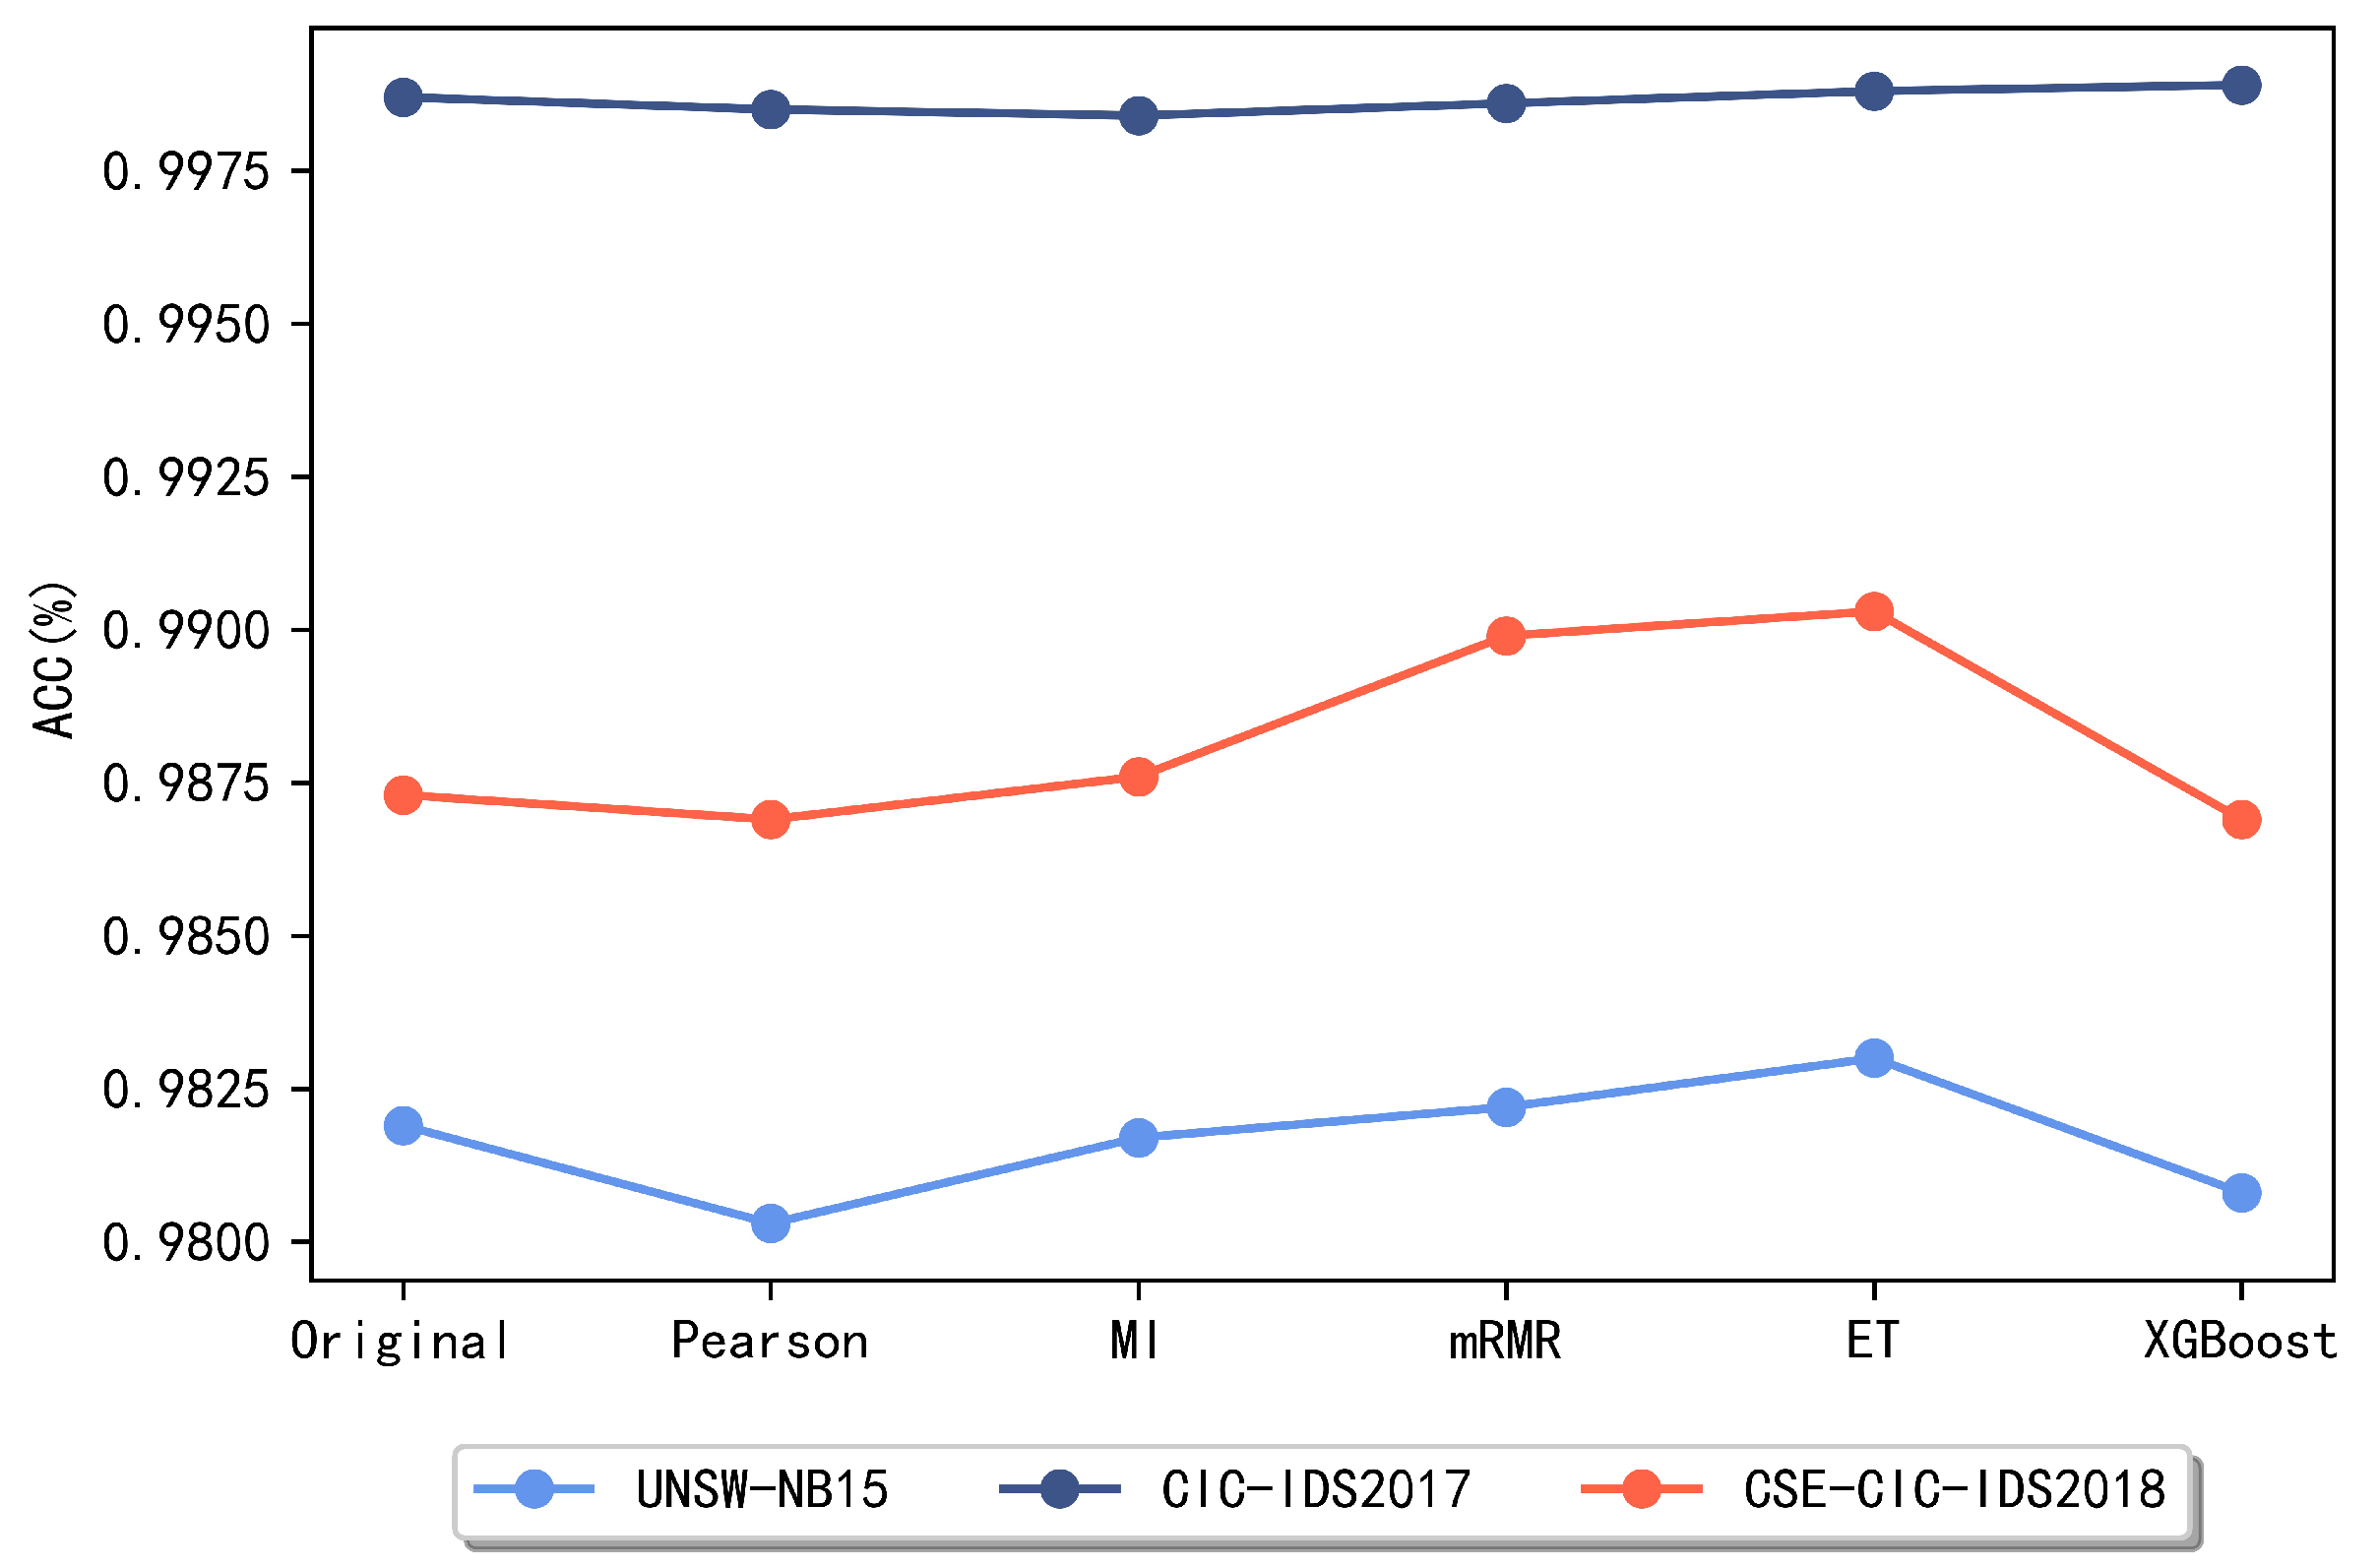
4.3. Automatic Feature Selection Performance Analysis

This study compares the suggested feature selection method against one that does not include feature selection to assess its performance. Table 2 shows the performance comparison on the UNSW-NB15, CIC-IDS2017, and CSE-CICIDS2018 datasets. On the UNSW-NB15 dataset, the proposed method achieves 98.37% accuracy and a 98.31% F1 score, and the training time is reduced by more than half. When compared to no feature selection on the CIC-IDS2017 dataset, the proposed feature selection strategy will perform better, while the time after feature selection is greatly reduced, especially on the DT classifier, which is more than three times. The false alarm rate on the RF classifier is reduced to 0.085%. Moreover, based on the CSE-CIC-IDS2018 dataset, the accuracy after feature selection reaches 99.04%, especially in terms of training time, which is greatly reduced compared to using all features. It is also evident that the designed feature selection approach is critical for increasing the efficiency of large data detection.
In previous problems of selecting the number of subsets for features, in the face of filtered and embedded methods, many used artificially set ratios to select features or those based on fixed thresholds [18,20,33,34,35,36,37]. Such methods are significantly subjective and require empirical knowledge, and they do not adequately consider the applicability to different scenarios. The top 10% and 30% of features were chosen for comparison with the regularly used selection ratios to demonstrate the efficiency of the method presented in this research. Figure 2 compares the experimental results of the three datasets under different proportions.
As can be seen from Figure 2, for the UNSW-NB15 and CIC-IDS2017 datasets, the performance of the classifier is poor when the proportion reaches 10%, and the accuracy is even lower compared to the original features, only 96.85% and 98.76%, respectively. This is because when only the top 10% of the features are selected, it is not enough to retain the most critical features in the original dataset, and a part of the useful information is lost, leading to the degradation of the classifier performance. In contrast, for the CSE-CIC-IDS2018 dataset, the best performance has been achieved when 10% of the features are selected, which is consistent with the feature subset selected by the method designed in this paper, and both achieved the best performance with 99.04% accuracy. When the first 30% of the subset is selected, the UNSW-NB15 and CIC-IDS2017 datasets are the same as the features selected by the method designed in this paper, and the performance also remains consistent with an accuracy of 98.37% and 99.91%, respectively. For the CSE-CIC-IDS2018 dataset, the effect is significantly lower when the first 30% of the features are selected, which is because, for the CSE- CIC-IDS2018 dataset, the best feature set can be selected quickly using the method designed in this paper, and when further features are added, it is equivalent to adding redundant information, resulting in a lower classification performance.

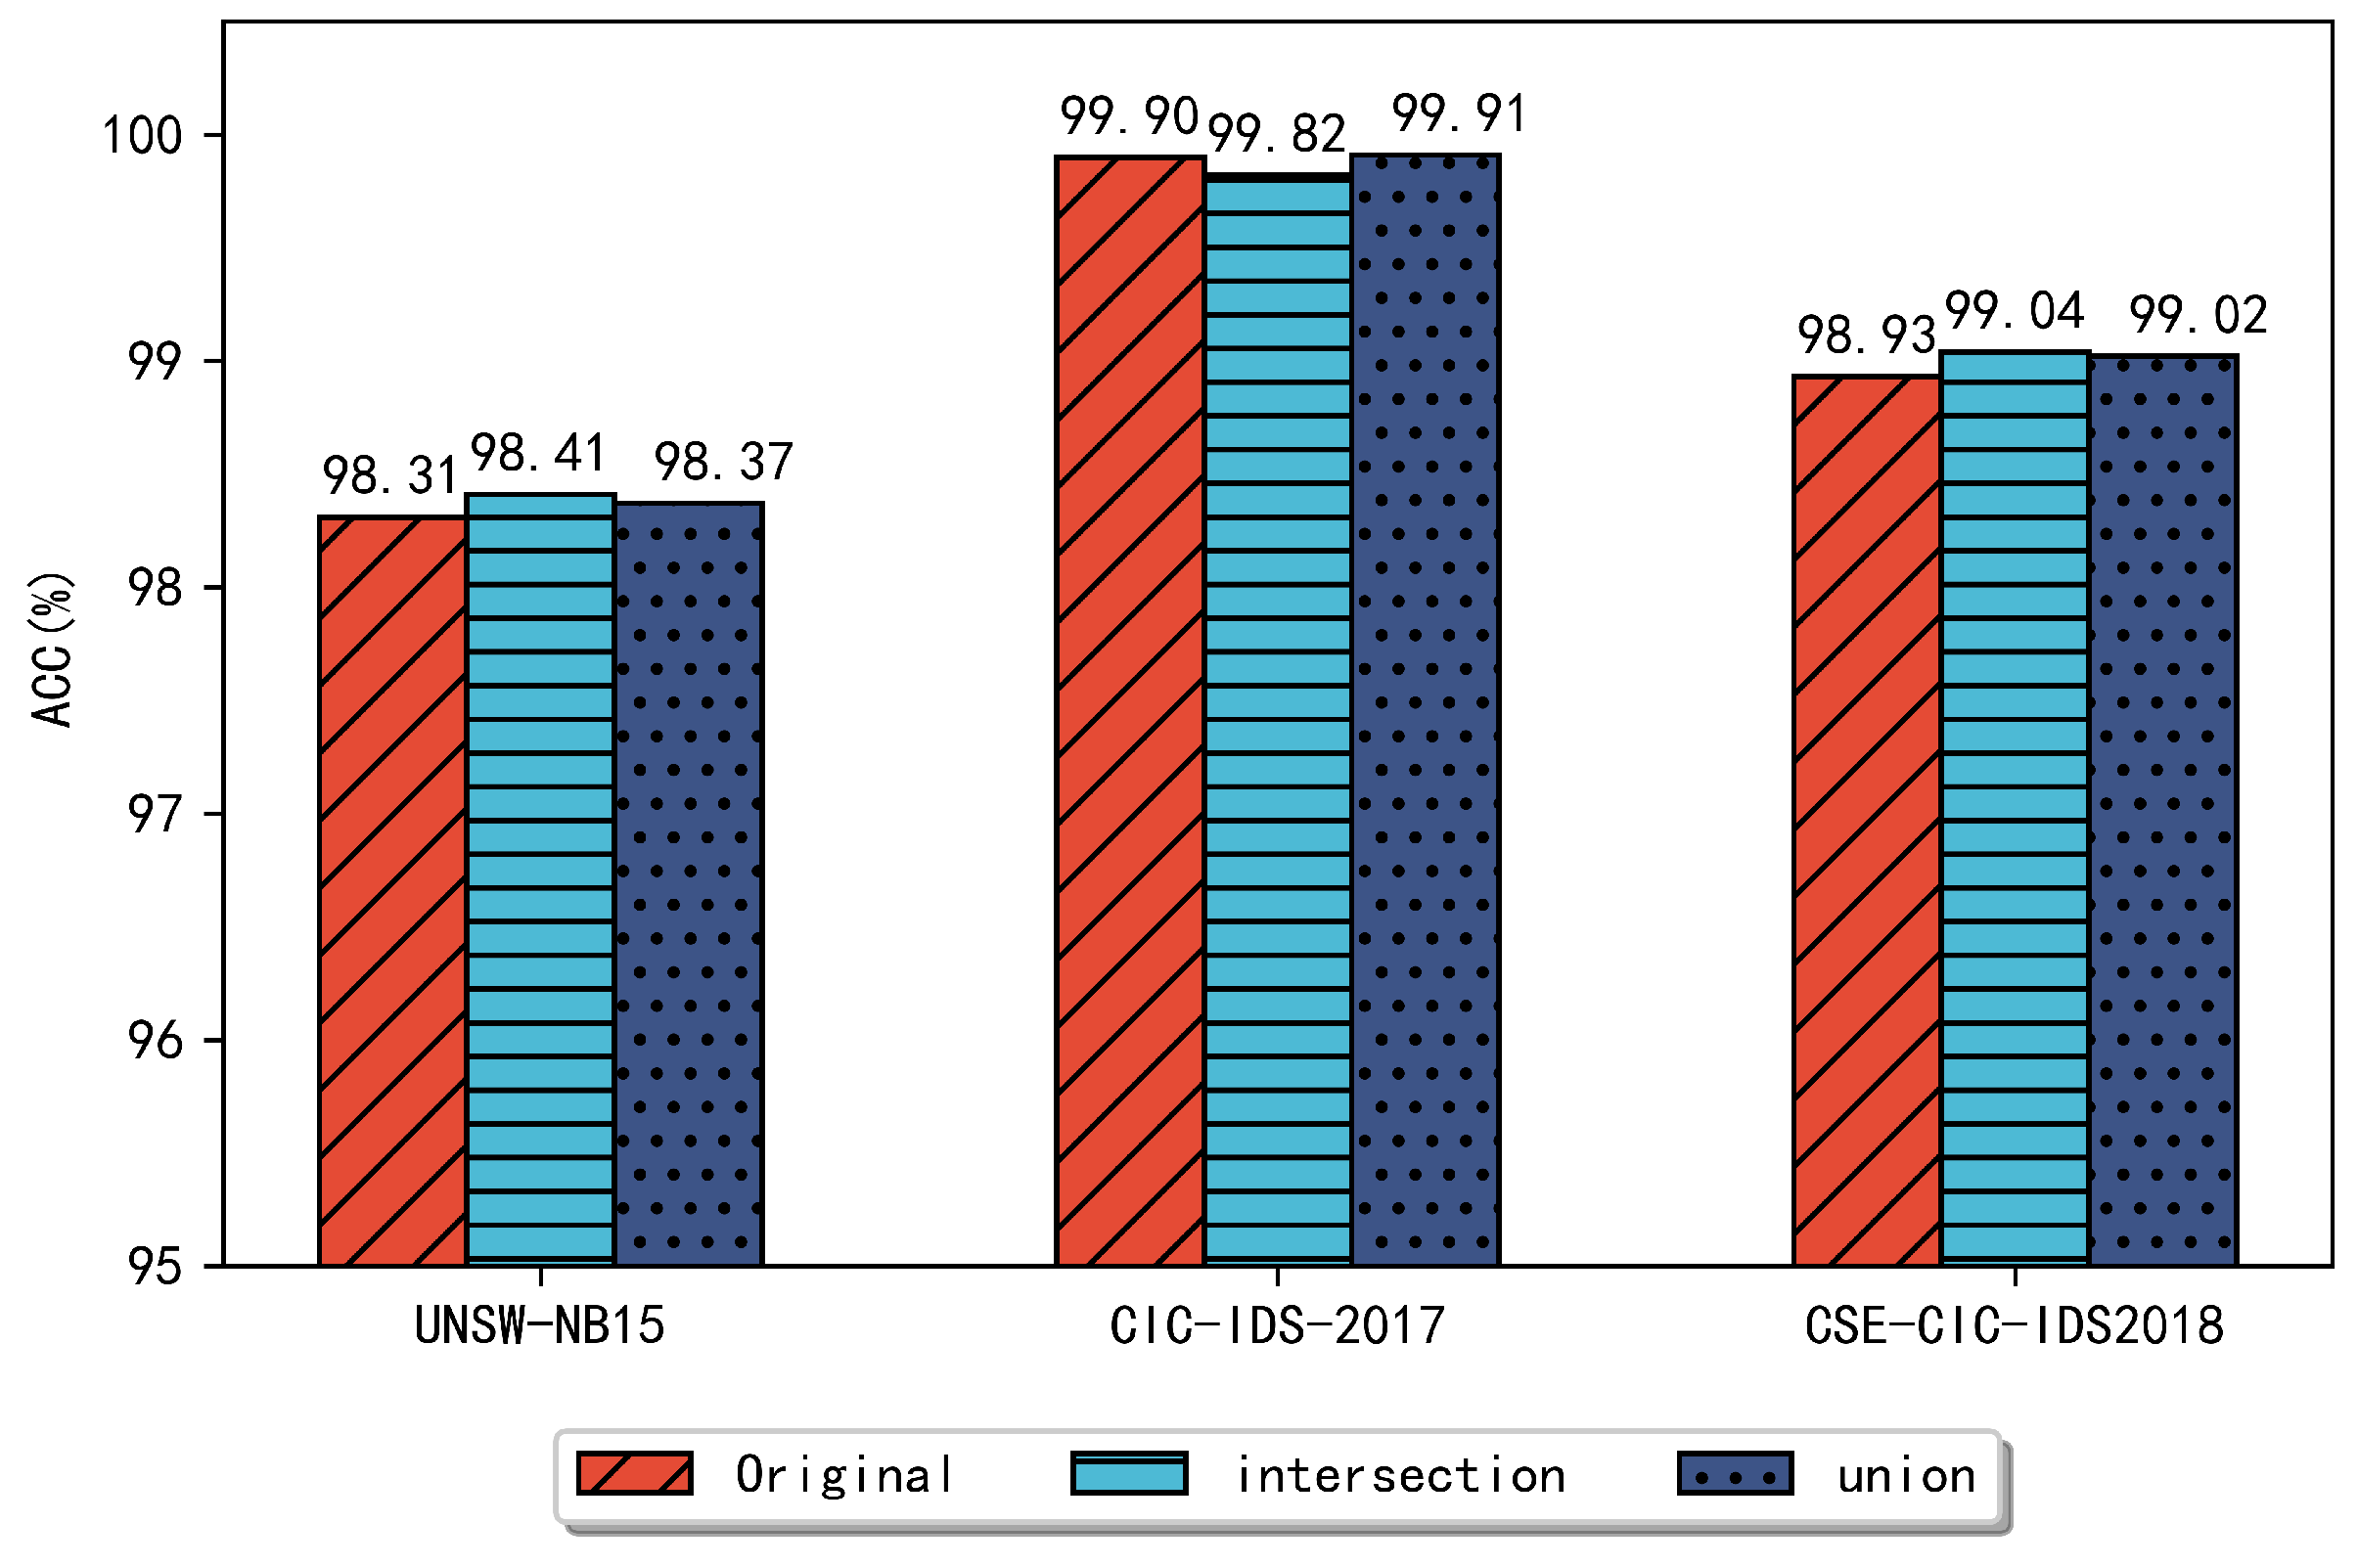
4.4. Ensemble Feature Selection Performance Comparison

In this section, to select the method with a better performance for the later ensemble feature selection method, several commonly used feature selection methods are compared, including five methods such as the Pearson correlation coefficient, mutual information, mRMR, ET method, and XGBoost. Figure 3 and Figure 4 reveal the obtained experimental results.
The above comparison reveals that for the UNSW-NB15 dataset, the best two of these methods are the ET algorithm and the mRMR method, respectively. For the CIC-IDS2017 dataset, the XGBoost and ET algorithms achieve better results and lower false alarm rates, so these two methods are chosen as the meta-methods for feature subset integration on the CIC-IDS2017 dataset later in this paper. For the CSE-CIC-IDS2018 dataset, it is clear that the subsets obtained using the two methods, the ET algorithm and mRMR algorithm, respectively, achieved the best classification performance and maintained a low false alarm rate. After identifying the two methods with the best performance on each dataset, this paper combines the subsets obtained by these two methods and compares the performance when taking the intersection and the union, respectively.
Figure 5 and Figure 6 compare the performance of the different combined approaches for each dataset on the RF and DT classifiers, respectively. In Figure 5, the UNSW-NB15 dataset achieves a classification accuracy of 98.41% and all other metrics are better than the original dataset. The CIC-IDS2017 dataset shows a slightly higher accuracy, detection rate, and F1 score when compared to the dataset without feature selection, and the false alarm rate decreases to 0.09%. On the CSE-CIC-IDS2018 dataset, the ensemble approach achieved better results, especially the false alarm rate was reduced to less than 1%, reaching 0.96%. In Figure 6, for UNSW-NB15, the highest accuracy of 99.34% was achieved using the ensemble feature subset and the false alarm rate was reduced to 1.69% compared to the original dataset. Compared with these two separate methods, the accuracy was improved by 0.12%. On the CIC-IDS2017 dataset, the ensemble method maintained a similar classification performance compared to the original dataset. On the CSE-CIC-IDS2018 dataset, the accuracy of the ensemble feature subset reached 99.03%, and the detection rate was 99.03%, F1 score was 98.82%, and the false alarm rate was 0.97%, respectively, compared to the accuracy of 98.73% on the original dataset.

5. Discussion

We compare the effectiveness of the approach described in this research to earlier studies to demonstrate its efficacy on the UNSW-NB15, CIC-IDS2017, and CSE-CIC-IDS2018 datasets. As the results show, we further demonstrate the effectiveness of the approach in selecting the most useful information for intrusion detection in this paper. In Table 3, this paper is compared with the latest research on the UNSW-NB15, CIC-IDS2017, and CSE-CIC-IDS2018 datasets, and the comparison items shown include the feature selection and classification techniques used, classification accuracy, and false alarm rate. For the UNSW-NB15 dataset, this paper is compared to swarm intelligence search-based methods, including GA [27], TS [29], and LSO [31], respectively, and the method designed in this paper achieves the highest accuracy and the lowest rate of false alarms. In comparison with ensemble strategies such as SCM3 [21] and RHF [38], the method in this paper also achieves the highest accuracy, and although the false alarm rate of the RHF method is reduced to 1.3%, our method works better in terms of accuracy. Overall, the method in this paper has more advantages.
For the CIC-IDS2017 dataset, the method in this paper achieved 99.92%, 99.92%, and 0.08% for Acc, F1, and FAR, respectively. When compared to the classification results obtained without the use of feature selection approaches, the accuracy of the classification using the XGBoost [24] classifier is 99.54%, but the false alarm rate is 0.237%, which is nearly three times higher than the false alarm rate of this paper. By comparing the swarm intelligence search algorithms such as GA [32] and CFS [28], the method in this paper achieves a higher accuracy and higher false alarm rate than these two methods. In comparison with the ensemble feature selection strategies such as SCM3 [21], CPM [39], and EFW [40], these three methods achieve 99.88%, 99.16%, and 99.25% accuracy, respectively, while the accuracy of this paper reaches 99.92%, relative to the F1 value of 99.17% achieved by the CPM method, which achieves an F1 value of 99.92%.
For the CSE-CIC-IDS2018 dataset, the method in this paper achieved 99.14%, 99.14%, and 98.85% for Acc, DR, and F1, respectively. In the comparison with the classification results without feature selection, the accuracy of the classification using LSTM [26] reached 96.2% and the detection rate was 96%. The classification accuracy, detection rate, and F1 values were 98.8%, 97.1%, and 97.9%, respectively, when using the feature selection method with the Spearman correlation coefficient [25]. The classification F1 value was 95.68% when the feature selection results were ensembled using the voting [41] integration strategy. As seen in the table, the method proposed in this paper was able to achieve better results than previous studies in these metrics that were compared.
Our proposed ensemble-based automatic feature selection method improves the classification performance while minimizing the training and prediction time, according to the experimental data. The main reason for the better results of the method designed in this paper is that, firstly, when selecting the best features for each dataset, the search range of the subsets is reduced by the accuracy based on the full set, avoiding a large amount of time consumption for a large-scale search. Secondly, the automatic feature selection method designed in this paper can measure the performance advantages and disadvantages of different subsets and integrate multiple metrics to evaluate the performance of subsets. Third, the ensemble feature selection strategy takes into account the bias of different feature selection methods for the same feature and obtains a subset with more general significance. The above three reasons enable the method designed in this paper to select the best subset and perform the classification prediction quickly and accurately in large-scale data scenarios.

6. Conclusions

For intrusion detection systems where the number of acquired traffic features is large and redundant and irrelevant features tend to have a serious impact on the results, this paper designs an ensemble-based automatic feature selection method, EAFS. Firstly, features with zero variance are removed using a variance threshold. Next, the importance or ranking of each feature is obtained using a separate feature selection method, and the ranked features are gradually added to the subset selected. Then, the subset performance is evaluated using the designed NSOM scores and the subset with the highest NSOM value is taken as the final subset. Finally, the two methods with the best performance on each dataset are obtained and the results are ensembled to reduce the bias of different methods. Experiments are implemented on the commonly used intrusion detection datasets, UNSW-NB15, CIC-IDS2017, and CSE-CIC-IDS2018, and after feature selection, the final classification performance is improved compared to the original feature set. On the UNSW-NB15 dataset, the classification accuracy and false alarm rate are 98.36% and 1.65%, respectively. On the CIC-IDS2017 dataset, the classification accuracy, F1 value, and false alarm rate are 99.92%, 99.92%, and 0.08%, respectively. On the CSE-CIC-IDS2018 dataset, the classification accuracy, detection rate, and F1 value are 99.04%, 99.04%, and 98.83%. The performance of our method also achieved good results in comparison with other works of literature. In future research, we will continue to study automatic feature selection and extend it to more selection methods, and we will also investigate the effectiveness of lightweight classification models in time.

Author Contributions

Conceptualization, H.Z.; investigation, Y.Z. and H.Z.; methodology, Y.Z.; resources, H.Z.; supervision, H.Z.; validation, Y.Z. and B.Z.; writing—original draft, Y.Z.; writing—review and editing, H.Z. and B.Z. All authors have read and agreed to the published version of the manuscript.

Funding

This research was partly supported by the Key R&D and promotion projects of Henan Province (Technological research) (Grant No. 212102210143).

Institutional Review Board Statement

Ethical review and approval are not required because all datasets used in this study are in the public domain.

Informed Consent Statement

Not applicable.

Data Availability Statement

The UNSW-NB15 dataset used to support the findings of this study is available at https://www.unsw.adfa.edu.au/unsw-canberra-cyber/cybersecurity/ADFA-NB15-Datasets/ (accessed on 26 June 2022). The CICIDS2017 dataset used to support the findings of this study is available at https://www.unb.ca/cic/datasets/ids-2017.html (accessed on 26 June 2022). The CSE-CIC-IDS2018 dataset used to support the findings of this study is available at https://www.unb.ca/cic/datasets/ids-2018.html (accessed on 26 June 2022).

Conflicts of Interest

The authors declare no conflict of interest.

References

  1. Verkerken, M.; D’hooge, L.; Wauters, T.; Volckaert, B.; Turck, D. Towards model generalization for intrusion detection: Unsupervised machine learning techniques. J. Netw. Syst. Manag. 2021, 30, 12. [Google Scholar] [CrossRef]
  2. Habeeb, R.A.A.; Nasaruddin, F.; Gani, A.; Hashem, I.A.T.; Ahmed, E.; Imran, M. Real-time big data processing for anomaly detection: A Survey. Int. J. Inf. Manag. 2019, 45, 289–307. [Google Scholar] [CrossRef] [Green Version]
  3. Kabir, M.; Hartmann, S. Cyber security challenges: An efficient intrusion detection system design. In Proceedings of the 2018 International Young Engineers Forum (YEF-ECE), Costa da Caparica, Portugal, 4 May 2018. [Google Scholar]
  4. Buczak, A.; Guven, E. A survey of data mining and machine learning methods for cyber security intrusion detection. IEEE Commun. Surv. Tutor. 2015, 18, 1153–1176. [Google Scholar] [CrossRef]
  5. Aljawarneh, S.; Aldwairi, M.; Yassein, M.B. Anomaly-based intrusion detection system through feature selection analysis and building hybrid efficient model. J. Comput. Sci. 2018, 25, 152–160. [Google Scholar] [CrossRef]
  6. Maldonado, J.; Riff, M.C.; Neveu, B. A review of recent approaches on wrapper feature selection for intrusion detection. Expert Syst. Appl. 2022, 198, 116822. [Google Scholar] [CrossRef]
  7. Fernandes, G.; Rodrigues, J.; Carvalho, L.; Al-Muhtadi, J.; Proença, M. A comprehensive survey on network anomaly detection. Telecommun. Syst. 2019, 70, 447–489. [Google Scholar] [CrossRef]
  8. Thakkar, A.; Lohiya, R. A survey on intrusion detection system: Feature selection, model, performance measures, application perspective, challenges, and future research directions. Artif. Intell. Rev. 2021, 55, 453–563. [Google Scholar] [CrossRef]
  9. Wei, G.; Zhao, J.; Feng, Y.; He, A.; Yu, J. A novel hybrid feature selection method based on dynamic feature importance. Appl. Soft. Comput. 2020, 93, 106337. [Google Scholar] [CrossRef]
  10. Di Mauro, M.; Galatro, G.; Fortino, G.; Liotta, A. Supervised feature selection techniques in network intrusion detection: A critical review. Eng. Appl. Artif. Intell. 2021, 101, 104216. [Google Scholar] [CrossRef]
  11. Solorio-Fernández, S.; Carrasco-Ochoa, J.A.; Martínez-Trinidad, J.F. A review of unsupervised feature selection methods. Artif. Intell. Rev. 2019, 53, 907–948. [Google Scholar] [CrossRef]
  12. Kasongo, S.M.; Sun, Y. A deep learning method with wrapper based feature extraction for wireless intrusion detection system. Comput. Secur 2020, 92, 101752. [Google Scholar] [CrossRef]
  13. Alaiz-Rodriguez, R.; Parnell, A.C. An information theoretic approach to quantify the stability of feature selection and ranking algorithms. Knowl.-Based Syst 2020, 195, 105745. [Google Scholar] [CrossRef]
  14. Thakkar, A.; Lohiya, R. Attack classification using feature selection techniques: A comparative study. J. Amb. Intell. Hum. Comp. 2020, 12, 1249–1266. [Google Scholar] [CrossRef]
  15. Lu, M. Embedded feature selection accounting for unknown data heterogeneity. Expert Syst. Appl. 2019, 119, 350–361. [Google Scholar] [CrossRef]
  16. Tsai, C.F.; Sung, Y.T. Ensemble feature selection in high dimension, low sample size datasets: Parallel and serial combination approaches. Knowl.-Based Syst. 2020, 203, 106097. [Google Scholar] [CrossRef]
  17. Shukla, A.K.; Singh, P. Building an effective approach toward intrusion detection using ensemble feature selection. Int. Inf. Secur. Priv. 2019, 13, 31–47. [Google Scholar] [CrossRef]
  18. Krishnaveni, S.; Sivamohan, S.; Sridhar, S.S.; Prabakaran, S. Efficient feature selection and classification through ensemble method for network intrusion detection on cloud computing. Clust. Comput. 2021, 24, 1761–1779. [Google Scholar] [CrossRef]
  19. Bolón-Canedo, V.; Alonso-Betanzos, A. Ensembles for feature selection: A review and future trends. Inf. Fusion 2019, 52, 1–12. [Google Scholar] [CrossRef]
  20. Osanaiye, O.; Cai, H.; Choo, K.R.; Dehghantanha, A.; Xu, Z.; Dlodlo, M. Ensemble-based multi-filter feature selection method for DDoS detection in cloud computing. EURASIP J. Wirel. Commun. Netw. 2016, 2016, 130. [Google Scholar] [CrossRef] [Green Version]
  21. Binbusayyis, A.; Vaiyapuri, T. Identifying and benchmarking key features for cyber intrusion detection: An ensemble approach. IEEE Access 2019, 7, 106495–106513. [Google Scholar] [CrossRef]
  22. Odhiambo Omuya, E.; Onyango Okeyo, G.; Waema Kimwele, M. Feature selection for classification using principal component analysis and information gain. Expert Syst. Appl. 2021, 174, 114765. [Google Scholar] [CrossRef]
  23. Guyon, I.; Elisseeff, A. An introduction to variable and feature selection. J. Mach. Learn. Res. 2003, 3, 1157–1182. [Google Scholar]
  24. Bansal, A.; Kaur, S. Extreme gradient boosting based tuning for classification in intrusion detection systems. In Advances in Computing and Data Sciences; Singh, M., Gupta, P., Tyagi, V., Flusser, J., Ören, T., Eds.; Springer: Singapore, 2018; pp. 372–380. [Google Scholar]
  25. Fitni, Q.R.S.; Ramli, K. Implementation of ensemble learning and feature selection for performance improvements in anomaly-based intrusion detection systems. In Proceedings of the 2020 IEEE International Conference on Industry 4.0, Artificial Intelligence, and Communications Technology (IAICT), Bali, Indonesia, 7–8 July 2020. [Google Scholar]
  26. Bansal, A.; Kaur, S. Dynamic betwork anomaly detection system by using deep learning techniques. In Advances in Computing and Data Sciences; Da Silva, D., Wang, Q., Zhang, L.J., Eds.; Springer: Cham, Switzerland, 2019; pp. 161–176. [Google Scholar]
  27. Khammassi, C.; Krichen, S. A GA-LR wrapper approach for feature selection in network intrusion detection. Comput. Secur. 2017, 70, 255–277. [Google Scholar] [CrossRef]
  28. Zhou, Y.; Cheng, G.; Jiang, S.; Dai, M. Building an efficient intrusion detection system based on feature selection and ensemble classifier. Comput. Netw. 2020, 174, 107247. [Google Scholar] [CrossRef] [Green Version]
  29. Nazir, A.; Khan, R.A. A novel combinatorial optimization based feature selection method for network intrusion detection. Comput. Secur. 2021, 102, 102164. [Google Scholar] [CrossRef]
  30. Farahani, G. Feature selection based on cross-correlation for the intrusion detection system. Secur. Commun. Netw. 2020, 2020, 8875404. [Google Scholar] [CrossRef]
  31. Benmessahel, I.; Xie, K.; Chellal, M.; Semong, T. A new evolutionary neural networks based on intrusion detection systems using locust swarm optimization. Evol. Intell. 2019, 12, 131–146. [Google Scholar] [CrossRef]
  32. Vijayanand, R.; Devaraj, D.; Kannapiran, B. Intrusion detection system for wireless mesh network using multiple support vector machine classifiers with genetic-algorithm-based feature selection. Comput. Secur. 2018, 77, 304–314. [Google Scholar] [CrossRef]
  33. Akashdeep; Manzoor, I.; Kumar, N. A feature reduced intrusion detection system using ANN classifier. Expert Syst. Appl. 2017, 88, 249–257. [Google Scholar] [CrossRef]
  34. Selvakumar, B.; Muneeswaran, K. Firefly algorithm based feature selection for network intrusion detection. Comput. Secur. 2019, 81, 148–155. [Google Scholar]
  35. Kshirsagar, D.; Kumar, S. A feature reduction based reflected and exploited DDoS attacks detection system. J. Ambient Intell. Hum. Comput. 2022, 13, 393–405. [Google Scholar] [CrossRef]
  36. Muthamil Sudar, K.; Deepalakshmi, P. An intelligent flow-based and signature-based IDS for SDNs using ensemble feature selection and a multi-layer machine learning-based classifier. J. Intell. Fuzzy Syst. 2021, 40, 4237–4256. [Google Scholar] [CrossRef]
  37. Bhatia, M.P.S.; Sangwan, S.R. Soft computing for anomaly detection and prediction to mitigate IoT-based real-time abuse. Pers. Ubiquit. Comput. 2021, 1–11. [Google Scholar] [CrossRef]
  38. Ayo, F.; Folorunso, S.; Adebayo, A.-A.; Adekunle, A.; Bamidele, A. Network intrusion detection based on deep learning model optimized with rule-based hybrid feature selection. Inf. Secur. J. Glob. Perspect. 2021, 29, 267–283. [Google Scholar] [CrossRef]
  39. Karna, I.; Madam, A.; Deokule, C.; Adhao, R.; Pachghare, V. Ensemble-based filter feature selection technique for building flow-based IDS. In Proceedings of the 2021 2nd International Conference on Advances in Computing, Communication, Embedded and Secure Systems (ACCESS), Ernakulam, India, 2–4 September 2021. [Google Scholar]
  40. Dwivedi, S.; Vardhan, M.; Tripathi, S. An effect of chaos grasshopper optimization algorithm for protection of network infrastructure. Comput. Netw. 2020, 176, 107251. [Google Scholar] [CrossRef]
  41. Leevy, J.L.; Hancock, J.; Zuech, R.; Khoshgoftaar, T.M. Detecting cybersecurity attacks across different network features and learners. J. Big Data 2021, 8, 38. [Google Scholar] [CrossRef]
  42. Moustafa, N.; Slay, J. UNSW-NB15: A comprehensive data set for network intrusion detection systems. In Proceedings of the 2015 Military Communications and Information Systems Conference (MilCIS), Canberra, ACT, Australia, 10–12 November 2015. [Google Scholar]
  43. Ghorbani, A.A.; Habibi Lashkari, A.; Sharafaldin, I. Toward generating a new intrusion detection dataset and intrusion traffic characterization. In Proceedings of the 4th International Conference on Information Systems Security and Privacy (ICISSP), Madeira, Portugal, 22–24 January 2018. [Google Scholar]
  44. Salo, F.; Nassif, A.B.; Essex, A. Dimensionality reduction with IG-PCA and ensemble classifier for network intrusion detection. Comput. Netw. 2019, 148, 164–175. [Google Scholar] [CrossRef]
  45. Çavuşoğlu, Ü. A new hybrid approach for intrusion detection using machine learning methods. Appl. Intell. 2019, 49, 2735–2761. [Google Scholar] [CrossRef]
  46. Vaca, F.D.; Niyaz, Q. An Ensemble Learning Based Wi-Fi Network Intrusion Detection System (WNIDS). In Proceedings of the 2018 IEEE 17th International Symposium on Network Computing and Applications (NCA), Cambridge, MA, USA, 1–3 November 2018. [Google Scholar]
Figure 1. Feature selection framework diagram.
Information 13 00314 g001
Figure 2. Performance comparison with other selection strategies.
Information 13 00314 g002
Figure 3. Comparison of accuracy of different methods.
Information 13 00314 g003
Figure 4. Comparison of false alarm rate of different methods.
Information 13 00314 g004
Figure 5. Using an RF classifier to compare the accuracy of several datasets.
Information 13 00314 g005
Figure 6. Using a DT classifier to compare the accuracy of several datasets.
Information 13 00314 g006
Table 1. Statistics of UNSW-NB15, CIC-IDS2017, and CSE-CIC-IDS-2018 datasets.
UNSW-NB15CIC-IDS2017CSE-CIC-IDS-2018
ClassNumbersClassNumbersClassNumbers
Benign2,218,764Benign2,273,097Benign13,484,708
Exploits44,525DDOS128,027DDOS1,263,933
Reconnaissance13,987DOS252,661DOS654,300
DoS16,353Bot1966Bot286,191
Generic215,481Patator13,835Brute Force380,949
Shellcode1511Heartbleed11Infiltration161,934
Fuzzers24,246Infiltration36Web Attack928
Worms174PortScan158,930
Backdoors2329Web Attack2180
Analysis2677
Total2,540,047Total2,830,743Total16,232,943
Table 2. Classification performance based on the different dataset.
ClassifierAcc(%)DR(%)F1(%)FAR(%)Training Time(s)Predicted Time(s)
Comparison of classification performance on the UNSW-NB15 dataset
RF98.3198.3198.241.70421.78
DT98.1998.1998.141.83140.09
RF98.3798.3798.311.65191.55
DT98.3098.3098.251.7260.09
Comparison of classification performance on the CIC-IDS2017 dataset
RF99.9099.9099.900.101392.21
DT99.8799.8799.870.131070.13
RF99.9299.9299.910.09791.80
DT99.8899.8899.880.12240.07
Comparison of classification performance on the CSE-CIC-IDS2018 dataset
RF98.9398.9398.771.07159621
DT98.7398.7398.691.2711270.83
RF99.0499.0498.830.9624312
DT99.0399.0398.830.97400.30
Table 3. Comparison of results on multiple datasets with the latest(%).
DatasetReferenceTechnologyAccDRF1FAR
UNSW-NB15Khammassi [27]GA-LR81.42--6.39
Nazir [29]TS-RF83.12--3.70
Benmessahel [31]LSO-FNN95.4299.3395.989.40
Binbusayyis [21]SCM3-RF95.8797.40-7.40
Femi [38]RHF-ANN97.60-97.701.30
This workEAFS-RF98.3698.3698.311.65
CIC-IDS2017Bansal [24]XGBoost99.54--0.237
Vijayanand [32]GA-SVM99.85--0.09
Zhou [28]CFS-BA99.8999.90-0.12
Binbusayyis [21]SCM3-RF99.8899.90-0.20
Karna [39]CPM-voting99.16-99.17-
Shubhra [40]EFW-SVM99.2599.52-0.007
This workEAFS- RF99.9299.9299.920.08
CSE-CIC-IDS2018Fitni [25]spearman98.8097.1097.90-
Lin [26]LSTM-Attention96.2096.0093.00-
Leevy [41]vote-LightGBM--95.88-
This workEAFS- RF99.0499.0498.830.96
Publisher’s Note: MDPI stays neutral with regard to jurisdictional claims in published maps and institutional affiliations.

