Article

Deep Learning Models for Waterfowl Detection and Classification in Aerial Images †

1
The Department of Electrical Engineering and Computer Science (EECS), University of Missouri, Columbia, MO 65201, USA
2
The School of Natural Resources, University of Missouri, Columbia, MO 65201, USA
3
U.S. Geological Survey, Missouri Cooperative Fish and Wildlife Research Unit, University of Missouri, Columbia, MO 65201, USA
4
The Missouri Department of Conservation, Columbia, MO 65201, USA
*
Authors to whom correspondence should be addressed.
This article is a revised and expanded version of a paper entitled “Development of New Aerial Image Datasets and Deep Learning Methods for Waterfowl Detection and Classification”, which was presented at 2022 IEEE 4th International Conference on Cognitive Machine Intelligence (CogMI), Atlanta, GA, USA and 14–17 December 2022.
Information 2024, 15(3), 157; https://doi.org/10.3390/info15030157
Submission received: 29 January 2024 / Revised: 29 February 2024 / Accepted: 4 March 2024 / Published: 11 March 2024

Abstract

:
Waterfowl populations monitoring is essential for wetland conservation. Lately, deep learning techniques have shown promising advancements in detecting waterfowl in aerial images. In this paper, we present performance evaluation of several popular supervised and semi-supervised deep learning models for waterfowl detection in aerial images using four new image datasets containing 197,642 annotations. The best-performing model, Faster R-CNN, achieved 95.38% accuracy in terms of mAP. Semi-supervised learning models outperformed supervised models when the same amount of labeled data was used for training. Additionally, we present performance evaluation of several deep learning models on waterfowl classifications on aerial images using a new real-bird classification dataset consisting of 6,986 examples and a new decoy classification dataset consisting of about 10,000 examples per category of 20 categories. The best model achieved accuracy of 91.58% on the decoy dataset and 82.88% on the real-bird dataset.

1. Introduction

The audience for this paper should be machine learning and data science professionals who are interested in developing deep learning models for wildlife management and research. Effective management of waterfowl populations is pivotal in the decision-making framework outlined by the Missouri Department of Conservation’s Wetland Planning Initiative [1]. Managers currently employ diverse methods, from informal observations to structured transect counts, for monitoring waterfowl. However, the lack of standardized monitoring hampers comparability across locations and diminishes collective learning for statewide management decisions. Accurate classification of waterfowl using UAS imagery requires an extensive library of annotated images and a more complete assessment of performance among alternative machine learning approaches than have currently been completed. Our work assesses the potential of using Uncrewed Aircraft Systems (UAS) and deep learning techniques to enhance waterfowl population monitoring [2].
Our previous paper [3] aimed to present aerial-image datasets and to apply deep learning models to detect and classify waterfowl in these datasets. The focus of the previous paper was on deep learning on waterfowl detection, while limited works have been presented on waterfowl classification. As an extension of our previous paper, this paper presents our creation of the newest aerial-image datasets and the adaptation and evaluation of advanced deep learning methods to detect and classify waterfowl in aerial images. Between 2020 and 2022, we conducted 57 trips to capture real waterfowl imagery and an additional 5 trips specifically for waterfowl decoy imagery across 10 conservation areas in Missouri. The distribution of these conservation areas is as shown in Figure 1. Employing DJI Mavic Pro 2 drones and a custom drone-path-planning app, we captured images at various altitudes (15 to 90 m) and in diverse lighting conditions (Sunny and Cloudy), resulting in thousands of aerial images in varying contexts.
To create labeled datasets for machine learning, we used a server-based LabelMe program to collaboratively label the waterfowl instances in the aerial images. This involved generating labels (bounding boxes) around the contours of the waterfowl instances. We labeled 197,642 waterfowl across 1237 images for training and assessing deep learning models for waterfowl detection and classification. However, there were still over 100,000 aerial images unlabeled. We created an unlabeled detection dataset from these images, which served as the training data for our semi-supervised models.
For the waterfowl classification, we created a new labeled decoy classification dataset containing around 10,000 examples and a new labeled real-bird classification dataset by cropping individual waterfowl from aerial images captured at a 15 m altitude by a drone. Additionally, we selected a subset of model-filtered waterfowl crops from the images captured at a 15 m altitude in the unlabeled detection dataset, to create an unlabeled classification dataset for training semi-supervised models. In total, the waterfowl classification dataset comprised 6989 labeled waterfowl crops and 235,542 unlabeled waterfowl crops.
The main contributions of this paper are as follows:
1.
We created three new labeled datasets specifically designed for waterfowl detection in aerial images, along with a new dataset for waterfowl classification in aerial images.
2.
Through rigorous evaluation using authentic waterfowl datasets, we assessed the efficacy of cutting-edge supervised deep learning models for both waterfowl detection and classification. Our analysis yielded notably accurate outcomes, demonstrating the models’ robust performance in real-life scenarios.
3.
We trained and evaluated semi-supervised learning models for waterfowl detection and classification. Our experiments’ results showed an improvement in detection and classification accuracy.

2. Related Work

2.1. Deep Learning Methods for Object Detection

There are two main types of deep learning models for image object detection: one-stage detectors and two-stage detectors. Two-stage detectors, exemplified by Faster R-CNN [4], Mask R-CNN [5], and EfficientDet [6], function by proposing regions through a dedicated network and subsequently classifying those regions via an independent network. Faster R-CNN, a popular two-stage detector, integrates Region Proposal Network (RPN) for proposals generation, sharing convolutional layers with the object detection network. It also employs a Feature Pyramid Network (FPN) to facilitate multi-scale proposal generation, with specific anchor size adjustments optimized for detecting smaller objects, such as birds in aerial images.
In contrast, one-stage detectors, such as RetinaNet [7] and SSD [8], operate as end-to-end deep learning models. While slow in speed, two-stage detectors often offer more accurate predictions. For instance, RetinaNet, a popular one-stage detector, enhances prediction accuracy through focal loss, performing direct regression and classification on individual anchor boxes derived from the feature map. The YOLO (You Only Look Once) models, such as YOLOv1 [9] and the recent YOLONAS [10], are well-known one-stage detectors. For example, YOLOv5 [11] demonstrated remarkable performance in 2021, while YOLONAS [10] attained state-of-the-art (popular) performance in 2023.
Transformer-based object-detection models, such as Detection Transformer (DETR), have shown promising performance. DETR [12], notable for being the first end-to-end transformer-based object detector, achieved comparable performance to Faster R-CNN without the need for Non-Maximum Suppression (NMS) methods to reduce duplicated proposals. Deformable DETR [13] further enhanced DETR’s convergence time by focusing on sparse spatial positioning. The state-of-the-art model CODETR [14] has surpassed others in the COCO detection leaderboard. A key innovation of CODETR lies in its application of auxiliary heads to increase the number of samples in each training batch.
In the domain of aerial bird detection, the DeepForest Bird Detector, developed by the Weecology lab at the University of Florida [15], is a leading RetinaNet-based model. Trained on extensive drone-captured bird images worldwide, this model served as a baseline for evaluating the bird-detection models developed in our study.
Semi-supervised learning techniques, like Mean Teacher [16], utilize unlabeled data to bolster the performance of supervised learning. In the student–teacher model, these methods initially generate predicted labels for unlabeled images through labeling functions or existing models trained on labeled data. Subsequently, an object detector is trained, using images containing both accurate and predicted (potentially inaccurate) labels. Another approach involves concurrent training of a detection neural network on labeled and unlabeled images, utilizing the consistency of the predictions as an additional learning objective [17]. Soft Teacher [18], an end-to-end semi-supervised object-detection model based on Faster R-CNN, diversifies input images by applying weak augmentation for the teacher model and strong augmentation for the student model. It also employs a box-jittering technique to select reliable pseudo-boxes for regression learning. Addressing imbalanced foreground and background pseudo-labels during training, Unbiased Teacher [19] implements focal loss and Exponential Moving Average (EMA) training, effectively mitigating the data-imbalance issue.

2.2. Deep Learning Methods for Image Classification

The objective of image classification is to predict the categories of distinct objects in images. In the past decade, deep learning methods in image classification have attained significant advancements since 2012 [20]. Numerous deep learning models have been introduced, consistently delivering improved performance [21,22].
ResNet [23] is a highly successful image-classification model, specifically tackling the vanishing gradient challenge within deep neural networks by introducing a framework for deep residual learning. EfficientNet [24] introduced the compound coefficient technique. Unlike random scaling of network depth and width, this technique harmonizes width, depth, and resolution dimensions using a constant ratio, thereby effectively balancing the model’s overall architecture. MixMatch [25] is a semi-supervised classification model published in 2019. MixMatch applies k-rounds augmentation to original images and employs a sharpening algorithm to generate distinct pseudo-labels for them. Both labeled and unlabeled data are incorporated into the training process, with prediction consistency serving as the guiding supervision. FixMatch [26] is another semi-supervised classification model. It employs a blend of consistency regularization and pseudo-labeling within its semi-supervised training methodology. Pseudo-labels, serving as the supervision for predictions on strongly augmented unlabeled images, are generated from the model’s output on weakly augmented unlabeled images.

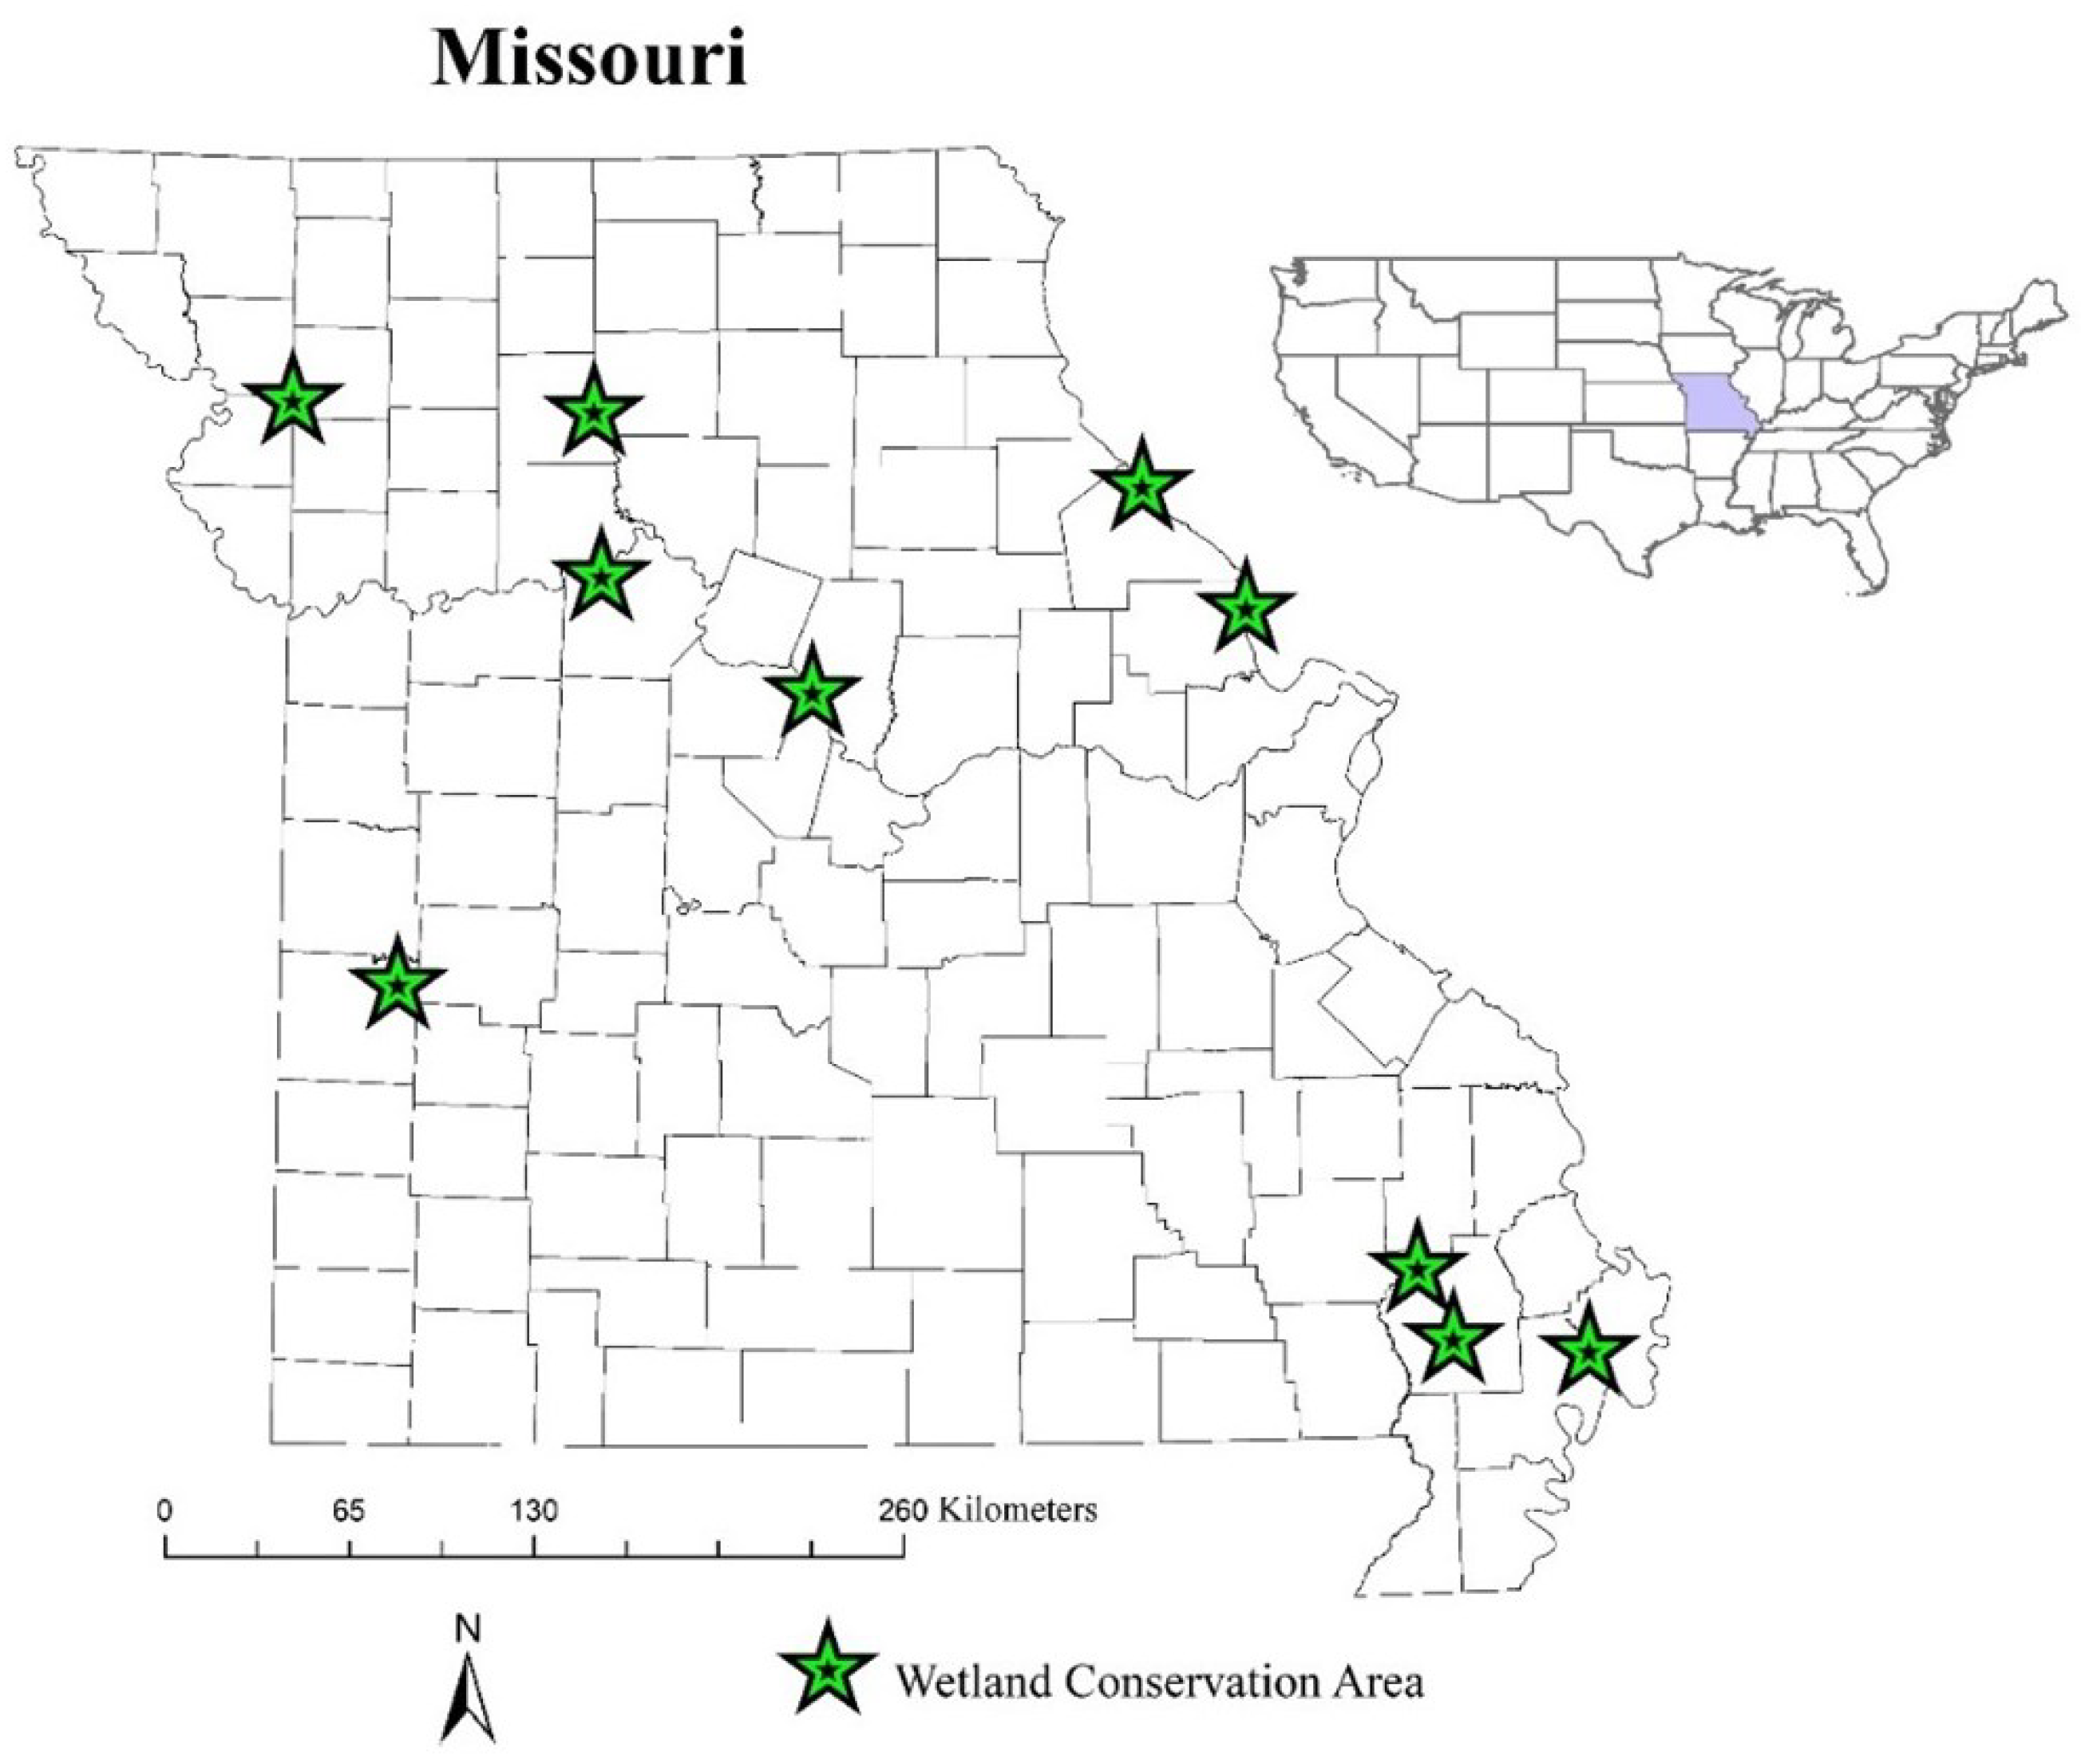
3. New Waterfowl Aerial-Image Datasets

3.1. Waterfowl-Detection Datasets

From images collected in Missouri conservation areas, we labeled 1237 aerial images (drone altitude 15–90 m) with 197,642 waterfowl and decoy labels and created four new waterfowl-detection datasets: Bird-G, Bird-H, Bird-I, and Bird-J, as shown in Table 1. These datasets were categorized based on the Missouri conservation areas from which the aerial images were collected. Compared with datasets Bird-A to Bird-F, these datasets are more practical as they encompass data collected across various seasons and altitudes, thus enhancing their comprehensiveness. The number of images, number of birds, drone flight altitudes, and target objects of each dataset are given in the table. We then divided each waterfowl-detection dataset into subsets of training (60%), validation (20%), and test (20%). In addition, we selected over 11,021 unlabeled aerial images to form an unlabeled dataset for semi-supervised learning experiments.
After the division into training, validation, and test subsets of Bird-G, Bird-I, and Bird-J, we combined the labeled datasets to form a big dataset named ’real-bird dataset’. This dataset was used in evaluating model performance across various model and training parameters. While annotating waterfowl instances, we also annotated the habitat and weather conditions of the aerial images. The testing data encompassed images captured at four different altitudes (15, 30, 60, and 90 m) in 11 distinct habitat conditions (i.e., HarvestedCrop, Ice, Land, Lotus, etc.) and two weather conditions (Cloudy and Sunny).

3.2. Waterfowl-Classification Dataset

We manually labeled the categories of waterfowl in the Bird-H and Bird-I datasets to create a real-bird classification dataset and a decoy-bird classification dataset. The real-bird classification dataset comprises 6986 waterfowl image crops—individual birds cropped from 15 m images in the Bird-I dataset. The images belong to 20 categories, including 19 waterfowl categories and 1 ‘Unknown’ category. Figure 2 shows the distribution of the waterfowl images across the 20 categories. These category labels have been assigned with high confidence by waterfowl experts within our team. The dataset division between the training and test sets for the real-bird classification dataset mirrors that of the Bird-I detection dataset, with a ratio of 5:1. However, it is important to note that this proportion may not be consistent across all classes.
To create an unlabeled training dataset for semi-supervised learning, we ran a pre-trained YOLOv5 model on all the images in the Unlabeled-K dataset to extract crops of bird images and filtered out low-quality crops using a confidence threshold of 0.5. This process yielded an unlabeled training dataset of 235,452 bird crops. While it is important to acknowledge that some crops containing waterfowl instances may be mistakenly removed, potentially reducing the transferability of the model to new datasets, these filtering methods can significantly decrease the number of crops without waterfowl.
The decoy-bird classification dataset contains around 10,000 decoy-bird crops from images in the Bird-H dataset. There are 10 different bird categories for images taken at four different heights. Considering the limited number of waterfowl instances, we divided the dataset into training and test sets and ignored the validation set. In the test set, we ensured an equal number of examples across all classes. The remaining examples were placed in the training set. In the case of the 90 m subset, we excluded the ‘female wigeon’ and ‘female pintail’ classes due to their limited number of images, which fell below 10, making them too small for reliable analysis. To investigate the impact of habitat on detection accuracy, we used three habitat subsets representing OpenWater, StandingCorn, and MoistSoil. Each subset was further divided into training and test sets, using the 7:3 ratio.

4. Methods

We applied some state-of-the-art deep learning methods to detect and classify waterfowl in drone images and compared their performances under various conditions.

4.1. Deep Learning Models for Waterfowl Detection

We applied both supervised models—including DeepForest Bird Detector, RetinaNet, Faster R-CNN, YOLOv5, and YOLONAS—and a semi-supervised model, Soft Teacher, to our waterfowl detection. The waterfowl objects in our datasets fall within the small-to-medium object category in object detection by the COCO [27] dataset guidelines. The bounding-box sizes for the waterfowl ranged from 18 × 18 pixels to 94 × 89 pixels.
During the Faster R-CNN training, we adjusted the initial size of the anchor boxes from [32, 64, 128, 256, 512] to [8, 16, 32, 64, 128] to align with typical waterfowl sizes. To accommodate higher waterfowl density, the RPN positive-sample fraction was increased from 0.5 to 0.8 and the RPN batch size from 256 to 512 to generate more positive samples in the Region Proposal Network training. The training parameters were set to 100 epochs, with early-stop tolerance of 30, a learning rate of 0.001, and a batch size of 4 for all the models. For input uniformity across the deep learning models, we cropped each training image into multiple non-overlapping 512 × 512 pixel images, facilitating training across various models.
During testing, we initially cropped each test image into 512 × 512 pixel images, which were then fed into the trained deep learning models. The resulting detections were aggregated to form predictions for the original test images. Performance metrics were computed based on these predictions and their corresponding ground-truth labels. For the semi-supervised detection models, unlabeled image crops in the Unlabeled-K dataset were prepared by cropping all the original aerial images into 512 × 512 pixel images.

4.2. Deep Learning Models for Waterfowl Classification

For the waterfowl classification, we applied two supervised classification models, EfficientNet and ResNet, and two semi-supervised classification models, MixMatch and FixMatch. After some basic parameter tuning by exploring a range of parameter values, we selected parameters that yielded good results across all of our experiments. In training, we used data augmentation that included random rotation and random horizontal flip. We tested two backbones, WiderResNet and ResNext, for the semi-supervised models. Across all the models, we set the training epochs to 300, the learning rate 0.0001, and the batch size to 32. Regarding the semi-supervised models, each training batch comprised 16 labeled and 16 unlabeled images.

4.3. Data Processing

We collected thousands of RGB aerial images featuring waterfowl and decoys, using a DJI Mavic Pro 2 drone across various conservation areas in Missouri. This drone has a 20 MP 1-inch CMOS sensor, providing a 66-degree field of view and images at a resolution of 5472 × 3648 pixels. For the waterfowl detection, we cropped each aerial image into 512 × 512 crops with an overlap of 20%. For the waterfowl classification, we resized the sizes of the waterfowl crop images to different sizes according to the altitudes of the drone-captured images. That is, we resized the crops into 128 × 128 pixels for 15 m images, 64 × 64 pixels for 30 m images, and 40 × 40 pixels for 60 m images. For the semi-supervised models (FixMatch and MixMatch), we resized the waterfowl crop images to 32 × 32 pixels to match the input requirements of WiderResNet, the backbone of the two semi-supervised models.

4.4. Evaluation Metrics

When evaluating the detection performance, we used Precision, Recall, F 1 , and mAP30 [2]:
P r e c i s i o n = t p t p + f p , R e c a l l = t p t p + f n ,
where t p is true positive and f p is false positive.
F 1 = 2 * P r e c i s i o n * R e c a l l P r e c i s i o n + R e c a l l .
I o U = I n t e r s e c t i o n a r e a o f t w o b o u n d i n g b o x e s U n i o n a r e a o f t w o b o u n d i n g b o x e s .
Note that mAP stands for mean Average Precision and that mAP30 is the mean Average Precision when the Intersection of Union (IoU) threshold is 30%.
When evaluating the classification performance, we used classification accuracy.

5. Experimental Results

The experiments were run on a Dell AlienWare desktop with Nvidia RTX 2070 GPU and 8 GB of memory.

5.1. Performance of Detectors Trained Using Individual Datasets

In this experiment, we separately applied Faster R-CNN, YOLOv5, YOLONAS, and Soft Teacher to each dataset. To elaborate, using the Bird-G dataset as an example, we trained each deep learning model using its allocated training and validation sets. Subsequently, the model’s performance was assessed and reported based on its test set.
Table 2 compares the mAP30 performances of four models on four datasets. YOLONAS was the best on average, reaching 86.66% mAP. Faster R-CNN and SoftTeacher were slightly worse than YOLONAS. YOLOv5 was the worst, only 77.16%, mainly due to its poor performance on Bird-H. None of the models performed the best across all datasets.

5.2. Performance of Detectors Trained Using All Datasets Combined

In this experiment, we trained each detection model using the combined training images from all the detection datasets. For fair comparison, we used the same parameters when training the detection models: 100 epochs, learning rate 0.01, and batch size 2. Then, we evaluated these trained models on the test set of each dataset. One exception was DeepForest Bird Detector. We did not re-train it and simply used the pre-trained weight from its public release.
Table 3 compares the mAP30 performances of six models on four datasets. Again, YOLONAS was the best on average, reaching 84.3% mAP. The pre-trained DeepForest Bird Detector was the worst, only 64.64%. None of the models performed the best across all datasets. YOLONAS was the best on Bird-H. YOLOv5 was the best on Bird-G and Bird-J. Faster R-CNN was the best on Bird-I.
We compared the results in Table 3 with those in Table 2, to assess the feasibility of training a generic model capable of achieving performance comparable to models trained on individual datasets. However, the results indicate that generic models generally perform worse than those trained on individual datasets, in terms of average mAP30, with the exception of YOLOv5. We observed that YOLOv5 performed less effectively on small datasets (Bird-H) during training. Increasing the number of training images can improve its performance.
Table 4 shows the training and inference times of these models. The semi-supervised model Soft Teacher was the slowest in training, about 30 times slower than RetinaNet, 17 times slower than YOLOv5 and YOLONAS, and 4 times slower than Faster R-CNN. In terms of inference time, Soft Teacher and Faster R-CNN had the same speed, about 4 times slower than the other models.
Figure 3 shows an example of the detection results of DeepForest Bird Detector and Faster R-CNN on an image of a flooded corn field. These results were generated by setting the models’ confidence threshold to 0.3.
To study the influence of environmental factors, e.g., habitats and light conditions, on detection accuracy, Table 5 compares the performances of those detectors trained using all datasets on images captured in different habitats and light conditions. The performance of those detectors exhibited significant variations, ranging from a low of 30% to a high of above 90%. For instance, in the Ice-habitat case, Faster R-CNN and RetinaNet achieved 99.05% and 89.76%, respectively, under Sunny conditions, but dropped to 70.68% and 34.28% under Cloudy skies. In comparison, YOLOv5 and YOLONAS performed consistently well in the Ice case under both Sunny and Cloudy skies. In the Land-habitat case, Faster R-CNN was the best, reaching 95.82% in Sunny conditions but only 74.29% in Cloudy conditions.
As the results show, for most of the habitats the detectors performed better on Sunny images. Yet, in the cases of the Wooded, Moist Soil, and StandingCorn habitats, most of the classifiers performed better on Cloudy images.

5.3. Performance of Altitude-Specific Detection Models

Based on the altitudes at which the aerial images in the datasets were captured, which were 15, 30, 60, and 90 m, we partitioned all the real-bird detection datasets (i.e., Bird-G, Bird-I, and Bird-J) into four distinct subsets. The division between the training and test sets within each subset remained consistent with the original dataset. We subsequently conducted separate training and testing of various models on these altitude-specific subsets.
Table 6 compares the performances of five models, in terms of mAP30 on datasets of different image-capturing altitudes. The results show a decrease in the performances of all the models as the altitude increased, which can be attributed to the decreasing size and resolution of waterfowl at higher altitudes. Faster R-CNN was the best for lower-altitude cases (i.e., 15 and 30 m), reaching 95.38% and 93.25% mAP. The two YOLO models performed better on higher-altitude images. The semi-supervised model Soft Teacher was competitive, but not the best for any altitude case.

5.4. Performance of Semi-Supervised Learning Detectors

In this experiment, we utilized the real-bird detection datasets to assess the efficacy of semi-supervised learning models. We varied the proportions of labeled training data, ranging from 10% to 50% of the training set for Soft Teacher, while the remainder served as unlabeled data. For comparison, Faster R-CNN was trained using the same amount of labeled data. Both models were trained using identical parameters, including 100 epochs, a learning rate of 0.01, and a batch size of 4. The performance metric was mAP30.
Table 7 compares the performance of Soft Teacher with that of Faster R-CNN when different amounts of labeled training examples were used in training. When a small amount of labeled training examples was used, such as 10%, Soft Teacher outperformed Faster R-CNN by a large margin (73.45% vs. 64.50%). As the amount of labeled training examples being used increased, the performances of both Soft Teacher and Faster R-CNN improved, and the difference between them decreased. Soft Teacher outperformed Faster R-CNN in all cases. The performance of Faster R-CNN trained by a 100% labeled training set was similar to that of Soft Teacher trained by a 50% labeled training set. We also noticed that models trained by 80% labeled images outperformed models trained by 100% labeled images and we believe that the inaccurate labels for the remaining 20% of images caused this performance difference.

5.5. Performances of Classification Models

In this experiment, we evaluated the classification performances of various deep learning models, including EfficientNet-b5, ResNet18, MixMatch, and FixMatch, using both our real-bird and decoy classification datasets. All the models were trained with a learning rate 0.00001 and a batch size of 4 and with early stopping—halting the training process when the validation accuracy showed no improvement for 15 consecutive epochs. The maximum number of training epochs was capped at 300. Since all the decoy image crops were labeled, we utilized unlabeled waterfowl crops from our unlabeled training set when training the semi-supervised models on the decoy classification training set.
Table 8 shows the classification accuracy of four models on decoy-bird-image crops taken at altitudes of 15, 30, 60, and 90 m, as well as on real-bird-image crops taken at an altitude of 15 m. The results show that the classification accuracy of all four models decreased as the image altitude increased. For instance, EfficientNet reached 91.58% on 15 m images, but only 41.05% on 90 m images. There was a big classification-accuracy drop from 30 m to 60 m. This leads us to the conclusion that images captured at 15 m and 30 m altitudes are suitable for bird classification in aerial images, while images captured at 60 m and 90 m are not.
In terms of overall performance, the two semi-supervised models, MixMatch and FixMatch, leveraged extra unlabeled training data and outperformed EfficientNet and ResNet18 on the 30, 60, and 90 m cases. However, EfficientNet was the best on the 15 m decoy case, whereas MixMatch was the best on the 15 m real-bird case.
Table 9 compares the performances of the four models on images captured in different habitats: OpenWater, MoistSoil, and StandingCorn. All the models achieved accuracy of over 90% on OpenWater images, lower than 80% on StandingCorn images, and from 70% to 54.78% on MoistSoil images. All the models were competitive in all cases, except that ResNet18 was much worse on MoistSoil images. These results underscore the considerable influence of various habitat types on classification accuracy.

6. Summary and Future Works

This paper presents our recent work, which involved the creation of new aerial-image datasets for waterfowl detection and classification and the adaptation and evaluation of popular supervised and semi-supervised deep learning models. Our experimental results for semi-supervised learning models showed their ability to slightly improve detection and classification performance using unlabeled data. Furthermore, we showed that altitude-specific detection models achieved improved detection results over altitude-blind detection models. Multiple models delivered strong performance, particularly excelling in images captured at 15 and 30 m, where they achieved detection accuracy exceeding 90%. Our experimental results also showed that different image contexts, such as different habitat and weather conditions, had significant impact on detection and classification accuracy. Additionally, we evaluated several classification models using our classification dataset and compared their performance across images taken at different heights and in various habitats. These models delivered good performance on images captured at 15 and 30 m, achieving accuracy from 80% to 90%.
While labeling aerial images of waterfowl, we observed a disparity in their distribution across habitats. There was a high-density distribution in habitats such as water and ice, while habitats like land and crops showed a lower-density distribution. In future work, we aim to identify the distribution patterns and to adjust the focus of our models accordingly.
When evaluating detection models on waterfowl datasets, we observed a significant disparity between image crops containing birds (foreground images) and those without birds (background images). The proportion of negative samples in the training set plays a critical role in the model’s ability to accurately predict False Positives. Our future work will focus on developing a dynamic training strategy to determine the optimal proportion of negative samples in the training set.
Transformer-based object detection and classification models have exhibited promising performance. Our future work will involve training and testing these models, with a focus on comparing their performance against convolution-based models.

Author Contributions

Conceptualization, Y.Z., A.R., L.W. and Y.S.; methodology, Y.Z. and Y.S.; software, Y.Z., Y.F., S.W., Z.T. and Z.Z.; validation, Y.Z.; formal analysis, Y.Z.; investigation, Y.Z., Y.F., Z.T., R.V. and Z.Z.; resources, Y.Z., Y.F., Z.T. and Z.Z.; data curation, Y.Z., Y.F., Z.T., R.V. and Z.Z.; writing—original draft preparation, Y.Z.; writing—review and editing, Y.S.; visualization, Y.Z.; supervision, Y.S.; project administration, Y.S.; funding acquisition, A.R., L.W. and Y.S. All authors have read and agreed to the published version of the manuscript.

Funding

This research was funded by the Department of Conservation, Missouri. The Missouri Cooperative Fish and Wildlife Research Unit is jointly sponsored by the Missouri Department of Conservation, the University of Missouri, the U.S. Fish and Wildlife Service, the U.S. Geological Survey, and the Wildlife Management Institute. Any use of trade, firm, or product names is for descriptive purposes only and does not imply endorsement by the U.S. Government.

Institutional Review Board Statement

Not applicable.

Informed Consent Statement

This article does not contain any studies performed by any of the authors that involved human participants.

Data Availability Statement

Check our website to obtain sample data: https://waterfowldetector.readthedocs.io.

Conflicts of Interest

The authors declare no conflicts of interest.

References

  1. Missouri Department of Conservation. Wetland Planning Initiative Implementation Plan; Missouri Department of Conservation: St. Charles, MO, USA, 2019. [Google Scholar]
  2. Tang, Z.; Zhang, Y.; Wang, Y.; Shang, Y.; Viegut, R.; Webb, E.; Raedeke, A.; Sartwell, J. sUAS and Machine Learning Integration in Waterfowl Population Surveys. In Proceedings of the 2021 IEEE 33rd International Conference on Tools with Artificial Intelligence (ICTAI), Washington, DC, USA, 1–3 November 2021; pp. 517–521. [Google Scholar]
  3. Zhang, Y.; Wang, S.; Zhai, Z.; Shang, Y.; Viegut, R.; Webb, E.; Raedeke, A.; Sartwell, J. Development of New Aerial Image Datasets and Deep Learning Methods for Waterfowl Detection and Classification. In Proceedings of the 2022 IEEE 4th International Conference on Cognitive Machine Intelligence (CogMI), Atlanta, GA, USA, 14–17 December 2022; pp. 117–124. [Google Scholar] [CrossRef]
  4. Ren, S.; He, K.; Girshick, R.; Sun, J. Faster R-CNN: Towards Real-Time Object Detection with Region Proposal Networks. In Proceedings of the Advances in Neural Information Processing Systems; Cortes, C., Lawrence, N., Lee, D., Sugiyama, M., Garnett, R., Eds.; Curran Associates, Inc.: Red Hook, NY, USA, 2015; Volume 28. [Google Scholar]
  5. He, K.; Gkioxari, G.; Dollár, P.; Girshick, R. Mask R-CNN. In Proceedings of the 2017 IEEE International Conference on Computer Vision (ICCV), Venice, Italy, 22–29 October 2017; pp. 2980–2988. [Google Scholar] [CrossRef]
  6. Tan, M.; Pang, R.; Le, Q.V. EfficientDet: Scalable and Efficient Object Detection. In Proceedings of the 2020 IEEE/CVF Conference on Computer Vision and Pattern Recognition (CVPR), Seattle, WA, USA, 13–19 June 2020; pp. 10778–10787. [Google Scholar]
  7. Lin, T.Y.; Goyal, P.; Girshick, R.; He, K.; Dollár, P. Focal Loss for Dense Object Detection. IEEE Trans. Pattern Anal. Mach. Intell. 2020, 42, 318–327. [Google Scholar] [CrossRef] [PubMed]
  8. Ma, W.; Wang, X.; Yu, J. A Lightweight Feature Fusion Single Shot Multibox Detector for Garbage Detection. IEEE Access 2020, 8, 188577–188586. [Google Scholar] [CrossRef]
  9. Redmon, J.; Divvala, S.; Girshick, R.; Farhadi, A. You Only Look Once: Unified, Real-Time Object Detection. In Proceedings of the 2016 IEEE Conference on Computer Vision and Pattern Recognition (CVPR), Las Vegas, NV, USA, 27–30 June 2016; pp. 779–788. [Google Scholar] [CrossRef]
  10. Aharon, S.; Louis-Dupont; Oferbaratz; Masad, O.; Yurkova, K.; Fridman, L.; Lkdci; Khvedchenya, E.; Rubin, R.; Bagrov, N.; et al. Super-Gradients, 2021. Available online: https://zenodo.org/records/7789328 (accessed on 29 February 2024).
  11. Ultralytics. YOLOv5: A State-of-the-Art Real-Time Object Detection System. 2021. Available online: https://docs.ultralytics.com (accessed on 29 February 2024).
  12. Carion, N.; Massa, F.; Synnaeve, G.; Usunier, N.; Kirillov, A.; Zagoruyko, S. End-to-End Object Detection with Transformers. In Proceedings of the Computer Vision—ECCV 2020, Glasgow, UK, 23–28 August 2020; pp. 213–229. [Google Scholar]
  13. Zhu, X.; Su, W.; Lu, L.; Li, B.; Wang, X.; Dai, J. Deformable DETR: Deformable Transformers for End-to-End Object Detection. arXiv 2020, arXiv:2010.04159. [Google Scholar]
  14. Zong, Z.; Song, G.; Liu, Y. DETRs with Collaborative Hybrid Assignments Training. arXiv 2022, arXiv:2211.12860. [Google Scholar]
  15. Weinstein, B.G.; Marconi, S.; Aubry-Kientz, M.; Vincent, G.; Senyondo, H.; White, E.P. DeepForest: A Python package for RGB deep learning tree crown delineation. Methods Ecol. Evol. 2020, 11, 1743–1751. [Google Scholar] [CrossRef]
  16. Tarvainen, A.; Valpola, H. Mean teachers are better role models: Weight-averaged consistency targets improve semi-supervised deep learning results. In Proceedings of the Advances in Neural Information Processing Systems 30: Annual Conference on Neural Information Processing Systems 2017, Long Beach, CA, USA, 4–9 December 2017; Volume 30. [Google Scholar]
  17. Jeong, J.; Lee, S.; Kim, J.; Kwak, N. Consistency-based semi-supervised learning for object detection. In Proceedings of the Advances in Neural Information Processing Systems 32: Annual Conference on Neural Information Processing Systems 2019, Vancouver, BC, Canada, 8–14 December 2019; Volume 32. [Google Scholar]
  18. Xu, M.; Zhang, Z.; Hu, H.; Wang, J.; Wang, L.; Wei, F.; Bai, X.; Liu, Z. End-to-End Semi-Supervised Object Detection with Soft Teacher. In Proceedings of the IEEE/CVF International Conference on Computer Vision (ICCV), Montreal, QC, Canada, 10–17 October 2021; pp. 3060–3069. [Google Scholar]
  19. Liu, Y.C.; Ma, C.Y.; He, Z.; Kuo, C.W.; Chen, K.; Zhang, P.; Wu, B.; Kira, Z.; Vajda, P. Unbiased Teacher for Semi-Supervised Object Detection. In Proceedings of the International Conference on Learning Representations (ICLR), Virtual Event, Austria, 3–7 May 2021. [Google Scholar]
  20. Krizhevsky, A.; Sutskever, I.; Hinton, G.E. ImageNet Classification with Deep Convolutional Neural Network. Commun. ACM 2017, 60, 84–90. [Google Scholar] [CrossRef]
  21. Wei, W.; Yang, Y.; Wang, X.; Wang, W.; Li, J. Development of convolutional neural network and its application in image classification: A survey. Opt. Eng. 2019, 58, 040901. [Google Scholar]
  22. Simonyan, K.; Zisserman, A. Very Deep Convolutional Networks for Large-Scale Image Recognition. In Proceedings of the International Conference on Learning Representations, San Diego, CA, USA, 7–9 May 2015. [Google Scholar]
  23. He, K.; Zhang, X.; Ren, S.; Sun, J. Deep Residual Learning for Image Recognition. In Proceedings of the IEEE Conference on Computer Vision and Pattern Recognition, Las Vegas, NV, USA, 27–30 June 2016. [Google Scholar]
  24. Tan, M.; Le, Q.V. EfficientNet: Rethinking Model Scaling for Convolutional Neural Networks. In Proceedings of the International Conference on Machine Learning, Long Beach, CA, USA, 10–15 June 2019. [Google Scholar]
  25. Berthelot, D.; Carlini, N.; Goodfellow, I.J.; Papernot, N.; Oliver, A.; Raffel, C. MixMatch: A Holistic Approach to Semi-Supervised Learning. arXiv 2019, arXiv:1905.02249. [Google Scholar]
  26. Sohn, K.; Berthelot, D.; Li, C.L.; Zhang, Z.; Carlini, N.; Cubuk, E.D.; Kurakin, A.; Zhang, H.; Raffel, C. FixMatch: Simplifying Semi-Supervised Learning with Consistency and Confidence. In Proceedings of the Advances in Neural Information Processing Systems 33: Annual Conference on Neural Information Processing Systems 2020, Virtual, 6–12 December 2020. [Google Scholar]
  27. Lin, T.; Maire, M.; Belongie, S.J.; Bourdev, L.D.; Girshick, R.B.; Hays, J.; Perona, P.; Ramanan, D.; Doll’ar, P.; Zitnick, C.L. Microsoft COCO: Common Objects in Context. arXiv 2014, arXiv:1405.0312. [Google Scholar]
Figure 1. A map of Missouri with star marks to indicate the distribution of the habitats in which we conducted the waterfowl survey.
Information 15 00157 g001
Figure 2. Distribution of waterfowl image examples in training and test sets across 20 categories in the real-bird classification dataset.
Information 15 00157 g002
Figure 3. Detection results of the DeepForest Bird Detector: (a) Faster R-CNN. (b) YOLOV5. (c) YOLONAS. (d) An image of a flooded corn field. In each image, green boxes denote True Positive (TP) predictions, yellow boxes denote False Positive (FP) predictions, and red boxes denote False Negative (FN) predictions.
Information 15 00157 g003
Table 1. Summary of waterfowl-detection datasets created based on collected aerial images.
Dataset NameNo. of ImagesNo. of BirdsAltitude (m)Object
Bird-G18162,75815–90Birds
Bird-H17716,73815–90Decoys
Bird-I171705815Birds
Bird-J708111,08815–90Birds
Unlabeled-K11,021Unknown15–90Birds
Table 2. Test performances of individually trained detection models, in terms of mAP30 (%).
Faster R-CNNYOLOv5YOLONASSoftTeacher
Bird-G89.7689.4286.6288.73
Bird-H81.7752.1491.5278.56
Bird-I94.5788.4889.295.54
Bird-J73.6078.6179.2371.43
Average84.9277.1686.6683.31
Table 3. Test performances of detection models trained using all datasets, in terms of mAP30 (%).
DeepForestRetinaNetFaster
R-CNN
YOLOv5YOLONASSoft
Teacher
Bird-G76.6089.6989.6791.0884.5688.56
Bird-H55.6581.6982.8868.7888.1182.45
Bird-I77.4185.4888.8587.0787.5784.46
Bird-J48.9374.7174.4888.9876.9772.20
Average64.6482.8983.7183.9784.3081.91
Table 4. Comparison of training and inference times (in seconds) of detection models. The models were trained for 1000 iterations. Inference time was for one drone image.
DeepForestRetinaNetFaster
R-CNN
YOLOv5YOLONASSoft
Teacher
Training-3624759581014
Inference0.90.94.31.11.04.2
Table 5. Test performances of detectors trained using all datasets combined in terms of mAP30 (%) on bird images in different habitat and light conditions.
Faster R-CNNYOLOv5YOLONASRetinaNetSoft Teacher
SunnyCloudySunnyCloudySunnyCloudySunnyCloudySunnyCloudy
HarvestedCrop91.1875.4182.9336.1684.1571.7756.1050.1590.7572.90
Ice99.0570.6899.3798.4899.3392.6989.7634.2896.6649.00
Land95.8274.2988.7166.9590.5668.9973.1148.8568.0361.81
Lotus88.2485.7079.3266.1685.5981.7588.2485.8856.0874.99
MoistSoil93.1390.2072.9893.5986.5891.9976.4484.6178.6571.91
OpenWater98.6787.1899.0993.0597.8991.3098.1183.9889.0944.10
ShrubScrub93.73-56.81-89.15-64.01-84.80-
StandingCorn90.7593.3655.0669.4683.2086.0787.2772.5175.8874.70
WaterCorn95.4891.6971.2768.0391.7888.5694.8766.2483.2152.99
Wooded81.9292.8867.6692.1678.0287.2989.0488.1358.1975.33
Table 6. Test performances of altitude-specific models, in terms of mAP30 (%), on images captured at different altitudes.
AltitudeFaster
R-CNN
RetinaNetYOLOv5YOLONASSoft
Teacher
15 m95.3886.2085.3793.9692.59
30 m93.2590.5480.7891.2392.27
60 m87.5643.9386.2191.4188.58
90 m81.6762.9490.5888.7077.23
Table 7. Test performances of Faster R-CNN and Soft Teacher, in terms of mAP30 (%) when trained using a proportion of the training set (10%, 20%, 50%, and 100%) as labeled data.
Labeled Training Set Proportion
10%20%50%100%
Faster R-CNN67.5074.1278.1782.79
Soft Teacher73.4577.7482.65-
Table 8. Classification accuracy (%) of five classification models on 15, 30, 60, and 90 m waterfowl classification datasets.
EfficientNetResNet18MixMatchFixMatch
15 m real bird81.6578.3782.8880.70
15 m decoy91.5889.7887.5488.71
30 m decoy79.9876.7481.3480.09
60 m decoy43.7540.6646.4048.80
90 m decoy41.0536.7247.9246.25
Table 9. Classification accuracy (%) of four deep learning models on images captured over three different habitats in the decoy classification dataset.
EfficientNetResNet18MixMatchFixMatch
OpenWater93.4691.2592.1893.57
MoistSoil70.7754.7871.5872.53
StandingCorn83.6882.4484.5581.56
Disclaimer/Publisher’s Note: The statements, opinions and data contained in all publications are solely those of the individual author(s) and contributor(s) and not of MDPI and/or the editor(s). MDPI and/or the editor(s) disclaim responsibility for any injury to people or property resulting from any ideas, methods, instructions or products referred to in the content.

