Article

Explainable Machine Learning Method for Aesthetic Prediction of Doors and Home Designs

by
Jean-Sébastien Dessureault
1,2,*,
Félix Clément
1,
Seydou Ba
1,
François Meunier
1 and
Daniel Massicotte
2
1
Departement of Mathematics and Computer Science, Université du Québec à Trois-Rivières, Trois-Rivières, QC G8Z 4M3, Canada
2
Departement of Electrical and Computer Engineering, Université du Québec à Trois-Rivières, Trois-Rivières, QC G8Z 4M3, Canada
*
Author to whom correspondence should be addressed.
Information 2024, 15(4), 203; https://doi.org/10.3390/info15040203
Submission received: 21 February 2024 / Revised: 24 March 2024 / Accepted: 29 March 2024 / Published: 5 April 2024
(This article belongs to the Special Issue Advances in Explainable Artificial Intelligence, 2nd Edition)

Abstract

:
The field of interior home design has witnessed a growing utilization of machine learning. However, the subjective nature of aesthetics poses a significant challenge due to its variability among individuals and cultures. This paper proposes an applied machine learning method to enhance manufactured custom doors in a proper and aesthetic home design environment. Since there are millions of possible custom door models based on door types, wood species, dyeing, paint, and glass types, it is impossible to foresee a home design model fitting every custom door. To generate the classification data, a home design expert has to label thousands of door/home design combinations with the different colors and shades utilized in home designs. These data train a random forest classifier in a supervised learning context. The classifier predicts a home design according to a particular custom door. This method is applied in the following context: A web page displays a choice of doors to a customer. The customer selects the desired door properties, which are sent to a server that returns an aesthetic home design model for this door. This door configuration generates a series of images through the Unity 3D engine module, which are returned to the web client. The customer finally visualizes their door in an aesthetic home design context. The results show the random forest classifier’s good performance, with an accuracy level of 86.8%, in predicting suitable home design, marking the way for future developments requiring subjective evaluations. The results are also explained using a feature importance graphic, a decision tree, a confusion matrix, and text.

1. Introduction

Machine learning has been increasingly applied to the field of aesthetics, particularly in the context of furniture and home design. One of the critical challenges in this domain is the subjective nature of aesthetics, which can vary significantly across individuals and cultures. However, recent studies have shown that machine learning algorithms can learn to recognize patterns and features commonly associated with aesthetic preferences and use this knowledge to predict new designs. For example, the authors of [1] implemented an intelligent aesthetic evaluation of the interior design framework to help people choose the appropriate and practical interior design from collected images or mobile digital devices. The authors of [2] studied the creative style and aesthetic properties of materials used in arts and crafts, conducting a thorough investigation to understand their development and explore their creative potential.
The authors of [3] proposed a style-based image suggestion framework to search for room ideas and relevant products for a given query image. A deep neural network classifier was trained by focusing on high-volume classes with high-agreement samples using a Visual Geometry Group (VGG) architecture, which is a standard deep Convolutional Neural Network (CNN). The proposed approach in [4] involved using classifiers to predict sales prices based on architectural styles. By comparing the classifications generated by machine learning models and human experts, the study determined the conditions under which ML classifiers could be as reliable as human experts in mass appraisal models. In their paper, the authors of [5] introduced a multi-scene deep learning model (MSDLM) that facilitates the automatic learning of aesthetic features. The MSDLM utilizes discriminative pre-training of multi-group descriptors to extract scene-specific aesthetic features and mitigate the influence of noisy data during model construction.
Overall, the use of machine learning in the field of aesthetics holds great promise for improving the design of furniture and home design products. By leveraging data and algorithms, designers can gain new insights into aesthetic preferences and develop more innovative and aesthetically pleasing products. However, there is still much work to be done in this domain, particularly in addressing the subjective and culturally contingent nature of aesthetics. Future research must continue exploring these challenges and developing new techniques and models for understanding and predicting aesthetic preferences.
A random forest (RF) algorithm, as described in [6,7,8], was used to categorize data that portray the combination of a door and home decor based on aesthetics. This approach employs decision trees and Bayesian network techniques and has numerous applications. For instance, in [9], an RF implementation was used to assess feature importance in detecting network intrusions. To reduce a dataset’s cardinality, the RF algorithm selects some features, identifying the most relevant elements to retain.
In [10,11], the A I 2 framework was utilized to apply machine learning techniques. It employs an NLP interface, enabling non-experts to use machine learning algorithms without proficiency in programming languages. The framework’s primary characteristic is its ability to execute machine learning algorithms via English language input, facilitating its usage. Additionally, it incorporates greenhouse gas (GHG) awareness, which provides strategies for evaluating GHG emissions generated by algorithms and offers alternative solutions that bypass energy-intensive algorithms. Furthermore, the framework addresses the black-box problem associated with traditional machine learning methods by utilizing texts, graphics, and tables to explain the algorithm’s process. This research focuses on A I 2 ’s explainability features rather than its chatbot NLP function.
The dataset utilized for this study is entirely generated before the RF classifier’s training process. This type of classifier performs well when the features include labels rather than continuous features. Since this is the case for the features in our dataset, the RF algorithm is the best choice.
The generation process involves the sequential generation of random door and decor features. An expert in interior design is then required to classify each combination as either “YES”, indicating that the combination is aesthetically pleasing, or “NO”, indicating the opposite. The only requirement is knowing whether the combination is aesthetic (“1”) or not (“0”). Each row in the dataset consists of columns “Door model”, ”Wood texture”, “Dyeing texture”, “Paint texture”, “Glass texture”, “Home design model”, “Home design characteristic 1”, “Home design characteristic 2”, and a class column (with possible values of 0 or 1). The classifier’s dataset contains 2533 data instances, each of which is an expert evaluation of the aesthetic of a door/home design combination.
No academic or legal qualification allows one to be an “expert in home design”. In the case of this study, the expert was designated by the door manufacturer on a confidence basis. This same criterion will be used in the future if the model has to be retrained. It is the door manufacturer’s task to find someone of confidence who will train the model on a combination of doors and home designs that enhance the products.
This study presents two significant contributions to the field of applied machine learning. Firstly, it proposes an applied method for predicting the aesthetic appeal of a home design by analyzing the combination of a door and a home design. Secondly, it validates a recent explainable framework named A I 2 . The proposed method for predicting the aesthetic appeal of a home design is a valuable contribution to machine learning as it provides a practical solution for analyzing the combination of a door and a home design. This approach has potential applications in interior design, where designers can use this method to evaluate the aesthetic appeal of different combinations of doors and home designs. It uses the extended explainable methods of the A I 2 framework to obtain enhanced results. Overall, the contributions of this study are significant, as they provide practical solutions to real-world problems in interior design and data analysis. This study’s findings can inform future research and inspire new approaches to machine learning and data analysis.
This paper is organized as follows. Section 2 describes the proposed methodology. Section 3 presents the results. Section 4 discusses the results and their meaning, and Section 5 concludes this research.

2. Applied Machine Learning Methodology

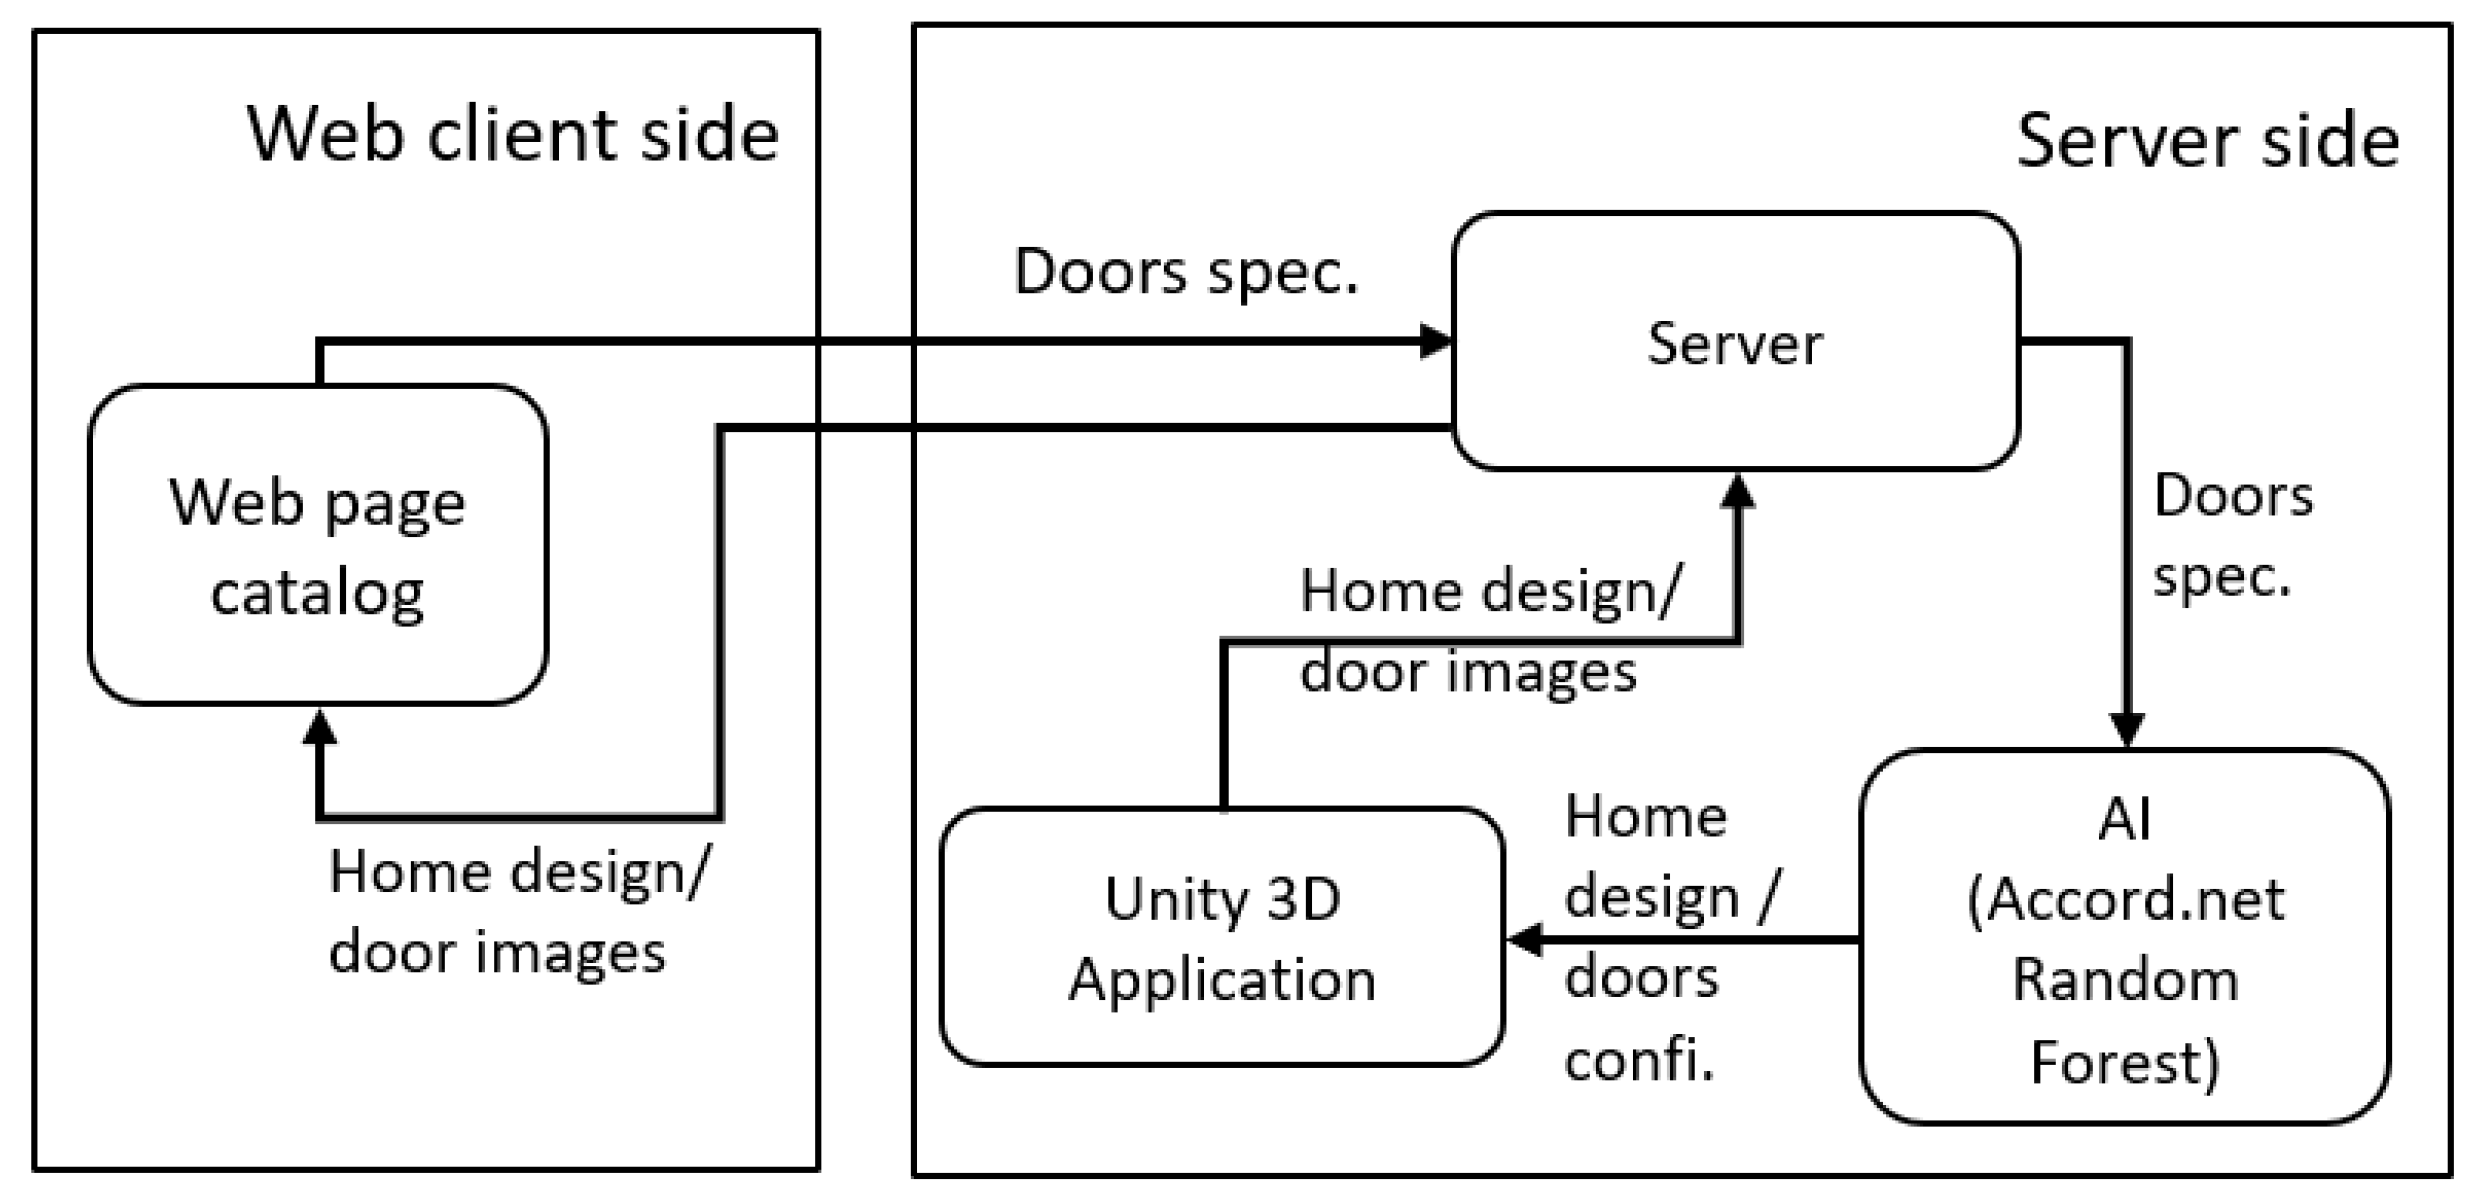
2.1. Web Client–Server Architecture

The system is deployed on a web client and a server, as shown in Figure 1. The web client displays a product catalog from a custom door manufacturer named Portes Milette in Quebec, Canada. For customers, the website allows the selection of different door characteristics. These characteristics are “Door model”, “Wood texture”, “Dyeing texture”, “Paint texture”, and ”Glass texture”. The global objective of the mandate was to enhance the visual perception of the doors by rendering high-quality images of the doors alone and in a home design context. Not every custom door fits every home design. The style, color, stain, and glass of the door must be aesthetic in terms of the characteristics of the home design. The type of room (bedroom, kitchen, bedroom) and its color must match the door. To complete the task, the selection of a suitable home design according to the door specifications and the generation of the images are done on the server side. Server software is used to communicate with the web pages. It receives requests from the web client, including the specifications of the door.
The software receives the door specifications and returns some suitable and aesthetic home design images of the door alone and in a home design context. This image generation methodology is further documented in Section 2.3. These images are returned to the catalog on the client side and displayed on the web page.

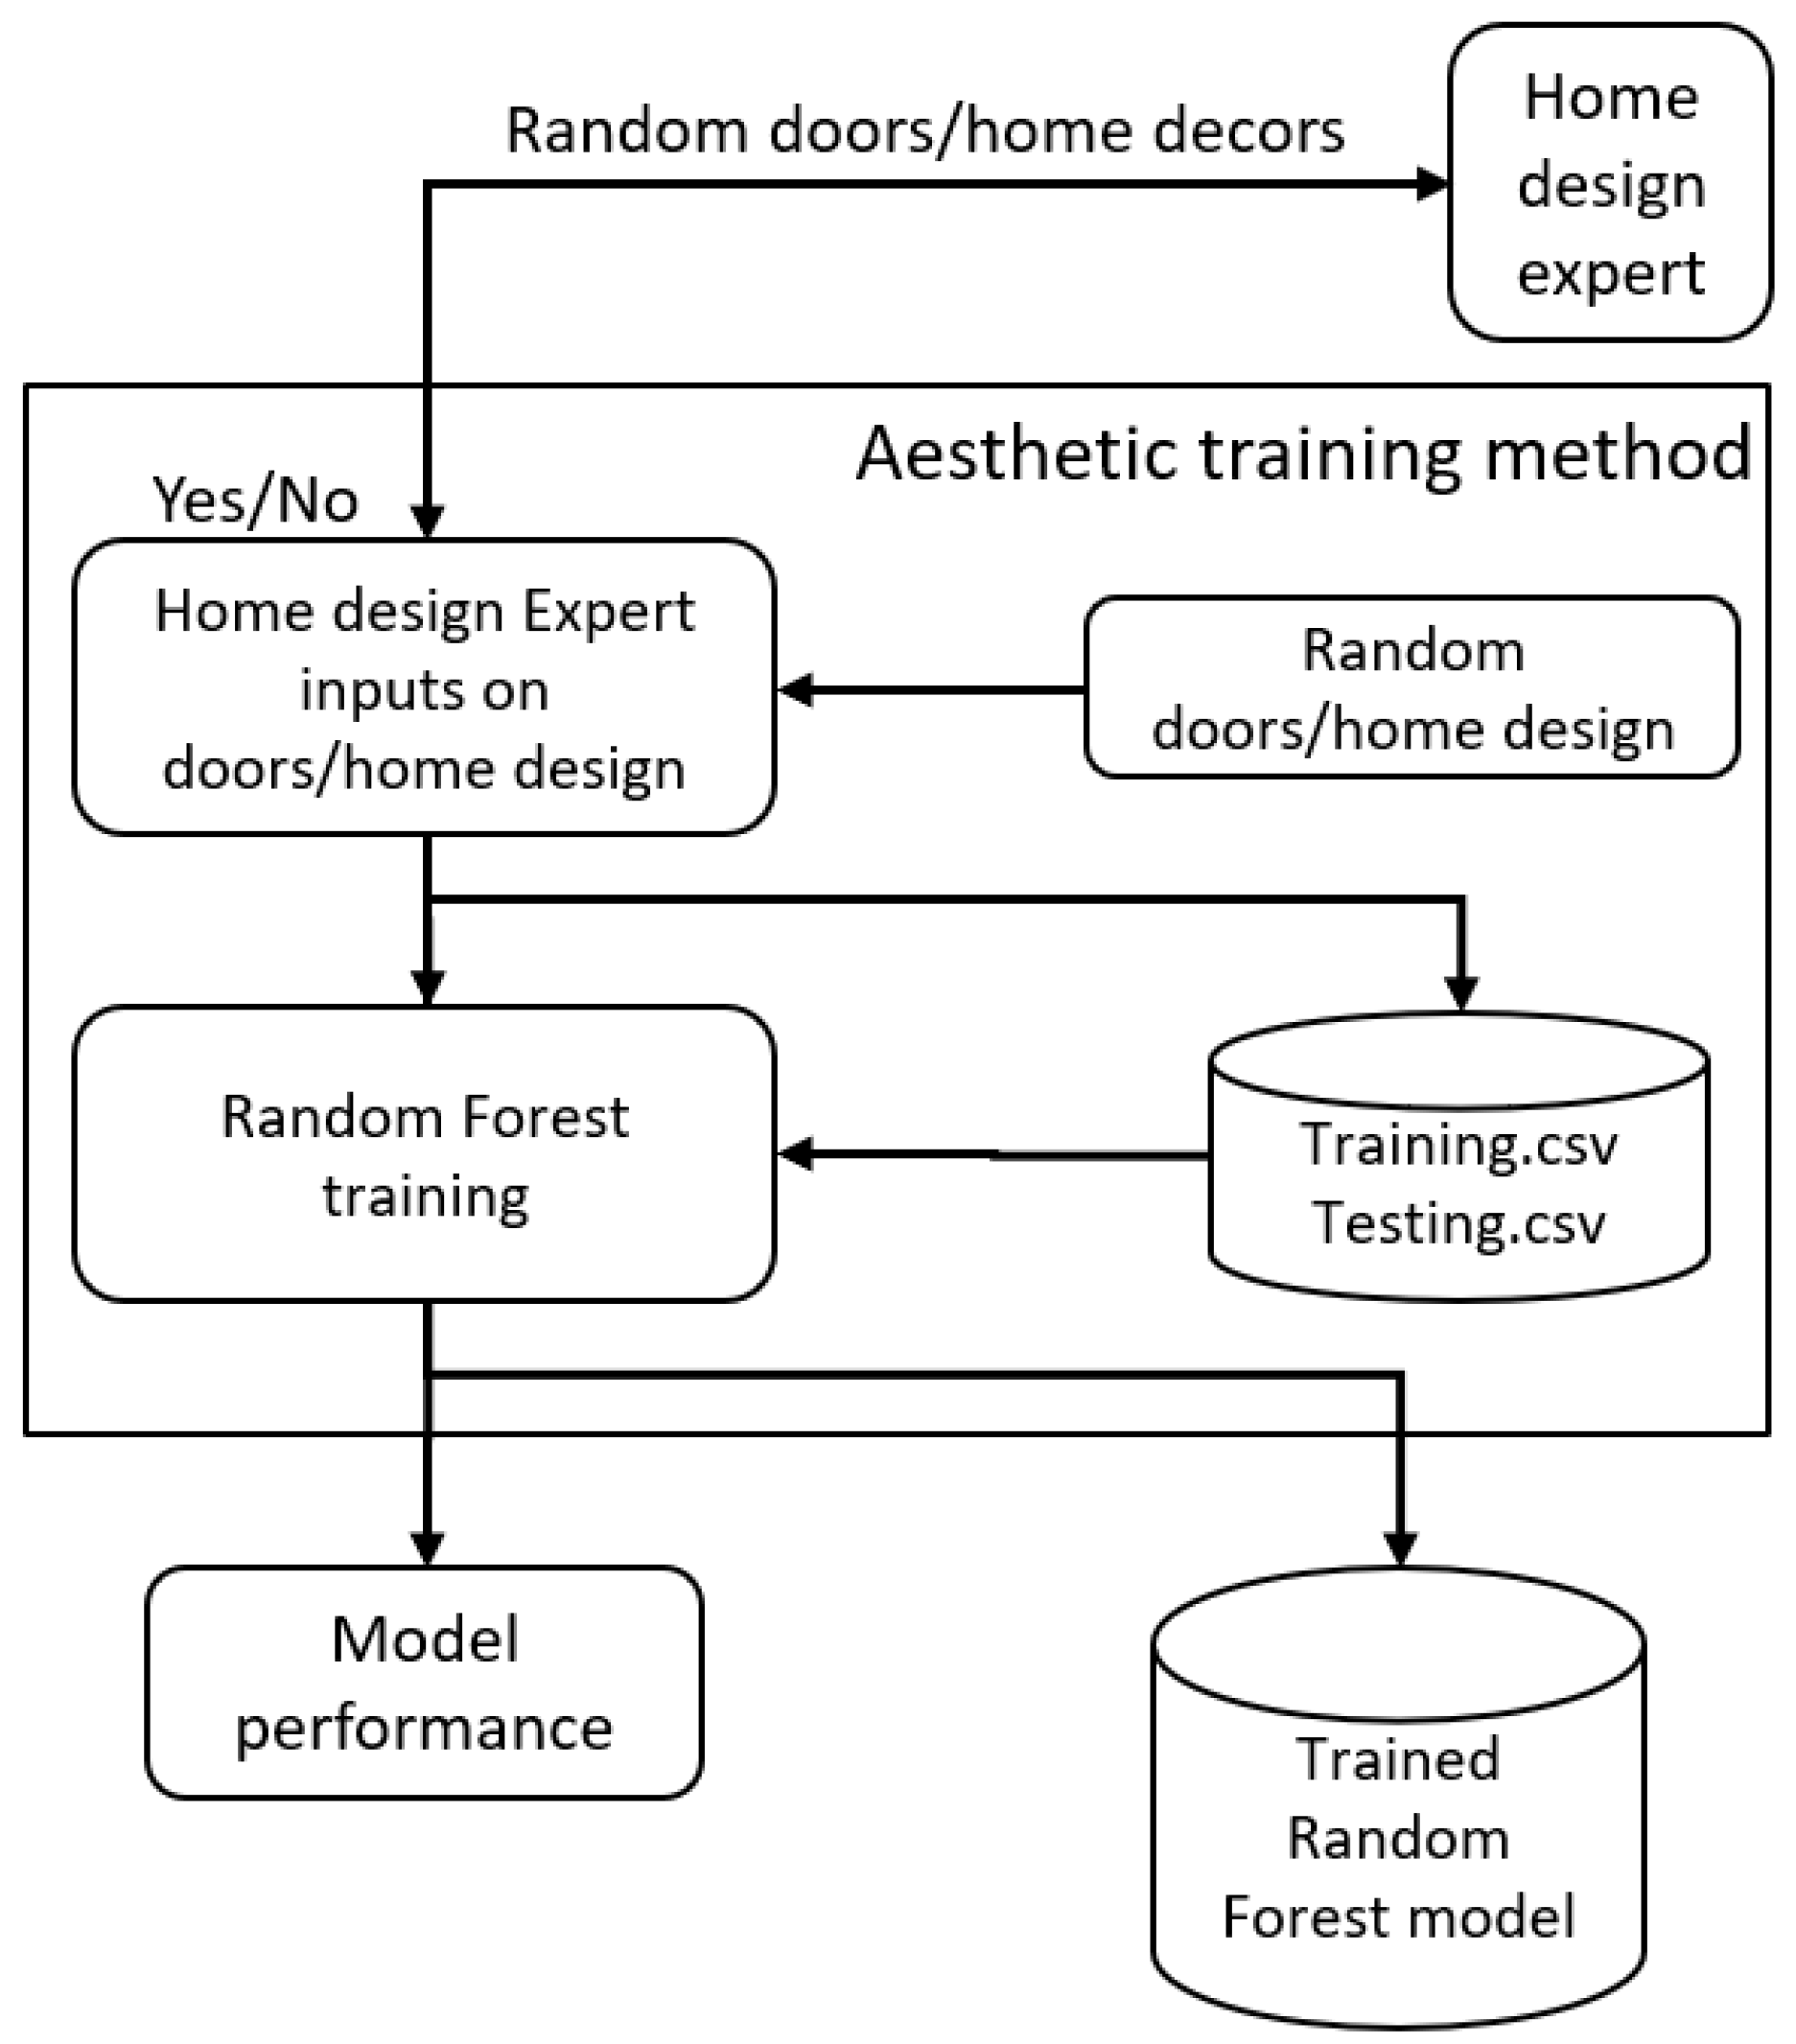
2.2. Training Module

The first part of the architecture constructs the training file and trains with these data using an RF classifier. Figure 2 shows this process. A random door/interior design is generated and displayed to a home design expert. This expert has to classify this image combination as either “YES” (1) or “NO” (0). “YES” means that the combination is aesthetically appealing, whereas "NO" means that the combination is not appropriate. A class label is assigned to each presented image, and a row is added to the training.csv file. Table 1 describes each feature in the training file.
Algorithms like XGBoost, GBM, LightGBM, Extra Trees, and other decision tree-based classifiers could have been preferable alternatives to an RF classifier; however, the constraints of our project necessitated the utilization of a C# library. In this context, we selected the Accord.net framework, primarily due to its compatibility with C# and Unity 3D. XGBoost and others were also not integrated into the new AI2 machine learning framework. The RF classifier was, in this context, the best available option.
The accumulated data were based on the availability of the home design expert and the minimum training data required to obtain satisfactory performance. This research set this dataset to 2533 combinations of doors/home design, where 1281 (50.57%) were marked as aesthetic, and 1252 (49.42%) were marked as unaesthetic. With this dataset, the classifier (an RF algorithm) can be used to train the model. For this RF algorithm, the two most important parameters are n-estimators (set to 100) and criterion (set to ‘gini’). The n-estimators is the number of decision trees pooled by the RF algorithm. In decision trees, the Gini impurity is utilized to assess the homogeneity or impurity of a data split. This metric gauges the probability of misidentifying a randomly chosen element from the dataset if it is mislabeled based on the class distribution in the split. Ultimately, this trained model was saved, and its performance could be evaluated with a fraction (20%) of the training data. These 20% represent the last data recorded in the dataset. In that specific case, we know that the classes and random data are equally distributed as in the first 80%. The model did not use any cross-validation to improve its accuracy. This is a constraint of the Accord.net machine learning platform. Platforms based on C# that can be used in Unity 3D usually have fewer features compared to others used in Python or R. The random forest training method does not allow cross-validation. Table 2 summarizes the statistics of the data. An 80-20% ratio was sufficient to properly train the RF algorithm and to keep enough data for evaluating the classifier’s performance.

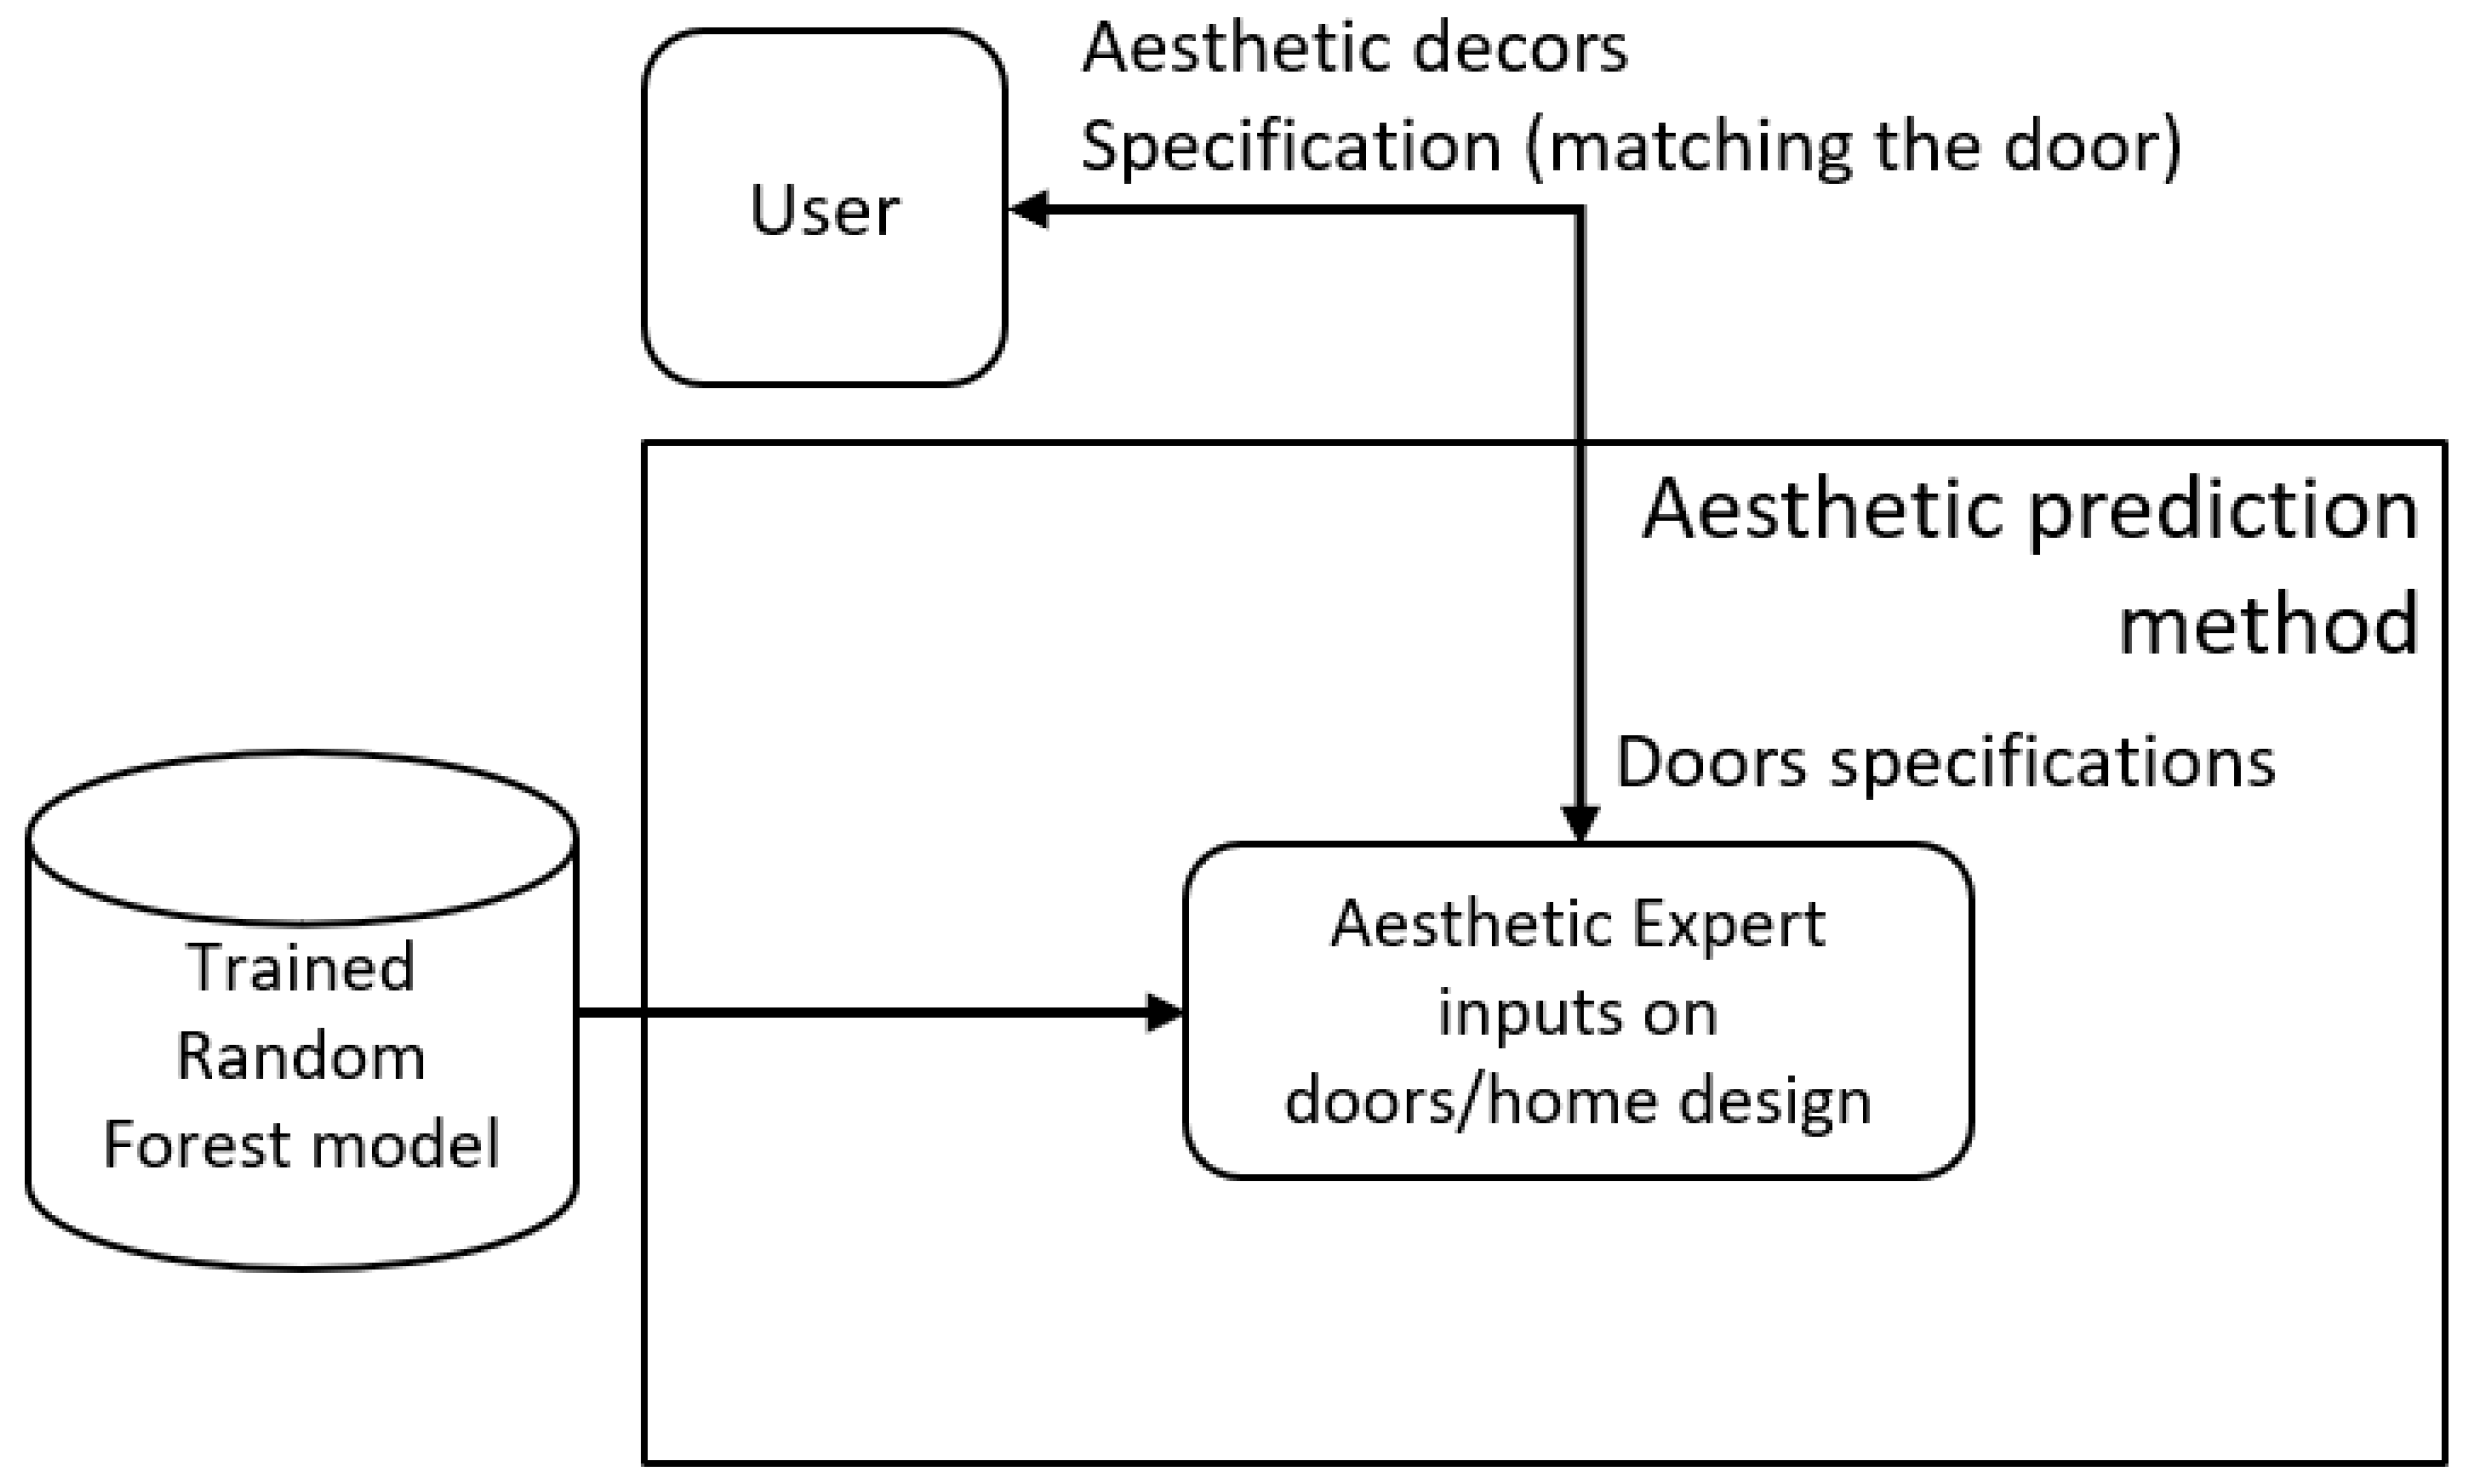
2.3. Prediction Module

This second part of the architecture uses the previously trained RF classifier to propose a suitable home design according to some of the door’s characteristics. Figure 3 shows this process.
This part is executed on the Portes Milette experimental website in a Unity 3D interface. Visitors may select their custom door’s characteristics (No. 1 to 4 in Table 1). Then, the RF algorithm has to find a suitable (class “YES” or “1”) home design. A loop is executed to randomly generate home designs, in which the RF-trained model makes a prediction. It loops until a suitable home design (class “YES” (1)) is found. Then, this suitable combination of door/interior design is displayed to the web visitor.

3. Results

3.1. Aesthetic Prediction

Part of the data (20%) has been kept to evaluate the model’s performance. These data calculate the ratio of good classifications divided by the total of classification attempts. The model accuracy is 86.8%.
The classifier receives the specifications of a door as a parameter. It loops until it finds a suitable aesthetic home design, which is returned to the client-side web page. In other words, the system randomly generates home designs until it finds a combination door/home design that returns a value of “1” (judged aesthetic by the expert). Figure 4, Figure 5, Figure 6 and Figure 7 show four aesthetic images combining a door and a home design, while Figure 8 and Figure 9 present samples of images rejected by the home design expert.
The standard RF method traditionally yields this type of result. However, current state-of-the-art ML practices suggest systematically emphasizing results and explainability for ethical purposes. This consideration is discussed further in Section 3.2.

3.2. Explaining the Results with the A I 2 Framework

Section 3.1 primarily presented the results. We must now apply current explainability concepts to enhance the results. Explainability is now an unavoidable requirement in modern machine learning algorithms. In this context, results must be justified when the data are accumulated from expert subjective experiences. The tool used to generate the images is Unity 3D [12], and it is not the most suitable for advanced machine learning methods. The main reason is that this tool uses the C# programming language, whereas most of the best machine learning tools are available in Python. To explain the results, the A I 2 framework is used. It has some built-in explainable functionalities that can help better understand the predictions. For a random forest algorithm, A I 2 proposes four different ways to present explanations of results: (1) feature importance graphics, (2) decision tree representations, (3) confusion matrices, and (4) explanation texts. Note that the classifier’s result of 86.1% is slightly different than the 86.8% previously observed. The reason is that those results come from two different RF algorithms (C# Accord.net and Python A I 2 ). There might be a slight difference in the random initialization.

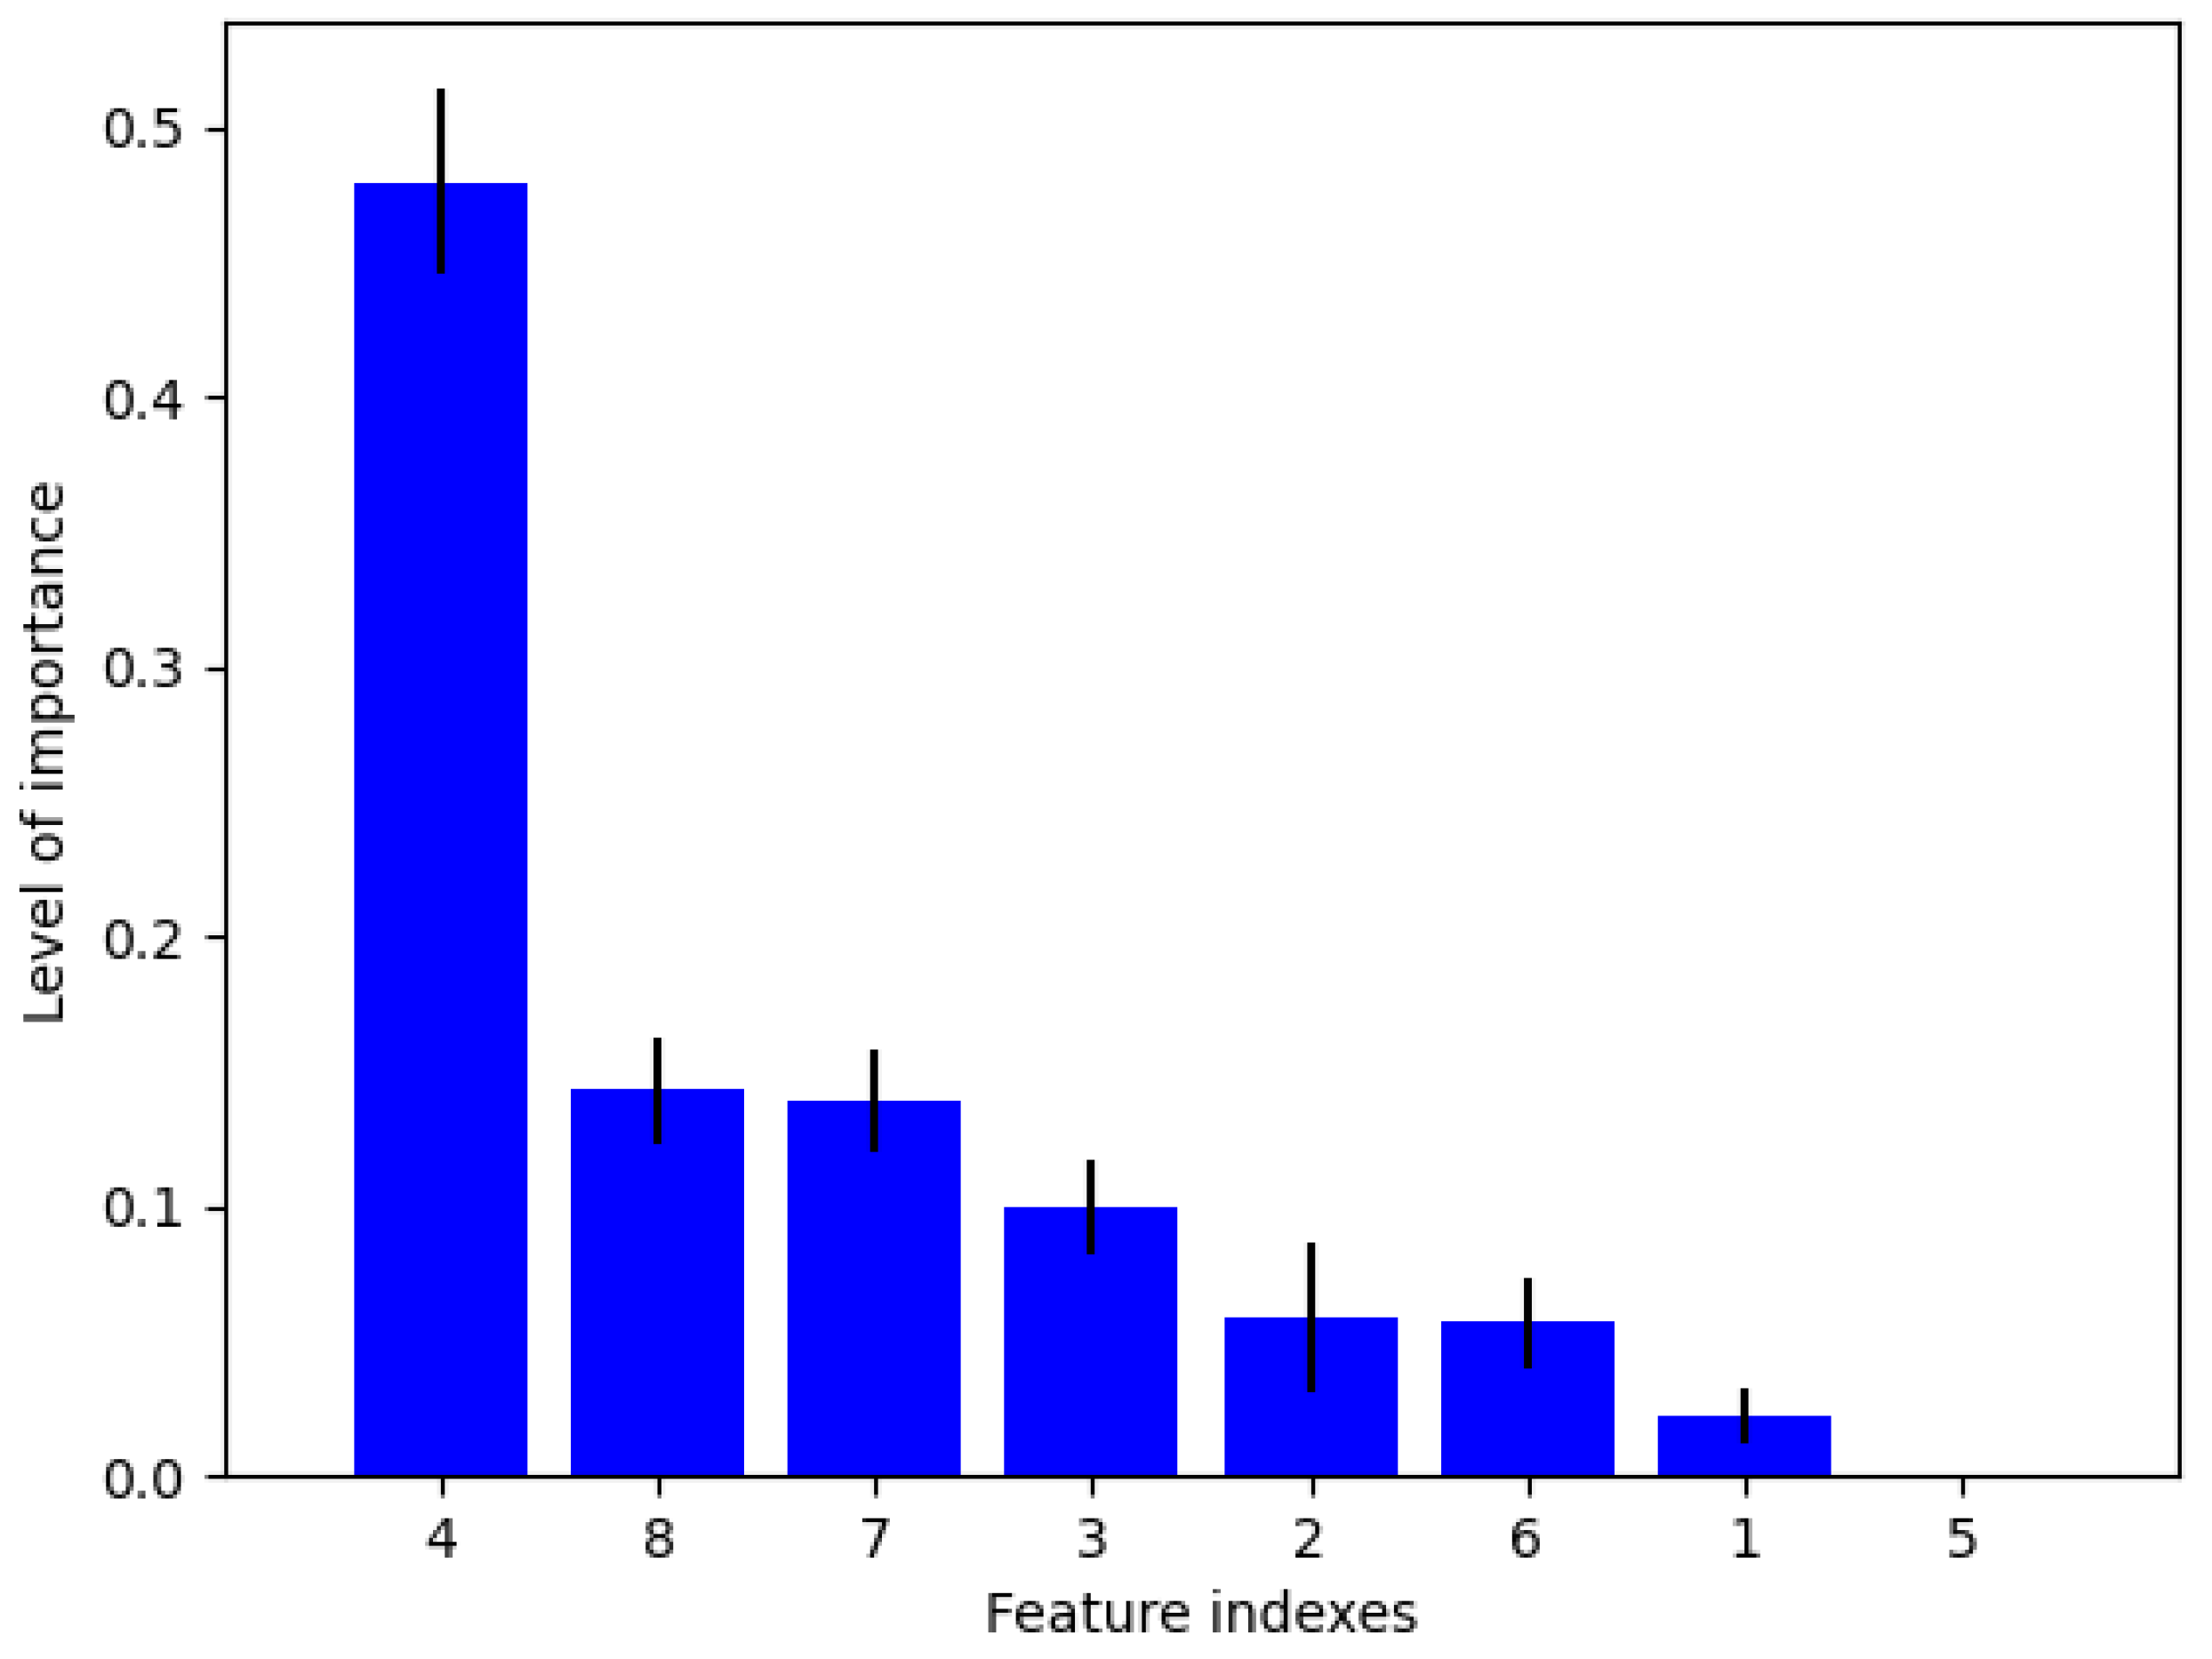
3.2.1. Feature Importance

Feature importance is a critical aspect of machine learning models and enables the identification of the most significant predictors of the target variable. Random forest classifiers determine feature importance by calculating each feature’s mean decrease in impurity or Gini importance. The mean decrease in impurity measures the reduction in the impurity of the nodes in the tree. At the same time, the Gini importance calculates the total reduction in the Gini index brought about by each feature. The feature importance score generated by a random forest classifier ranks each predictor’s importance, thus providing insights into the underlying relationship between the independent and dependent variables. Understanding feature importance is crucial in determining which features to include or exclude from a predictive model, thus improving the accuracy of the model’s predictions. Figure 10 shows a feature importance graphic generated using the A I 2 .explain() method.
The blue bars represent the normalized (distributing the values between 0 and 1, using the normalize function of sklearn.preprocessing) value of each feature’s importance. The black lines show the standard deviation of the values. All the feature numbers refer to the features presented in Table 1. It can be concluded that the paint color is the most important feature in selecting an aesthetic/unaesthetic combination. Feature 5 (type of glass) is not important at all. Indeed, this characteristic was not implemented in this first version. A LaTeX text describing the graphic is also generated to better explain the results.
Note that depending on the door model, only some features are used simultaneously. For instance, a door can be dyed, so no paint is required. Also, some doors have glass, whereas others do not.

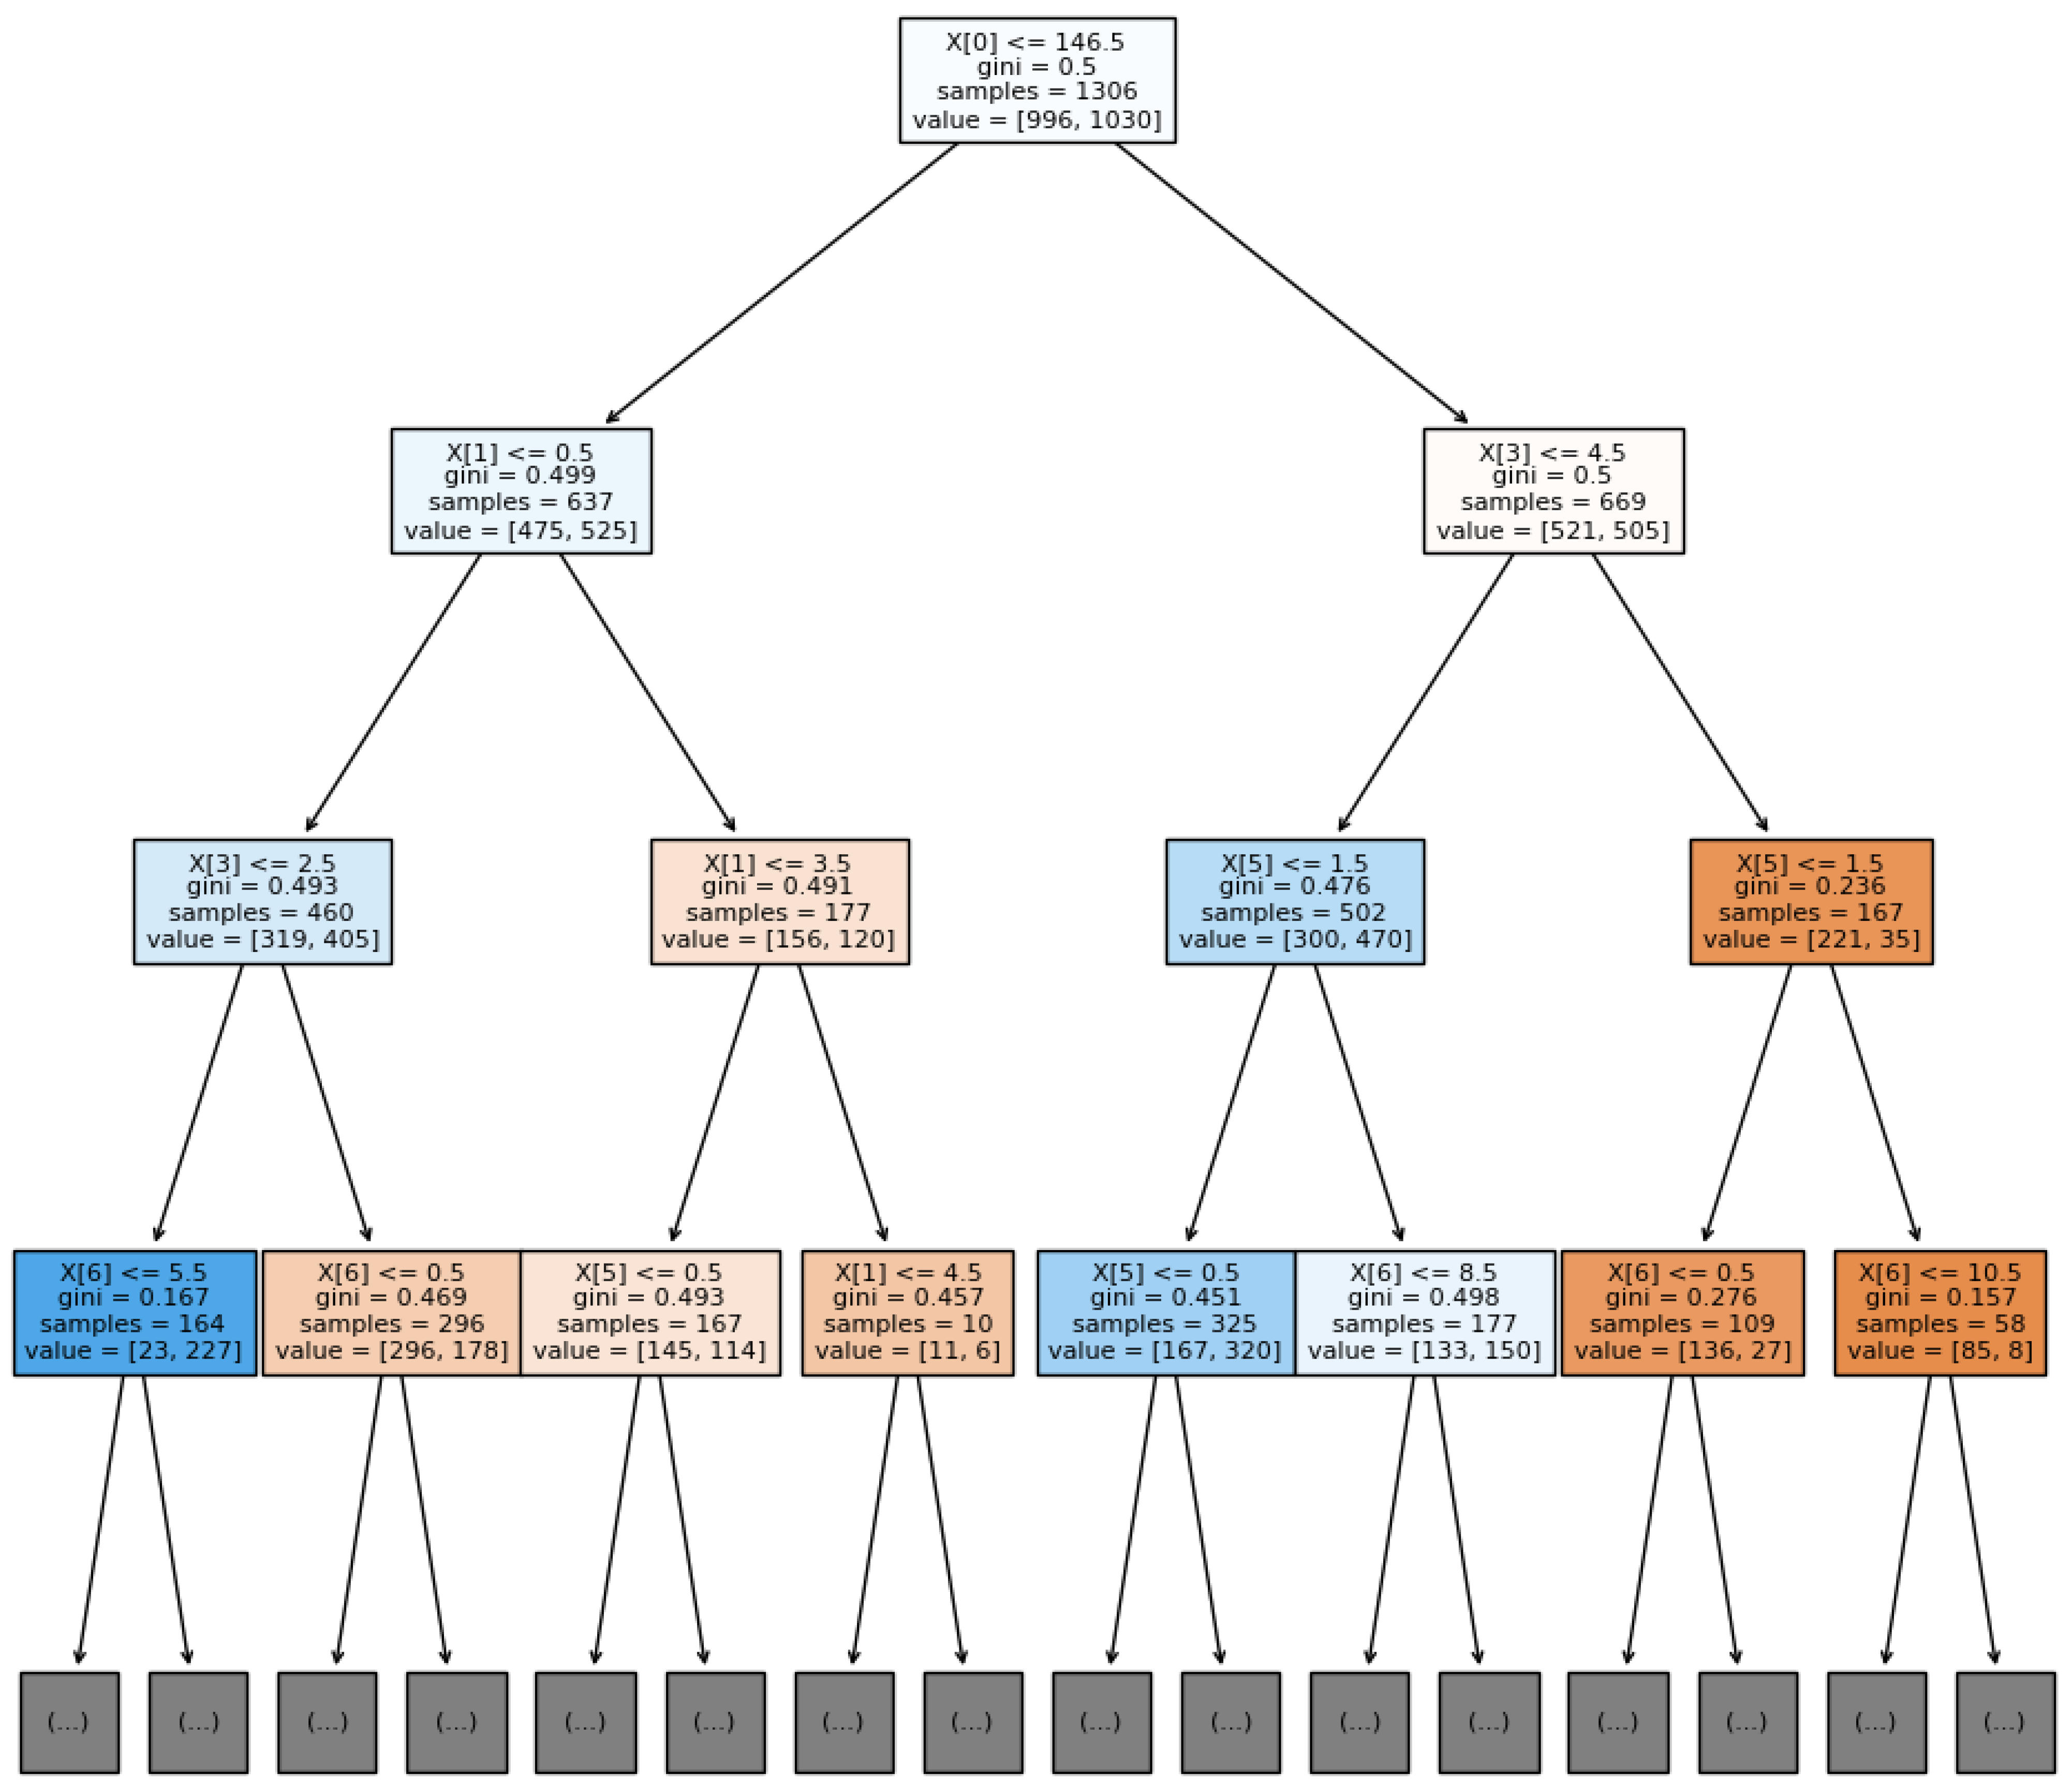
3.2.2. Decision Tree

A decision tree graph is a decision support tool representing a decision-making process in a tree-like structure. It is a graphical representation of a decision tree algorithm, a popular machine learning technique for predictive modeling and data mining.
At each node of the decision tree, a decision is made based on the value of a specific input feature or attribute. The tree branches out based on the possible outcomes of the decision, with each branch representing a possible value of the next feature or attribute in the decision-making process. The process continues until a final decision or prediction is made. The decision tree graph is an intuitive, easy-to-interpret representation of complex decision-making processes.
The graphic in Figure 11 depicts the feature importance generated using the A I 2 .explain() method. There are many decision trees pooled in an RF algorithm. In this case, 250 decision trees are included in the whole algorithm. The graphic shows the first one as an example. Others are similar without being identical.
This graphic allows us to visualize the decision tree model. The branches of a decision tree represent the different paths the data can take based on the features and their values. Each branch corresponds to a particular decision or split made at a specific node in the tree.
The equation in each box represents the condition used to decide that particular node. It specifies a feature and a threshold value, and the data points are divided into two groups based on whether they satisfy the condition. For example, an equation could be “X[0] <= 0.5”, which means that if the value of Feature 0 (Feature 1 in Table 1) for a data point is less than or equal to 0.5, it follows the left branch; otherwise, it follows the right branch.
The Gini value measures the impurity or uncertainty in a node and quantifies how well the data points in that node are classified. A Gini value of 0 indicates that all the data points in the node belong to the same class. In contrast, a Gini value of 0.5 represents maximum impurity, indicating an equal distribution of data points across different classes.
The sample field in each box represents the number of data points that reach that particular node. It indicates the total count of samples that satisfy the conditions leading to that node. The values field represents the class distribution of the samples in that node.
In the visualization, the orange and blue colors represent different classes. In this case, classes 0 (orange) and 1 (blue) mean aesthetic or unaesthetic door/room combinations, respectively. Each leaf node in the decision tree is associated with a specific class, and the color indicates the predominant class in that leaf node. For example, if orange is the dominant color in a leaf node, most samples reaching that node belong to the orange class.
Overall, the decision tree visualization helps understand the decision-making process of the model, the splits made at each node based on feature conditions, the distribution of samples across nodes, and the final class assignments in the leaf nodes.
To better explain the results, a LaTeX text is generated that describes the graphic.

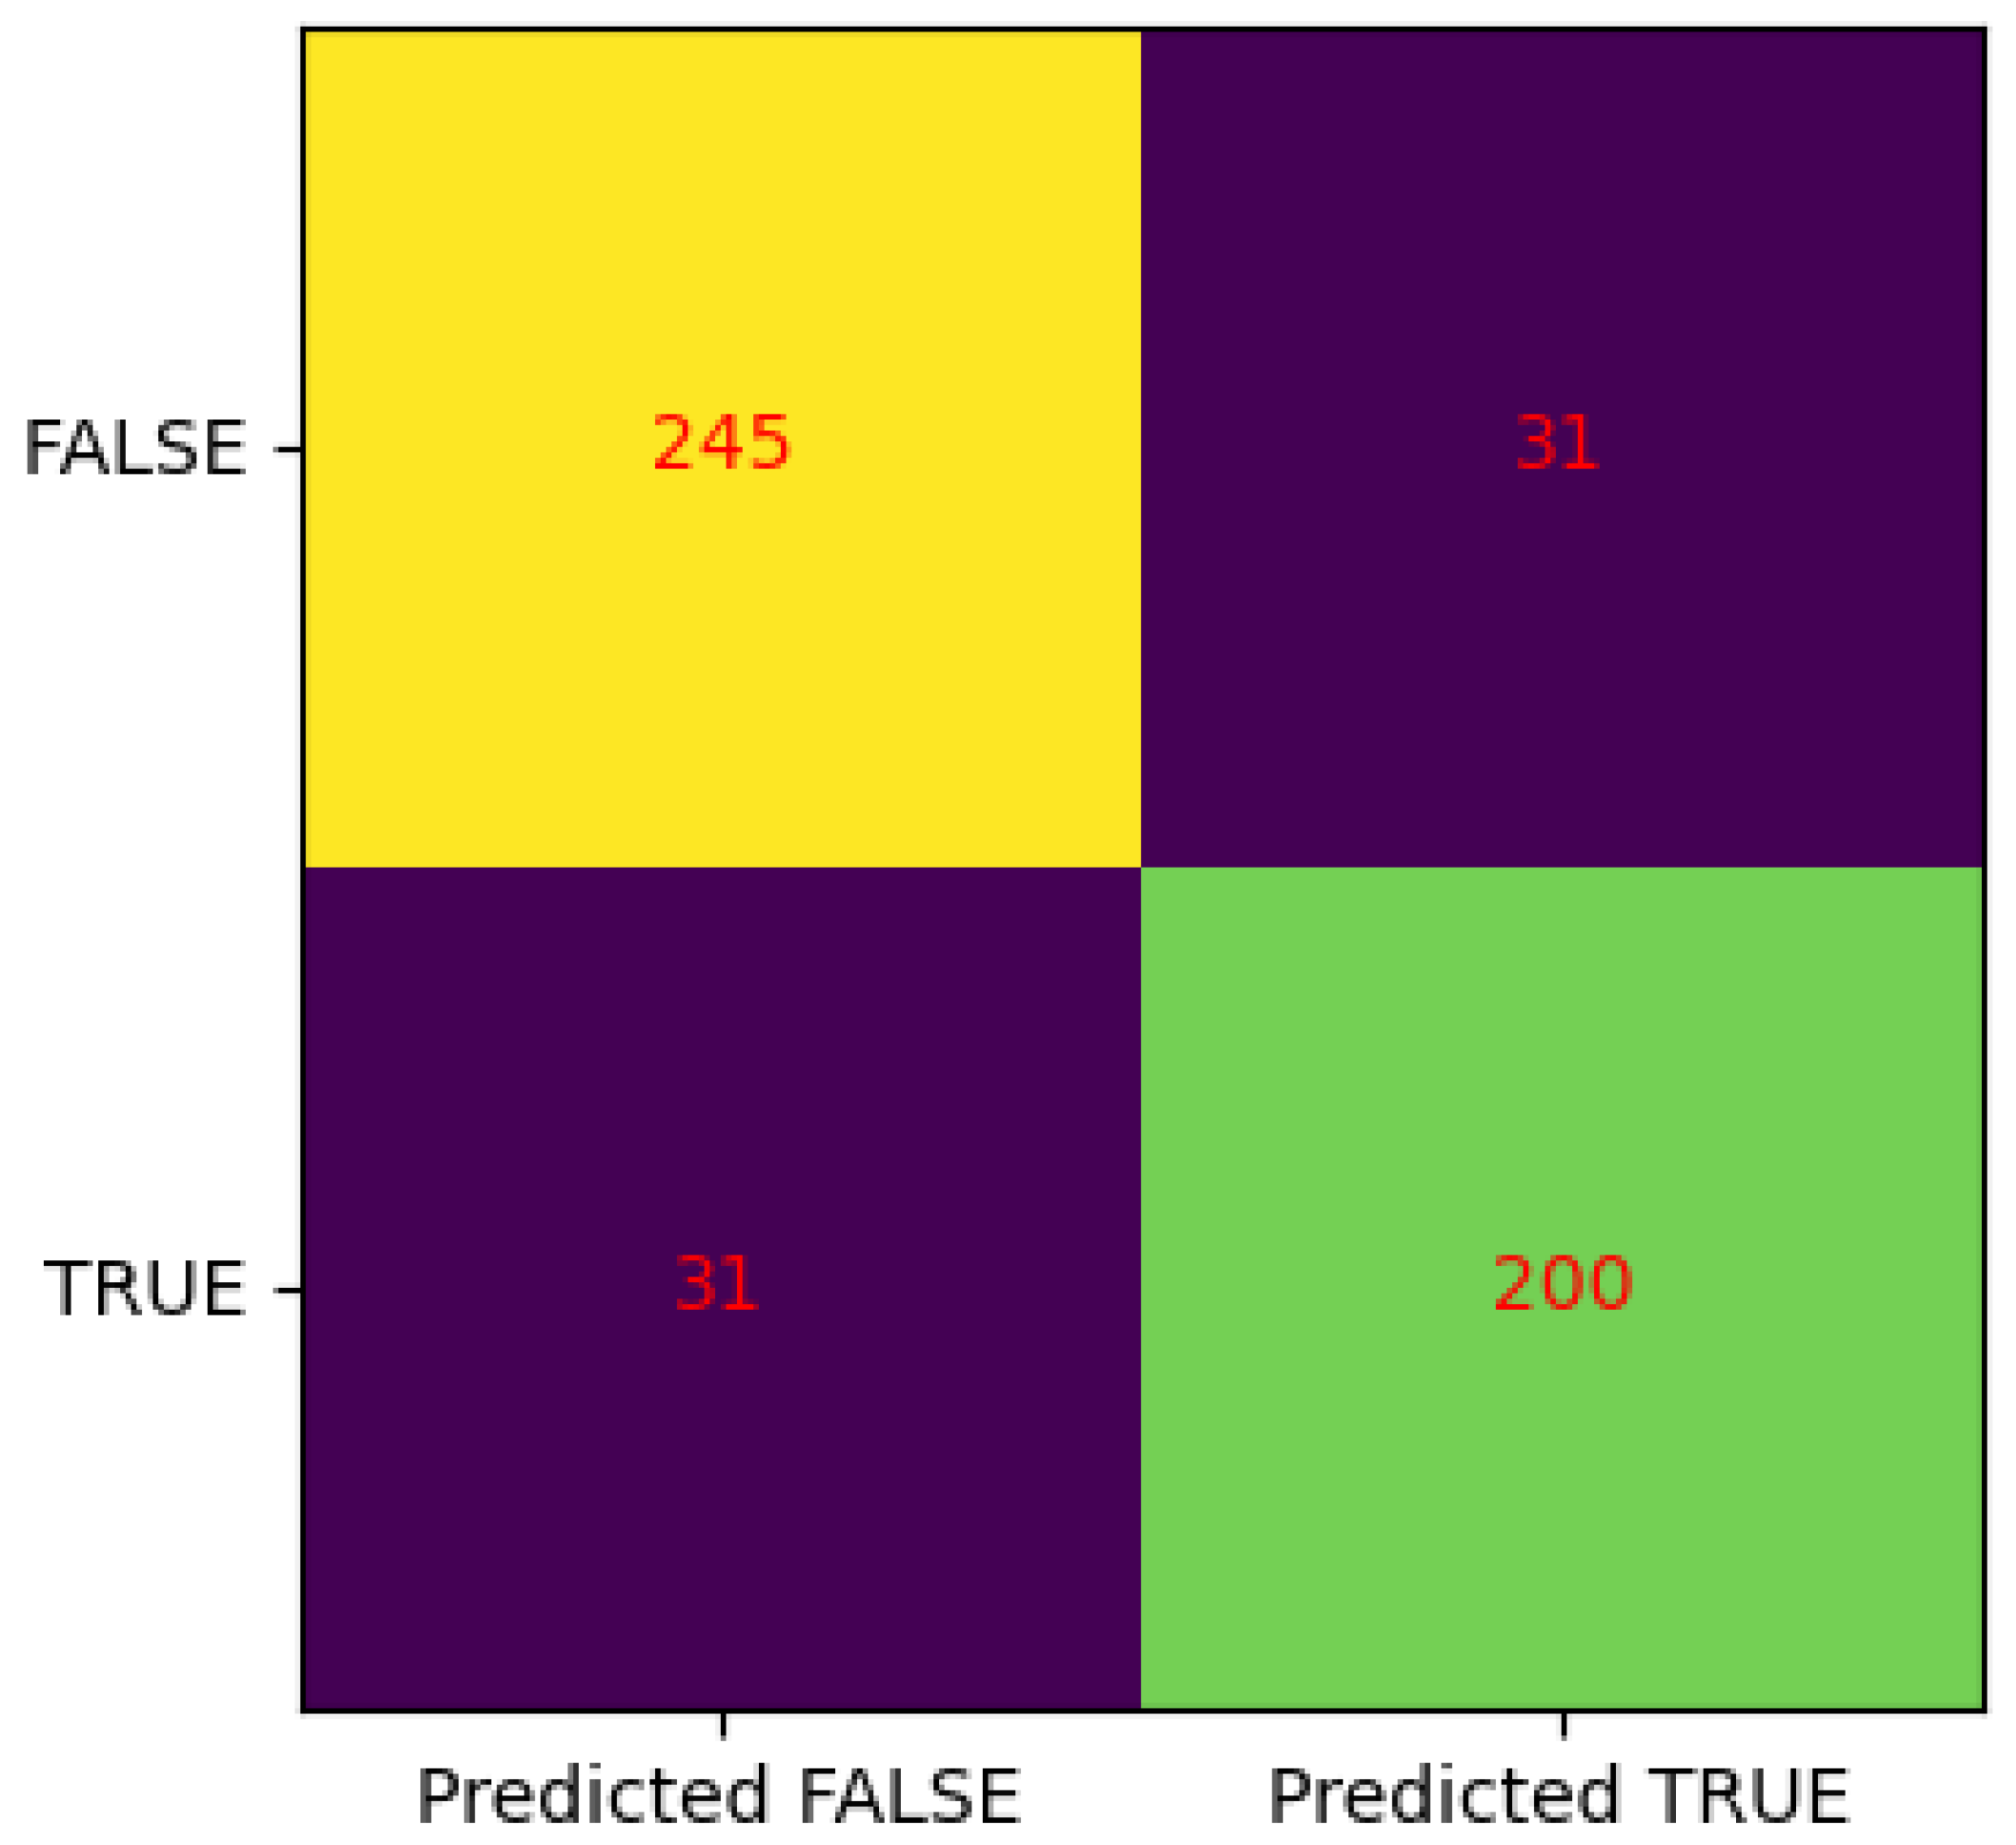
3.2.3. Confusion Matrix

In machine learning, a confusion matrix is a table that summarizes the performance of a classification model by comparing the predicted labels to the actual labels of a set of test data. In the context of a random forest classifier, a confusion matrix is beneficial for evaluating the accuracy of the classifier’s predictions.
The confusion matrix for a binary classification problem consists of four cells: true positive (TP), false positive (FP), true negative (TN), and false negative (FN). The true positive cell represents the number of instances correctly classified as positive. In contrast, the false positive cell represents the number of instances incorrectly classified as positive. Similarly, the true negative cell represents the number of instances correctly classified as negative, whereas the false negative cell represents the number of instances incorrectly classified as negative. A LaTeX text is created to describe the graphic to enhance the understanding of the outcomes.
Figure 12 displays the confusion matrix generated utilizing the A I 2 .explain() method.
The values in the confusion matrix in our case can be interpreted as follows:
  • True Positive (TP): The model correctly predicted the positive class and the actual class was also positive. In this case, the count was 200.
  • True Negative (TN): The model correctly predicted the negative class and the actual class was also negative. The count was 245 for this scenario.
  • False Positive (FP): The model incorrectly predicted the positive class but the actual class was negative. There were 31 instances where the model made such false positive predictions.
  • False Negative (FN): The model incorrectly predicted the negative class but the actual class was positive. Similar to false positives, there were 31 instances where the model made false negative predictions.
There were 507 tested values (rounded 20% of 2534). Furthermore, various metrics can be derived from the confusion matrix, such as accuracy, precision, recall, and F1-score, which provide a more comprehensive evaluation of the model’s performance. These metrics help quantify the model’s ability to classify instances and identify areas that require improvement correctly.
To provide a better explanation of the results, a LaTeX text is generated that describes the graphic.

3.2.4. Explanation Text

This aspect of the RF method’s explainability produces a LaTeX text for the user to better understand the algorithm’s concept. The text is as follows:
A random forest algorithm is an ensemble machine learning method used for classification and regression tasks. The method involves constructing multiple decision trees at training time and combining their predictions to obtain a final output. Random forest classifiers work by constructing decision trees based on randomly selected subsets of the input features and training data, thus reducing the variance and overfitting issues common in single decision tree models. The final output of the random forest classifier is determined by averaging or voting the predictions of the individual decision trees. The algorithm has gained popularity due to its high accuracy, robustness, and ease of use. It is suitable for various applications such as image classification, fraud detection, and stock market prediction.
The text is always the same for this version of A I 2 . In the future, we might add custom text depending on the graphic type and data.

4. Discussion

This novel applied method is a significant contribution since it proposes synthesizing an expert’s assessment. In this case, it is a home interior design expert, although this method could be applied to many different fields. This method can be used when evaluating a custom product in a specific environment. This simulated expert concept is not new in artificial intelligence. A few decades ago, expert systems were trendy methods. However, they were created from predicates embedded in the code. There was no notion of learning involved at all. Using the proposed method, an expert is simulated from a state-of-the-art, data-driven machine learning algorithm. The results allow for a multitude of subtleties that would be impossible using old-fashioned expert systems.
Using this novel method, the results may vary from one expert to another, depending on the expert’s formation, culture, taste, or simply their mood on the day. The results are subjective and will never be universal. That being said, this is not necessary. The need is for the client enterprise to be comfortable with the results. There is no ethical issue with this method. It is never used in a critical situation associated with consequences harmful to humans. The worst that can happen is a system proposing, once in a while, an undesired product/environment combination.
Figure 4, Figure 5 and Figure 8 provide two examples of AI-generated images. They are labeled aesthetic and unaesthetic, respectively, showing the subjective nature of the learned data. Despite this subjectivity, the customer is satisfied with its website’s harmonious combinations of doors/home designs. The combinations are harmonious, at least for the enterprise’s expert, since the results are based on its inputs (aesthetic or non-aesthetic choices).
The limitations of this research mainly concern the choice of frameworks. First, we had to choose a Unity 3D- and C#-compatible framework, significantly restricting the options. The Accord.net framework was selected, even though we knew it had fewer methods and possibilities compared to other well-known frameworks in Python. Second, AI2 was chosen to explain the results. This is a new and promising Python-based framework. Since it is quite a recent tool, some features are still being developed.
New AI methods are now required to explain their results for ethical purposes. Several graphics and text were generated using the A I 2 machine learning framework to augment the explainability of this method’s results. Figure 10 shows the importance of the features used to classify the data. Figure 11 depicts the decision process of one of the decision trees embedded in the RF algorithm. The last graphic, shown in Figure 12, is a confusion matrix, which depicts the distribution of classifier-type errors. The explanation text provided in Section 3.2 also explains the methodology of the RF algorithm.

5. Conclusions

This article proposes a practical machine learning approach to enhance the appearance of custom-made doors in a home design setting. Due to the vast number of possible custom door variations based on factors such as wood types, wood stains, types of glass, and door styles, it is impossible to predict an ideal home design model to complement each custom door. To generate the required data, a home design expert must assess thousands of door/home design combinations with varying colors and shades. The resulting data are used to train a random forest classifier in a supervised learning environment, which predicts the compatibility of a custom door with a particular home design. This approach is employed on a web page where customers can choose from various doors. After selecting the desired door properties, a request Is sent to the server to provide an aesthetically pleasing home design image for that specific door. The Unity 3D engine module generates the images, which are then returned to the web client. The customer can then visualize the door in a home design context.
The findings show that the random forest classifier performs well in predicting suitable home designs, providing a path for future work requiring subjective assessments. This method also explains the results by producing multiple graphics and texts associated with the data and the process. Indeed, the method generates a feature importance graphic, a decision tree representation, a confusion matrix, and a complete text explaining the process, allowing for a better understanding of the results.
In the future, this novel method could be tested in other domains requiring expert aesthetic analysis, particularly in other furniture and interior design areas. However, this method could also be used in the vast field of retail to showcase different products. The method is beneficial for highlighting customized products. It could underline handicrafts, clothing, sports equipment, or even home construction in various sectors. The concept involves showcasing a specific customized product in a particular decor that is particularly suitable. From an ethical point of view, it is a case-by-case affair, depending on the combinations proposed. Generally speaking, the method poses no particular ethical problems. The process could use cookies stored on the client’s computer to further personalize the proposed result.
Explanations could also be improved by generating more information about the decision trees and customizing the explanation text about the graphics. This could be done using large language models (LLMs). It would be fascinating to exploit this method to discriminate between adequate and inadequate images produced by new generative models like Midjourney, DALL-E, and others in the context of massive image production. Also, it would be valuable to survey users to determine whether the proposed aesthetic images are suitable for them. We could evaluate whether there is a discrepancy between the door manufacturer’s expertise and the customer’s preferences. That would be a good way to evaluate the expert’s work.

Author Contributions

J.-S.D.: Conceptualization, methodology, software, and writing—original draft. F.C.: Conceptualization, methodology, and software. S.B.: Conceptualization, methodology, and software F.M.: Conceptualization, methodology, validation, resources, editing—review and editing, supervision, and project administration. D.M.: Conceptualization, methodology, validation, resources, writing—review and editing, supervision, project administration, and funding acquisition. All authors have read and agreed to the published version of the manuscript.

Funding

This research was funded by the Natural Sciences and Engineering Research Council under grant number RGPIN-2020-06980. It also received the support from the Mathematics of Information Technology and Complex Systems (MITACS) Accelerate Program.

Institutional Review Board Statement

Not applicable.

Informed Consent Statement

Not applicable.

Data Availability Statement

Data are contained within the article.

Acknowledgments

This work was supported by the “Cellule d’expertise en robotique et intelligence artificielle” of the Cégep de Trois-Rivières.

Conflicts of Interest

The authors declare no conflicts of interest.

Abbreviations

The following abbreviations are used in this manuscript:
A I 2 Artificial Intelligence for Automated Indexes
GHGGreenhouse Gases
MSDLMMulti-Scene Deep Learning Model
NLPNatural Language Processing
RFRandom Forest

References

  1. Zhang, Z.; Ban, J. Aesthetic Evaluation of Interior Design Based on Visual Features. Int. J. Mob. Comput. Multimed. Commun. 2022, 13, 1–12. [Google Scholar] [CrossRef]
  2. Yu, L.; Chung, W. Analysis of Material and Craft Aesthetics Characteristics of Arts and Crafts Works Based on Computer Vision. J. Exp. Nanosci. 2023, 18, 2174693. [Google Scholar] [CrossRef]
  3. Ataer-Cansizoglu, E.; Liu, H.; Weiss, T.; Mitra, A.; Dholakia, D.; Choi, J.W.; Wulin, D. Room Style Estimation for Style-Aware Recommendation. In Proceedings of the 2019 IEEE International Conference on Artificial Intelligence and Virtual Reality (AIVR), San Diego, CA, USA, 9–11 December 2019; IEEE: Piscataway, NJ, USA, 2019; pp. 267–2673. [Google Scholar] [CrossRef]
  4. Lindenthal, T.; Johnson, E.B. Machine Learning, Architectural Styles and Property Values. J. Real Estate Financ. Econ. 2021, 1–32. [Google Scholar] [CrossRef]
  5. Wang, W.; Zhao, M.; Wang, L.; Huang, J.; Cai, C.; Xu, X. A Multi-Scene Deep Learning Model for Image Aesthetic Evaluation. Signal Process. Image Commun. 2016, 47, 511–518. [Google Scholar] [CrossRef]
  6. Biau, G.; Scornet, E. A random forest guided tour. Test 2016, 25, 197–227. [Google Scholar] [CrossRef]
  7. Gulea, T. How not to Use Random Forest. 2019. Available online: https://medium.com/turo-engineering/how-not-to-use-random-forest-265a19a68576 (accessed on 20 February 2024).
  8. Paul, A.; Mukherjee, D.P.; Das, P.; Gangopadhyay, A.; Chintha, A.R.; Kundu, S. Improved Random Forest for Classification. IEEE Trans. Image Process. 2018, 27, 4012–4024. [Google Scholar] [CrossRef] [PubMed]
  9. Chang, Y.; Li, W.; Yang, Z. Network Intrusion Detection Based on Random Forest and Support Vector Machine. In Proceedings of the 2017 IEEE International Conference on Computational Science and Engineering (CSE) and IEEE International Conference on Embedded and Ubiquitous Computing (EUC), Guangzhou, China, 21–24 July 2017; Volume 1, pp. 635–638. [Google Scholar] [CrossRef]
  10. Dessureault, J.S.; Massicotte, D. AI2: A Novel Explainable Machine Learning Framework Using an NLP Interface. In Proceedings of the 2023 8th International Conference on Machine Learning Technologies (ICMLT), New York, NY, USA, 10–12 March 2023; pp. 1–7. [Google Scholar] [CrossRef]
  11. Dessureault, J.S.; Massicotte, D. AI2: The next leap toward native language based and explainable machine learning framework. arXiv 2023, arXiv:cs.LG/2301.03391. [Google Scholar]
  12. Haas, J.K. A History of the Unity Game Engine. Ph.D. Thesis, Worcester Polytechnic Institute, Worcester, MA, USA, 2014. [Google Scholar]
Figure 1. The architecture of the system, which includes a web client and a server.
Information 15 00203 g001
Figure 2. The architecture of the training process.
Information 15 00203 g002
Figure 3. The architecture of the prediction process.
Information 15 00203 g003
Figure 4. Sample image of a combination of a door/room judged aesthetic by the expert (bedroom context).
Information 15 00203 g004
Figure 5. A first sample image of a combination of s door/room judged aesthetic by the expert (living room context).
Information 15 00203 g005
Figure 6. Sample image of a combination of a door/room judged aesthetic by the expert (bathroom context).
Information 15 00203 g006
Figure 7. A second sample image of a combination of a door/room judged aesthetic by the expert (living room context).
Information 15 00203 g007
Figure 8. Sample image of a combination of a door/room judged unaesthetic by the expert (bathroom context).
Information 15 00203 g008
Figure 9. Sample image of a combination of a door/room judged unaesthetic by the expert (bedroom context).
Information 15 00203 g009
Figure 10. Feature importance graphic (index feature number from Table 1).
Information 15 00203 g010
Figure 11. Decision tree graphic.
Information 15 00203 g011
Figure 12. Confusion matrix of the results of the RF classifier.
Information 15 00203 g012
Table 1. Features and classes of the training.csv file.
No.Feature NameDomains
Description
(User choices)
1.Door model(door models)
The model of the door.
2.Wood texture(wood textures)
The wood’s essence and its texture.
3.Dyeing color(dyeing colors)
The color of the dye.
4.Paint texture(paint colors)
The color of the paint.
5.Glass texture(glass textures)
The texture of the glass.
(AI choices)
6.Home design model“Bathroom”,
“Living room”,
“Bedroom”
The model of the home design.
7.Home design color 1(colors)
The first color of the home design.
8.Home design color 2(colors)
The second color of the home design.
(Classes for training purposes)
9.The class“0” (NO), “1” (YES)
The class of the data.
Table 2. Dataset summary.
DatasetTraining DataTest Data
2534 rows2026 rows (80%)507 rows (20%)
Disclaimer/Publisher’s Note: The statements, opinions and data contained in all publications are solely those of the individual author(s) and contributor(s) and not of MDPI and/or the editor(s). MDPI and/or the editor(s) disclaim responsibility for any injury to people or property resulting from any ideas, methods, instructions or products referred to in the content.

