Abstract
Effective and efficient use of information and communication technology (ICT) systems in the administration of educational organisations is crucial to optimise their performance. Earlier research on the identification and analysis of ICT users’ satisfaction with administration tasks in education is limited and inconclusive, as they focus on using ICT for nonadministrative tasks. To address this gap, this study employs Artificial Intelligence (AI) and machine learning (ML) in conjunction with a survey technique to predict the satisfaction of ICT users. In doing so, it provides an insight into the key factors that impact users’ satisfaction with the ICT administrative systems. The results reveal that AI and ML models predict ICT user satisfaction with an accuracy of 94%, and identify the specific ICT features, such as usability, privacy, security, and Information Technology (IT) support as key determinants of satisfaction. The ability to predict user satisfaction is important as it allows organisations to make data-driven decisions on improving their ICT systems to better meet the needs and expectations of users, maximising labour effort while minimising resources, and identifying potential issues earlier. The findings of this study have important implications for the use of ML in improving the administration of educational institutions and providing valuable insights for decision-makers and developers.
1. Introduction
ICT encompasses a wide range of computer and communication hardware and software that are used to create, store, transmit, interpret, and alter data in various formats [1,2]. ICT is widely used in various fields including health [3], transportation [4], and education [5]. In recent years, the use of ICT in education has been increasing. Studies such as the one by Robinson and Zaitun [6] have examined the use of ICT tools by English language teachers and their impact on students’ acquisition of English language competency and the quality of their learning experience. Additionally, Fernández-Gutiérrez et al. [7] explored the impact of using ICT in schools on students’ academic outcomes in compulsory secondary education, specifically in the subjects of mathematics, reading, and science. However, the use of ICT systems in educational organisations for administration tasks is an area that has received little attention in the literature [8,9].
ICT systems have the potential to enhance the administration process in educational organisations. By providing different tools and technologies, ICT systems can attract and motivate all members of the organisation, regardless of their role, to become more engaged in their daily administration tasks [10]. One of the key benefits of using ICT systems in administration is the ability to improve communication and information transactions within the organisation. These systems can provide a secure and reliable medium for sharing and exchanging information, which can improve the efficiency and effectiveness of the administration process [11]. Additionally, ICT systems can enable better decision making by providing easy access to data and analytics and help the organisation to be more responsive to the changing needs of the workforce and the stakeholders. Furthermore, ICT systems can enable more automation and streamline the administration process, which saves time and resources [12].
Currently, there is a wide range of ICT systems available for use in the administration process of educational organisations. For instance, in Saudi Arabia, over 15 ICT systems or applications are currently in use, such as Noor, Faris, and Madrasati. However, the variety of these systems can lead to issues of inconsistency, security, and privacy among users [13]. Despite the development of these ICT systems, user satisfaction guarantee remains a challenge. Therefore, there is a crucial need for a method to predict user satisfaction before developing or implementing such systems. By predicting user satisfaction, decision-makers and managers can gain a better understanding of the needs of the users and develop systems that effectively meet those needs. This approach can help to improve the effectiveness and efficiency of the administration process in educational organisations [14].
ML algorithms are gaining increasing attention for their ability to find valuable insights and learn about user’s needs. These algorithms use statistical techniques to enable computer systems to “learn” from data and make predictions or decisions. They have the ability to identify patterns and insights in large and complex datasets, which makes them useful in various fields such as healthcare, finance, and education [15]. Motivated by the success of ML in predictions for different applications, the objective of this study is to utilise ML models to predict the ICT systems users’ satisfaction within educational institutions. This can help decision-makers take the correct actions in terms of developing or imposing a new ICT system. This, in turn, can lead to more effective and efficient administration processes within educational organisations, as the ICT systems will be better aligned with the needs and aspirations of the users [14].
While previous research has explored the use of ICT in various educational contexts globally, this study seeks to provide new insights by focusing on the administrative applications of ICT within educational institutions in Saudi Arabia, a context that has been less examined. Despite the presence of similar cases internationally, this research contributes unique perspectives by examining the confluence of ICT with administrative efficiency in a region characterised by rapid technological adoption and specific cultural and systemic educational nuances. Furthermore, this study introduces an innovative predictive model using machine learning algorithms tailored to the unique dataset derived from Saudi educational institutions, thereby contributing novel methodological advancements to the field. Our paper contributes to the following research outcomes:
- Addressing the gaps in earlier research on identifying and analysing ICT user satisfaction for administration tasks in educational businesses, which has been limited and inconclusive.
- Providing insights into the key factors that impact user satisfaction in ICT administrative (business) systems.
- Enabling organisations to make data-driven decisions to improve their ICT systems, better meet user needs and expectations, maximise labour efforts while minimising resources, and identify potential issues earlier.
2. Related Work
This section summarises the literature related to the adoption of ICT in educational organisations especially for administration tasks. Then, it discusses the ML applications in this domain of ICT adoption.
2.1. ICT for Administration Tasks in Educational Organisations
The extensive availability of computers has not only enhanced access to information but has also facilitated communication with others and the creation of new knowledge and cultural artefacts [16]. The study of the effects of ICT and technology on education, curriculum, classroom, and students has been an ongoing area of research for over 20 years [2,17,18].
On the other hand, the literature on the use of ICT in educational organisations for administration purposes is still limited. Studies such as Khalid and Nyvang [19] have aimed to explore the barriers to ICT adoption experienced by stakeholders in educational administration in rural Bangladesh and identify ways to overcome these barriers to facilitate the transformation process. Another study by Qureshi and Abro [20] examined the influence and effectiveness of ICT in administration, and it found that ICT was not as effective as expected due to the lack of appropriate resources, particularly in the form of a management information system with training and monitoring mechanisms. Additionally, Hayes [21] inspected the ways in which teachers are using ICT in their classroom administration practices and found that ICT is mainly being used to support and supplement existing practices. Moreover, these factors are summarised as factors that influenced the users and their attitudes toward the ICT systems [22]. Despite the potential advantages of using ICT for administration tasks in educational organisations, its effectiveness remains under-researched.
ICT systems can facilitate different administration tasks such as communication with different layers in the education sector, assigning marks, circulating new roles or announcements, and attendance monitoring. Different applications and services are currently in use. However, there is no unified framework for the requirement of these ICT systems [23]. Another study about using ICT in schools was conducted in Saudi Arabia. The study aims to improve the utilisation of ICT in schools in the Kingdom of Saudi Arabia by employing a set of strategies. The study focuses on the use of ICT for practical, educational support such as school administration, teaching management, and the preparation of worksheets for student assignments, which is known as supportive ICT use [13]. According to the literature, there is a limitation in the communication between the ICT users and the decision-makers. Moreover, the ICT systems used in education are mainly used for simple tasks such as assigning grades and recording absences. However, the users are still not satisfied with this variety of ICT systems and that has been mentioned in the previous studies. ICT systems can be more powerful tools in educational organisations precisely in the administration tasks [18,24].
2.2. User Satisfaction with ICT Systems
According to the International Organisation for Standardisation (ISO), user satisfaction is defined as “a person’s perception of the degree to which the user’s requirements have been fulfilled” [25]. Users’ satisfaction is often associated with user gratification and can be used as an indicator of the effectiveness of a product or system. In educational organisations, when students, teachers, and staff are satisfied with such tools and systems that they are using, it indicates that these technological tools are meeting their needs and facilitating the accomplishment of their objectives [26].
In the context of ICT, user satisfaction refers to the degree to which individuals or organisations that use ICT tools and systems are satisfied with the features, functionality, and overall performance of those tools and systems. Measuring user satisfaction can help organisations identify areas where their ICT tools and systems may be not meeting the required standards and make improvements to better meet the needs of users. It can also provide valuable feedback on features that are functioning as intended and help guide decisions about future investments in ICT. Overall, user satisfaction is an important concept in the design and evaluation of ICT technologies, as it provides insights into how well an ICT system is meeting the needs of its users and can help guide decisions about future improvements [27].
The satisfaction rate of users with ICT systems in educational institutions serves as an indicator that can offer meaningful insights to stakeholders and decision-makers. This measurement can facilitate the comprehension of users’ needs and preferences and enable an understanding of the factors contributing to their satisfaction. Moreover, stakeholders and decision-makers can identify the underlying issues faced by users in utilising ICT systems by analysing their satisfaction. An illustrative study comparing two secondary schools in China and Canada found that although both schools had comparable ownership and access to ICT devices, the use of ICT for learning and teaching differed substantially between the two. Chinese students relied more on classroom learning, and their teachers did not incorporate and promote ICT outside of the classroom, resulting in limited accessibility to ICT, which substantially affected the participants’ satisfaction [28]. This example highlighted how the analysis of user satisfaction can provide valuable insights into the challenges confronted by users in utilising ICT systems in educational institutions, which can be used by decision-makers to identify areas for improvement to enhance user satisfaction. Another study investigated ICT practices in Malaysian universities, finding that infrastructure, support services, and faculty attitudes significantly contribute to ICT satisfaction in higher education [29].
Furthermore, a multilevel analysis on institutionalised ICT use in primary education was conducted, indicating that school-level factors such as leadership and vision play a significant role in shaping ICT satisfaction [30]. Additionally, a study examined the factors influencing cloud service usage in Malaysian higher education during the COVID-19 pandemic, highlighting the importance of accessibility and reliability for user satisfaction [31]. These studies underscore how user satisfaction analysis can unveil challenges faced by users in utilising ICT systems, enabling decision-makers to identify areas for enhancement to boost satisfaction.
2.3. Machine Learning Models for ICT
ML models have been proven to be highly effective for various applications, including those related to education. These models can identify patterns and trends in data that may not be immediately apparent to human researchers, making them valuable tools for analysis and prediction [32].
Table 1 summarises the most commonly used models in the literature. For example, different algorithms are utilised to predict the student’s academic success, including Random Forest (RF), Support Vector Machine (SVM), Gradient boosting, Decision Tree (DT), Logistic Regression (LR), Linear Regression, Extreme Gradient Boosting (XGBoost), and Artificial Neural Networks (ANNs). They achieved 97% accuracy using XGBoost [33]. Another variant of tree-based algorithms, the Gradient Boosting Machine (GBM), has been used to predict students’ academic performance in Brazil. With the ability to process enormous amounts of data quickly, the GBM was able to accurately predict student performance based on a variety of factors [34].

Table 1.
Summary of commonly used ML Models in the literature.
RF, a tree-based model, along with SVM, is used for comparison with an ANN model in predicting users’ satisfaction regarding massive open online courses based on their purchase experiences.
The results show that SVM and RF had a higher accuracy rate in predicting customer satisfaction compared with the ANN [35]. The success of SVM for classifications is also demonstrated in predicting mental health problems among higher education students. In the study, they used Linear Regression, LR, DT, SVM, Naïve Bayes (NB), k-Nearest Neighbours (KNN), RF, and ANN. Their results show that the SVM algorithm achieved the highest accuracy rate at 96% [36]. Moreover, the attitude of university students towards ICT and mobile technology in India and Hungary is evaluated using ML techniques. The ICT users’ attitude was measured using five levels. Four ML classifiers were used, including an ANN, SVM, KNN, and Discriminant. The results show that the SVM outperformed the other classifiers in predicting students’ attitudes with an accuracy of 98.1% for Hungarian students and 96.6% for Indian students [37].
Neural network models, particularly ANNs with various architectures, have also been successful in academic applications. For example, ANNs were found to be the most effective algorithm, achieving a 75% accuracy rate in identifying slow learners among high school students. The evaluation included models such as NB, Sequential Minimal Optimisation, and tree-based models [39]. Another proposed ANN model for predicting users’ satisfaction in educational organisations during emergency remote learning due to the COVID-19 pandemic in Hong Kong was compared with DT, RF, vanilla ANN, XGBoost, and SVM. The results show that their model achieved 70% accuracy [40]. An investigation paper employed ML to predict students’ success based on final exam scores. Additionally, ML was utilised to forecast students’ satisfaction with their teachers and courses. The authors identified five factors influencing the prediction of student satisfaction and concluded that course attributes had the most significant impact compared with other factors [41]. Overall, ML models have the potential to revolutionise the field of ICT in education by providing valuable insights and predictions that can benefit students, educators and managers alike.
As demonstrated by previous studies [32,33,36,37,40], the integration of ML techniques to predict users’ satisfaction can enhance the decision-making process by enabling stakeholders to understand users’ needs and preferences better and subsequently improve the design, implementation, and maintenance of ICT systems. However, the integration of ML models towards predicting user satisfaction with ICT systems for administration tasks, especially in Saudi education systems, is still unknown. Hence, to fill this gap, this study aims to analyse users’ satisfaction towards Saudi ICT systems in educational organisations for administration tasks.
3. Research Problem Formulation
Figure 1 visualises the problem to be considered in this research. It can be formulated as follows:
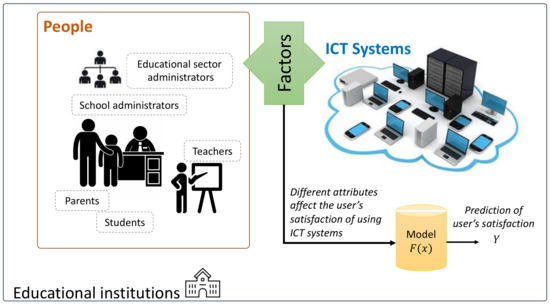
Figure 1.
Conceptual framework summarising the research problem formulation; using the factors resulting from the relationship between various stakeholders and their usage of ICT systems in educational organisations to build a prediction model.
Given the following:
- L number of attributes related to staff’s view about ICT systems aspects in an educational organisation
- X, where X is a vector of length L, represents the factors.
The aim is as follows:
- Find that is a model to map X to Y where that shows the user satisfaction indicator.
- Decide the most influential factors that affect the user satisfaction.
This problem is important in order to find a model that can predict user satisfaction to help the IT department in the Ministry of Education by providing a framework to predict and plan for better systems. This can lead to improving the efficiency of the ICT systems and increase their usage in educational organisations. Identifying key importance factors can offer deeper insights into the critical aspects of systems that warrant consideration.
Hence, this study addresses the following research questions (RQs):
- RQ1: What is the distribution of users’ satisfaction towards ICT systems at educational organisations in Saudi Arabia?
- RQ2: How can ML models aid in predicting users’ satisfaction towards ICT systems at educational organisations in Saudi Arabia?
- RQ3: What factors influence users’ satisfaction toward ICT systems at educational organisations in Saudi Arabia?
4. Methodology
This study employs a quantitative research methodology to investigate user satisfaction with ICT systems in educational organisations in Saudi Arabia. Figure 2 illustrates the structured approach taken in this study. It has three main phases: (1) dataset collection, (2) prediction calculation, and (3) prediction analysis.
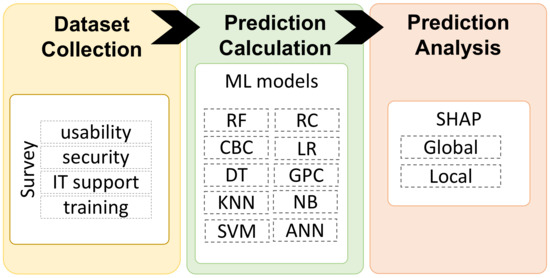
Figure 2.
An overview of the research methodology.
4.1. Dataset Collection
To obtain a more targeted evaluation of users’ satisfaction, this study adopted a questionnaire survey targeting educational organisations in Saudi Arabia. The survey link and QR code were distributed through social media platforms, where many users are active. Additionally, communication was established with the Ministry of Education in Saudi Arabia to seek cooperation in distributing the questionnaire to the targeted participants. Given that Arabic is the main language in Saudi Arabia, the survey questions were provided in both English and Arabic to facilitate easier and more convenient participation.
The study commenced with an informed consent process, wherein participants were presented with a consent form outlining the research objectives and confirming that participants were above 18 years of age. This process is essential to ensure that participants are fully informed about the nature of the study and voluntarily participate. Informed consent is a fundamental ethical requirement in any research study, as it helps protect participants’ rights while establishing trust between researchers and participants. Moreover, anonymity was a key requirement in the study design, ensuring that the survey maintained participants’ privacy and confidentiality.
The survey encompassed various factors related to the use of ICT in educational organisations in Saudi Arabia for administrative purposes. After reviewing the relevant literature, the questionnaire was structured into five sections, as shown in Table 2. The questions aimed to capture factors affecting ICT users’ satisfaction, including IT support, privacy, security, and communication, in addition to demographic information about the participants. Specific areas covered by the questions included the adequacy of IT support, the effectiveness of security measures, the ease of use of ICT systems, and the efficiency of communication facilitated by ICT. All measurements in the survey were based on Likert scales, with responses initially captured on a 5-point scale. To address potential class imbalances that could affect the ML models, the responses were recoded into a 3-point scale: ‘Strongly Agree’ and ‘Agree’ were combined into ‘Yes’; ‘Strongly Disagree’ and ‘Disagree’ were combined into ‘No’; and ‘Neutral’ was retained as ‘I do not know’.
Table 2.
The questionnaire direction.
The survey contains various factors about using ICT at educational organisations in Saudi Arabia for administration purposes. After sorting and analysing the relevant literature, the questionnaire is designed with five parts, as it is shown in Table 2. The questions in the questionnaire reflect factors that affect the ICT users’ satisfaction, such as the IT support provided, privacy, security, and communication. Appendix A discusses the details of the survey.
Dataset Validity and Reliability Measures
In order to evaluate the distribution of participant responses regarding the factors influencing their satisfaction with the usage of ICT, it is important to measure the validity and reliability of the study instrument. This step is crucial in ensuring the quality and accuracy of the research findings. In this study, three commonly used measures were employed to evaluate the validity and reliability of the research instrument. These measures are (1) Cronbach’s Alpha, (2) Split-Half Method, and (3) Exploratory Factor Analysis.
- Cronbach’s Alpha: Cronbach’s alpha is a widely recognised statistical measure for evaluating the internal consistency reliability of a research instrument. It gauges the degree of inter-relatedness among the items on the instrument, ensuring that they collectively produce consistent outcomes. In this study, Cronbach’s alpha was computed as part of the initial analysis to ascertain the dataset’s consistency and validity. The value obtained for the survey instrument was 0.894, significantly surpassing the commonly accepted threshold of 0.7, indicating a high level of internal consistency [42,43].
- Split-Half Method: To further validate the reliability of the survey, the Split-Half Method was utilised, resulting in a reliability coefficient of 0.86. This corroborates the internal consistency of the survey items, reinforcing the reliability of the instrument [44].
- Exploratory Factor Analysis: This analysis was conducted to assess the construct validity of the survey. It verified the aggregation of the survey items into coherent factors, consistent with the theoretical constructs being measured. The Kaiser–Meyer–Olkin measure of sampling adequacy was determined to be 0.82, and the Bartlett’s Test of Sphericity was significant (p < 0.001), indicating the suitability of the data for factor analysis [45,46].
These comprehensive validity and reliability measures collectively bolster the robustness of the survey instrument and enhance the credibility of the research findings related to the factors influencing participants’ satisfaction with ICT usage.
4.2. Prediction Calculation
This phase of the study entails predicting ICT user satisfaction, utilising the dataset collected from the previous phase. This is performed through the implementation of various ML algorithms. The users’ satisfaction prediction is the target feature in this study, it is denoted by which is the dependent variable and the estimated value of Y is denoted by . Different models are fed with the encoded values of the captured measurements to calculate the prediction. These factors are shown in Table 3.
Table 3.
The encoded prediction measurements.
The dataset is split into training and validation sets with a training size of 80% and a validation size of 20%. Before building the ML models, the data are normalised using minimum maximum normalisation to scale the features to a range of 0 to 1. This is performed separately for both the training and validation sets. The ML models included are Random Forest (RF), CatBoost Classifier (CBC), Decision Tree (DT), k-Nearest Neighbors (KNN), Support Vector Machine (SVM), Ridge Classifier (RC), Logistic Regression (LR), Gaussian Process Classifier (GBC), Naïve Bayes (NB), and Artificial Neural Networks (ANNs).
- RF is an ensemble learning method that constructs multiple decision trees at training time and outputs the class that is the mode of the classes (classification) or the mean prediction (regression) of the individual trees. We used an RF model with 100 trees and the ‘entropy’ criterion to measure the quality of a split.
- CBC, advantageous for its handling of categorical data, is utilised with default parameters but with a specific focus on depth optimisation (depth = 6) to ensure model complexity was balanced against its predictive accuracy.
- The DT model is used with the default parameters. The entropy function was used for determining the best split at each node, aiming to maximise information gain.
- KNN is a nonparametric classification algorithm that classifies a new instance based on its closest neighbours in the training dataset. In this study, the ‘brute’ method is employed with three neighbours in the KNN model. The ‘brute’ algorithm calculates distances between all pairs of data points, which is particularly suitable for small datasets. Interestingly, the accuracy of this model reached its peak performance when utilising three neighbours; any deviation from this number resulted in noticeably lower classification results.
- SVM is a binary classification algorithm that finds a hyperplane in a high-dimensional space that maximally separates the two classes. We used an SVM model with a radial basis function kernel and a regularisation parameter of 1.0. This kernel is commonly used in SVMs for nonlinear classification problems, while the regularisation parameter controls the balance between model complexity and error.
- The RC model is employed primarily for its efficiency and simplicity, with an alpha parameter of 1.0 to control model complexity through regularisation.
- LR is applied with an L2 penalty and a regularisation strength of 1.0, providing a solid foundation for modelling binary outcomes and examining the influence of individual predictors.
- The GPC model is chosen for its flexibility and nonparametric nature, using a default radial basis function kernel. This model excels in providing probabilistic predictions, which are invaluable for understanding prediction confidence levels.
- NB is a probabilistic classification algorithm that uses Bayes’ theorem to predict the probability of a target variable. The used implementation for the NB is with a variance smoothing parameter of 1 . The variance smoothing parameter is used to avoid probabilities of zero in cases where the variance of the predictors is zero.
- An ANN model is a type of neural network that consists of multiple layers of interconnected nodes; it has the potential to learn complex nonlinear relationships between input and output variables. This model is used with three hidden layers of ten nodes each, as well as the ‘tanh’ activation function. Also, in this model, the batch size is 32, with early stopping and the ‘Adam’ solver with an ‘adaptive’ learning rate.
All models were trained and validated using 5-fold cross-validation, and their performance was evaluated based on various metrics, including accuracy, precision, recall, and F1-score. The best-performing model was selected based on its overall performance and its ability to balance between precision and recall [47].
4.3. Prediction Analysis
This stage is dedicated to identifying the factors that influence user satisfaction by analysing the predictions made in the previous stage. It is important to emphasise that the phases of this study are interconnected. The data collected in Section 4.1 form the basis for the predictions and subsequent analysis in Section 4.2 and Section 4.3.
In this phase, the SHapley Additive exPlanations (SHAP) algorithm is utilised to elucidate the importance of various input factors in determining the predicted level of satisfaction. SHAP provides an interpretable model that quantifies the contribution of each feature to the predicted outcome. This interpretability is crucial for identifying the key factors that drive user satisfaction. By understanding these factors, we can gain insights into how to enhance user satisfaction and improve the overall user experience.
The SHAP algorithm offers both global and local interpretability:
- Global Interpretability: This provides an overview of the importance of each feature across all predictions. It helps in understanding the overall impact of different features on user satisfaction.
- Local Interpretability: This offers insights into the contribution of each feature to individual predictions. It enables a detailed analysis of how specific features influence the satisfaction level of individual users.
The application of the SHAP algorithm in this study allows for a comprehensive analysis of the factors affecting user satisfaction with ICT systems in educational organisations. By identifying these factors, we can inform decision-making processes and implement targeted interventions to improve user satisfaction.
5. Results and Discussion
This section is devoted to discussing the results of the data collection and prediction process. Specifically, The study’s results shed light on users’ satisfaction towards ICT systems in Saudi Arabia and the factors that drive this satisfaction. The use of ML models proved effective in predicting users’ satisfaction levels, and the study’s findings highlight the importance of several key factors, including infrastructure, IT support, communication, and training. The following sections provide a detailed discussion of these findings and their implications for improving the overall user experience of ICT systems at educational organisations in Saudi Arabia.
5.1. Distribution of User Satisfaction
This section directly addresses RQ1 by providing empirical data on user satisfaction. The research study received a total of 1721 responses. In order to ensure that the data collected was of high quality and accurately reflected the research objectives, a comprehensive process was employed to assess the validity of the responses. This involved a thorough review of the responses, which included checking for completeness, accuracy, and relevance. Following this assessment, a total of 1273 responses were deemed to be suitable for inclusion in the analysis, while 448 responses were excluded based on predetermined inclusion criteria. The exclusion reasons included incomplete or partial responses, or responses that did not meet the study’s eligibility criteria, such as participants not meeting age or geographical requirements, and responses that contained invalid or inconsistent data. In total, 605 are satisfied with the current ICT systems and 668 are not satisfied. Ensuring a balanced distribution within a dataset is crucial, as it significantly influences the performance of predictive models [48]. This study observes a nearly equitable distribution among participants, with the satisfaction rates being approximately equal, indicative of a 50:50 split.
Table 4 displays the distribution of participants based on their gender, education level, and job position. The sample consists of 1273 individuals, with 51% male, 48% female, and 1% preferring not to say. The majority of participants hold a bachelor’s degree (56%), followed by a master’s degree (16%) and secondary school (12%). The data indicate that teachers constitute the highest participation rate (59%), followed by the ’other’ category (11%), administrative assistants (17%), school deputy headmasters (5%), and principals (8%). These findings highlight the significance of teachers as the largest group of participants and the need to consider their perspectives in interpreting the study’s results. The distribution of participants by gender, education level, and job position provides important insights for researchers and practitioners in the education field.
Table 4.
Demographic Profile and Role Distribution Among Survey Respondents.
5.2. Predictive Power of ML Models
This subsection tackles RQ2, demonstrating the utility of ML in forecasting user satisfaction. The performance of various algorithms is evaluated using accuracy, precision, recall, and F1-score [49]. Table 5 shows the performance of various machine learning algorithms in predicting ICT users’ satisfaction with the administration of educational institutions. The results in the above table are ranked based on the accuracy rate. However, it is important to note that accuracy alone does not always provide a complete picture of the model’s performance [50]. The highest accuracy score is achieved by the RF algorithm, followed by CBC and DT. The RF algorithm performs better than any other algorithm. RF is a useful algorithm in prediction studies [51]. In this study, the RF algorithm archives a 95% accuracy rate in ICT users’ satisfaction prediction. This is the highest score in this study. Also, RF archives a high rate in other measurements like precision, recall, and F1-score (Ho et al., 2021 [40]). This indicates its ability to balance precision and recall, which is in line with previous studies that reported the effectiveness of this algorithm in predicting user satisfaction [52].
Table 5.
Performance of machine learning algorithms in predicting ICT users’ satisfaction in relation to the administration of educational institutions in percentage.
Moreover, the SVM algorithm achieved high scores, which is consistent with previous studies that have found SVM to be effective in identifying users’ satisfaction [33,53]. The F1-score is a measure of the algorithm’s ability to balance precision and recall. Precision measures the number of correct positive predictions out of all positive predictions, while recall measures the number of correct positive predictions out of all actual positive instances. The RF algorithm’s superior F1-score suggests that it accurately identifies both true positives and true negatives [49]. Table 5 above shows that RF has the highest F1-score (94.468%), while NB has the lowest F1-score (88.703%). For the precision metric, which measures the proportion of true positives among all positive predictions, we can see that CBC has the lowest precision score (92.500%), while RF has the highest precision score (94.068%). In contrast, DT has the lowest precision score (89.600%) [54].
Overall, the ’black box’ nature of ML models makes it difficult to understand how they make predictions and create issues in fields such as healthcare and finance. Explainable Artificial Intelligence (XAI) refers to the technique that enhances the interpretability of ML models, allowing users to understand why the model generates certain predictions and identify biases or errors [55] XAI methods range from simpler techniques such as feature importance analysis and decision trees to more complex methods such as LIME and SHAP [56]. In this study, SHAP is used to explain the model, revealing the hidden factors influencing ICT users’ satisfaction.
5.3. Factors Influencing User Satisfaction
This section delves into the analysis of factors that affect user satisfaction, drawing on the data analysis and ML model insights. This section answers RQ3 by identifying and discussing the significant determinants of satisfaction.
The key factors that impact user satisfaction with ICT systems in educational settings include the quality of infrastructure, the effectiveness of IT support, the clarity of communication, and the availability and quality of training.
The data are used to evaluate the effectiveness of existing infrastructure and inform the decision making regarding future infrastructure improvements. Figure 3 presents the results of a survey conducted on participants regarding infrastructure measurements; the questions are discussed in Table A2. The survey consists of five questions, with the corresponding responses being ’Yes’, ’No’, or ’I do not know’. The table displays the percentage distribution of responses for each question. For instance, for the first question, 48.08% of respondents answered ’Yes’, while 31.97% responded with ’No’, and 19.87% indicated ’I do not know’. The table provides valuable insights into the participants’ perceptions regarding infrastructure measurements, revealing the percentage distribution of responses for each question. Infrastructure has a strong relationship with the usage of ICT systems [57]. The reliable and strong infrastructure can attract and make the users’ experience better [58]. These measurements reflect the elements that should be in the infrastructure [1].
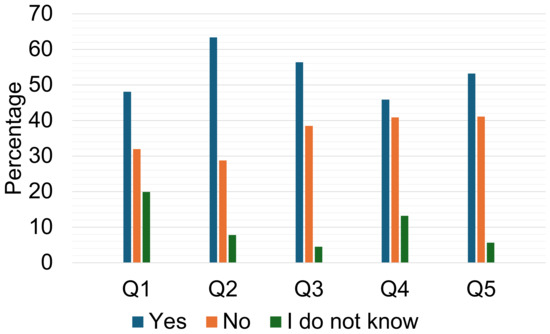
Figure 3.
Distribution of Participants’ Responses to Infrastructure Measurements.
Training is enabling ICT users to acquire the knowledge and skills necessary to effectively use ICT systems in their daily tasks and improve the outcome efficiency. Training programs are helping users to learn by doing and applying ICT systems in real-world scenarios and enhancing their skills and knowledge [59]. In addition, training is a powerful tool that is used to increase ICT users’ convenience. Training enables users to use ICT systems more effectively in a wider range of tasks, find creative solutions to complex problems, and increase their overall productivity and efficiency. As the users receive more training, this makes them engage more in using ICT [60]. Training is crucial for keeping ICT users up to date with the latest advancements and changes in ICT systems. As technology is rapidly evolving, it is helping users to stay informed and educated about the latest trends and innovations. Additionally, training improves the users’ trust in ICT systems and therefore it will be used increasingly.
This study examined the training measurement based on enough training and previous experiences, as explained in Table A3. Based on the survey results that are shown in Figure 4, the current training is not matching the users’ needs. Only about 16% think they received enough training, while around 62% of the participants answered they did not receive enough training on using ICT. A further 22% answered they did not receive any kind of training about using ICT systems to perform their duties.
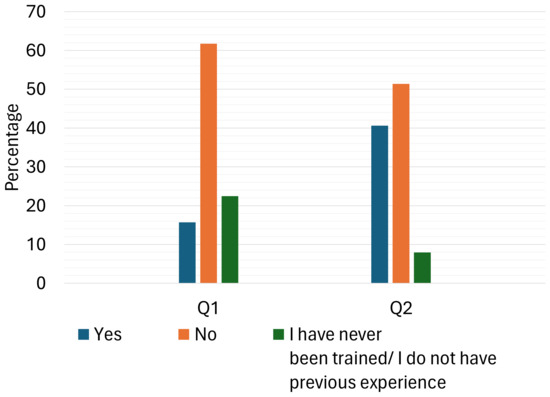
Figure 4.
Distribution of participants’ responses to training measurements.
Training contributes to the experience of ICT users as they learn to perform and apply the ICT systems in their daily tasks professionally. Based on the survey measurements regarding previous experiences and training, around 51% of the ICT users in Saudi Arabia answered their previous experiences did not help them use ICT systems. This highlights the effective training programs that must be tailored to the needs of ICT users [61]. Training programs that are based on hands-on applications and that offer opportunities for continuous learning and feedback are more effective. This is encouraging the ICT users can adapt their previous experience [22].
ICT systems act as a way for users and stakeholders to talk with a wide variety of other workers. This process of communication improves teamwork among users and stakeholders, reduces confusion, and boosts user engagement [62]. Figure 5 shows the results of studying how communication works in this context, with the related questions discussed in Table A5. About 64% of the people surveyed think that the current ICT systems in Saudi Arabia do not let them share their suggestions or questions. Also, around 16% are not sure if the existing ICT systems allow them to give any feedback or suggestions. The outcomes from studying communication suggest that 66% of ICT users in Saudi Arabia are not confident about using ICT systems for talking to others. Only 21% of the people taking part agreed that ICT systems have helped them communicate better.
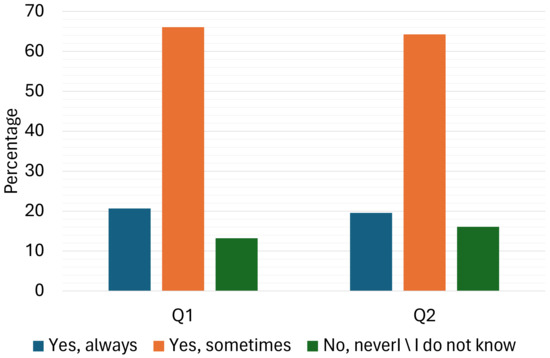
Figure 5.
Communication measurements with current ICT systems in education institutions in Saudi Arabia.
Without trustworthy ways to communicate, users cannot share what they need from ICT systems. This affects how happy they are and makes them rely less on ICT systems for their everyday tasks, like talking to others [63]. Moreover, communication problems affect how efficiently users can work because the current ICT systems are not a dependable method for talking to others. This means users spend more time on communication by using alternatives that might not be reliable.
5.3.1. Correlation Analysis
Correlation analysis is a widely used statistical technique for examining the relationship between two continuous variables, such as satisfaction and its associated factors. A positive correlation indicates that an increase in the value of one variable is associated with an increase in the value of the other variable. In addition, it helps in assessing the reliability and validity of the dataset. Moreover, in this paper, the correlation test is used to understand the relationship between input features and the target variable. The results reveal that satisfaction had a strong positive correlation with usability (0.57), previous experience (0.48), security (0.45), privacy (0.41), training (0.36), and communication (0.31). Additionally, weak positive correlations were observed between satisfaction and other features, as depicted in Figure 6. These findings suggest that improving these features could increase user satisfaction and provide insights for designing better systems.
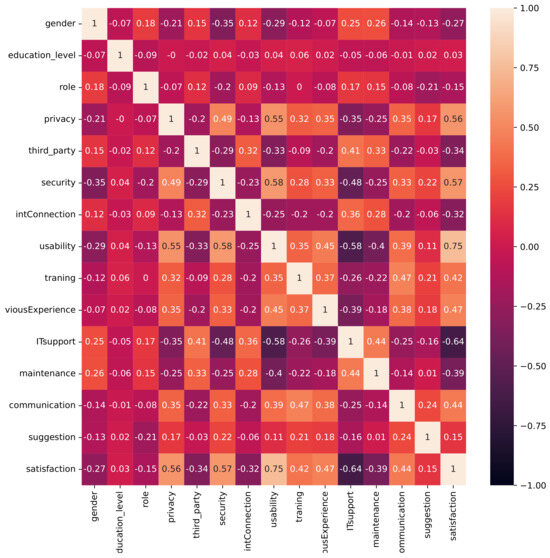
Figure 6.
Correlation heatmap of user satisfaction and factors such as usability, security, and training.
5.3.2. Interpreting Model Results with SHAP
The utilisation of SHAP allows the interpretation of the model’s results globally and locally. Figure 7 summarises the interpretations of the RF model’s results. It is clear that usability is the most important feature that affects users’ satisfaction. This result indicates that ICT usage in Saudi educational institutions is highly affected by the systems’ usability. The usability of a system can significantly impact user satisfaction, engagement, and overall effectiveness [62]. A system with good usability allows users to interact with it easily, efficiently, and effectively, leading to a positive user experience and increased usage [62]. It is proved that usability is highly associated with the users’ satisfaction as it reflects their engagement and attitude toward the ICT systems [64]. Hence, developers and decision-makers should give more attention to the usability of such systems.
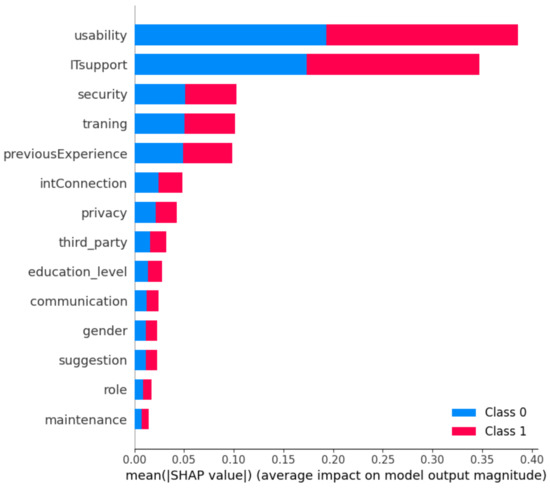
Figure 7.
Global interpretation of factors affecting ICT users’ satisfaction.
Infrastructure is an important factor for ICT users’ satisfaction. Based on the analysis it is found that usability, privacy and security are the most important features. Privacy and security concerns impact user attitudes towards using ICT systems. If the system does not guarantee these features, it is more likely to not be used, and users might use alternative solutions, such as third-party systems. In fact, this is a common issue in Saudi educational organisations [1]. It is found that Saudi users maintain social media platforms as the most used communication platform for educational organisations. This can threaten the users’ and organisations’ confidential information [65].
The IT support availability seems to be more important than the hardware maintenance for Saudi users. IT support is also an essential feature that impacts ICT users’ satisfaction with using ICT systems and their trust in the institution providing the system, as shown in Figure 2. Therefore, IT support must also be considered in the design and development of ICT systems in educational institutions. Users rely on IT support to help them navigate technical issues, troubleshoot problems, and ensure that the system operates smoothly. This support helps users overcome technical difficulties and ensures that they can use ICT systems with ease [66]. Having reliable IT support enhances the ICT users’ efficiency, and this leads to reducing the wasting time and effort this attracts more users and satisfies their needs. IT support instructs users and guides them to improve their performance. This is due to the experience the IT support team have [67]. When ICT users do not receive the adequate IT help they need, they are more likely to seek alternative solutions, such as third-party support. For example, if users encounter technical problems and cannot obtain timely and effective support, they may lose valuable work time, leading to frustration and reduced productivity. Furthermore, if users start using unauthorised third-party support, the institution could lose control over the users’ data, leading to a breach of security [68]. The availability of reliable and effective IT support influences user attitudes towards using ICT systems. This has significant implications for users’ satisfaction, productivity, and the organisation’s overall IT infrastructure. The IT support attracts the ICT users to use the systems more often, and consequently, they will start learning and educating themselves to always be up to date with the latest version of the ICT systems [69].
Figure 8 presents a typical user, where IT support is the most important feature that influences the satisfaction of the ICT users in Saudi Arabia educational organisations [70]. The IT support increases the usage of the ICT systems, and this enhances the administration tasks in educational institutions in Saudi Arabia. Next, communication is also affecting ICT users’ satisfaction in Saudi Arabia. This is also shown in Figure 8. The users’ satisfaction is affected when they cannot raise or propose any suggestions to the higher departments. In addition, their suggestions should be treated critically due to their direct interaction with the ICT systems [71].
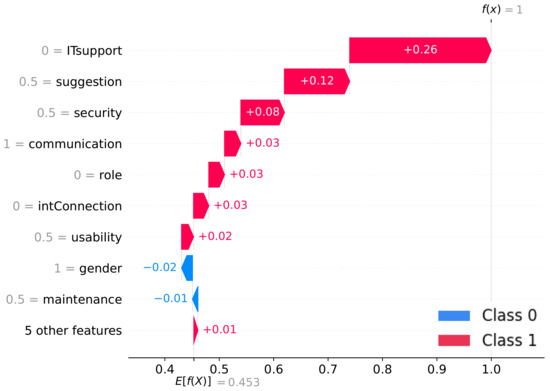
Figure 8.
Features that affect the degree of satisfaction of typical users in Saudi Arabia educational organisations.
Figure 9 displays how an ICT user expresses satisfaction with the system. It outlines how various system features contribute to the user’s satisfaction, with security being the most important feature in this instance. This highlights the significance of security as a determinant of user satisfaction and its potential impact on users’ experience. Notably, especially in light of recent information leaks that overshadow ICT systems, the prevalent user concern is their information privacy. Therefore, understanding user preferences regarding security features can help developers create systems that better align with user needs, leading to greater satisfaction and trust in ICT systems [72].
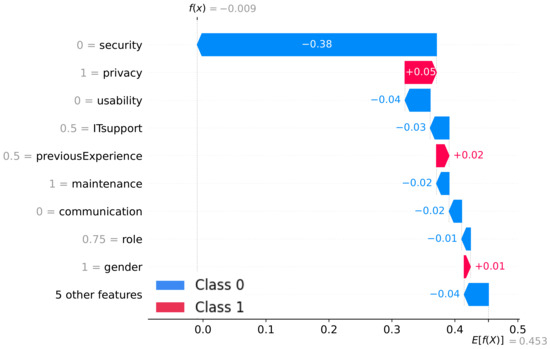
Figure 9.
The effective features identified using SHAP for user satisfaction.
Usability is another feature influencing ICT user satisfaction with the system. The ease of use of ICT systems can influence user engagement, leading to positive or negative experiences. Users’ perceptions of usability depend on factors such as system complexity, user interface design, and accessibility, among others. Therefore, developers should prioritise user-centred design and testing to ensure that ICT systems are intuitive and easy to use. By doing so, developers can increase user satisfaction with ICT systems, leading to improved adoption and user retention [73].
Overall, the prioritisation of these features during the design and development of ICT systems in educational institutions is essential, as it influences users’ satisfaction and their inclination to use the ICT systems, as well as their trust in the institution. Failure to address the users’ concerns may lead to users seeking alternative unauthorised third-party solutions, resulting in significant implications for users’ satisfaction, productivity, and the organisation’s IT infrastructure. Therefore, institutions must ensure that adequate ICT systems and IT support are available to users. This includes timely response to support requests, knowledgeable and skilled support staff, and clear communication regarding system maintenance and upgrades [74]. SHAP is highly useful for identifying which features individually affect the prediction and ICT users’ satisfaction. This tool offers more detailed information about each individual case concerning ICT systems.
6. Conclusions
This study aimed to predict ICT users’ satisfaction in Saudi Arabian educational organisations using ML techniques. The results show that RF and CBC achieved the highest accuracy rate of 94.9% and 94.1%, respectively, followed by DT and KNN with an accuracy rate of 92.9% and 92.2%, respectively. The other algorithms also demonstrated varying degrees of performance, with the lowest accuracy rate of 90.2% achieved by the ANN. Additionally, some algorithms showed higher precision than recall, while others showed the opposite pattern. Overall, RF, CBC, DT, and KNN proved to be effective ML algorithms for predicting ICT users’ satisfaction. LR, which achieved an accuracy rate of 91.4%, was found to be suitable for binary classification tasks like the one evaluated. However, its limitations in terms of linearity and independence between predictor variables need to be considered for future analysis. Also, the limited number of participants makes it hard to obtain a full understanding. Overall, this study highlights the potential of machine learning techniques in predicting ICT users’ satisfaction, informing decision making in higher education departments to enhance the quality of education and users’ experience. In the future, this framework could be used to develop a new tool for predicting users’ satisfaction with ICT systems.
This study is subject to several limitations that should be considered when interpreting the findings. First, the research is centred around educational organisations in Saudi Arabia, thus the generalisability of the results to other geographical or cultural contexts may be limited. Additionally, the conclusions drawn are based on data from a specific array of ICT systems implemented for administrative purposes within these organisations. Therefore, our findings might not be directly transferable to different types of ICT systems or to systems utilised in dissimilar contexts of application. Another constraint relates to the dataset size. The volume of data available after preprocessing was relatively small, which could lead to potential overfitting when training more complex ML models, such as ANNs. This was evident in the lower accuracy observed in the ANN model. It is suggested that future research should investigate these phenomena across diverse cultural and educational landscapes to enhance the robustness of the findings. Moreover, further studies could expand upon the range of ICT systems examined and explore user satisfaction in varying operational environments.
Author Contributions
Conceptualization, H.A., B.S. and A.L.; Methodology, H.A. and B.S.; Software, H.A.; Validation, H.A. and B.S.; Formal analysis, H.A. and B.S.; Investigation, H.A.; Resources, B.S. and A.L.; Data curation, H.A.; Writing—original draft, H.A.; Writing—review & editing, B.S. and A.L.; Visualization, H.A.; Supervision, B.S. and A.L.; Project administration, B.S. All authors have read and agreed to the published version of the manuscript.
Funding
This research received no external funding.
Institutional Review Board Statement
HEC21065, La Trobe University.
Data Availability Statement
The data presented in this study are available on request from the corresponding author.
Conflicts of Interest
The authors declare no conflict of interest.
Appendix A
The questionnaire includes demographic questions about the participants. All measurements in this tool are built based on the Likert scales to measure and count the participants’ responses [75]. The study measurements are built on a 5-point Likert scale. However, to avoid unbalanced classes that could affect the ML Models the measurements are recoded into a 3-point Likert scale. This was carried out as follows: the ‘Strongly Agree’ and ‘Agree’ classes were changed to ‘Yes’. The ‘Strongly Disagree’ and ‘Disagree’ classes were changed to ‘No’. The ‘Neutral’ class was changed to ‘I do not know’. This step helps have balanced classes and be suitable for ML algorithms.
Table A1 describes the measurement fields for the demographic questions. The first field (Q1) pertains to the participant’s gender, with response options of ‘Female’; (coded as 1), ‘Male’ (coded as 2), or ‘Prefer not to say’ (coded as 3). The second field (Q2) asks about the participant’s level of education, with response options ranging from ‘primary degree’ (coded as 1) ‘intermediate degree’ (coded 2), ‘secondary degree’ (coded 3), ‘diploma degree’ (coded 4), ‘bachelor degree’ (coded 5), ‘master degree’ (coded 6), ‘PhD degree’; (coded 7), and ‘other’ (coded 8). The third field (Q3) asks about the participant’s role in the education sector, with response options that include ‘school principal’ (coded as 1), ‘school deputy headmaster’ (coded as 2), ‘teacher’ (coded as 3), ‘administrative assistant’ (coded as 4), and ‘other’ (coded as 5). These fields and their corresponding ranges were carefully chosen to collect key demographic information about the participants that is relevant to the study’s aims. The use of Likert-type category scales enables the participants to provide their responses in a clear and concise manner, allowing for accurate and efficient data collection.
Table A1.
The demographic measurements.
Table A1.
The demographic measurements.
| Fields | Discerption of the Measurement |
|---|---|
| Q1 | What is your gender? |
| Q2 | What is your education level? |
| Q3 | What is your role? |
Table A2 outlines a set of measurements related to the infrastructure, including Q1 to Q5. Q1 measures whether the current ICT systems provided by the Ministry of Education in Saudi Arabia maintain users’ privacy, with response options of ‘Yes’, ‘No’, or ‘I do not know’. Q2 measures the frequency of using third-party software, with response options of ‘Yes, always’, ‘Yes, sometimes’, or ‘No, never’. Q3 examines whether the systems and programs provided by the Ministry of Education have negatively affected participants’ task performance due to Internet connection issues, with response options of ‘Yes, always’, ‘Sometimes’, or ‘No, never’. Q4 assesses whether the systems and programs provided by the Ministry of Education are safe to use. The response options for Q4 are ‘Yes’, ‘No’, or ‘I do not know’. Finally, Q5 investigates whether the systems and programs provided by the Ministry of Education have an easy-to-use interface, with response options of ‘Yes’, ‘No’, or ‘I do not know’. These measurements are designed to provide structured and relevant data for the study’s research questions and objectives. The use of Likert-type category scales in these measurements ensures that the participants’ responses are clear and easy to analyse.
Table A3 shows the measurements related to training on the use of ICT systems provided by the Ministry of Education in Saudi Arabia. Q1 measures the availability and appropriateness of training offered to the participants, with response options of ‘Yes, always’, ‘Yes, sometimes’, or ‘No, never’. Q2 evaluates the adequacy of previous experiences in dealing with the programs and systems provided by the Ministry of Education, with response options of ‘Yes’, ‘No’, or ‘I do not have any previous experience’. These fields were carefully selected to assess the effectiveness of the training programs and the participants’ preparedness in utilising the ICT systems in their daily administration tasks. The use of a Likert scale allows for the recording of responses on multiple levels, facilitating data analysis and the identification of areas for improvement. The responses to these questions provide insights into the effectiveness of the training programs and any gaps that need to be addressed to enhance participants’ proficiency in using ICT systems.
Table A2.
Infrastructure measurements.
Table A2.
Infrastructure measurements.
| Fields | Discerption of the Measurement |
|---|---|
| Q1 | The currently provided ICT systems maintain the users’ privacy. |
| Q2 | You need to use third-party software. |
| Q3 | Your performance of tasks has been negatively affected when using the systems and programs provided by the Ministry of Education due to the Internet connection. |
| Q4 | The systems and programs provided by the Ministry of Education are safe to use. |
| Q5 | The systems and programs provided by the Ministry of Education are characterised by an easy-to-use interface. |
Table A3.
Training measurements.
Table A3.
Training measurements.
| Fields | Discerption of the Measurement |
|---|---|
| Q1 | You get enough training to use current ICT systems. |
| Q2 | Previous experiences have helped you in dealing with programs and systems provided by the Ministry of Education. |
Table A4 lists the measurement fields for questions related to IT support and its effectiveness in the education sector. The first field (Q1) inquiries about whether there is enough IT support available for the current ICT systems provided by the Ministry of Education, with response options of ‘Yes always’ (coded as 1), ‘Yes sometimes’ (coded as 2), or ‘No never’ (coded as 3). The second field (Q2) asks whether the participants’ performance in completing administrative tasks has been negatively affected due to the IT support, with response options of ‘Yes always’ (coded as 1), ‘Yes sometimes’ (coded as 2), or ‘No never’ (coded as 3). The third field (Q3) measures whether the IT support provided has helped the participants solve problems related to the ICT systems, with response options of ‘Yes always’ (coded as 1), ‘Yes sometimes’ (coded as 2), or ‘No never’ (coded as 3). These measurement fields were carefully designed to assess the effectiveness of the IT support provided in the education sector and to gather data on the participants’ experiences with it. The Likert-type category scales used for each question enable the participants to provide nuanced responses that accurately reflect their experiences, allowing for a thorough analysis of the data collected.
Table A5 presents the fields and corresponding domains used to collect data on participants’ perceptions of current ICT systems within their education organisation. The first field (Q1) assesses whether the current ICT systems help participants communicate with other members of their organisation, with response options of ‘Yes always’ (coded as 1), ‘Yes sometimes’ (coded as 2), or ‘No never’ (coded as 3). The second field (Q2) examines whether the current ICT systems assist participants in communicating with higher departments, with response options of ‘Yes always’ (coded as 1), ‘Yes sometimes’ (coded as 2), or ‘No never’ (coded as 3). The third field (Q3) measures whether the current ICT systems have increased communication between decision-makers and users, with response options of ‘Yes always’ (coded as 1), ‘Yes sometimes’ (coded as 2), or ‘No never’; (coded as 3). These fields and their corresponding ranges were carefully selected to gauge participants’ attitudes toward the effectiveness of current ICT systems within their education organisation. The use of a Likert-type response format enables participants to provide their perceptions in a straightforward and structured manner, allowing for efficient and accurate data collection.
Table A4.
IT support measurements.
Table A4.
IT support measurements.
| Fields | Discerption of the Measurement |
|---|---|
| Q1 | Your performance in completing administrative tasks has been negatively affected due to IT support. |
| Q2 | Your performance in completing tasks has been negatively affected due to the lack or delay in proper periodic maintenance of equipment, devices and systems provided by the Ministry of Education. |
Table A5.
Communication measurements.
Table A5.
Communication measurements.
| Fields | Discerption of the Measurement |
|---|---|
| Q1 | The current ICT systems help you for the internal communication. |
| Q2 | The systems and programs provided by the Ministry of Education have helped you for the external communication. |
The final question in the survey elicits participants’ overall user satisfaction with the current ICT systems within their education organisation. Participants are asked to rate their satisfaction level using a two-point response scale, with response options of ‘satisfied’ (coded as 1) or ‘not satisfied’ (coded as 2). This question was included to provide a holistic view of participants’ perceptions of the current ICT systems and to help identify areas for improvement. The use of a binary response format enables participants to provide a clear and concise response, while also facilitating efficient data collection and analysis. Overall, this question provides valuable insights into participants’ overall satisfaction with the ICT systems, which can inform future efforts to improve the effectiveness and usability of these systems within educational organisations.
References
- Almaghrabi, H.; Li, A.; Soh, B. IiCE: A Proposed System Based on IoTaaS to Study Administrative Efficiency in Primary Schools. In Proceedings of the IoT as a Service: 7th EAI International Conference, IoTaaS 2021, Sydney, Australia, 13–14 December 2021; Springer: Berlin/Heidelberg, Germany, 2022; pp. 121–138. [Google Scholar]
- Hoque, K.E.; Samad, R.S.A.; Siraj, S.; Ziyadh, A. The Role of ICT in school management of Maldives. CzesŁAw Kupisiewicz 2012, 270, 270–282. [Google Scholar]
- Honka, A.; Kaipainen, K.; Hietala, H.; Saranummi, N. Rethinking health: ICT-enabled services to empower people to manage their health. IEEE Rev. Biomed. Eng. 2011, 4, 119–139. [Google Scholar] [CrossRef] [PubMed]
- Perego, A.; Perotti, S.; Mangiaracina, R. ICT for logistics and freight transportation: A literature review and research agenda. Int. J. Phys. Distrib. Logist. Manag. 2011, 41, 457–483. [Google Scholar] [CrossRef]
- Hoque, K.E.; Razak, A.Z.A.; Zohora, M.F. ICT utilization among school teachers and principals in Malaysia. Int. J. Acad. Res. Progress. Educ. Dev. 2012, 1, 17–34. [Google Scholar]
- Samuel, R.; Bakar, Z. The utilization and integration of ICT tools in promoting English language teaching and learning: Reflections from English option teachers in Kuala Langat District, Malaysia. Int. J. Educ. Dev. Using ICT 2006, 2, 4–14. [Google Scholar]
- Fernández-Gutiérrez, M.; Gimenez, G.; Calero, J. Is the use of ICT in education leading to higher student outcomes? Analysis from the Spanish Autonomous Communities. Comput. Educ. 2020, 157, 103969. [Google Scholar] [CrossRef]
- Chang, I.H. The effect of principals’ technological leadership on teachers’ technological literacy and teaching effectiveness in Taiwanese elementary schools. J. Educ. Technol. Soc. 2012, 15, 328–340. [Google Scholar]
- Vanderlinde, R.; Van Braak, J.; Tondeur, J. Using an online tool to support school-based ICT policy planning in primary education. J. Comput. Assist. Learn. 2010, 26, 434–447. [Google Scholar] [CrossRef]
- Passey, D. ICT and School management: A Review of Selected Literature; Lancaster University, Department of Educational Research: Lancaster, UK, 2002; Volume 16, p. 2008. [Google Scholar]
- Eremie, I.; Agi, U.K. Information and Communication Technology (ICT) Skills and Efficient Management of Educational Resources in Public Secondary Schools. J. Int. Soc. Teach. Educ. 2020, 24, 36–47. [Google Scholar]
- Anshari, M.; Syafrudin, M.; Fitriyani, N.L. Fourth industrial revolution between knowledge management and digital humanities. Information 2022, 13, 292. [Google Scholar] [CrossRef]
- Almalki, G.; Williams, N. A strategy to improve the usage of ICT in the Kingdom of Saudi Arabia primary school. Int. J. Adv. Comput. Sci. Appl. 2012, 3, 42–198. [Google Scholar] [CrossRef]
- Bright, A.A.; Asare, G. The impact of management information system on University of Education Winneba, Kumasi Campus-Ghana. Eur. J. Res. Reflect. Manag. Sci. 2019, 7, 1–20. [Google Scholar]
- Zhu, Y.; Janssen, M.; Wang, R.; Liu, Y. It is me, chatbot: Working to address the COVID-19 outbreak-related mental health issues in China. User experience, satisfaction, and influencing factors. Int. J. Hum. Comput. Interact. 2022, 38, 1182–1194. [Google Scholar] [CrossRef]
- Alhayani, B.; Abbas, S.T.; Khutar, D.Z.; Mohammed, H.J. Best ways computation intelligent of face cyber attacks. Mater. Today Proc. 2021, 3, 26–31. [Google Scholar] [CrossRef]
- Brannigan, N.; Brannigan, N. Enhancing Leadership Capacity in ICTs in Education through technology enabled collaboration. Retrieved 2010, 5, 1–9. [Google Scholar]
- Prokopiadou, G. Using information and communication technologies in school administration: Researching Greek kindergarten schools. Educ. Manag. Adm. Leadersh. 2012, 40, 305–327. [Google Scholar] [CrossRef]
- Khalid, M.S.; Nyvang, T. A change agent’s facilitation process for overcoming the barriers of ICT adoption for educational administration—The case of a rural-Bangladesh vocational institution. Australas. J. Educ. Technol. 2014, 30, 547–561. [Google Scholar] [CrossRef]
- Zuhaib, H.; Muhammad, M. Efficient use of ICT in administration: A case from Mehran University of Engineering and Technology, Jamshoro, Pakistan. Int. J. Econ. Commer. Manag. 2016, 4, 540–550. [Google Scholar]
- Hayes, D.N. ICT and learning: Lessons from Australian classrooms. Comput. Educ. 2007, 49, 385–395. [Google Scholar] [CrossRef]
- Suleimen, N. Appraising the Attitude towards Information Communication Technology Integration and Usage in Kazakhstani Higher Education Curriculum. J. Inf. Technol. Educ. 2019, 18, 355. [Google Scholar] [CrossRef]
- Mitomo, H. Utilization of ICT in elementary and secondary education in Japan: Its policies and effects. Telecommun. Policies Jpn. 2020, 1, 239–266. [Google Scholar]
- Ghavifekr, S.; Afshari, M.; Siraj, S.; Seger, K. ICT application for administration and management: A conceptual review. Procedia Soc. Behav. Sci. 2013, 103, 1344–1351. [Google Scholar] [CrossRef]
- ISO 10004:2012; Quality Management—Customer Satisfaction—Guidelines for Monitoring and Measuring. International Standard; International Organization for Standardization: London, UK, 2018.
- Biesok, G.; Wyród-Wróbel, J. Customer satisfaction-Meaning and methods of measuring. In Marketing and Logistic Problems in the Management of Organization; Wydawnictwo Naukowe Akademii Techniczno-Humanistycznej w Bielsku-Bialej: Bielsko-Biala, Poland, 2011; pp. 23–41. [Google Scholar]
- Kalankesh, L.R.; Nasiry, Z.; Fein, R.A.; Damanabi, S. Factors influencing user satisfaction with information systems: A systematic review. Galen Med. J. 2020, 9, e1686. [Google Scholar] [CrossRef] [PubMed]
- Zhang, Z. How Canadian and Chinese high school students access and use ICT: An exploratory study. J. Educ. Technol. Dev. Exch. (JETDE) 2014, 7, 2. [Google Scholar] [CrossRef]
- Islam, A.A.; Mok, M.M.C.; Gu, X.; Spector, J.; Hai-Leng, C. ICT in higher education: An exploration of practices in Malaysian universities. IEEE Access 2019, 7, 16892–16908. [Google Scholar] [CrossRef]
- Vanderlinde, R.; Aesaert, K.; Van Braak, J. Institutionalised ICT use in primary education: A multilevel analysis. Comput. Educ. 2014, 72, 1–10. [Google Scholar] [CrossRef]
- San, Y.Y.; Yew, M.P.; Mei, C.Y.; Pin, C.T. Exploring the Factors of Using Cloud Service in Malaysia Higher Education Institutions During COVID-19 Pandemic Outbreak. Qeios 2024, 1, 7SZCV6. [Google Scholar]
- Qazdar, A.; Er-Raha, B.; Cherkaoui, C.; Mammass, D. A machine learning algorithm framework for predicting students performance: A case study of baccalaureate students in Morocco. Educ. Inf. Technol. 2019, 24, 3577–3589. [Google Scholar] [CrossRef]
- Ojajuni, O.; Ayeni, F.; Akodu, O.; Ekanoye, F.; Adewole, S.; Ayo, T.; Misra, S.; Mbarika, V. Predicting student academic performance using machine learning. In Proceedings of the Computational Science and Its Applications—ICCSA 2021: 21st International Conference, Cagliari, Italy, 13–16 September 2021; Springer: Berlin/Heidelberg, Germany, 2021. Part IX 21. pp. 481–491. [Google Scholar]
- Fernandes, E.; Holanda, M.; Victorino, M.; Borges, V.; Carvalho, R.; Van Erven, G. Educational data mining: Predictive analysis of academic performance of public school students in the capital of Brazil. J. Bus. Res. 2019, 94, 335–343. [Google Scholar] [CrossRef]
- Hew, K.F.; Hu, X.; Qiao, C.; Tang, Y. What predicts student satisfaction with MOOCs: A gradient boosting trees supervised machine learning and sentiment analysis approach. Comput. Educ. 2020, 145, 103724. [Google Scholar] [CrossRef]
- Shafiee, N.S.M.; Mutalib, S. Prediction of mental health problems among higher education student using machine learning. Int. J. Educ. Manag. Eng. (IJEME) 2020, 10, 1–9. [Google Scholar]
- Verma, C.; Illés, Z. Attitude prediction towards ICT and mobile technology for the real-time: An experimental study using machine learning. In The International Scientific Conference Elearning and Software for Education; “Carol I” National Defence University: Bucharest, Romania, 2019; Volume 3, pp. 247–254. [Google Scholar]
- Panagiotakopoulos, T.; Kotsiantis, S.; Kostopoulos, G.; Iatrellis, O.; Kameas, A. Early dropout prediction in MOOCs through supervised learning and hyperparameter optimization. Electronics 2021, 10, 1701. [Google Scholar] [CrossRef]
- Kaur, P.; Singh, M.; Josan, G.S. Classification and prediction based data mining algorithms to predict slow learners in education sector. Procedia Comput. Sci. 2015, 57, 500–508. [Google Scholar] [CrossRef]
- Ho, I.M.K.; Cheong, K.Y.; Weldon, A. Predicting student satisfaction of emergency remote learning in higher education during COVID-19 using machine learning techniques. PLoS ONE 2021, 16, e0249423. [Google Scholar] [CrossRef] [PubMed]
- Afrin, F.; Rahaman, M.S.; Hamilton, M. Mining Student Responses to Infer Student Satisfaction Predictors. arXiv 2020, arXiv:2006.07860. [Google Scholar]
- Madaio, M.; Lasko, R.; Ogan, A.; Cassell, J. Using Temporal Association Rule Mining to Predict Dyadic Rapport in Peer Tutoring. In Proceedings of the International Conference on Educational Data Mining (EDM), Wuhan, China, 25–28 June 2017. [Google Scholar]
- Bland, J.M.; Altman, D.G. Statistics notes: Cronbach’s alpha. BMJ 1997, 314, 572. [Google Scholar] [CrossRef] [PubMed]
- Vispoel, W.P.; Morris, C.A.; Kilinc, M. Using generalizability theory to disattenuate correlation coefficients for multiple sources of measurement error. Multivar. Behav. Res. 2018, 53, 481–501. [Google Scholar] [CrossRef] [PubMed]
- Tabachnick, B.G.; Fidell, L.S.; Ullman, J.B. Using Multivariate Statistics; Pearson: Boston, MA, USA, 2013; Volume 6. [Google Scholar]
- Kaiser, H.F. An index of factorial simplicity. Psychometrika 1974, 39, 31–36. [Google Scholar] [CrossRef]
- Dake, D.K.; Buabeng-Andoh, C. Using Machine Learning Techniques to Predict Learner Drop-out Rate in Higher Educational Institutions. Mob. Inf. Syst. 2022, 2022, 2670562. [Google Scholar] [CrossRef]
- Chawla, N.V. Data mining for imbalanced datasets: An overview. In Data Mining and Knowledge Discovery Handbook; Springer: New York, NY, USA, 2010; pp. 875–886. [Google Scholar]
- Luan, H.; Tsai, C.C. A review of using machine learning approaches for precision education. Educ. Technol. Soc. 2021, 24, 250–266. [Google Scholar]
- Singla, S.; Feizi, S. Salient ImageNet: How to discover spurious features in Deep Learning? arXiv 2021, arXiv:2110.04301. [Google Scholar]
- Lin, Y.W.; Zhou, Y.; Faghri, F.; Shaw, M.J.; Campbell, R.H. Analysis and prediction of unplanned intensive care unit readmission using recurrent neural networks with long short-term memory. PLoS ONE 2019, 14, e0218942. [Google Scholar] [CrossRef] [PubMed]
- Thaher, T.; Zaguia, A.; Al Azwari, S.; Mafarja, M.; Chantar, H.; Abuhamdah, A.; Turabieh, H.; Mirjalili, S.; Sheta, A. An enhanced evolutionary student performance prediction model using whale optimization algorithm boosted with sine-cosine mechanism. Appl. Sci. 2021, 11, 10237. [Google Scholar] [CrossRef]
- Zhang, M.; Fan, J.; Sharma, A.; Kukkar, A. Data mining applications in university information management system development. J. Intell. Syst. 2022, 31, 207–220. [Google Scholar] [CrossRef]
- Zhang, Y.; Yun, Y.; An, R.; Cui, J.; Dai, H.; Shang, X. Educational data mining techniques for student performance prediction: Method review and comparison analysis. Front. Psychol. 2021, 12, 698490. [Google Scholar] [CrossRef]
- Arrieta, A.B.; Díaz-Rodríguez, N.; Del Ser, J.; Bennetot, A.; Tabik, S.; Barbado, A.; García, S.; Gil-López, S.; Molina, D.; Benjamins, R.; et al. Explainable Artificial Intelligence (XAI): Concepts, taxonomies, opportunities and challenges toward responsible AI. Inf. Fusion 2020, 58, 82–115. [Google Scholar] [CrossRef]
- Galhotra, S.; Pradhan, R.; Salimi, B. Explaining black-box algorithms using probabilistic contrastive counterfactuals. In Proceedings of the 2021 International Conference on Management of Data, Xi’an, China, 11 June 2021; pp. 577–590. [Google Scholar]
- Habiba, U.; Ahmed, S.Z. ICT infrastructure and access to online services: Determining the factors affecting faculty satisfaction with university-subscribed resources. Int. Inf. Libr. Rev. 2020, 53, 112–130. [Google Scholar] [CrossRef]
- Ngwenyama, O.; Morawczynski, O. Factors affecting ICT expansion in emerging economies: An analysis of ICT infrastructure expansion in five Latin American countries. Inf. Technol. Dev. 2009, 15, 237–258. [Google Scholar] [CrossRef]
- Jacob, O.N.; Deborah, J.; Samuel, A.; Elizabeth, A.; Solomon, A.T. Administration of research programme in Nigerian public universities: Problems and way forward. Riwayat Educ. J. Hist. Humanit. 2020, 3. [Google Scholar]
- Dormann, M.; Hinz, S.; Wittmann, E. Improving school administration through information technology? How digitalisation changes the bureaucratic features of public school administration. Educ. Manag. Adm. Leadersh. 2019, 47, 275–290. [Google Scholar] [CrossRef]
- Ifinedo, E.; Rikala, J.; Hämäläinen, T. Factors affecting Nigerian teacher educators’ technology integration: Considering characteristics, knowledge constructs, ICT practices and beliefs. Comput. Educ. 2020, 146, 103760. [Google Scholar] [CrossRef]
- Bolaji, H.; Jimoh, H.A. Usability and utilization of ICT among educational administrators in secondary students in public school. Indones. J. Educ. Res. Technol. 2023, 3, 97–104. [Google Scholar] [CrossRef]
- Tokareva, E.A.; Smirnova, Y.V.; Orchakova, L.G. Innovation and communication technologies: Analysis of the effectiveness of their use and implementation in higher education. Educ. Inf. Technol. 2019, 24, 3219–3234. [Google Scholar] [CrossRef]
- Panagiotarou, A.; Stamatiou, Y.C.; Pierrakeas, C.; Kameas, A. Gamification acceptance for learners with different E-skills. Int. J. Learn. Teach. Educ. Res. 2020, 19, 263–278. [Google Scholar] [CrossRef]
- Marín, V.I.; Carpenter, J.P.; Tur, G. Pre-service teachers’ perceptions of social media data privacy policies. Br. J. Educ. Technol. 2021, 52, 519–535. [Google Scholar] [CrossRef]
- Sattaburuth, C.; Nilsook, P. Democratization of Information Technology Service for Higher Education Institutes. J. Theor. Appl. Inf. Technol. 2022, 100, 2895–2904. [Google Scholar]
- Keržič, D.; Alex, J.K.; Pamela Balbontín Alvarado, R.; Bezerra, D.d.S.; Cheraghi, M.; Dobrowolska, B.; Fagbamigbe, A.F.; Faris, M.E.; França, T.; González-Fernández, B.; et al. Academic student satisfaction and perceived performance in the e-learning environment during the COVID-19 pandemic: Evidence across ten countries. PLoS ONE 2021, 16, e0258807. [Google Scholar] [CrossRef]
- Mandal, S.; Khan, D.A. A Study of security threats in cloud: Passive impact of COVID-19 pandemic. In Proceedings of the 2020 International Conference on Smart Electronics and Communication (ICOSEC), Trichy, India, 10–12 September 2020; IEEE: New York, NY, USA; pp. 837–842. [Google Scholar]
- Apple, M.T.; Mills, D.J. Online teaching satisfaction and technostress at Japanese universities during emergency remote teaching. In Transferring Language Learning and Teaching from Face-to-Face to Online Settings; IGI Global: Hershey, PA, USA, 2022; pp. 1–25. [Google Scholar]
- Rodríguez-Abitia, G.; Martínez-Pérez, S.; Ramirez-Montoya, M.S.; Lopez-Caudana, E. Digital gap in universities and challenges for quality education: A diagnostic study in Mexico and Spain. Sustainability 2020, 12, 9069. [Google Scholar] [CrossRef]
- Belenko, V.; Klepikova, A.; Nemtsev, S.; Belenko, T. Innovative approaches in the educational process management of the university with the use of information and educational environment. In Proceedings of the International Scientific Conference on Innovative Approaches to the Application of Digital Technologies in Education, Stavropol, Russia, 12–13 November 2020. [Google Scholar]
- Chen, X.; Xia, E.; Jia, W. Utilisation status and user satisfaction of online education platforms. Int. J. Emerg. Technol. Learn. (iJET) 2020, 15, 154–170. [Google Scholar] [CrossRef]
- Bolaji, H.; Adeoye, M.A. Accessibility, Usability, and Readiness Towards ICT Tools for Monitoring Educational Practice in Secondary Schools in Ilorin Metropolis. Indones. J. Multidiciplinary Res. 2022, 2, 257–264. [Google Scholar]
- Cidral, W.A.; Oliveira, T.; Di Felice, M.; Aparicio, M. E-learning success determinants: Brazilian empirical study. Comput. Educ. 2018, 122, 273–290. [Google Scholar] [CrossRef]
- Lethbridge, T.C. A survey of the relevance of computer science and software engineering education. In Proceedings of the 11th Conference on Software Engineering Education, Atlanta, GA, USA, 23–25 February 1998; IEEE: New York, NY, USA, 1998; pp. 56–66. [Google Scholar]


Disclaimer/Publisher’s Note: The statements, opinions and data contained in all publications are solely those of the individual author(s) and contributor(s) and not of MDPI and/or the editor(s). MDPI and/or the editor(s) disclaim responsibility for any injury to people or property resulting from any ideas, methods, instructions or products referred to in the content. |
© 2024 by the authors. Licensee MDPI, Basel, Switzerland. This article is an open access article distributed under the terms and conditions of the Creative Commons Attribution (CC BY) license (https://creativecommons.org/licenses/by/4.0/).