Abstract
Railway infrastructure is generally classified as either fixed or movable infrastructure assets. Failure in any of the assets could lead to the complete shutdown and disruption of the entire system, economic loss, inconvenience to passengers and the train operating company(s), and can sometimes result in death or injury in the event of the derailment of the rolling stock. Considering the importance of the railway infrastructure assets, it is only necessary to continuously explore their behavior, reliability, and safety. In this paper, a proactive multi-criteria decision-making model that is based on an interval-valued intuitionistic fuzzy set and some reliability quantitative parameters has been proposed for the evaluation of the reliability of the infrastructure assets. Results from the evaluation show that the failure mode ‘Broken and defective rails’ has the most risk and reliability concerns. Hence, priority should be given to the failure mode to avoid a total system collapse.
1. Introduction
Railway transport was first introduced in Nigeria by the British colonial government in 1901, when a 20-kilometer rail line was constructed from the then Lagos colonial headquarters to one of their sub-offices in Ibadan. The line was further extended to Minna and Baro-Kano in 1911 [1]. With the many years of neglect of the railway facilities, including the rolling stock and the right of way, the capability, reliability, and utility of the system have greatly been reduced [2]. One of the results of such neglect is the progressive wear that is seen in most of the rail lines/tracks and the collapse of most of the other key railway infrastructure [3].
Although the government has made some attempts to rehabilitate some of the railway lines [4] and enhance their efficiency [5], it is not enough to achieve excellent reliability management of the rail lines and their infrastructure. A proper diagnostic study, a retrospective assessment for finding vulnerabilities, and a predictive analysis practice are needed for proactive failure prevention in the rail system and network [6] and for addressing reoccurrences of adverse system failure by tracking the causal relationships of the failure from the origin [7]. Some of these practices, however, have been grouped into the following themes: the remaining service life study [8], reliability-centered maintenance and the digital twin approach for detecting faults in some of the key rail infrastructures [9,10], and structural response to random vibration due to the movement of the train [11,12,13]. Finally, the root cause of failure in some selected subsystems and components of the railway infrastructure assets [14]. The use of reliability-centered maintenance, predictive maintenance programs, and expert-based rail data for the assessment of the root cause of failure, fault detection, and failure diagnosis in railway infrastructure assets is an interesting topic in reliability management studies [15].
Railway infrastructure in general can be classified into the following two assets [16]: (1) Infrastructures that can be grouped into fixed assets such as lines/rail tracks, bridges, sleepers, signaling systems, points and interlocking systems, electrical units, etc. (2) Infrastructure that can move on the railway (rolling stock), such as passenger coaches, locomotives, and freight cars. Failure of any of these infrastructure assets can result in the complete shutdown of the entire system. Where this could lead to a delay in traffic and sometimes a total disruption of the entire system altogether, it can also cause a great deal of economic loss, inconvenience to both the passengers and the train operating company(s), and sometimes result in death or injury due to the derailment of the rolling stock [17].
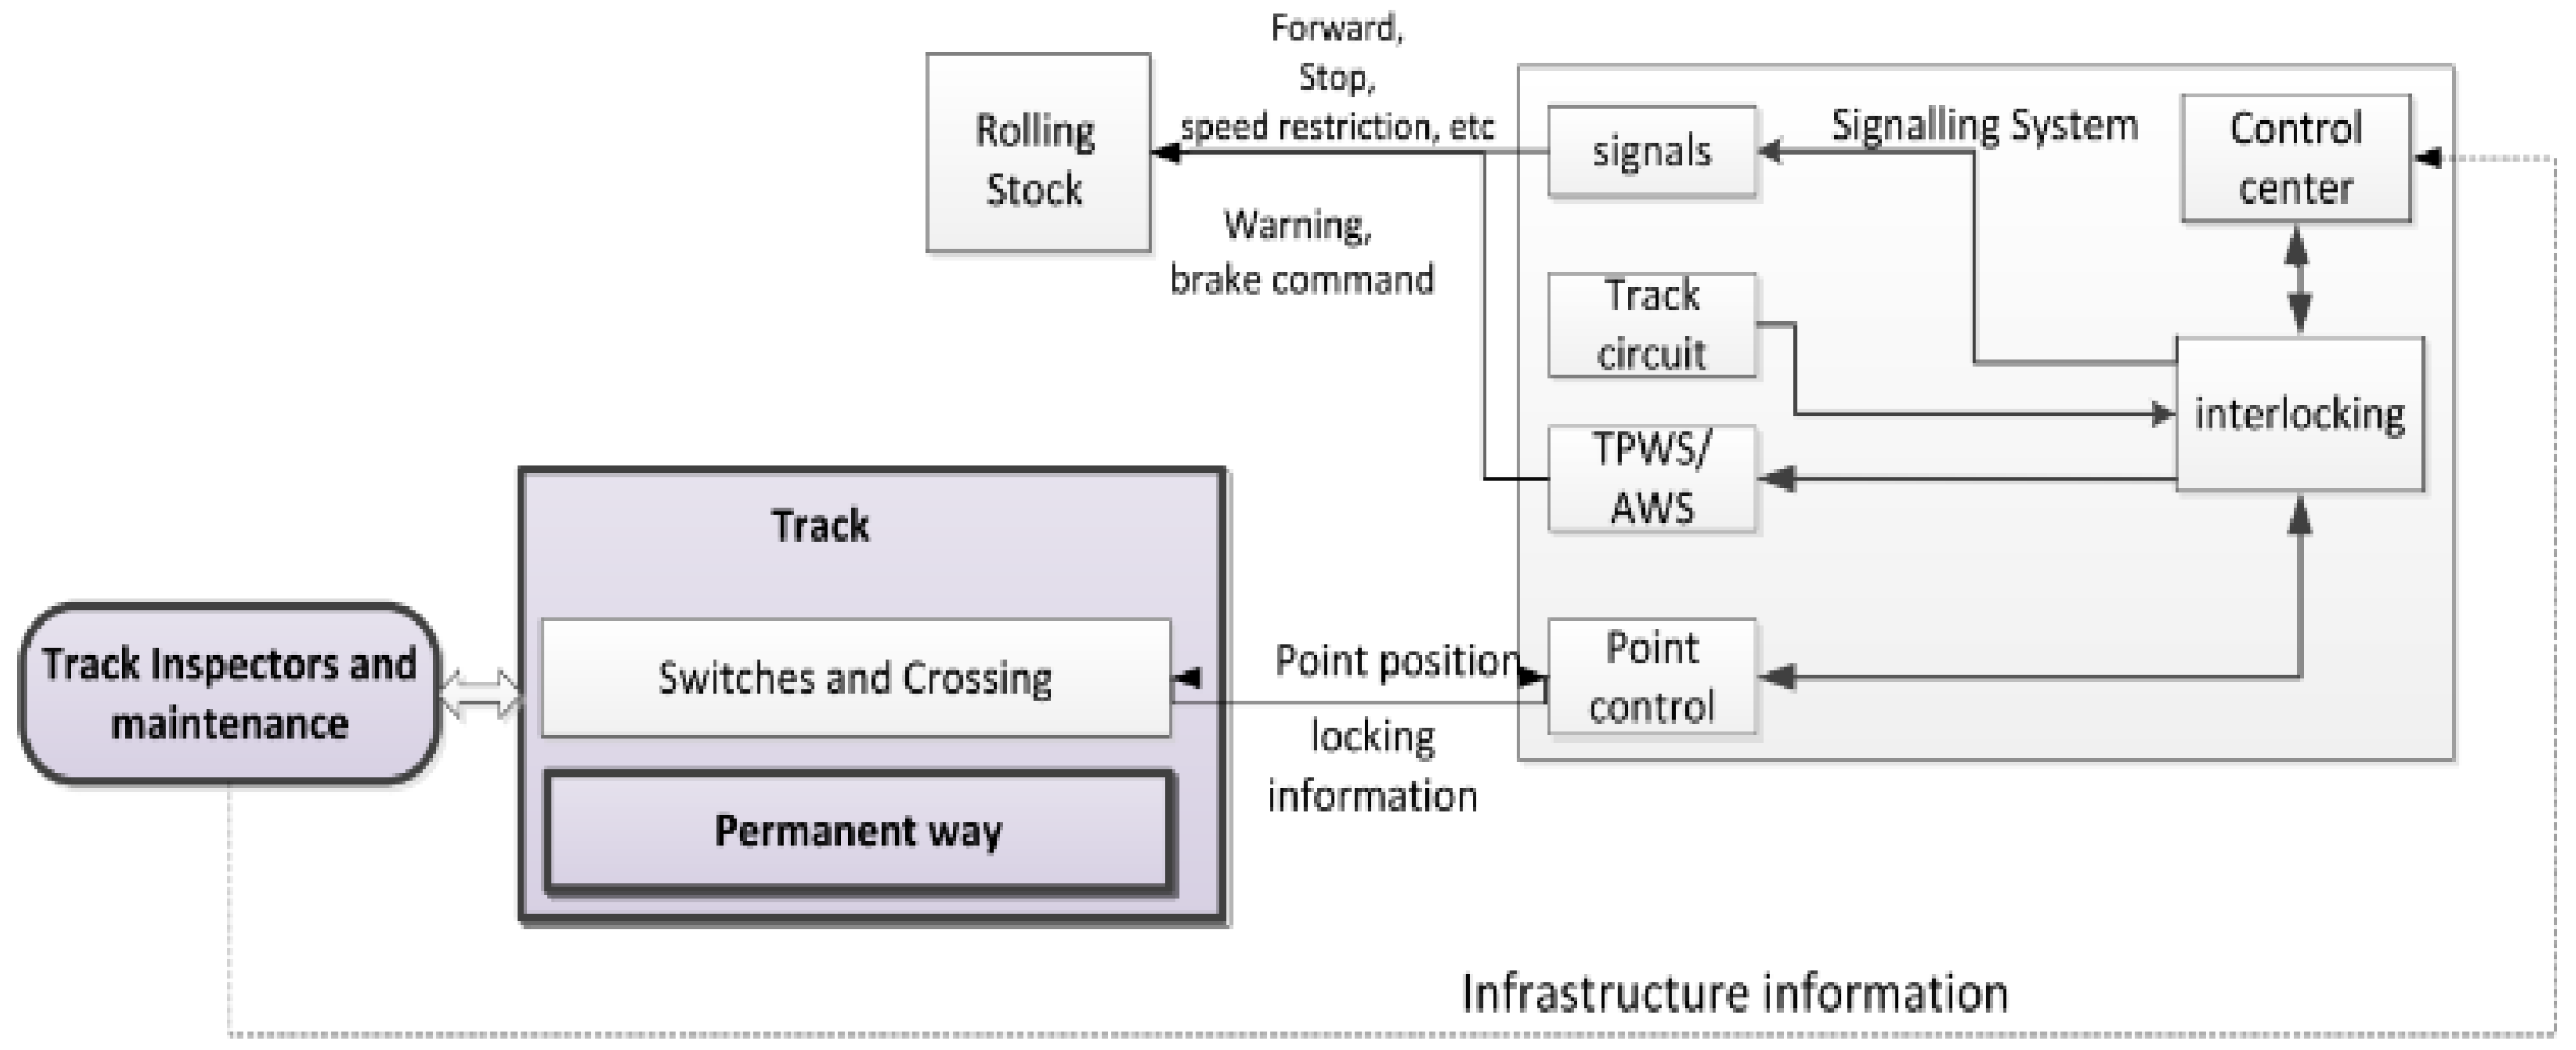
Considering the importance of the issues raised so far, it is only necessary to continuously explore the behavior of these railway infrastructures, their reliability, and their safety concerns. According to Dinmohammadi et al. [16], one of the open and challenging areas still available in railway infrastructure research is the need for a practical methodology that can cope with the uncertainty of information for analyzing and mitigating the risks associated with the failure mechanism of the railway infrastructure components at a system level. The currently available methods used in the railway industry include the fault tree analysis method [18,19], the event tree analysis method [20], the Monte Carlo simulation model [21], the consequence analysis method [22], and the equivalent fatality analysis method [23]. These methods, however, all rely heavily on the availability and accuracy of reliability-related data, which in most cases are not readily available. A simplistic approach that often fails to capture the multi-dimensional nature of uncertainty inherent in asset condition assessment. Details of the infrastructure asset information for the railway system are presented in Figure 1 below.
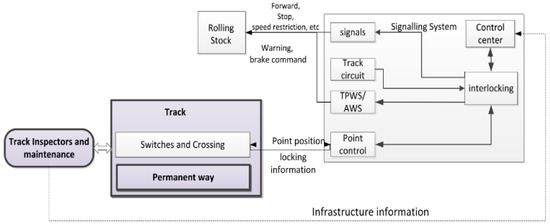
Figure 1.
Railway infrastructure assets [24].
In this paper, however, a proactive multi-criteria decision-making (P-MCDM) model that is based on an interval-valued intuitionistic fuzzy set (IVIFS) and some reliability quantitative parameters has been proposed for the evaluation of the reliability of the infrastructure assets of the rail system. To address the multi-dimensional nature of uncertainty inherent in the rail system asset condition assessment, an interval-valued intuitionistic fuzzy Dombi Heronian mean (IVIIFDHM) operator was incorporated into the P-MCDM model. The proactive evaluation model is used for measuring and mitigating the risks associated with the failure of the railway mechanism and infrastructure components. The evaluation, which aims to provide system failure knowledge, is achieved by prioritizing the failure modes associated with the railway infrastructure components. The new model derives its data from historical system failure reports and expert-based opinions, which can be likened to the reliability-centered maintenance concept that is designed to probe into what could happen due to the operation and application of the system. The main advantages and contributions of the work/method presented here include the following:
- (1)
- The extension of the criticality evaluation factors to include factors like maintainability (MT), safety and environmental impact protection (SEP), and costs of maintenance (CM), which have not been used as reliability and criticality factors in the evaluation of failure modes or when determining the root cause of failure under the reliability evaluation literature as well as for railway infrastructure asset evaluation.
- (2)
- The use of an expert-based approach for determining the root cause of failure in the railway infrastructure assets, which is the first of its kind in this area of research, as it can provide a solution to complex problems by reasoning through large bodies of knowledge and specific human expertise otherwise referred to as experts in this study.
- (3)
- The study also contributes to the reliability study of the railway infrastructure assets by proposing a new PMCDM model that holistically addresses the uncertainties in the evaluation process by using a multi-dimensional membership function that includes real membership, imaginary membership, real non-membership, and imaginary non-membership functions.
- (4)
- Unlike the currently existing reliability management model, the new PMCDM model accounts for some of the reliability quantitative parameters that are otherwise ignored in the currently existing reliability management model.
- (5)
- The new model is flexible and can be used in the evaluation of decision-making problems.
The rest of the paper is organized as follows: in Section 2, the formation of the new PMCDM model is presented by reviewing the concept of the IVIFS and the reliability quantitative parameters, and finally, the presentation of the PMCDM model algorithm and framework. In Section 3, a case with fifteen failure mode alternatives and four reliability criticality criteria is presented to illustrate the procedure for the implementation of the proposed approach for the root cause of failure determination in a section of the infrastructure assets of the rail system. And finally, in Section 4, some closing remarks, observations, and recommendations for future studies are presented.
2. Methods
2.1. Formation of the PMCDM Model
The proactive multi-criteria decision-making (PMCDM) model presented here is based on an interval-valued intuitionistic fuzzy set (IVIFS) and some reliability quantitative parameters that are used for the evaluation of the reliability of the infrastructure assets of the rail system. In developing the model, the IVIFS and the reliability quantitative parameters are reviewed and then integrated into the model. Finally, an algorithm that can be used for its implementation is presented in the form of a framework.
2.1.1. Interval-Valued Intuitionistic Fuzzy Set (IVIFS)
The IVIFS presented here was developed by Ye [25] and is an extension of the intuitionistic fuzzy set (IFS) originally proposed by Atanassov [26]. IVIFS, which has multi-dimensional mathematical functions, is used for addressing decision-making problems with several uncertainties, falsity, hesitation, and periodicity. The mathematical concept and formation of the IVIFS have been presented in Definition 1, which is followed by a mathematical operator that has been specifically selected and used in the development of the PMCDM model.
Definition 1
([25]). If is a given set and is a set of all closed subintervals of an interval [0, 1], then IVIFS of A in X is expressed as follows:
where with the condition .
The intervals and denote the degrees of membership and non-membership of the element x to the set A. Thus, for each the intervals, , and are closed and their lower and upper-end points are given as , respectively. The set can be rewritten as follows:
With the condition for each element x, we can compute the unknown degree of an intuitionistic fuzzy interval of in A, which can be defined as follows:
If and, then the IVIFS A is reduced to an ordinary IFS. In using the IVIFS for solving decision-making problems, the mathematical functions have been expressed as.
Definition 2
([27]). Let represent the interval-valued intuitionistic fuzzy number (IVIFN) of the interval-valued intuitionistic fuzzy Dombi Heronian mean (IVIIFDHM) operator, which has been selected specifically for the formation of the PMCDM model. For all , the IVIIFDHM operator of dimension n is a mapping IVIIFDHM of such that
where , , , and ; n is the number of IVIFN presented by the experts; are the real and imaginary membership functions; and are the real and imaginary non-membership functions, respectively. is the number of experts involved in the evaluation, while are real numbers that represent the computed reliability quantitative parameters.
2.1.2. Reliability Quantitative Parameters
In the evaluation of the reliability of the infrastructure assets of the rail system, the following reliability quantitative parameters have been adopted and integrated into the proactive multi-criteria decision-making (PMCDM) model:
- Failure rate
The failure rate of a system, which is often used in reliability engineering, can be described as the frequency with which the said system or its component parts fail [28]. The failure rate is expressed as the number of failures per unit of time. For the reliability assessment of a complex system, like the infrastructure assets of a railway, the failure rate data can be obtained through the following:
- (i)
- Estimation: Failure data obtained from the field are, in most cases, used to estimate the failure rate of a particular system by using statistical analysis techniques [29]. To ensure the accuracy of the failure rate, it is advised that the analyst have a good understanding of equipment and system operation, understand the procedures for data collection, understand the key environmental and physical parameters and variables impacting the failure rates, understand how the equipment is operated at the system level, and finally, understand the type of failure data required.
- (ii)
- Historical data about the device or system under consideration: Many engineering facilities maintain several rules of engagement, including the internal databases of failure information on the devices or systems they operate or produce [30]. With the failure information, the failure rate can be calculated for each device or system. For new devices or systems, the historical data for similar devices or systems can serve as a useful estimate [31].
- (iii)
- Prediction: Time lag is one of the many drawbacks associated with failure rate estimations of engineering systems. According to Mettas [32], failure rate data are concerning; however, when they are available, the system or devices for which the failure information is required have become obsolete. Due to this drawback, failure-rate prediction methods are often deployed to obtain data for the design and maintainability of systems and devices. These methods may be used on newly designed devices to predict the device’s failure rates and failure modes. Two of the most prominent approaches that have found application recently include the life cycle testing method and the failure modes, effects, and diagnostic analysis (FMEDA) method.
In integrating the failure rate parameter into the proactive multi-criteria decision-making (PMCDM) model, the study has adopted the Lambda–Tau method originally presented in [33] by modifying the failure rate.
Definition 3.
Without any loss of generality, let the Lambda–Tau method for the failure rate of a complex system be given as follows:
Equation (5) can further be described for systems in a fuzzy environment by considering the fuzzy failure rate function . If , the α-cuts of the fuzzy failure rate function have therefore been rewritten as follows:
where are two-parameter Weibull probability distributions; is the α-cuts of the fuzzy failure rate function; are the failure and repair rates, respectively; and are the boundary values within the CIFN and can be described as vagueness coefficients.
- Availability
To ensure the reliability of a system, risk and cost reductions, which are the most fundamental requirements critical to the maintenance unit, need to be taken into consideration. It is therefore essential that maintenance managers and engineers work around the clock to maximize the availability of operating systems/subsystems by eliminating sudden failures that, in most cases, can disrupt operations. Failures, as we know them, are an inescapable occurrence in the mechanical system and can only be managed by adopting a planned maintenance policy to ensure they are available for operation. The availability functions of the system are given below.
Definition 4.
Let the Lambda–Tau method for the fuzzy availability function of the system be given as [34] follows:
If , then the α-cuts of the fuzzy availability function can therefore be described in the following form:
2.2. PMCDM Model Algorithm and Framework
The PMCDM model algorithm proposed for the evaluation of the reliability of the infrastructure assets of the rail system has been presented in the following steps:
- Step 1: Request expert opinion from at least two persons with corresponding work experience on the subject matter to evaluate the reliability of the infrastructure assets of a railway system by prioritizing the failure modes of the system. The experts, who should come from both academia and industry, should have at least a first degree in engineering; this is mainly to ensure the integrity of the assessment process.
- Step 2: The identified set of failure modes is subject to some reliability-based criteria. Ask the experts to evaluate the failure modes using a linguistic scale that has a corresponding IVIFN equivalent (see Table 1).
 Table 1. Linguistic scale and its IVIFN equivalent for data collection.
 - Step 3: With the gathered experts’ opinions and evaluations, construct the linguistic intuitionistic fuzzy decision matrix of the experts ). Using the IVIFN values in Table 1, convert the to a numerical matrix. The numerical form of the matrix is given in Equation (9) and is based on the IVIFN.
- Step 4: With the numerical matrix in place, which is provided by the individual experts, the IVIIFDHM operator in Equation (4) is then used for the aggregation of the experts’ preference opinions and evaluation. The aggregation, which allows for the integration of some reliability quantitative parameters like fuzzy failure rate and availability function into the model, is used for the construction of the comprehensive intuitionistic decision matrix .
- Step 5: Using the intuitionistic entropy originally proposed by Ye [35], the weighted vector of the reliability criteria is computed from by using the following mathematical formation:
- Step 6: With the weighted vector, construct a weighted normalization matrix for the reliability criteria. From the matrix, determine the maximum and minimum values and then use them as the intuitionistic fuzzy positive and negative ideal (CIFNI) solution, respectively.
- Step 7: Determine the closeness coefficient values for the failure modes using Equation (11).
- Step 8: Rank the failure modes in descending order using the results obtained in Step 7.
3. Results and Discussion
Numerical Implementation of the Model
To illustrate the procedure for the implementation of the proposed approach for the determination of the reliability of the infrastructure assets of the rail system, a case with fifteen failure mode alternatives and four reliability criticality criteria has been presented. The failure mode alternatives that were obtained from the maintenance record within a rail system in Nigeria include faulty block joints (FB), broken and defective rails (BDR), and drainage–track substructure (DTS), all for the perway subsystem. Interlocking crossings (ICs), point-to-point machines (PPMs), track circuits (TCs), and on-track machines provide signals for the signaling subsystem. Substation power (SP), light barrier (LB), faulty cable and wires (FCW), and faulty push buttons (FPB) for the electrical subsystem. Loose actuator rods (LAR), actuator rods not disengaging from limit switches (ARD), door drive (DD), guard operating panel (GOP), and loose plugs (LP) for the mechanical subsystem. Are evaluated with respect to the following four criteria: failure frequency (FF), maintainability (MT), safety and environmental impact protection (SEP), and costs of maintenance (CM) reliability criticalities.
In implementing the PMCDM algorithm for the evaluation of the reliability of the railway infrastructure assets, a group of three experts, one from academia (with a Ph.D. in industrial engineering) and two from the railway industry (both of them are registered engineers in Nigeria), were carefully chosen to give their expert advice/opinions and to evaluate the failure mode alternatives with respect to the reliability criticality criteria. Results from the evaluation, which have been presented in Table 2, show the linguistic intuitionistic fuzzy decision matrix of the experts, which can furthermore be converted to the numerical matrix using the IVIFN as presented in Table 1 above.
Table 2.
The linguistic intuitionistic fuzzy decision matrix of the three experts.
With the linguistic intuitionistic fuzzy decision matrix of the experts and the converted numerical matrix in place, the individual expert’s opinions and evaluation are aggregated using the IVIIFDHM operator in Equation (4). Before the proper evaluation, the fuzzy failure rate and availability function of the railway infrastructure asset were calculated using Equations (6) and (8), respectively. In the context of accurate reliability data, for convenience, the parameters have been given the following fixed values: and . The results of the aggregation and computation are given in Table 3.
Table 3.
Aggregated individual experts’s opinions and evaluations.
Using the intuitionistic entropy originally proposed by Ye [35] and that has found application in the following literature [36,37], the weighted vectors of the reliability criteria are computed and then used for the construction of the weighted normalization matrix of the reliability criteria. This is followed by the determination of the maximum and minimum values from the weighted normalization matrix, which is used as the intuitionistic fuzzy positive and negative ideal solution, respectively. The results of the weighted vectors (CR), the weighted normalization matrix that is used for discrimination between different IVIFN, and the closeness coefficient have been presented in Table 4, as well as the ranking order of the failure modes.
Table 4.
The weighted normalization matrix of the reliability modes.
The result of the ranking order for the evaluation of the reliability of the infrastructure assets of the railway system shows that the failure modes ‘broken and defective rails (BDR)’ and ‘drainage–track substructure (DTS)’ have the most and least reliability and risk concerns. Hence, the failure mode Broken and defective rails should be monitored and inspected to avoid a total failure. With the ranking result, the study has been able to verify the feasibility and rationality of the proposed model used in the evaluation of the reliability of the infrastructure assets of a railway system.
Although the proposed model has been validated for its feasibility and rationality to address objectivity and flexibility issues in the results obtained, as well as to mitigate any potential biases in the evaluation process, a stability analysis was carried out using the failure rate and availability parameter values. This was achieved by changing the parameter values to observe their impact on the overall ranking results of the alternatives. In this paper, the stability of the failure rate and availability parameter values have been tested and studied using a sensitivity analysis. Details of the analysis have been presented in Table 5, where the values of the availability parameter have been varied. The results show that 4 out of the 15 alternatives are robust to the variations in the parameter values. Hence, these alternatives (failure modes) can be said to be relatively insensitive to changes in the evaluated parameters and are stable and highly reliable under different conditions. Decision-makers can prioritize their resources and efforts toward these alternatives. This also indicates that the model is relatively robust and is able to capture the essential dynamics within the failure modes accurately, most especially with the high number of alternatives that are sensitive to parameter variations. These results suggest that the behavior of the model is consistent and predictable.
Table 5.
Sensitivity analysis for the infrastructure assets of the railway system.
The following observations have been made in the application and management of the PMCDM model for the evaluation of reliability, and it offers the following advantages over traditional reliability assessment methods:
- The IVIFS allow for the representation of uncertainty inherent in railway infrastructure reliability assessment.
- The IVIFS-based MCDM model offers greater flexibility in handling multiple criteria and decision factors relevant to railway infrastructure reliability.
- The proactive nature of IVIFS-based MCDM models allows decision-makers to anticipate and mitigate potential reliability issues before they escalate.
- The model involves a complex mathematical computation; consultants, academics, or experts of some sort are identified as the most probable eventual end-users of the developed model, where they may become involved with companies to aid its usage.
- The model may be ideal for a company that wants to ensure flexibility, adjustability, and agility in the management of their product reliability and decision-making process.
4. Conclusions
Railway infrastructure, which can generally be classified into the following two assets: (1) fixed infrastructure assets, which include lines/rail tracks, bridges, sleepers, signaling systems, points, interlocking systems, electrical units, etc.; and (2) infrastructure assets that can move on the railway, like rolling stock. Failure in any of these assets, however, could lead to the complete shutdown of the entire system, a delay in traffic, and sometimes the total disruption of the entire system. It can cause a great deal of economic loss and inconvenience to both the passengers and the train operating company(s), and it can sometimes result in death or injury in the event of the derailment of the rolling stock.
Considering the importance of the issues raised, it is only necessary, therefore, to continuously explore the behavior of these railway infrastructures, their reliability, and their safety. In this paper, a proactive multi-criteria decision-making model that is based on an interval-valued intuitionistic fuzzy set and some reliability quantitative parameters has been proposed for the evaluation of the reliability of the infrastructure assets of the rail system. The proactive evaluation model is used for measuring and mitigating the risks associated with the failure of the railway mechanism and infrastructure components.
Results from the evaluation show that the failure modes ‘broken and defective rails (BDR)’ and ‘drainage–track substructure (DTS)’ have the most and least reliability concerns and risks. Hence, the failure mode Broken and defective rails should be monitored and inspected to avoid total failure and collapse of either system. While the research aims and objectives have been achieved in this study, a notable limitation has been observed regarding the suggestion for each of the invited experts to use only the IVIFN table. This recommendation stems from the fact that each expert might possess different parameters for the linguistic terms (M, I, S, and Ma). In the future, the authors intend to extend the knowledge gained during the evaluation process by developing a decision support program that could be stored in a versioned repository for future cooperation reliability decision-making based on the infrastructure assets evaluated. Also, the authors intend to implement the proposed model by addressing all subjectivity issues for the prioritization of maintenance actions, which is aimed at mitigating the risks due to the identified failure mode, ‘broken and defective rails’.
Author Contributions
Conceptualization, D.O.A. and S.S.; methodology, D.O.A.; formal analysis, D.O.A.; writing—original draft preparation D.O.A.; writing—review and editing, D.O.A. and S.S. All authors have read and agreed to the published version of the manuscript.
Funding
This research received no external funding.
Institutional Review Board Statement
Not applicable.
Informed Consent Statement
Informed consent was obtained from all subjects involved in the study.
Data Availability Statement
The data presented in this study are available on request from the corresponding author.
Conflicts of Interest
The authors declare no conflicts of interest.
References
- Oyefuga, B.; Egbetokun, A. Rebuilding Rail Infrastructure in Nigeria—Policy, Problems and Prospects. In Autumn Conference and Annual Meeting of the Korean Society for Railway; The Korean Society for Railway: Seoul, Republic of Korea, 2016; pp. 1–13. [Google Scholar]
- Wojuade, C.A. Potentials of Light Rail Transit in Nigeria. Int. J. Manag. Sci. Bus. Res. 2016, 5, 271–277. [Google Scholar]
- Agbaeze, E.K. Boosting Railway System Infrastructure in Nigeria: The Public-Private Partnership Option. J. Bus. Adm. Manag. Sci. Res. 2014, 3, 39–48. [Google Scholar]
- Ayoola, T.A. Establishment of the Nigerian Railway Corporation. J. Retracing Africa 2016, 3, 21–42. [Google Scholar]
- Ogochukwu, C.G.; Ogochukwu, O.F.; Ogorchukwu, I.M.; Ebuka, I.A. Assessment of the performance of railway transportation in Nigeria from 1970 to 2010. Sci. Afr. 2022, 15, e01120. [Google Scholar] [CrossRef]
- Yeh, C.T.; Lin, Y.K.; Yeng, L.C.L.; Huang, P.T. Reliability evaluation of a multistate railway transportation network from the perspective of a travel agent. Reliab. Eng. Syst. Saf. 2021, 214, 107757. [Google Scholar] [CrossRef]
- Garmabaki, A.H.S.; Marklund, S.; Thaduri, A.; Hedström, A.; Kumar, U. Underground pipelines and railway infrastructure–failure consequences and restrictions. Struct. Infrastruct. Eng. 2020, 16, 412–430. [Google Scholar] [CrossRef]
- Yu, Z.; Lei, N.; Mo, Y.; Xu, X.; Li, X.; Huang, B. Feature Extraction Based on Self-Supervised Learning for Remaining Useful Life Prediction. J. Comput. Inf. Sci. Eng. 2024, 24, 021004. [Google Scholar] [CrossRef]
- Song, Z.; Hackl, C.M.; Anand, A.; Thommessen, A.; Petzschmann, J.; Kamel, O.; Braunbehrens, R.; Kaifel, A.; Roos, C.; Hauptmann, S. Digital Twins for the Future Power System: An Overview and a Future Perspective. Sustainability 2023, 15, 5259. [Google Scholar] [CrossRef]
- Sresakoolchai, J.; Kaewunruen, S. Railway infrastructure maintenance efficiency improvement using deep reinforcement learning integrated with digital twin based on track geometry and component defects. Sci. Rep. 2023, 13, 2439. [Google Scholar] [CrossRef]
- He, Y.; Zhang, Y.; Yao, Y.; He, Y.; Sheng, X. Review on the Prediction and Control of Structural Vibration and Noise in Buildings Caused by Rail Transit. Buildings 2023, 13, 2310. [Google Scholar] [CrossRef]
- Zhang, C.; Kordestani, H.; Shadabfar, M. A combined review of vibration control strategies for high-speed trains and railway infrastructures: Challenges and solutions. J. Low Freq. Noise Vib. Act. Control 2023, 42, 272–291. [Google Scholar] [CrossRef]
- Zhu, Z.; Feng, Y.; Yang, X.; Li, H.; Zou, Y. An efficient parallel computing method for random vibration analysis of a three-dimensional train-track-soil coupled model using Seed-PCG algorithm. J. Cent. South Univ. 2024, 31, 302–316. [Google Scholar] [CrossRef]
- Zoeteman, A. Life cycle cost analysis for managing rail infrastructure. Eur. J. Transp. Infrastruct. Res. 2001, 1, 391–413. [Google Scholar] [CrossRef]
- Kefalidou, G.; Golightly, D.; Sharples, S. Identifying rail asset maintenance processes: A human-centric and sensemaking approach. Cogn. Technol. Work 2018, 20, 73–92. [Google Scholar] [CrossRef]
- Dinmohammadi, F.; Alkali, B.; Shafiee, M. Risk Evaluation of Railway Rolling Stock Failures Using FMECA Technique: A Case Study of Passenger Door System. Urban Rail Transit 2016, 2, 128–145. [Google Scholar] [CrossRef]
- Al-Douri, Y.K.; Tretten, P.; Karim, R. Improvement of railway performance: A study of Swedish railway infrastructure. J. Mod. Transp. 2016, 24, 22–37. [Google Scholar] [CrossRef]
- Dindar, S.; Kaewunruen, S.; An, M.; Gigante-Barrera, A. Derailment-based Fault Tree Analysis on Risk Management of Railway Turnout Systems. IOP Conf. Ser. Mater. Sci. Eng. 2017, 245, 1–8. [Google Scholar] [CrossRef]
- Jafarian, E.; Rezvani, M.A. Application of fuzzy fault tree analysis for evaluation of railway safety risks: An evaluation of root causes for passenger train derailment. Proc. Inst. Mech. Eng. Part F J. Rail Rapid Transit 2012, 226, 14–25. [Google Scholar] [CrossRef]
- Khalid, N.I.M.; Najdi, N.F.N.; Adlee, N.F.K.; Misiran, M.; Sapiri, H. Assessing railway accident risk through event tree analysis. AIP Conf. Proc. 2019, 2138, 0300231–0300238. [Google Scholar] [CrossRef]
- Quiroga, L.M.; Schnieder, E. Monte Carlo simulation of railway track geometry deterioration and restoration. Proc. Inst. Mech. Eng. Part O J. Risk Reliab. 2012, 226, 274–282. [Google Scholar] [CrossRef]
- Che Hassan, C.R.; Puvaneswaran, B.; Aziz, A.R.; Noor Zalina, M.; Hung, F.C.; Sulaiman, N.M. Quantitative risk assessment for the transport of ammonia by rail. Process Saf. Prog. 2010, 29, 60–63. [Google Scholar] [CrossRef]
- Chen, Y. Improving Railway Safety Risk Assessment Study. Ph.D. Dissertation, University of Birmingham, Birmingham, UK, 2012. [Google Scholar]
- Shang, H. Maintenance Modelling, Simulation and Performance Assessment for Railway Asset Management. Ph.D. Dissertation, Université de Technologie de Troyes, Troyes, France, 2015. [Google Scholar]
- Ye, J. Multicriteria fuzzy decision-making method based on a novel accuracy function under interval-valued intuitionistic fuzzy environment. Expert Syst. Appl. 2009, 36, 6899–6902. [Google Scholar] [CrossRef]
- Atanassov, K.T. Intuitionistic fuzzy sets. Fuzzy Sets Syst. 1986, 20, 87–96. [Google Scholar] [CrossRef]
- Wu, L.; Wei, G.; Wu, J. Some Interval-Valued Intuitionistic Fuzzy Dombi Heronian Mean Operators and their Application for Evaluating the Ecological Value of Forest Ecological Tourism Demonstration Areas. Int. J. Environ. Res. Public Health 2020, 17, 829. [Google Scholar] [CrossRef] [PubMed]
- Finkelstein, M. Introduction. In Failure Rate Modelling for Reliability and Risk; Springer Science & Business Media: Berlin/Heidelberg, Germany, 2008; pp. 1–84. [Google Scholar]
- Goble, W.M.; van Beurden, I. Combining field failure data with new instrument design margins to predict failure rates for SIS Verification. In Proceedings of the 2014 International Symposium—Beyond Regulatory Compliance, Making Safety Second Nature, Hilton College Station-Conference Center, College Station, TX, USA, 28–30 October 2014; pp. 1–15. [Google Scholar]
- Aikhuele, D.O. A Study of product development engineering and design reliability concerns. Int. J. Appl. Ind. Eng. 2018, 5, 79–89. [Google Scholar] [CrossRef]
- Aikhuele, D.O.; Turan, F.M. Need for reliability assessment of parent product before redesigning a new product. Curr. Sci. 2017, 112, 10–11. [Google Scholar]
- Mettas, A. Design for Reliability: Overview of the Process and Applicable Techniques. Int. J. Perform. Eng. 2010, 6, 577–586. [Google Scholar]
- Garg, H.; Sharma, S.P.; Rani, M. Weibull fuzzy probability distribution for analyzing the behaviour of pulping unit in a paper industry. Int. J. Ind. Syst. Eng. 2013, 14, 395–413. [Google Scholar] [CrossRef]
- Garg, H.; Rani, M.; Sharma, S.P. Reliability analysis of the engineering systems using intuitionistic fuzzy set theory. J. Qual. Reliab. Eng. 2013, 2013, 943972. [Google Scholar] [CrossRef]
- Ye, J. Multicriteria fuzzy decision-making method using entropy weights-based correlation coefficients of interval-valued intuitionistic fuzzy sets. Appl. Math. Model. 2010, 34, 3864–3870. [Google Scholar] [CrossRef]
- Aikhuele, D.O. A hybrid-fuzzy model with reliability-based criteria for selecting consumables used in welding dissimilar aluminum alloys joint. Eng. Appl. Sci. Res. 2019, 46, 79–85. [Google Scholar] [CrossRef]
- Aikhuele, D.O. Intuitionistic fuzzy hamming distance model for failure detection in a slewing gear system. Int. J. Syst. Assur. Eng. Manag. 2021, 12, 884–894. [Google Scholar] [CrossRef]
Disclaimer/Publisher’s Note: The statements, opinions and data contained in all publications are solely those of the individual author(s) and contributor(s) and not of MDPI and/or the editor(s). MDPI and/or the editor(s) disclaim responsibility for any injury to people or property resulting from any ideas, methods, instructions or products referred to in the content. |
© 2024 by the authors. Licensee MDPI, Basel, Switzerland. This article is an open access article distributed under the terms and conditions of the Creative Commons Attribution (CC BY) license (https://creativecommons.org/licenses/by/4.0/).