Article

Early Parkinson’s Disease Diagnosis through Hand-Drawn Spiral and Wave Analysis Using Deep Learning Techniques

1
School of Computer Science, Faculty of Engineering and Information Technology, University of Technology Sydney, Sydney, NSW 2007, Australia
2
Department of Computer Engineering, Chulalongkorn University, Bangkok 10330, Thailand
*
Author to whom correspondence should be addressed.
Information 2024, 15(4), 220; https://doi.org/10.3390/info15040220
Submission received: 1 March 2024 / Revised: 12 April 2024 / Accepted: 12 April 2024 / Published: 13 April 2024
(This article belongs to the Special Issue Editorial Board Members’ Collection Series: "Information Processes")

Abstract

:
Parkinson’s disease (PD) is a chronic brain disorder affecting millions worldwide. It occurs when brain cells that produce dopamine, a chemical controlling movement, die or become damaged. This leads to PD, which causes problems with movement, balance, and posture. Early detection is crucial to slow its progression and improve the quality of life for PD patients. This paper proposes a handwriting-based prediction approach combining a cosine annealing scheduler with deep transfer learning. It utilizes the NIATS dataset, which contains handwriting samples from individuals with and without PD, to evaluate six different models: VGG16, VGG19, ResNet18, ResNet50, ResNet101, and Vit. This paper compares the performance of these models based on three metrics: accuracy, precision, and F1 score. The results showed that the VGG19 model, combined with the proposed method, achieved the highest average accuracy of 96.67%.

1. Introduction

Parkinson’s disease (PD) is a progressive and incapacitating neurodegenerative disorder that primarily affects motor function, with symptoms often presenting subtly and intensifying over time [1]. The disease is characterized by diverse motor symptoms such as tremors, slow movement, and rigidity, as well as non-motor symptoms, including cognitive impairment and sleep disturbances [2]. It mainly affects people over 65, but it has come on earlier in recent years. The rates of disability and death from it are increasing much faster than any other neurological disorder globally. More than 10 million people worldwide are living with the disease in 2024. Particularly in Australia, the rates of Parkinson’s disease patients are more severe. One in every three hundred and eight Australians has the disease, and there are approximately 37 new cases every single day [3]. Early detection may enable the timely initiation of symptom management therapies, ultimately slowing disease progression, enhancing the quality of life, and extending the life expectancy of affected individuals [4].
Parkinson’s disease is a neurological disorder that is progressive and is marked by five different stages. Stage 1 is mild symptoms with tremors and movement issues on only one side of the body; stage 2 is a bit worse, with both tremors and rigidity affecting both sides. Patients in stage 3 will lose balance and movements with frequent falls. In stage 4 and stage 5, they cannot live alone and likely find it impossible to walk or stand. The traditional diagnosis of the disease is usually based on an assessment of clinical signs. The Unified Parkinson’s Disease Rating Scale (UPDRS) is one of the most widely used clinical rating scales, which includes the manifestation of a patient’s various motor symptoms like facial expression, writing, walking, speaking, and drawing. However, this approach to diagnosis is prone to misclassification, as the non-motor symptoms in the early stages of PD are very mild, and motor assessment relying only on human observation is challenging. With the passage of time and the continued development of technology and techniques, the advent of artificial intelligence (AI) has presented novel opportunities for healthcare, particularly in the field of disease diagnosis and management. Leveraging the power of AI could prove transformative in enhancing early detection and addressing current diagnostic shortcomings. Researchers and doctors have been working for the past few years to identify the disease correctly and promptly, for example, by using machine learning models to analyze patients’ magnetic resonance imaging (MRI) and positron emission tomography (PET) results to complete the diagnosis.
Several research studies have been conducted regarding using artificial intelligence in medicine and healthcare [5,6,7,8]. Recently, more and more academic researchers are attempting to use different deep learning algorithms in the classification tasks of detecting Parkinson’s [9,10,11,12]. Haller et al. [13] presented a system that can help detect PD using magnetic resonance images (MRI) because it is a neurodegenerative disease that probably affects brain regions. A result of up to 97% accuracy at the individual level is achieved using a support vector machine (SVM) analysis of a diffusion tensor image (DTI). There are some studies that have used deep transfer learning in the analysis of DaTscan in the last three years, where DaTScan is injected into the blood and, using special imaging equipment, scans the head for detection [14]. DatScan imaging can also be used to diagnose PD, even when patients are in a very early stage with less common parkinsonism clinical presentations [15]. The diagnoses of Parkinson’s using DatScan and clinical exams are similarly accurate. These methods are commonly applied to diagnosis in hospitals and clinics.
Zham et al. [16] point out that the speed and pen pressure while using a pen to draw patterns for PD patients are relatively low. Pereira et al. [17] introduced a method using a smart pen with different sensors to extract visual and signal-based information from healthy and PD patients. They invited them to complete a handwriting clinical exam; the information collected from the exam is their dataset, with a result of 78.9% accuracy using the Naïve Bayes (NB) classifier.
Basnin et al. [18] presented their methods using deep transfer learning with 91.36% testing accuracy. In their study, the dataset used was only hand-drawn spiral images, with 800 images. Das et al. [19] explore an advanced method for detecting Parkinson’s disease through hand-drawn images by patients, leveraging a fusion of discrete wavelet transform coefficients and histograms of oriented gradient features for improved accuracy. They demonstrated the superiority of combining these techniques in extracting relevant information and identifying crucial coefficients, achieving higher accuracy in disease detection through machine learning methods, particularly noting the effectiveness of random forest and support vector machine classifiers with spiral pattern images.
Based on the previous findings, although the diagnostic accuracy is relatively high and stable, such a diagnostic strategy is time-consuming and costly. People with PD suffer from changes in neuronal mechanisms that make it difficult to control body movements and motor skills. Researchers have found it easier to identify PD by analyzing handwriting or hand drawings [20]. Shaban [21] argues for using a fine-tuned VGG-19 model for diagnosis based on spiral and wave handwriting patterns. The dataset used is small and contains 102 wave and 102 spiral images. Data augmentation, like image rotation augmentation, was used to minimize model overfitting. The CNN model achieved a high accuracy of 88% and 89% for the wave and spiral images after applying 10-fold cross-validation.
This paper employs deep transfer learning for the early diagnosis of PD. Six deep learning models, namely VGG16, VGG19, ResNet18, ResNet50, ResNet101, and Vit, are used on hand-drawn datasets to classify the disease. The dataset used consists of hand-drawn spiral images and hand-drawn wave images. The data size is increased using AugMix and PixMix augmentation techniques to improve the models’ performance, accuracy, and generalization. Moreover, a cosine annealing scheduler is used to enhance the learning process of the models, especially for image classification tasks.
The paper has been organized accordingly: Section 2 describes the methodology used in the paper, including different deep learning techniques. Section 3 presents the results and discussion using the dataset with the proposed methodology. Finally, Section 4 shows the conclusions and future work discussions.

2. Methodology

Figure 1 provides an overview of the experimental methodology. Initially, it is essential to note that data about PD patients are typically limited due to confidentiality concerns. Consequently, the dataset utilized in this paper, sourced from Kaggle, is relatively small, comprising only 102 wave and 102 spiral pattern images. To mitigate this, pretrained deep learning models are employed to mitigate the risk of model overfitting.
The experiments are divided into two distinct branches. The first branch serves as the control group and does not incorporate data augmentation techniques, while the second branch leverages three different forms of data augmentation. Subsequently, the workflow involves configuring model parameters and implementing a cosine annealing scheduler. This scheduler facilitates fine-tuning network weights and expedites convergence toward the optimal solution by dynamically adjusting the learning rate. The ultimate output of the process is a binary classification, where “0” signifies a healthy condition and “1” indicates the presence of PD.

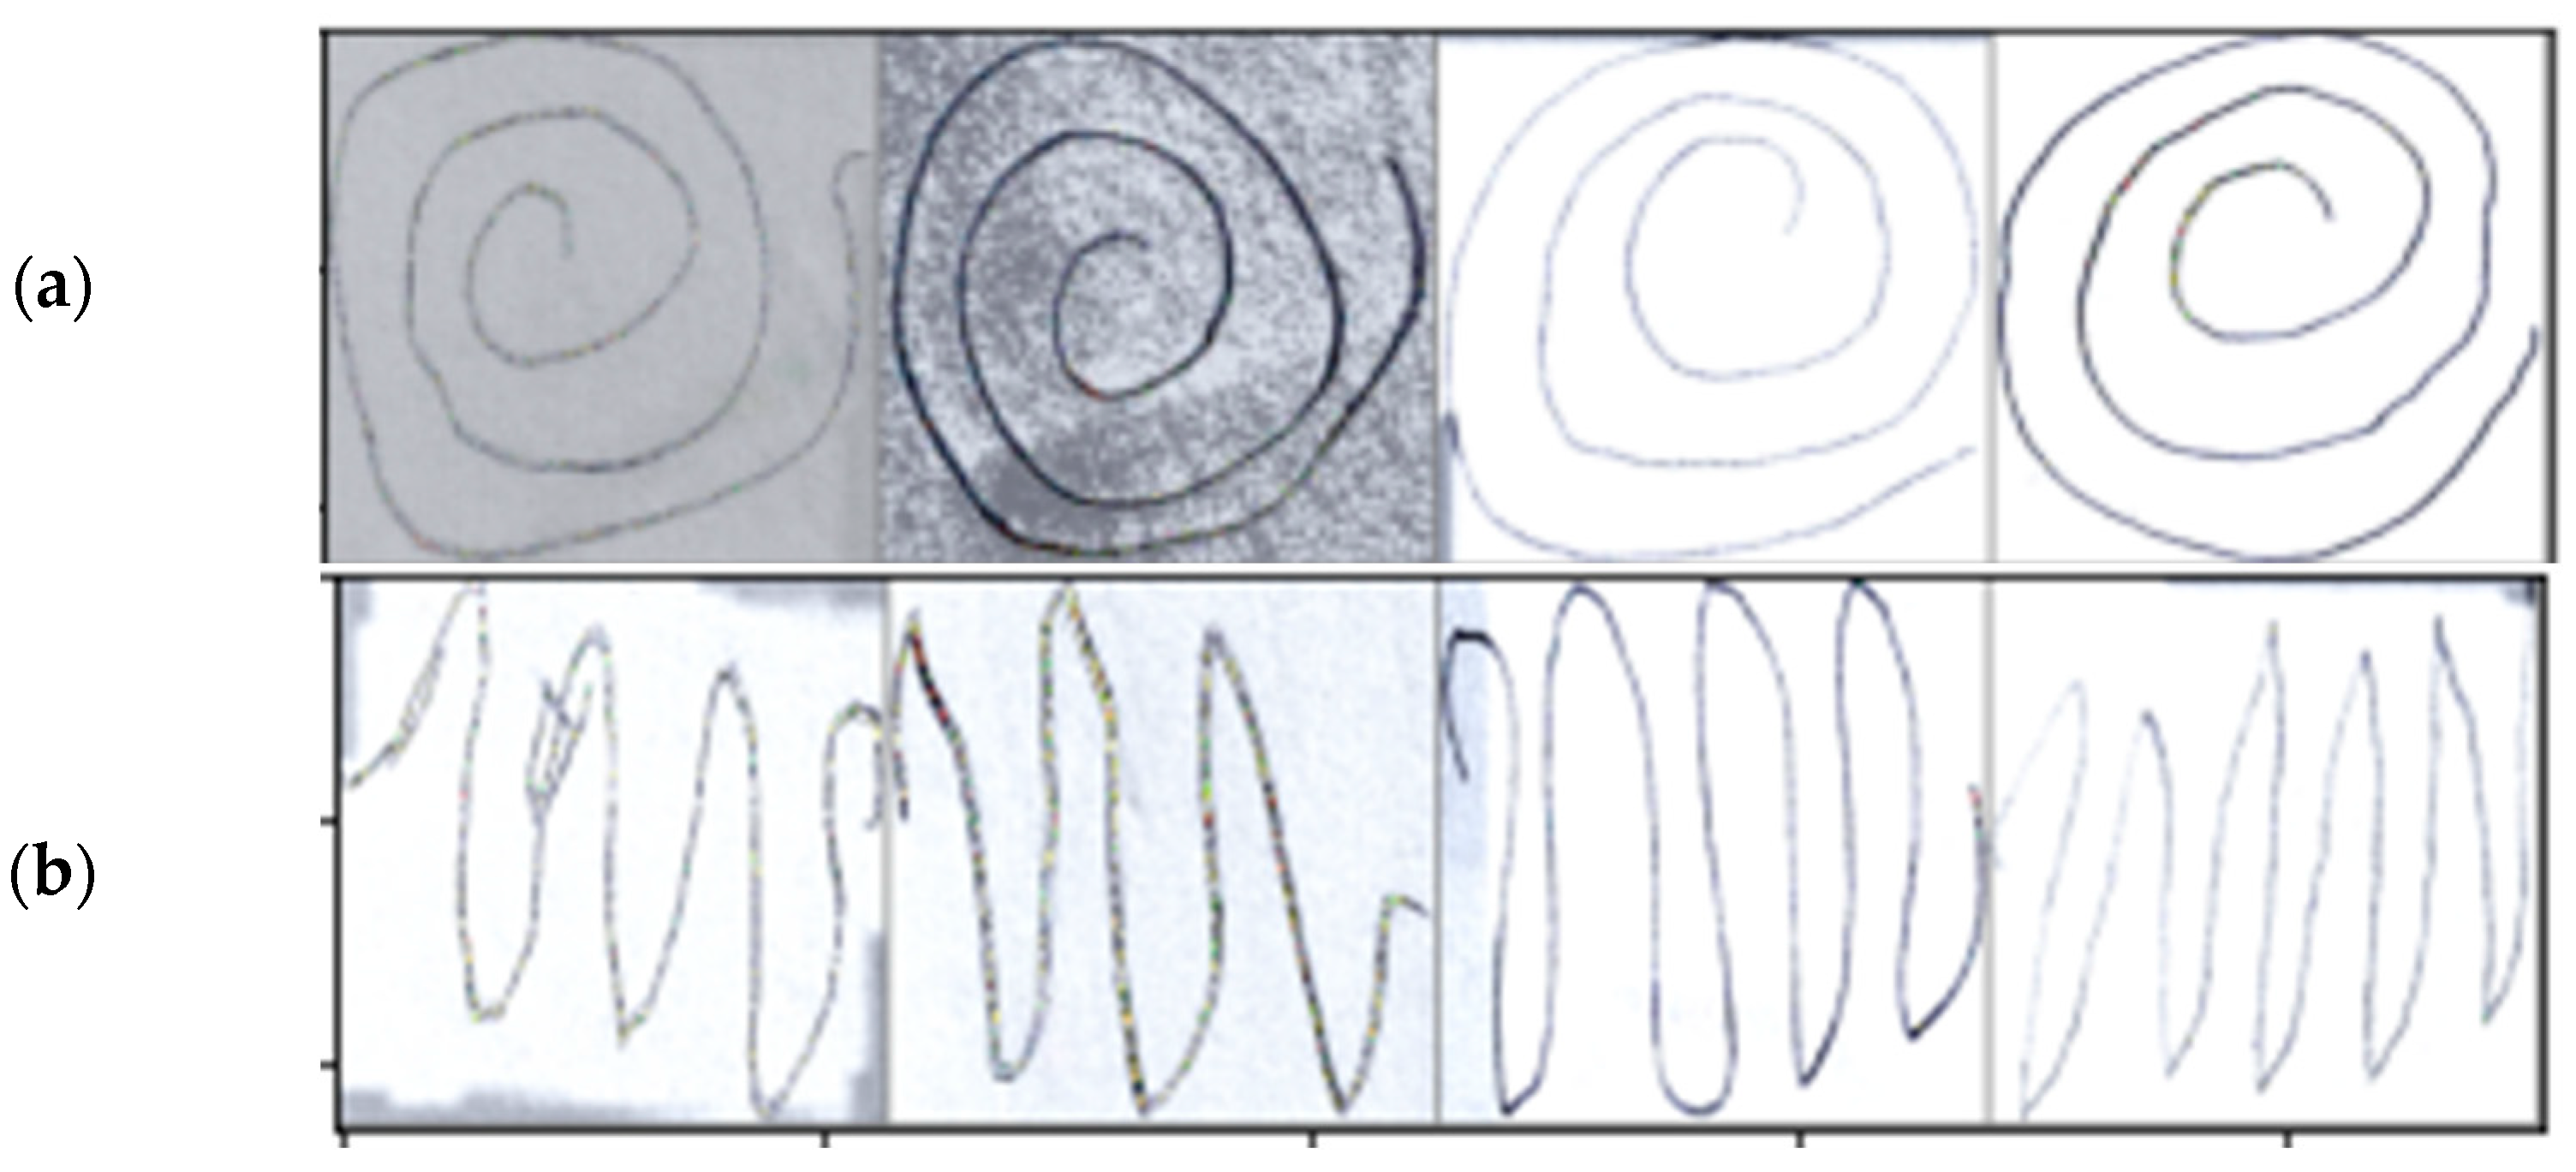
2.1. Dataset Preprocessing

This study used a dataset of hand drawings from healthy individuals and Parkinson’s patients curated by Adriano de Olivera Andrade and Joao Paulo Folado from the NIATS of the Federal University of Uberlândia. Their data are collected from 12 healthy individuals and 15 patients with PD. Each participant drew between three and four sine waves and a spiral drawing. The dataset includes two types of patterns: spiral and wave. Both patterns’ training and testing sets had 72 and 30 images, respectively. The dataset is shown in Figure 2.
Before the analysis, the dataset was split into training and test sets. All the handwriting samples were used in all six models, which was a random selection. In the preprocessing phase, the dataset images underwent sequential transformations through the application of the compose function provided by PyTorch. The transformations were as follows: First, the images were resized to 224 × 224 pixels, a standard input size for deep learning algorithms like CNNs. Then, the images were normalized by setting each channel’s mean and standard deviation to 0.5, which usually helped improve the stability and convergence of training.

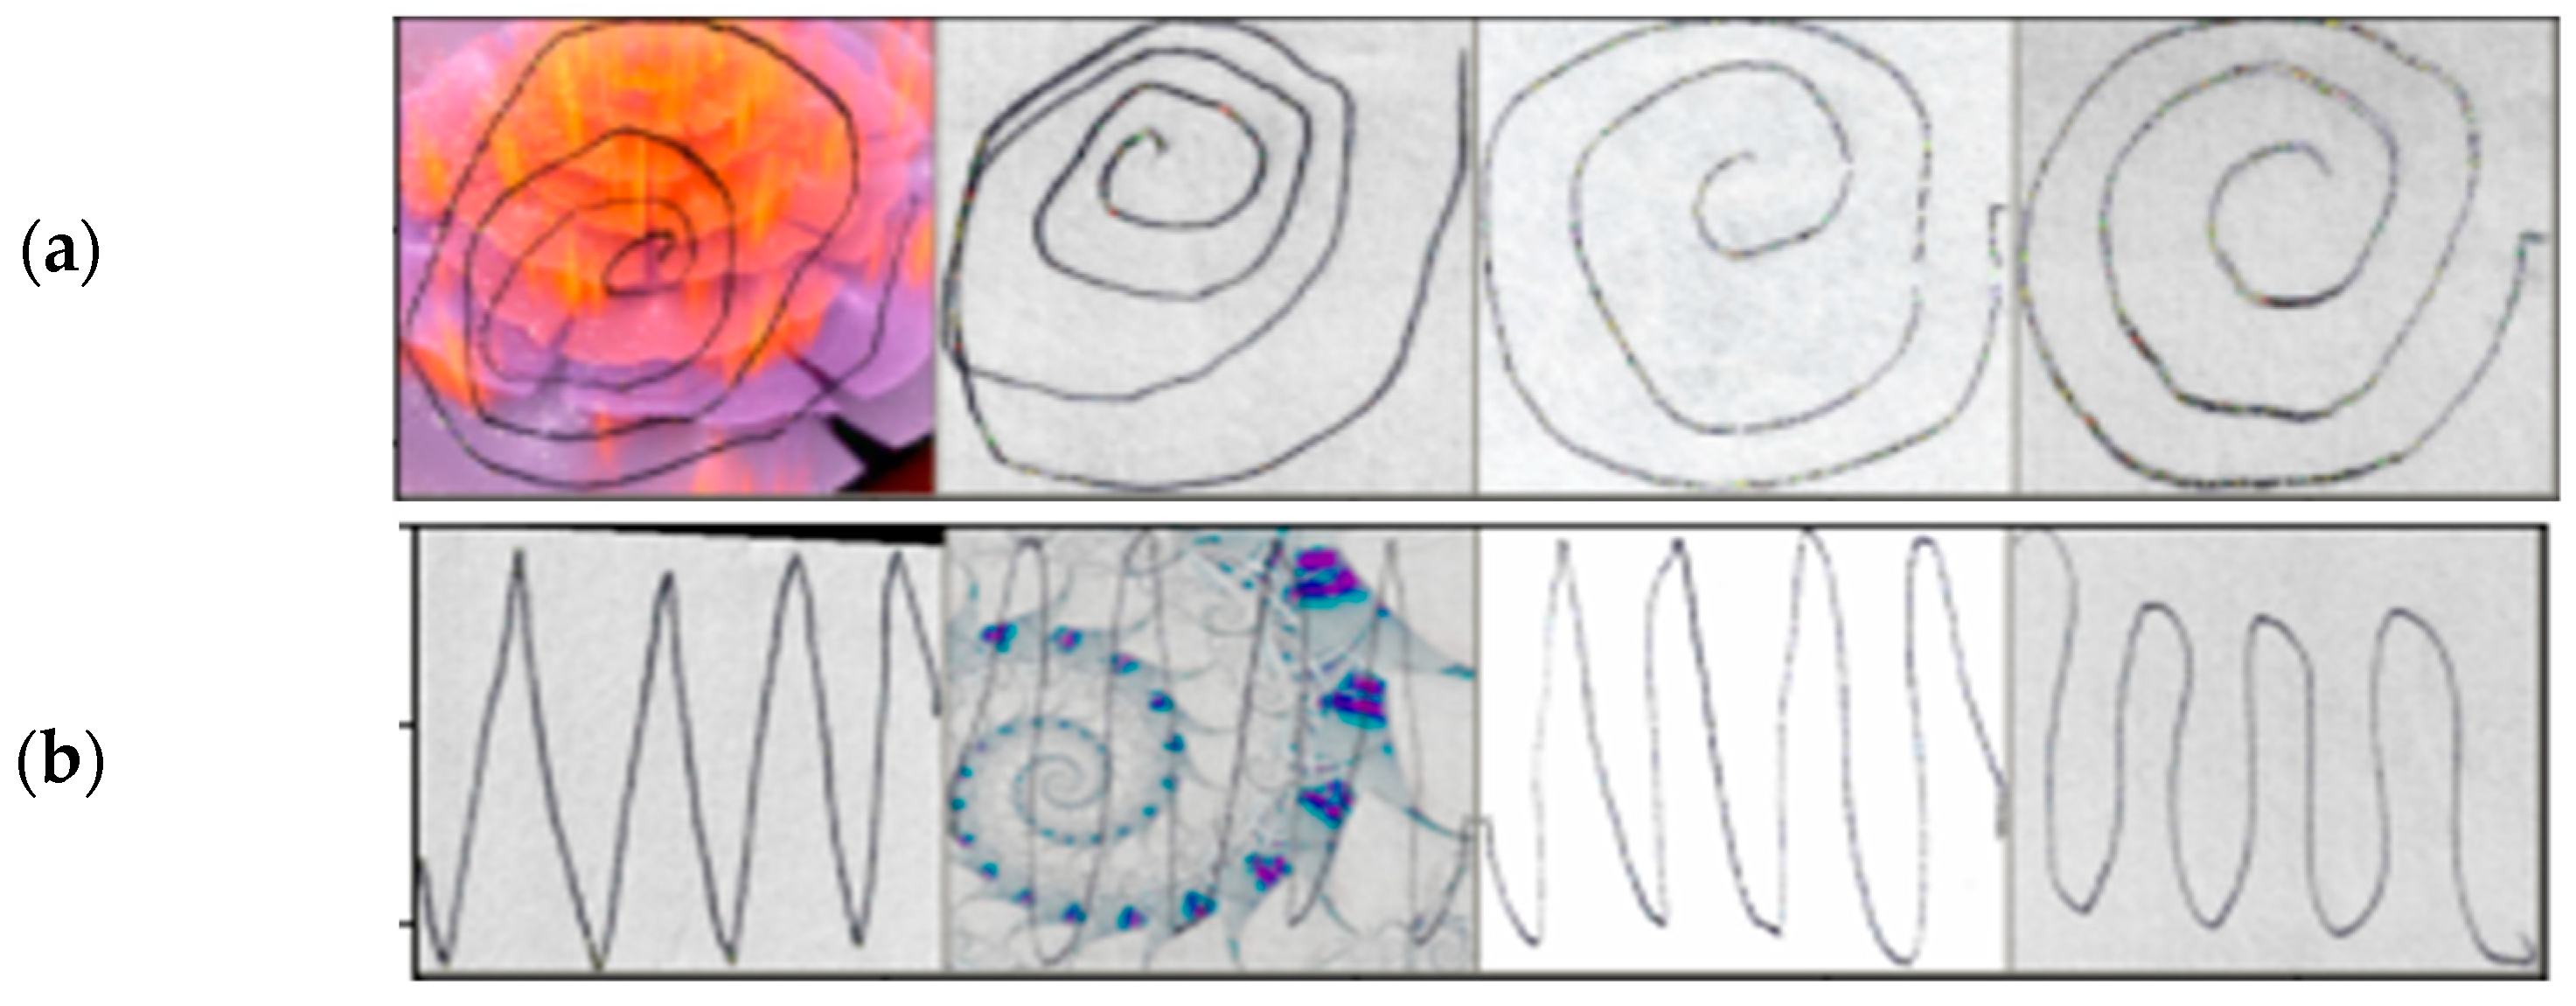
2.2. Data Augmentation

Data augmentation is a technique to increase the diversity of training datasets by introducing transformed versions of existing instances to avoid overfitting. It has been recognized as a practical approach to enhance the performance and generalization of machine learning models. In this study, we performed fundamental geometric transformations, like flipping and rotation, and complex manipulations, such as color jittering, cropping, and synthetic image generation, using Generative Adversarial Networks (GANs). These techniques increase the model’s robustness to variations in the input data and also help to mitigate overfitting by artificially increasing the size of the training dataset. The following augmentations are used in the paper.
First, the images were randomly flipped horizontally with a 0.5 probability to increase the dataset’s diversity. Next, the images were randomly rotated by an angle within a specified range, another augmentation technique.
Also, the AugMix algorithm generated augmented versions of the input images by applying random transformations to each input image. Each augmented version of an image was then preprocessed (e.g., normalized) and added to a ‘mixture’ image, which was a weighted sum of the preprocessed augmented images. The weights for this sum (ws) were drawn from a Dirichlet distribution. AugMix is a new way of augmenting data to make machine learning models more robust and reliable. It was proposed by Hendrycks et al. [22] to mix different augmentations on a single input and combine them probabilistically. The goal is to create more varied and realistic samples that enhance the performance and robustness of the model.
The final augmented image is a convex combination of the original preprocessed image and the mixture image, where the mixing coefficient (m) was drawn from a beta distribution. The depth of the augmentation (i.e., the number of transformations applied in sequence to each input image) was either fixed (if mixture_depth > 0) or drawn randomly from {1, 2, 3}. The severity of the augmentation (i.e., the intensity of the transformations) was controlled. Figure 3 presents some samples using the AugMix augmentation.
Similarly, the PixMix augmentation method was applied to the dataset. PixMix [23] is an effective data augmentation technique because it combines the advantages of both mixing-based and transformation-based methods, leading to enhanced diversity in the training data, which can improve the model’s robustness and generalization ability.
In the PixMix function, the original image and an image for mixing were taken as input. A series of augmentations and mixing operations were performed on these images. A mixing operation was randomly selected from the mixings and applied to the mixed image, followed by an augmented version of the original or mixing image. The mixing intensity was controlled by beta, and the operation was repeated a random number of times (up to k, where k is set to four). The result was clipped to the range [0, 1] to ensure that it was a valid image. If the flag was incremented, the original image had been augmented before being mixed. Some samples using the PixMix augmentation are demonstrated in Figure 4.

Cosine Annealing Schedule

Cosine annealing schedulers, an effective learning rate scheduler, play an instrumental role in enhancing the performance of machine learning models, especially in image classification. Loshchilov and Hutter [24] argue that the learning rate is regulated based on the cosine function, thereby helping a model converge optimally and preventing overfitting.
In the proposed study, the cosine annealing scheduler initiates with a high learning rate, which is progressively diminished in accordance with a cosine curve until it attains a predetermined minimum. Subsequently, the learning rate is increased again to a higher value. This cycle is iteratively repeated to ensure that the model explores various local minima within the error landscape. The learning rate for cosine annealing for each batch within i t h runs is shown below, where η m i n i and η m a x i define the ranges for the learning rate and T c u r is the number of epochs that were performed.
η t = η m i n i + 1 2 η m a x i η m i n i × 1 + cos T c u r T i π
This approach has shown effectiveness when used in conjunction with data augmentation techniques. The cosine annealing scheduler is combined with the cyclic augmentation technique in automatic speech recognition (ASR). It is revealed that this combination enables the model to perform robust learning by providing various augmented data, thereby improving the overall ASR system performance.

2.3. Deep Learning Models

After augmentation, six deep transfer learning models were used to analyze the datasets, which are Resnet18, ResNet50, ResNet101, VGG16, VGG19, and ViT_base_patch16_224.

2.3.1. Residual Network (ResNet)

The Residual Network, commonly referred to as ResNet, represents a groundbreaking development in deep learning, specifically engineered to facilitate the training of significantly deeper neural networks [25]. The ResNet18 model consists of four distinct components: the initial convolution, residual blocks, global pooling, and the fully connected layer. A hallmark feature of ResNet lies in its introduction of residual blocks or skip connections. These innovative elements enable the direct propagation of gradients to earlier layers, effectively mitigating the vanishing gradient predicament. Rather than striving to learn an absolute mapping from inputs to outputs, ResNet’s layers focus on acquiring the residual, i.e., the disparity between the input and output of a sequence of layers. Each fundamental block within ResNet comprises two sets of c‘onv2d,’ B‘atchNorm2d,’ and R‘eLu’ layers. This transformative advancement has empowered the successful training of networks exceeding one hundred layers, leading to significant performance enhancements across diverse machine learning tasks.
The architecture of ResNet offers various versions, including ResNet18, ResNet50, and ResNet101, each differentiated by its network depth. Among these, ResNet18 stands out as the shallowest, with 18 layers, rendering it the fastest option in the lineup. It is often preferred when computational resources or time constraints are present, yet there is a need for relatively high performance. ResNet18 has demonstrated remarkable performance in this research and delivered outstanding accuracy while minimizing time overhead.

2.3.2. Convolutional Neural Networks (CNNs)

A Convolutional Neural Network (CNN) [26] is a deep learning model renowned for its exceptional performance in handling various image recognition and computer vision tasks. Its architectural elegance, characterized by the use of small (3 × 3) convolution filters and deep layers, sets a groundbreaking standard within the deep learning community, emphasizing the pivotal role of network depth in enhancing performance. VGGNet, a prominent CNN architecture, comprises three main components: convolutional layers, pre-logits, and classification layers.
Convolutional layers constitute a critical component of VGGNet, featuring a series of convolutional layers followed by ReLu activation functions and max-pooling layers. This design effectively reduces the spatial dimensions of the feature maps while enhancing depth, aiding in feature extraction. In the pre-logits section, fully connected layers generate features or activations, which are subsequently transformed into logits before reaching the SoftMax layers. The classification layer, the network’s final segment, produces class scores. It encompasses global pooling, dropout, a fully connected layer, and a flattening identity layer.
Furthermore, this study also incorporates the VGG19 model, which boasts more convolutional layers than VGG16. VGG19 includes additional convolutional layers, allowing the network to discern more intricate and nuanced features from the input images. However, this augmentation also escalates the model’s parameter count, translating to lengthier training times and an elevated risk of overfitting.

2.3.3. Vision Transformers (ViTs)

The ViT_base_patch16_224 model represents a notable variant within the ViT (vision transformer) family that has garnered substantial attention. In this configuration, the input image undergoes segmentation into 16 × 16 patches, forming a sequence employed as input for the transformer. This approach enables the model to discern and learn relationships between distinct patches, distinguishing itself from the localized focus of CNNs (convolutional neural networks) [27]. The model’s operation involves dividing the input image into small patches (in this instance, 16 × 16), linearly projecting each patch into a corresponding embedding, and subsequently feeding these embeddings into the transformer architecture.
The ViT_base_patch16_224 model in this study comprises several key components: PatchEmbed, a dropout layer, blocks, layer normalization, and the head. PatchEmbed is the initial embedding layer responsible for partitioning the input image into fixed-sized patches and linearly embedding them. Subsequently, dropout layers are applied after introducing positional embeddings to the patch embeddings. The block section plays a vital role in this vision transformer network. Each block includes a normalization layer, an attention mechanism, and an Mlp (multi-layer perceptron). Following this, layer normalization is applied to the output of the last transformer block. In summary, this model architecture involves dividing input images into patches, embedding them, processing them through a series of transformer blocks, and ultimately utilizing the transformer’s output for classification.
In medical image analysis, the ViT_base_patch16_224 model exhibits promising applications. Given a sufficiently extensive dataset comprising pertinent medical images, such as brain MRIs of individuals with PD, the model could undergo fine-tuning to identify disease-indicative patterns. This potential application could facilitate early detection and diagnosis, as outlined by Mei et al. [28].

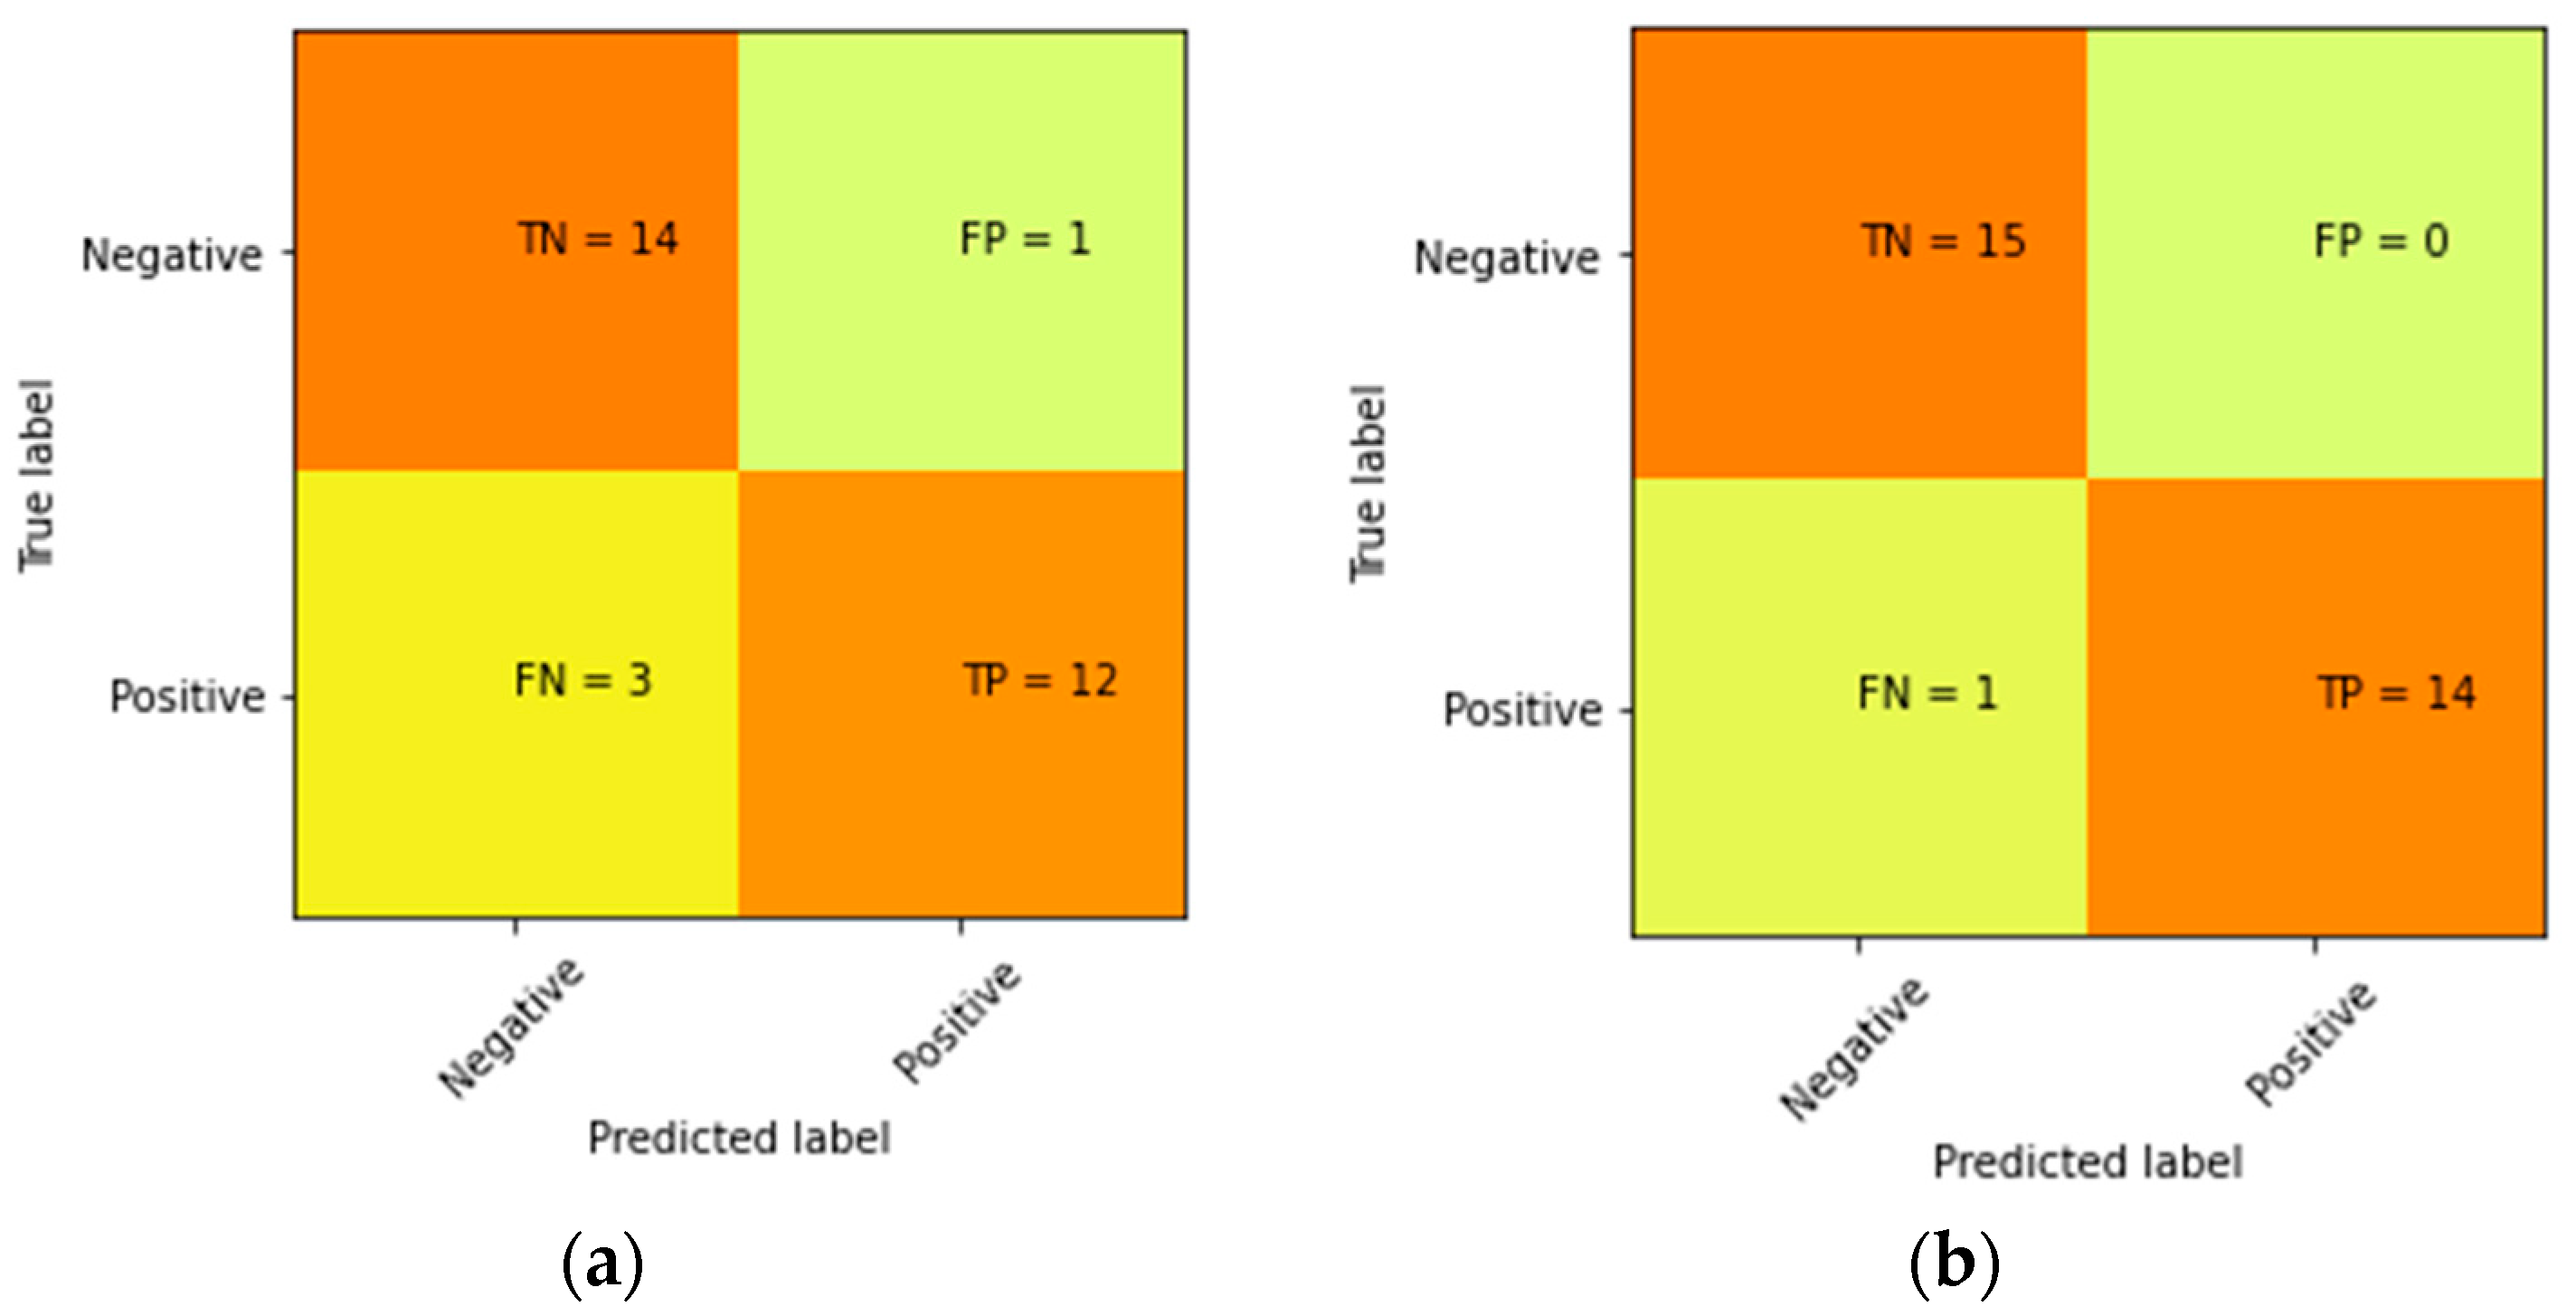
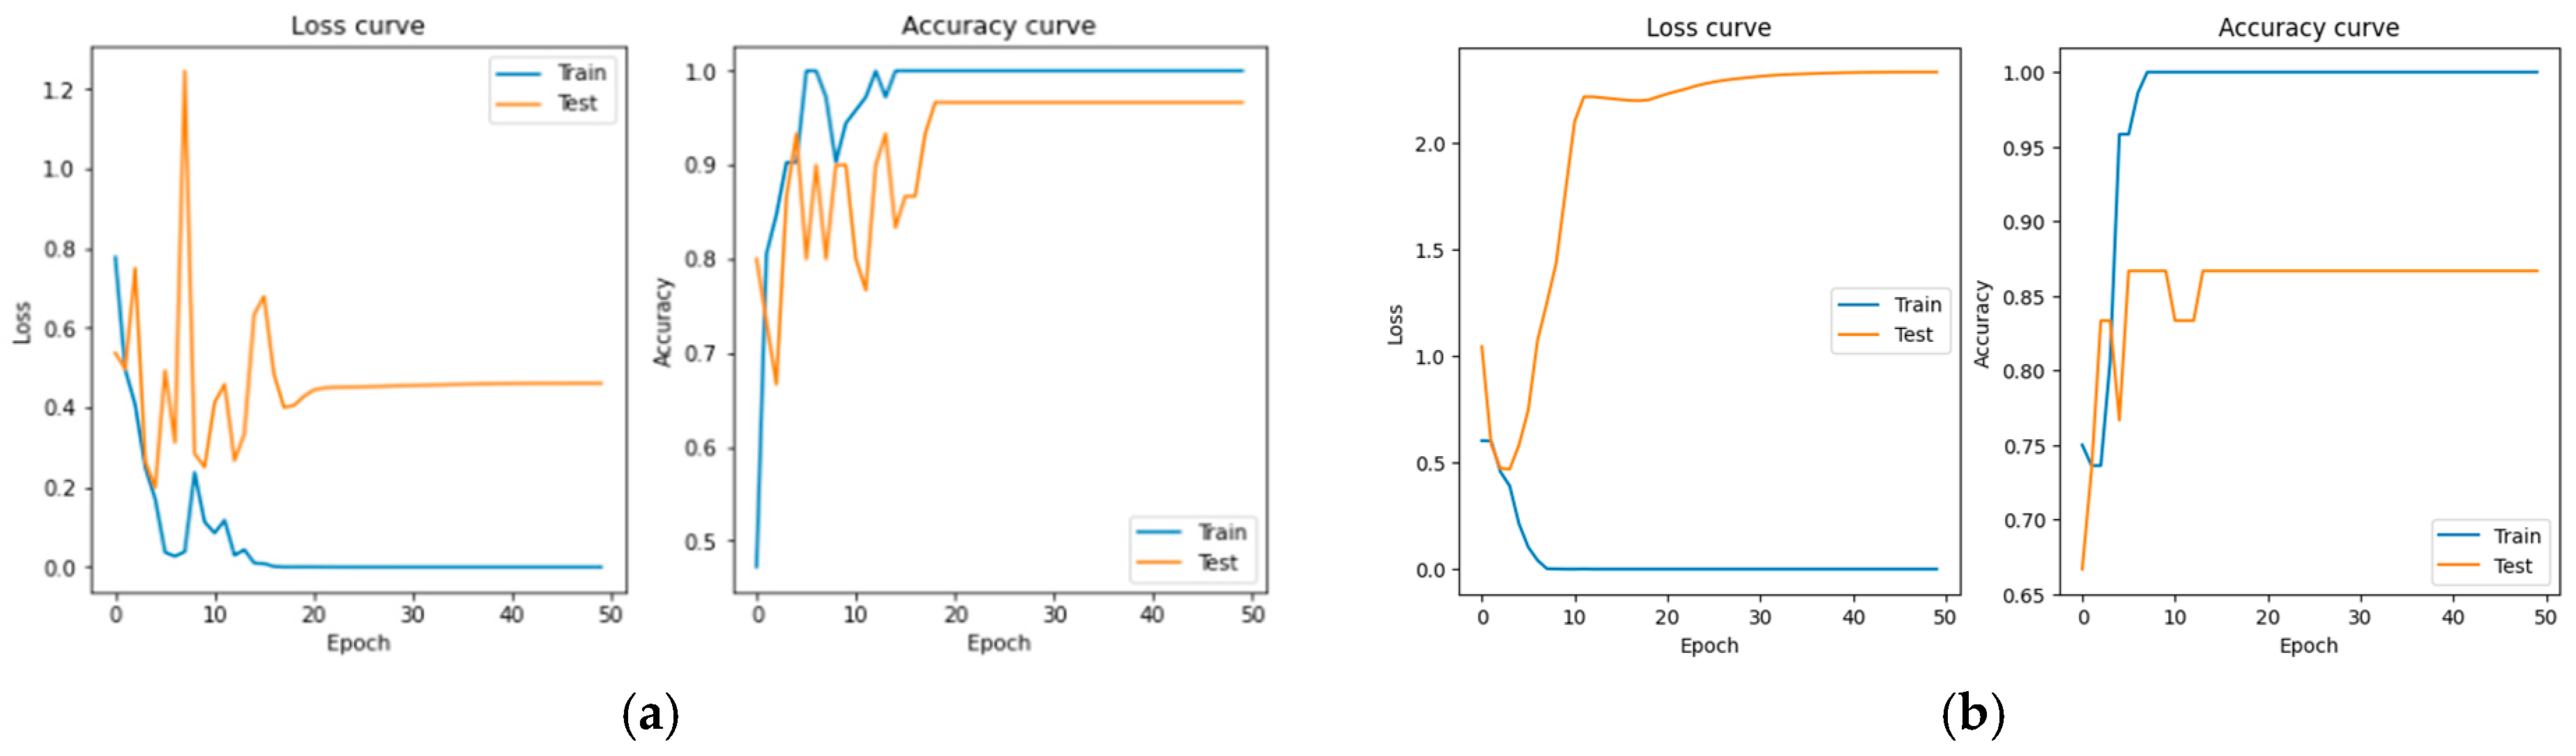
2.4. Evaluation Metrics

In this paper, accuracy, precision, recall, and Matthews Correlation Coefficient (MCC) metrics are used. Here, TPs (True Positives) indicate instances correctly identified as the positive class, while FPs (False Positives) refer to non-target class instances incorrectly labeled as positive. Conversely, FNs (False Negatives) represent target class instances mistakenly classified as negative, and TNs (True Negatives) are correctly identified non-target class instances:
A c c u r a c y = T P + T N T P + T N + F P + F N
P r e c i s i o n = T P T P + F P
R e c a l l = T P T P + F N
M C C = T P × T N F P × F N T P + F P T P + F N T N + F P T N + F N

3. Result

Numerous experiments were undertaken to determine the optimal accuracy for the early detection of PD using deep transfer learning. Table 1 provides the classification accuracy percentages for different deep learning models (VGG16, VGG19, ResNet18, ResNet50, ResNet101, Vit_base_patch16_224) across various augmentation methods (no augmentation, rotation and flipping, AugMix, and PixMix) and two different datasets (spiral and wave).
With rotation and flipping data augmentation, VGG19 performed the best across both the wave and spiral datasets, achieving the highest accuracy among the models. Applying rotation and flipping data augmentation to the images in the dataset, VGG19 again excelled with the highest accuracy. For the spiral dataset, VGG19 and ResNet50 performed the best, with VGG19 having a slightly higher accuracy. AugMix was a more advanced data augmentation technique that improved the accuracy for the wave dataset. VGG19 maintained its high performance in the wave dataset, while in the spiral dataset, the accuracy was similar to where there was no augmentation used. PixMix, on the other hand, did not perform well in the wave dataset, with lower accuracy across all the models. However, the spiral dataset improved the accuracy of some models, particularly Vit_base_patch16_224 and ResNet18. According to Table 2, it was evident that the models’ accuracy improved after using cosine annealing.
Overall, the choice of data augmentation method had a significant impact on model performance. VGG19 consistently performed well, especially with rotation and flipping augmentation and AugMix. ResNet18 also performed reasonably well in multiple scenarios. The choice of the dataset also affected the results, with the wave dataset generally yielding higher accuracy than the spiral dataset. The confusion matrix of VGG19 with rotation and flipping augmentation is shown in Figure 5. According to the data in Table 3, the value of MCC is 0.94, and the recall value equals 0.93. Moreover, Figure 5 presents the confusion matrix to highlight important details of the best-performing model on both the spiral and wave datasets. Significantly, a model in the healthcare domain is more focused on recall value because a high value of recall means predicting more accurately among people with PD. In this case, they will not miss anyone who is a Parkinson’s patient, and it can have a better chance of saving some lives.
Table 3 showcases the evaluation metrics of the model VGG19 with rotation and flipping augmentation for Parkinson’s wave detection tasks. As depicted in Figure 6, the training loss dwindled to 0, while the testing loss consistently hovered around 0.461. This phenomenon can be attributed mainly to the VGG19 model’s intricate architecture featuring 19 layers and many parameters, predisposing it to overfitting, primarily when operating on a relatively small dataset. To address this overfitting concern in future endeavors, implementing regularization techniques such as L1/L2 regularization or dropout in the model’s design may mitigate the problem, potentially leading to improved accuracy. In the case of the VGG19 model employed for Parkinson’s wave detection, overfitting appears to be a noticeable issue. Figure 7 shows prediction output samples from the VGG19 model with augmentation and cosine scheduling.

4. Conclusions

In this paper, various deep transfer learning models have been presented for the early diagnosis of PD using hand-drawn spiral and wave patterns. Furthermore, different data augmentation techniques, including some state-of-the-art augmentation techniques, such as AugMix and PixMix, have been used to avoid model overfitting. Additionally, among all the models introduced, it was observed that the VGG19 model outperformed the other models with an accuracy of 96.67%. However, the target users are only the patients in stage 1 and stage 2 or healthy individuals. A limitation of this diagnosis is that some PD individuals in a very early stage would not experience tremors. Overall, early diagnosis through image classification was found to be both feasible and convenient. This approach allows for relatively early diagnosis in all patients, enabling timely intervention and disease management. In the future, efforts will be made to enhance the results by incorporating more data and exploring alternative detection techniques.

Author Contributions

Conceptualization, Y.H. and M.P.; methodology, Y.H., K.C. and M.H.H.; software, Y.H. and A.-A.N.; validation, K.C., M.H.H., A.B. and M.P.; formal analysis, Y.H. and M.H.H.; investigation, Y.H. and M.H.H.; resources, A.B. and M.P.; data curation, Y.H., K.C. and A.-A.N.; writing—original draft preparation, Y.H.; writing—review and editing, Y.H., K.C., A.-A.N., M.H.H., A.B. and M.P.; visualization, K.C. and A.B.; supervision, M.H.H. and M.P.; project administration, M.H.H. and A.B.; funding acquisition, A.B. and M.P. All authors have read and agreed to the published version of the manuscript.

Funding

This research received no external funding.

Institutional Review Board Statement

Not applicable.

Informed Consent Statement

Not applicable.

Data Availability Statement

The data presented in this study are available on https://www.kaggle.com/code/basel99/parkinson-s-disease-detection/input (accessed on 11 April 2024).

Conflicts of Interest

The authors declare no conflicts of interest.

References

  1. Postuma, R.B.; Berg, D.; Stern, M.; Poewe, W.; Olanow, C.W.; Oertel, W.; Obeso, J.; Marek, K.; Litvan, I.; Lang, A.E.; et al. MDS Clinical Diagnostic Criteria for Parkinson’s Disease. Mov. Disord. 2015, 30, 1591–1601. [Google Scholar] [CrossRef]
  2. Sveinbjornsdottir, S. The Clinical Symptoms of Parkinson’s Disease. J. Neurochem. 2016, 139, 318–324. [Google Scholar] [CrossRef] [PubMed]
  3. Parkinson’s Australia. Statistics on Parkinson’s 2022. Available online: https://www.parkinsons.org.au/statistics/ (accessed on 29 February 2024).
  4. Kalia, L.V.; Lang, A.E. Parkinson’s Disease. Lancet 2015, 386, 896–912. [Google Scholar] [CrossRef] [PubMed]
  5. Huseyn, E. Deep Learning Based Early Diagnostics of Disease. arXiv 2020, arXiv:2008.01792. [Google Scholar] [CrossRef]
  6. Shaban, M. Deep Learning for Parkinson’s Disease Diagnosis: A Short Survey. Computer 2023, 12, 58. [Google Scholar] [CrossRef]
  7. Tanveer, M.; Richhariya, B.; Khan, R.U.; Rashid, A.H.; Khanna, P.; Prasad, M.; Lin, C.T. Machine Learning Techniques for the Diagnosis of Alzheimer’s Disease. ACM Trans. Multimed. Comput. Commun. Appl. 2020, 16, 1–35. [Google Scholar] [CrossRef]
  8. Zhou, Z.; Kanwal, A.; Chaturvedi, K.; Raza, R.; Prakash, S.; Jan, T.; Prasad, M. Deep Learning-Based Classification of Neurodegenerative Diseases Using Gait Dataset: A Comparative Study. In Proceedings of the 2023 International Conference on Robotics, Control and Vision Engineering, Tokyo, Japan, 21–23 July 2023; ACM: New York, NY, USA, 2023; pp. 59–64. [Google Scholar]
  9. Chatterjee, K.; Kumar, R.P.; Bandyopadhyay, A.; Swain, S.; Mallik, S.; Li, A.; Ray, K. PDD-ET: Parkinson’s Disease Detection Using ML Ensemble Techniques and Customized Big Dataset. Information 2023, 14, 502. [Google Scholar] [CrossRef]
  10. Zafeiropoulos, N.; Bitilis, P.; Tsekouras, G.E.; Kotis, K. Evaluating Ontology-Based PD Monitoring and Alerting in Personal Health Knowledge Graphs and Graph Neural Networks. Information 2024, 15, 100. [Google Scholar] [CrossRef]
  11. Dai, Y.; Song, Y.; Liu, W.; Bai, W.; Gao, Y.; Dong, X.; Lv, W. Multi-Focus Image Fusion Based on Convolution Neural Network for Parkinson’s Disease Image Classification. Diagnostics 2021, 11, 2379. [Google Scholar] [CrossRef] [PubMed]
  12. Hap, A.U.; Li, J.P.; Agbley, B.L.Y.; Mawuli, C.B.; Ali, Z.; Nazir, S.; Din, S.U. A Survey of Deep Learning Techniques Based Parkinson’s Disease Recognition Methods Employing Clinical Data. Expert Syst. Appl. 2022, 208, 118045. [Google Scholar] [CrossRef]
  13. Haller, S.; Simon Badoud, S.; Nguyen, D.; Garibotto, V. Individual Detection of Patients with Parkinson Disease Using Support Vector Machine Analysis of Diffusion Tensor Imaging Data: Initial Results. Am. J. Neuroradiol. 2012, 33, 2123–2128. [Google Scholar] [CrossRef] [PubMed]
  14. Tassew, T.M.; Xuan, N.; Chai, B. PDDS: A Software for the Early Diagnosis of Parkinson’s Disease from MRI and DaT Scan Images Using Detection and Segmentation Algorithms. Biomed. Signal Process. Control 2023, 86, 105140. [Google Scholar] [CrossRef]
  15. Isaacson, J.R.; Brillman, S.; Chhabria, N.; Isaacson, S.H. Impact of DaTscan Imaging on Clinical Decision Making in Clinically Uncertain Parkinson’s Disease. J. Park. Dis. 2021, 11, 885–889. [Google Scholar] [CrossRef] [PubMed]
  16. Zham, P.; Kumar, K.D.; Dabnichki, P.; Arjunan, P.S.; Raghav, S. Distinguishing Different Stages of Parkinson’s Disease Using Composite Index of Speed and Pen-Pressure of Sketching a Spiral. Front. Neurol. 2017, 8, 268142. [Google Scholar] [CrossRef] [PubMed]
  17. Pereira, R.D.; Pereira, D.R.; da Silva, F.A.; Hook, C.; Webber, S.A.; Pereira, L.A.; Papa, J.P. A Step towards the Automated Diagnosis of Parkinson’s Disease: Analyzing Handwriting Movements. In Proceedings of the IEEE International Symposium on Computer-Based Medical Systems 2015, Sao Carlos, Brazil, 22–25 June 2015. [Google Scholar]
  18. Basnin, N.; Sumi, A.T.; Hossain, S.M.; Andersson, K. Early Detection of Parkinson’s Disease from Micrographic Static Hand Drawings. In Proceedings of the 2021 International Conference on Brain Informatics, Virtual, 17–19 September 2021; Volume 12960, pp. 433–447. [Google Scholar]
  19. Das, H.S.; Das, A.; Neog, A.; Mallik, S.; Bora, K.; Zhao, Z. Early Detection of Parkinson’s Disease Using Fusion of Discrete Wavelet Transformation and Histograms of Oriented Gradients. Mathematics 2022, 10, 4218. [Google Scholar] [CrossRef]
  20. Kamran, I.; Naz, S.; Razzak, I.; Imran, M. Handwriting Dynamics Assessment Using Deep Neural Networks for Early Identification of Parkinson’s Disease. Future Gener. Comput. Syst. 2020, 117, 234–244. [Google Scholar] [CrossRef]
  21. Shaban, M. Deep Convolutional Neural Network for Parkinson’s Disease Based Handwriting Screening. In Proceedings of the IEEE 17th International Symposium on Biomedical Imaging Workshops (ISBI Workshops) 2020, Iowa City, IA, USA, 4 April 2020. [Google Scholar]
  22. Hendrycks, D.; Mu, N.; Cubuk, E.D.; Zoph, B.; Gilmer, J.; Lakshminarayanan, B. AugMix: A Simple Data Processing Method to Improve Robustness and Uncertainty. arXiv 2019, arXiv:1912.02781. [Google Scholar]
  23. Hendrycks, D.; Zou, A.; Mazeika, M.; Tang, L.; Song, D.; Steinhardt, J.; Li, B. PIXMIX: Dreamlike Pictures Comprehensively Improve Safety Measures. In Proceedings of the IEEE/CVF Conference on Computer Vision and Pattern Recognition, New Orleans, LA, USA, 18–24 June 2022. [Google Scholar]
  24. Loshchilov, I.; Hutter, F. SGDR: Stochastic Gradient Descent with Warm Restarts. arXiv 2017, arXiv:1608.03983. [Google Scholar]
  25. He, K.; Zhang, X.; Ren, S.; Sun, J. Deep Residual Learning for Image Recognition. In Proceedings of the IEEE Conference on Computer Vision and Pattern Recognition, Boston, MA, USA, 7–12 June 2015. [Google Scholar]
  26. Canziani, A.; Paszke, A.; Culurciello, E. An Analysis of Deep Neural Network Model for Practical Applications. In Proceedings of the IEEE Conference on Computer Vision and Pattern Recognition, Las Vegas, NV, USA, 27–30 June 2016. [Google Scholar]
  27. Dosovitskiy, A.; Beyer, L.; Kolesnikov, A.; Weissenborn, D.; Zhai, X.; Unterthiner, T.; Dehghani, M.; Minderer, M.; Heigold, G.; Gelly, S.; et al. An Image Is Worth 16*16 Words: Transformers for Image Recognition at Scale. In Proceedings of the IEEE Conference on Computer Vision and Pattern Recognition, Seattle, WA, USA, 13–19 June 2020. [Google Scholar]
  28. Mei, J.; Desrosiers, C.; Frasnelli, J. Machine Learning for the Diagnosis of Parkinson’s Disease: A Review of Literature. Front. Aging Neurosci. 2021, 13, 633752. [Google Scholar] [CrossRef] [PubMed]
Figure 1. Proposed framework architecture.
Information 15 00220 g001
Figure 2. Dataset of two different patterns of hand drawing (spiral and wave).
Information 15 00220 g002
Figure 3. Training samples with AugMix augmentation: (a) spiral dataset and (b) wave dataset.
Information 15 00220 g003
Figure 4. Training samples with Pixmix augmentation: (a) spiral dataset and (b) wave dataset.
Information 15 00220 g004
Figure 5. Confusion matrix of VGG19 with rotation and flipping augmentation on (a) spiral dataset and (b) wave dataset.
Information 15 00220 g005
Figure 6. Accuracy and loss curve of VGG19 on (a) wave dataset and (b) spiral dataset.
Information 15 00220 g006
Figure 7. Prediction samples of VGG19 with augmentation and cosine scheduling on (a) wave dataset and (b) spiral dataset.
Information 15 00220 g007
Table 1. Classification accuracy (%) for various models using different augmentation techniques.
Augmentation MethodsDatasetVGG16VGG19ResNet18ResNet50ResNet101Vit_base_patch16_224
No AugmentationWave9293.3386.6781.3285.3368
Spiral77.346678.773.3479.3370
Rotation and flippingWave86.6796.6792.6787.339460
Spiral809086.6787.3384.6786.67
AugMixWave9086.679076.6784.6764
Spiral83.338086.6783.3381.3373.33
PixMixWave76.6763.3347.334451.3383.33
Spiral46.6753.3352.675047.3386.67
Table 2. Classification accuracy (%) for various models with and without cosine annealing.
MethodsDatasetVGG16VGG19ResNet18ResNet50ResNet101Vit_base_patch16_224
W/O Cosine AnnealingWave908292.6787.3379.3382.67
Spiral79.3383.3383.3382.678666
Cosine AnnealingWave9296.6792.6787.339483.33
Spiral83.3387.6686.6787.3384.6786.67
Table 3. Evaluation metrics of VGG19.
ModelDatasetAccuracyPrecisionRecallMCC
VGG19Wave0.9710.930.94
Spiral0.870.920.800.74
Disclaimer/Publisher’s Note: The statements, opinions and data contained in all publications are solely those of the individual author(s) and contributor(s) and not of MDPI and/or the editor(s). MDPI and/or the editor(s) disclaim responsibility for any injury to people or property resulting from any ideas, methods, instructions or products referred to in the content.

