Abstract
Electric vehicles (EVs) are alternatives to traditional combustion engine-powered vehicles. This work focuses on a thermal management system for battery EVs using liquid cooling and a machine learning (ML) model to predict their thermal-related health. Real-world data of EV operation, battery and cooling conditions were collected. Key influencing factors on the thermal-related health of batteries were identified. The ML model’s effectiveness was evaluated against experimental test data. The ML model proved effective in predicting and analyzing battery thermal health, suggesting its potential for use with the thermal management system.
1. Introduction
Climate change is causing concerns about the increasing demand for fossil fuels, which causes significant environmental problems. The use of combustion engines in transportation is a major contributor to this issue [1,2]. As a result, a discernible surge in interest has emerged in electric vehicles (EVs) as viable and sustainable alternatives to traditional combustion engine vehicles [3]. EVs operate by harnessing electricity derived from clean and renewable energy sources, thus circumventing the detrimental environmental effects associated with fossil fuel combustion. This burgeoning interest in EVs is underscored by the recognition of their potential to mitigate the adverse impacts of climate change and reduce dependence on finite fossil fuel reserves [4]. It is noteworthy to mention that there exist four primary classifications of EVs: hybrid electric vehicles (HEVs), plug-in hybrid electric vehicles (PHEVs), battery electric vehicles (BEVs), and fuel cell electric vehicles (FCEVs), each offering distinct advantages and technological advancements in the realm of sustainable transportation [5]. According to the Thailand energy conservation plan, the goal is to encourage the use of 1.2 million EVs by 2036.
Battery EVs (BEVs) are among the most popular type available commercially. They rely on electric motors and rechargeable battery packs. Monitoring battery thermal conditions is important during operation. A battery thermal management system (BTMS) is a technique used to control the temperature of batteries appropriately, which improves the performance of EVs. This system is designed to increase the lifespan of battery cells by controlling the heating level and heat dissipation of the battery, especially when experiencing rapid charging and discharging or extreme ambient temperatures [6].
While the literature on BTMSs has seen significant growth, the integration of machine learning (ML) techniques within BTMSs for EVs remains relatively underexplored. Although there have been notable efforts to apply ML methodologies to enhance EV operation, the extent of such endeavors remains somewhat constrained. Despite the growing interest in ML applications across various domains, its utilization specifically within the context of BTMSs for EVs has yet to reach its full potential. Nonetheless, it is worth acknowledging the existence of some studies that have delved into the application of ML algorithms to optimize EV operation, underscoring the nascent but promising trajectory of ML within this domain. Cheng et al. [7] adopted multi-layer perceptron (MLP) models to investigate the geometric parameters that affect the performance of a Tesla valve and used computational fluid dynamics to analyze the impact of geometric parameters on heat transfer and pressure drop. Achariyaviriya et al. [8] used an MLP model to predict the consumption of BEVs in Thailand through real-world driving tests. Recently, Ren et al. [9] explored phase-change materials (PCMs) in managing the thermal performance of batteries, focusing on various arrangement schemes of PCMs within a battery system to optimize heat dissipation and maintain temperature stability during battery operation. They analyzed the performance of these configurations under various operating conditions, aiming to identify the most effective arrangement for enhancing battery safety, longevity, and performance. The limited exploration of ML techniques was evident specifically within BTMSs for EVs. Despite significant advancements in both fields, there remains a notable gap in integrating ML methodologies to enhance BTMSs, which could potentially unlock new avenues for optimizing battery performance and longevity under diverse operating conditions. Additionally, studies on the development of machine learning for BTMSs in EVs are still limited and vary according to the researchers’ interests.
The objectives of this study are to develop an MLP-based ML model for monitoring the thermal-related health of a BEV and to investigate the relationship between operating conditions and battery thermal health. The novelty of this work lies in its pioneering integration of machine learning techniques, specifically MLP models, into BTMSs for EVs. While the existing literature has touched upon the application of ML in broader EV contexts, this study uniquely addresses the underexplored potential of ML in optimizing battery thermal health and performance, offering new insights into how operating conditions affect battery longevity and efficiency. Another important aspect is that this study utilizes real data from EV driving tests to inform the development of the MLP model. While design conditions used in simulations are useful for initial assessments, they often fail to capture the full range of variables and uncertainties encountered in actual operating environments. Real-world conditions, such as varying temperatures, unpredictable driving patterns, and fluctuating battery states, introduce complexities that traditional design conditions may overlook. In contrast, neural network-based predictive models can learn from historical data and adapt to these variable conditions, providing more robust and accurate predictions. This enhanced predictive capability is crucial for improving battery performance and longevity, as it accounts for the dynamic and diverse nature of real-world usage. A discussion will be included on how discrepancies between design and real-world conditions impact model accuracy and applicability, thereby highlighting the importance of incorporating advanced machine learning techniques to address these challenges.
2. Material and Method
2.1. Data Collection and Preprocessing
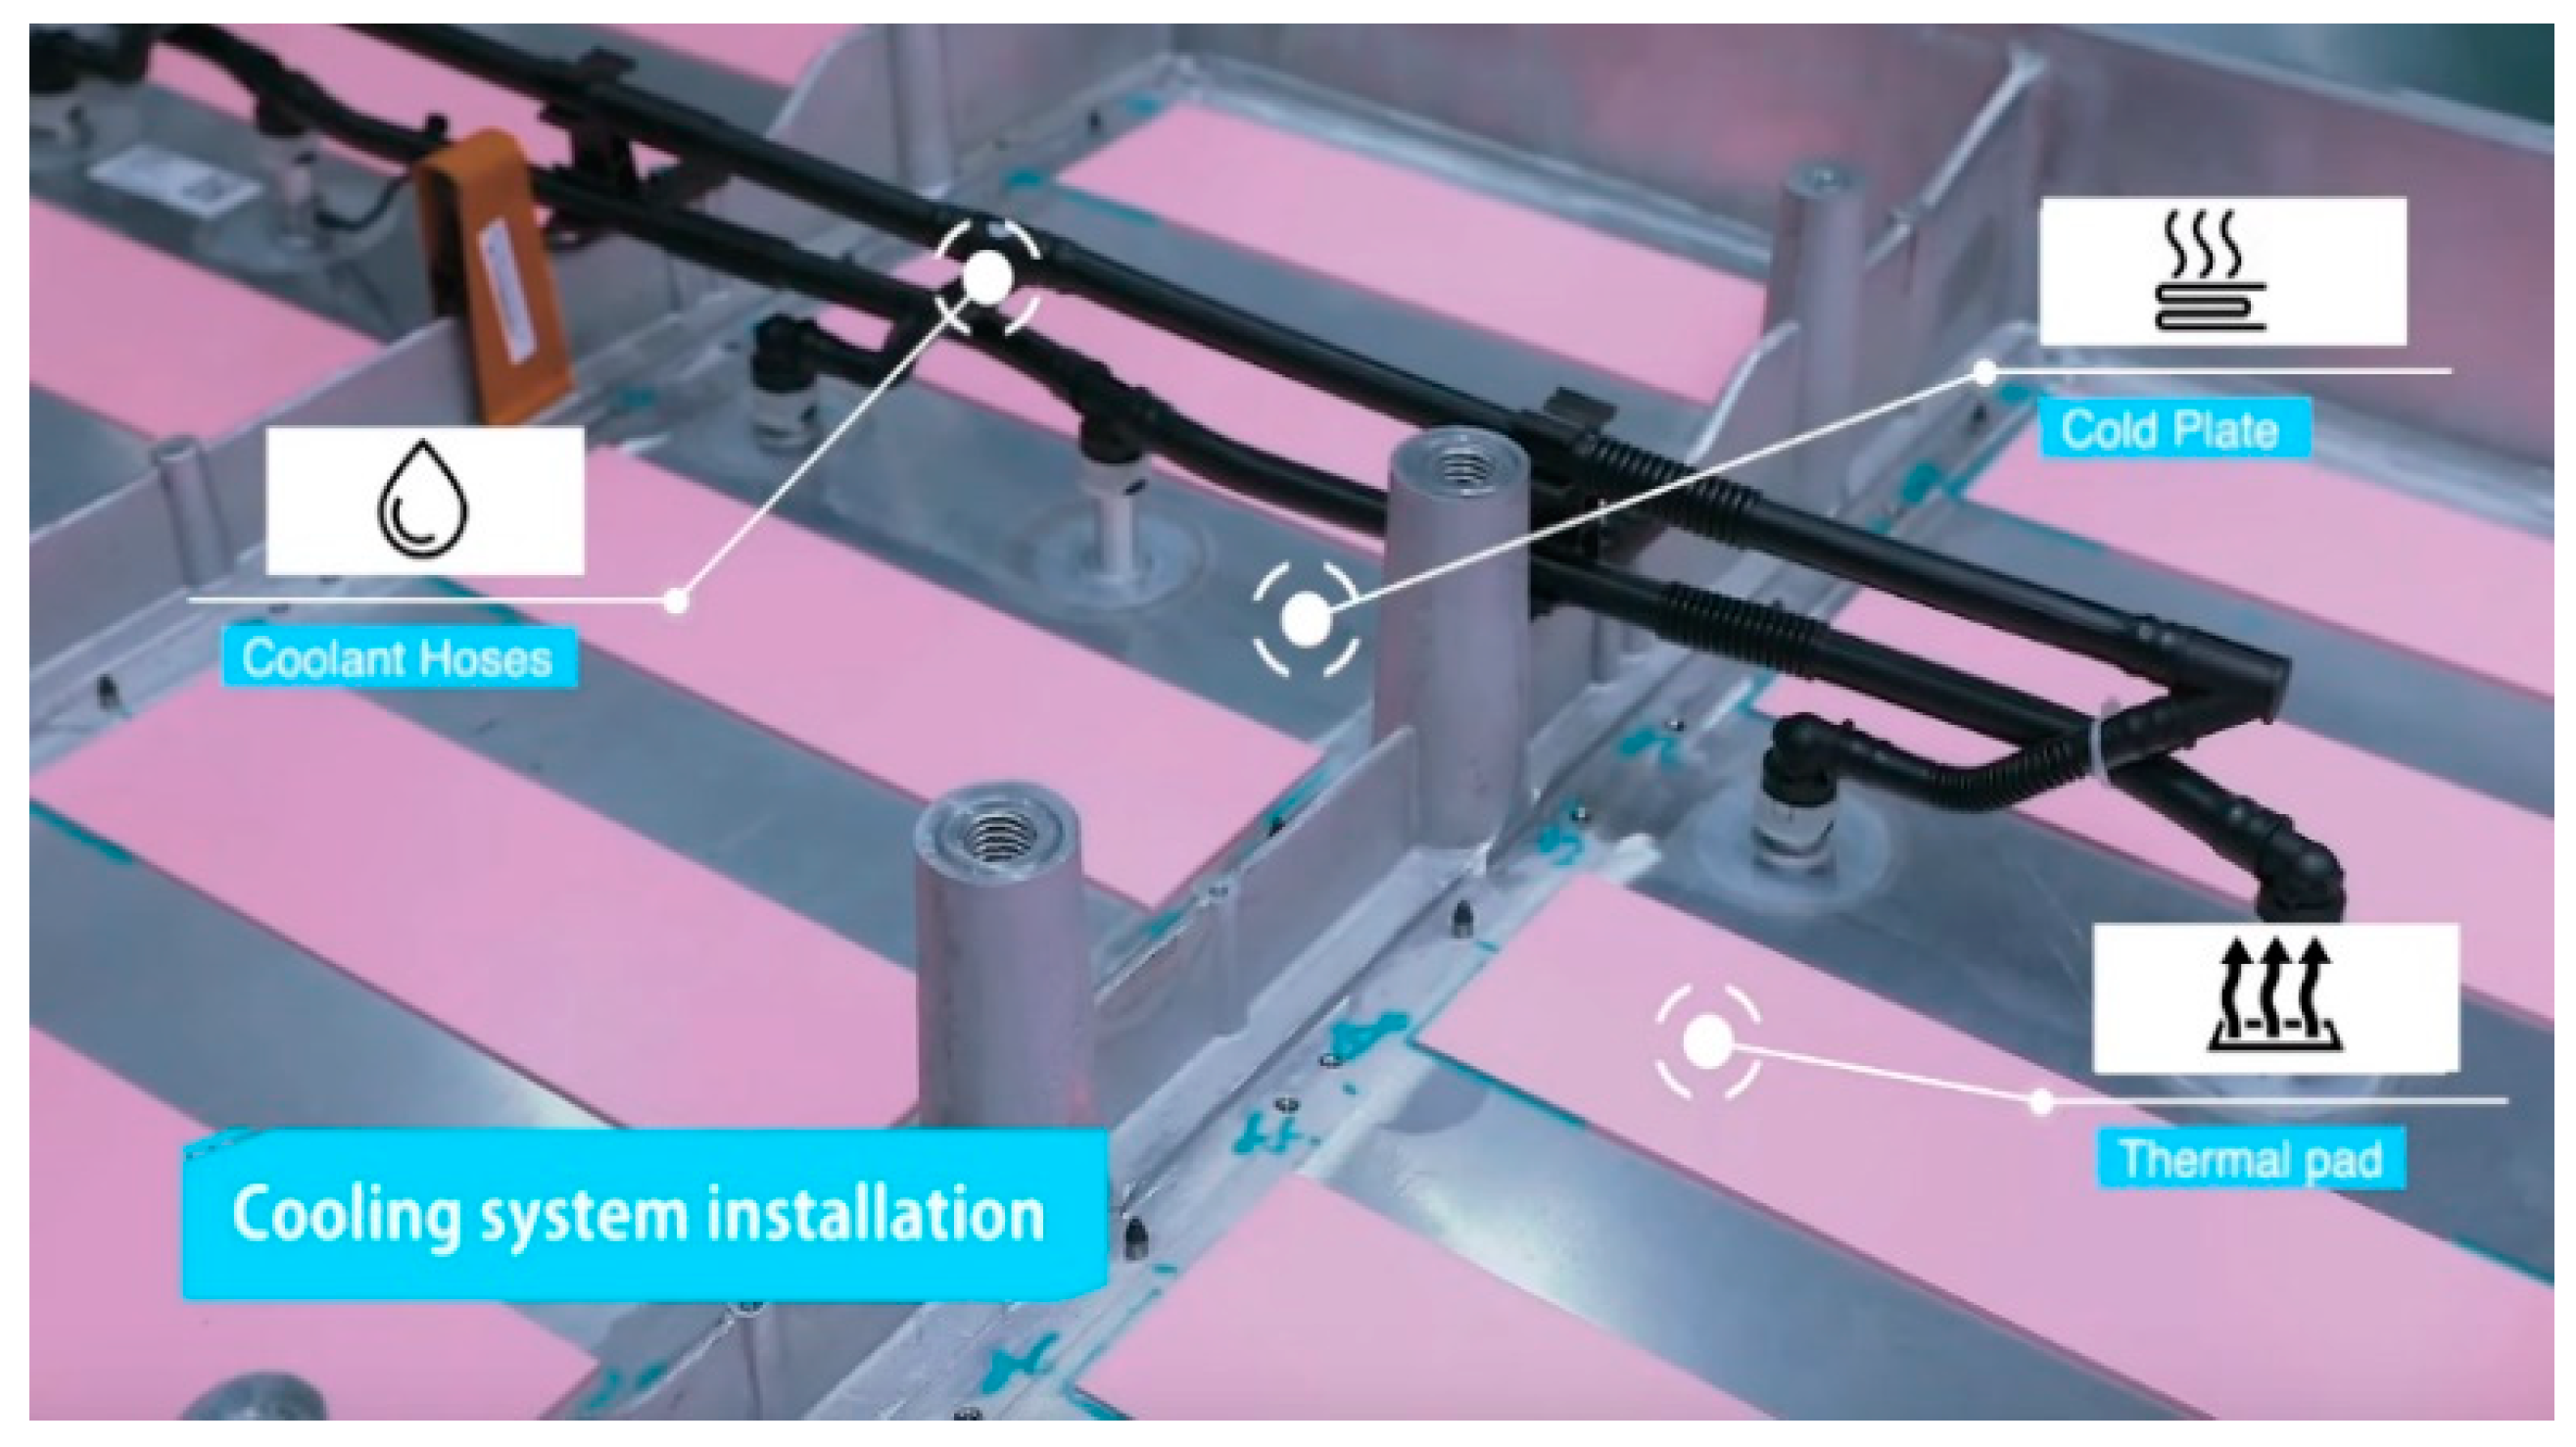
This research utilized the MG ZS EV as the test model, which is a BEV. The battery type used is lithium-ion. For its cooling system, the car employs a liquid cooling method, using ethylene glycol-based (organic acid) technology as the coolant. The installed liquid cooling system consists of the following: (1) Coolant hoses: These hoses are responsible for transporting the coolant to the cold plate or cooling plate. (2) A cold plate: A cold plate is a smooth, shiny surface located at the base of the battery pack. Its primary function is to efficiently cool the battery during various operations, including driving, rapid charging, and coping with hot weather conditions in Thailand. (3) A thermal or heat conductive pad: This pink pad is positioned on the cold plate and serves the crucial role of transferring heat away from the battery to the cold plate. This process helps maintain the battery’s temperature within an acceptable range. The battery structure and installation layout are shown in Figure 1, Figure 2, Figure 3, Figure 4 and Figure 5.

Figure 1.
Battery structure.
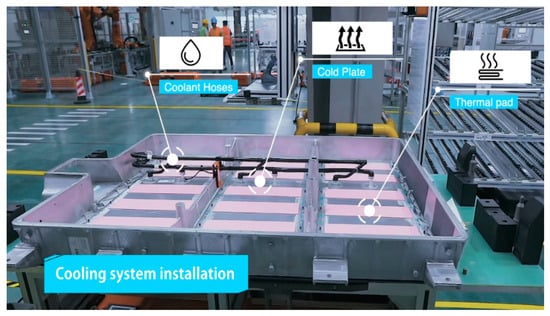
Figure 2.
Installation of battery cooling system for testing cars.
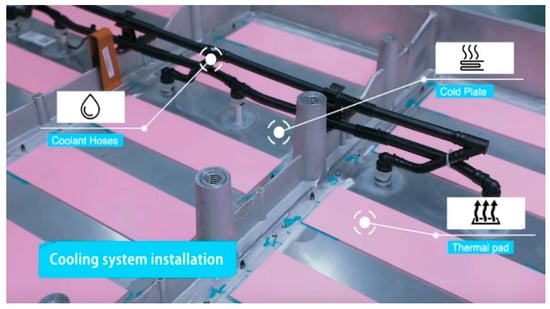
Figure 3.
Top view of installation of battery cooling system for testing cars.
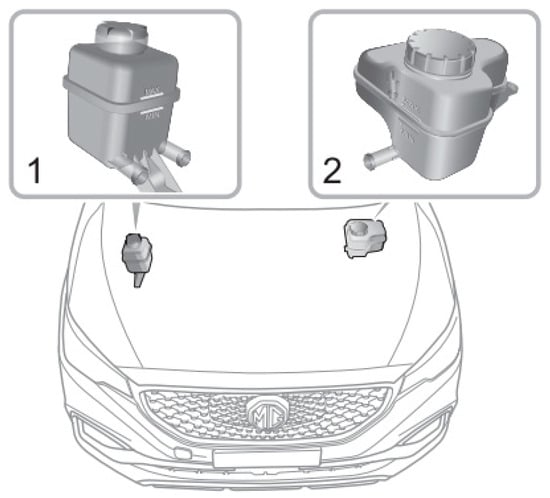
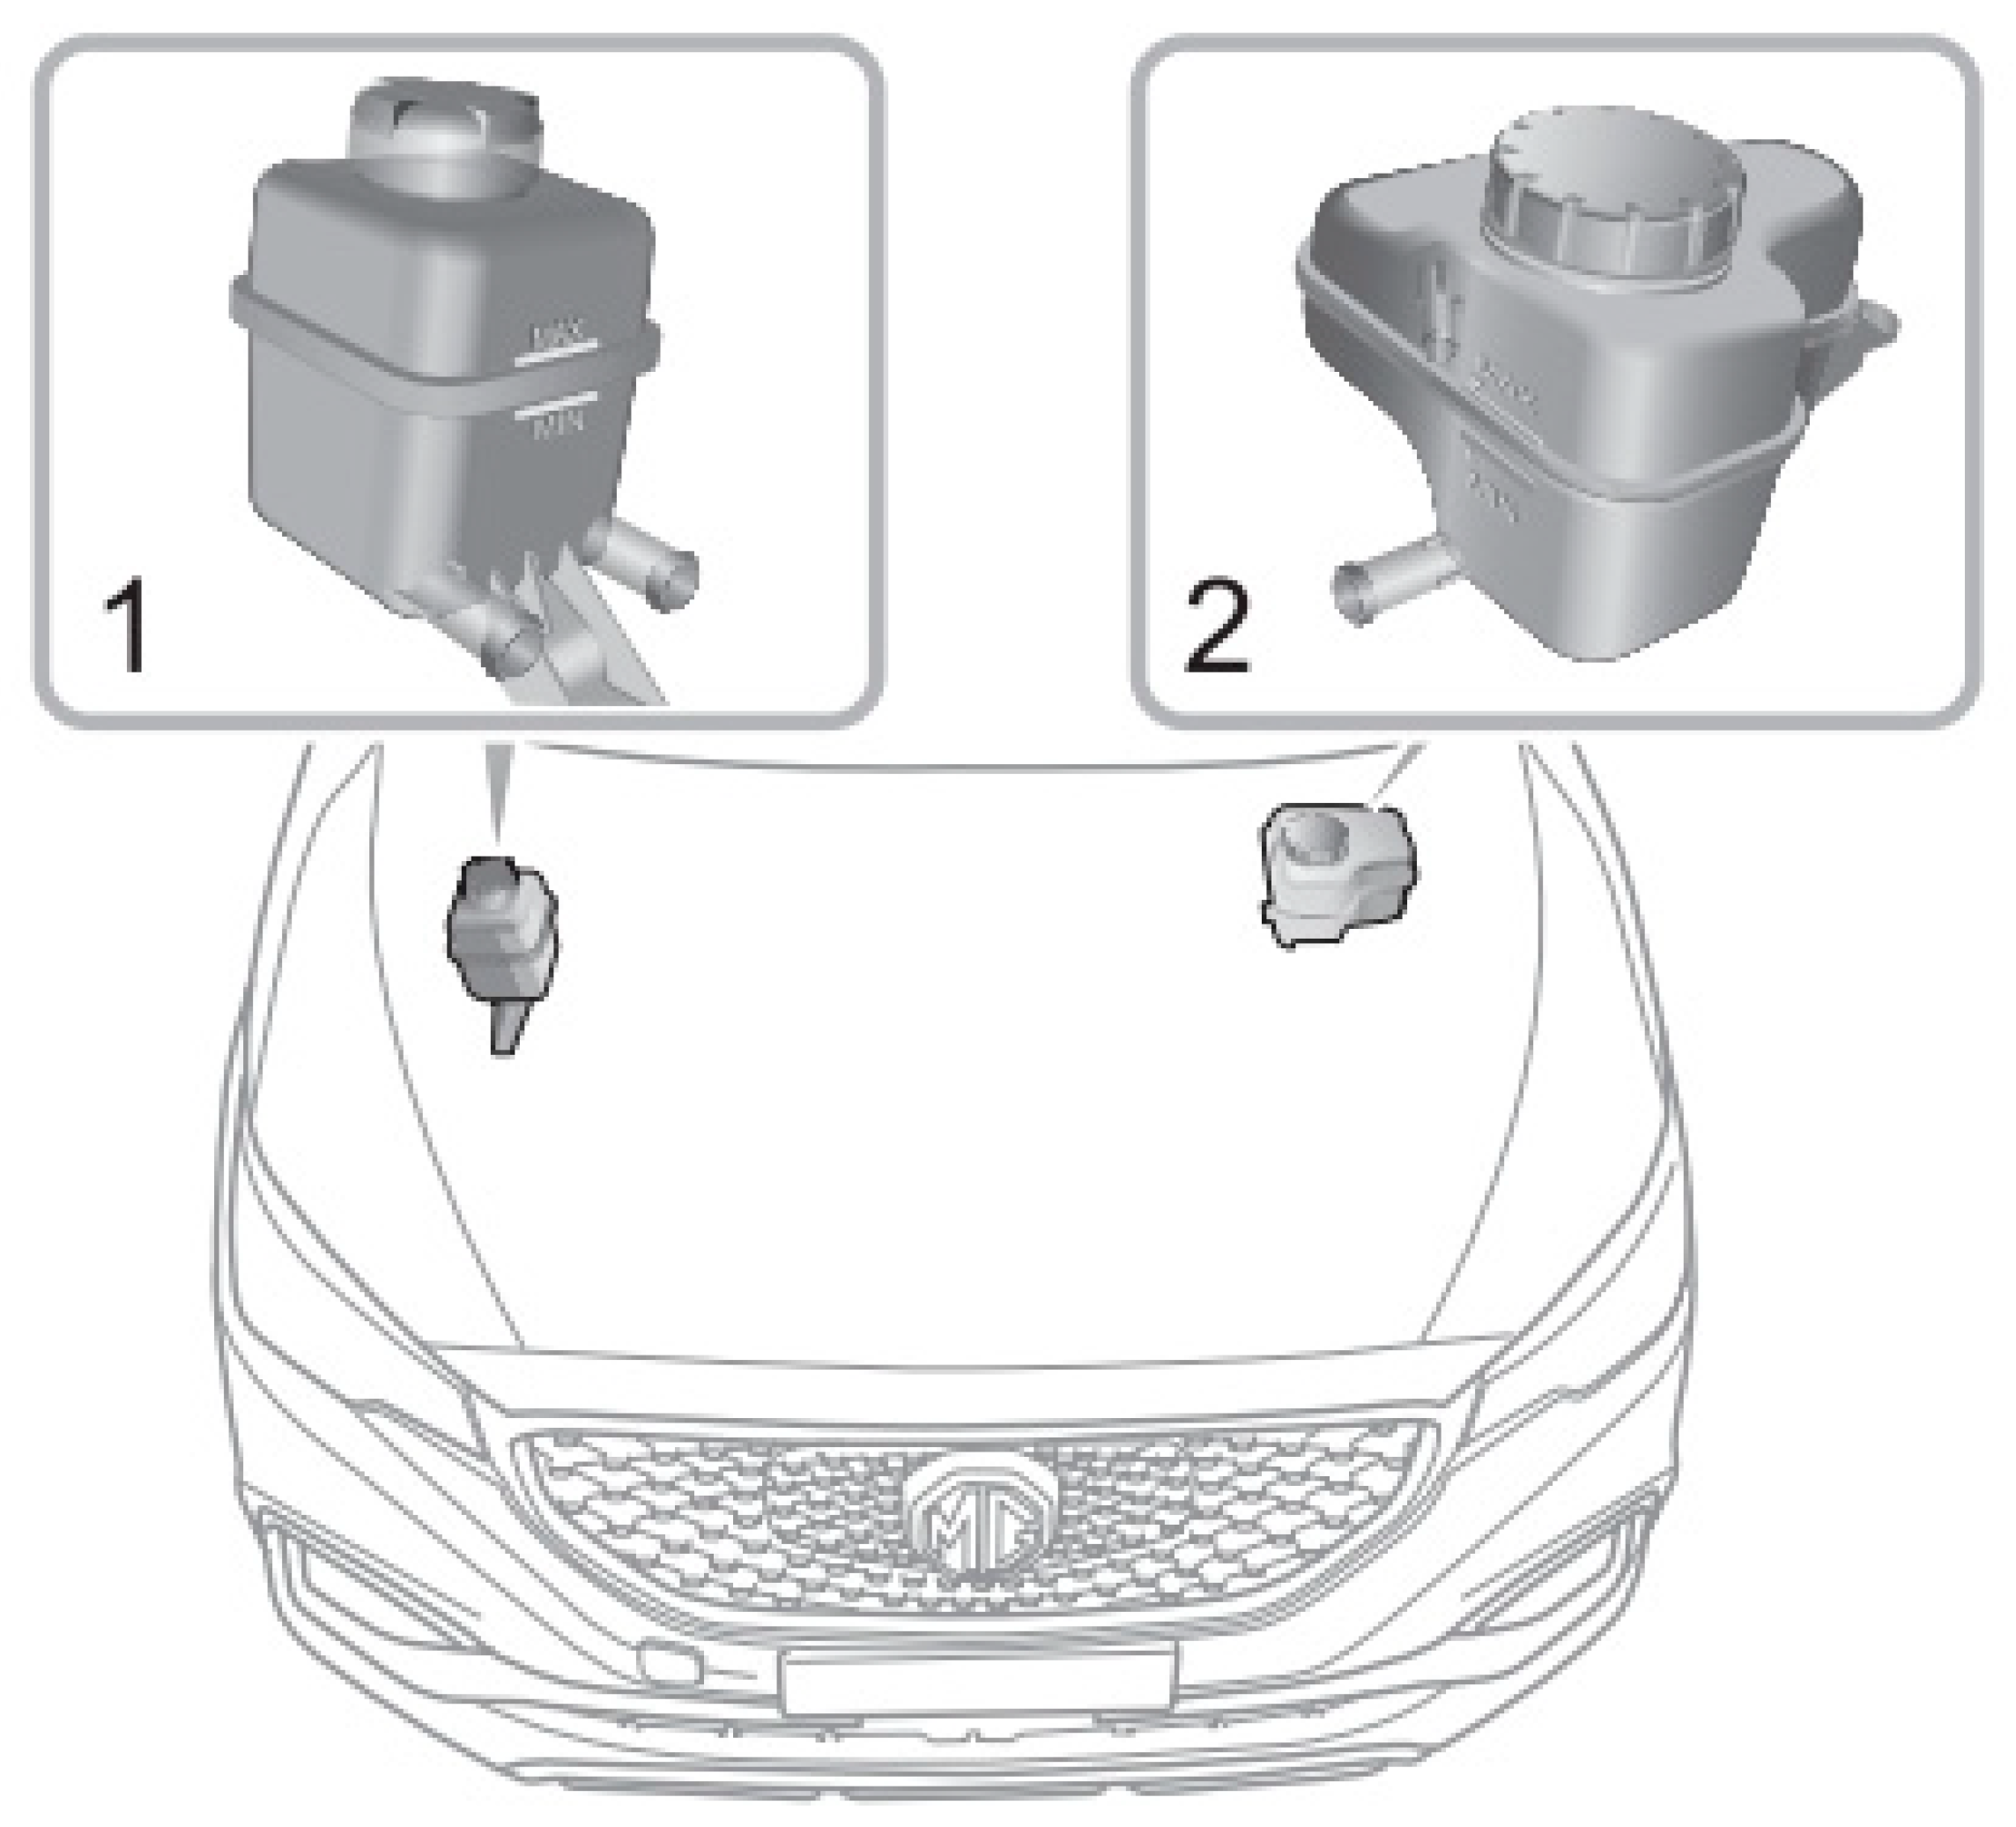
Figure 4.
Battery coolant reservoir (left) in under-bonnet locations.
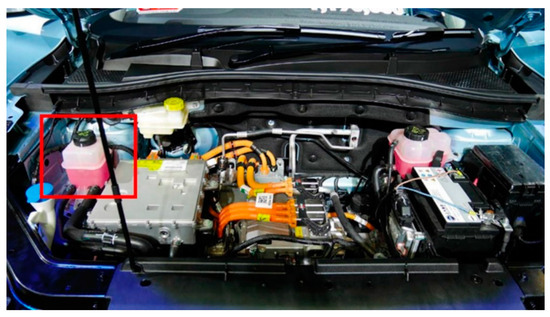
Figure 5.
Detailed view of under-bonnet locations.
This cooling system is operated by the coolant flowing through the coolant hoses within the battery pack and being directed to the cold plate beneath all 18 modules. Each battery module is equipped with this heat sink. When the batteries generate heat, the thermal pad beneath each module absorbs this heat and channels it to the cold plate, which contains the coolant. The coolant then carries the absorbed heat to the external part of the system, causing its temperature to drop. The cooled coolant is then circulated back into the system to repeat the cooling process again. This system functions as a closed circulation system, ensuring that the coolant never directly contacts the battery, making it entirely safe for the battery. There is no need for constant coolant replenishment.
In addition, data are collected using on-board diagnostics (OBD) II due to its standardization in EVs. The OBD system is designed to diagnose and monitor the engine and other vehicle systems, enabling early issue detection, real-time feedback, and overall performance optimization. The experimental tests were carried out by driving a BEV to collect data with an ambient temperature range of 20–35 °C to find factors affecting heat dissipation under various conditions such as speed (30–100 km/h) and weight using sandbags which were the weight of a human (100–350 kg). After going through preprocessing, which involved dropping duplicates and missing values, it was discovered that 40 data rows (840 data points) were eliminated from the raw dataset cleaning process. The Pearson correlation coefficient is a method used to examine linear relationships between two variables or datasets [10].
2.2. ML Model Evaluation
An MLP model was adopted in this work. It is a category of artificial neural network that comprises several layers of interconnected nodes. In this architecture, each node within one layer is linked to every node in the adjacent layer. MLPs are categorized as feedforward neural networks, signifying that data move unidirectionally, progressing from the input layer to the output layer. The fundamental structure of the MLP model comprises three essential components: the input layer, the hidden layer, and the output layer. Depending on the specific requirements of the model’s design, multiple hidden layers can be incorporated [11]. Within an MLP, every node in each layer takes input from all nodes in the preceding layer. It proceeds by calculating a weighted sum of these inputs, passes them through an activation function, and generates an output. The use of an activation function introduces non-linear elements into the model, enabling the network to grasp intricate patterns and connections in the data. Learning in MLPs is generally accomplished via the backpropagation (backward propagation of errors) algorithm. This process entails the network making adjustments to its weights, guided by the variance between the anticipated output and the actual output. This iterative procedure continues until the network attains the desired level of precision. In this study, GridSearchCV was used to optimize the hyperparameters for the dataset, and the details of these hyperparameters are provided in Table 1.

Table 1.
The hyperparameters for MLP algorithm.
The MLP model addresses the complexity of battery thermal management in electric vehicles, which poses significant challenges for traditional physics-based models and purely regression-based approaches. While physics-based models, which rely on balance equations, offer valuable insights, they often require extensive domain-specific knowledge and may not readily accommodate the dynamic, non-linear interactions present in real-world conditions. These models can be constrained by their assumptions and may struggle to accurately predict performance under varied and unpredictable operational scenarios.
In contrast, neural networks, although not physics-based, excel at capturing complex, non-linear relationships and learning from empirical data. Their ability to process large volumes of data and adapt to intricate patterns makes them particularly well suited for managing the variability and complexity inherent in battery thermal management. Neural networks can leverage historical data to provide robust predictions, even when the underlying physics are difficult to model comprehensively.
It should be emphasized that while physics-based models and regression approaches have their merits, neural networks offer a flexible and adaptive solution that can complement and enhance these traditional methods by providing additional predictive accuracy and insights, especially in scenarios where traditional models may fall short. This rationale will be detailed to clarify why neural networks are a suitable choice for this application.
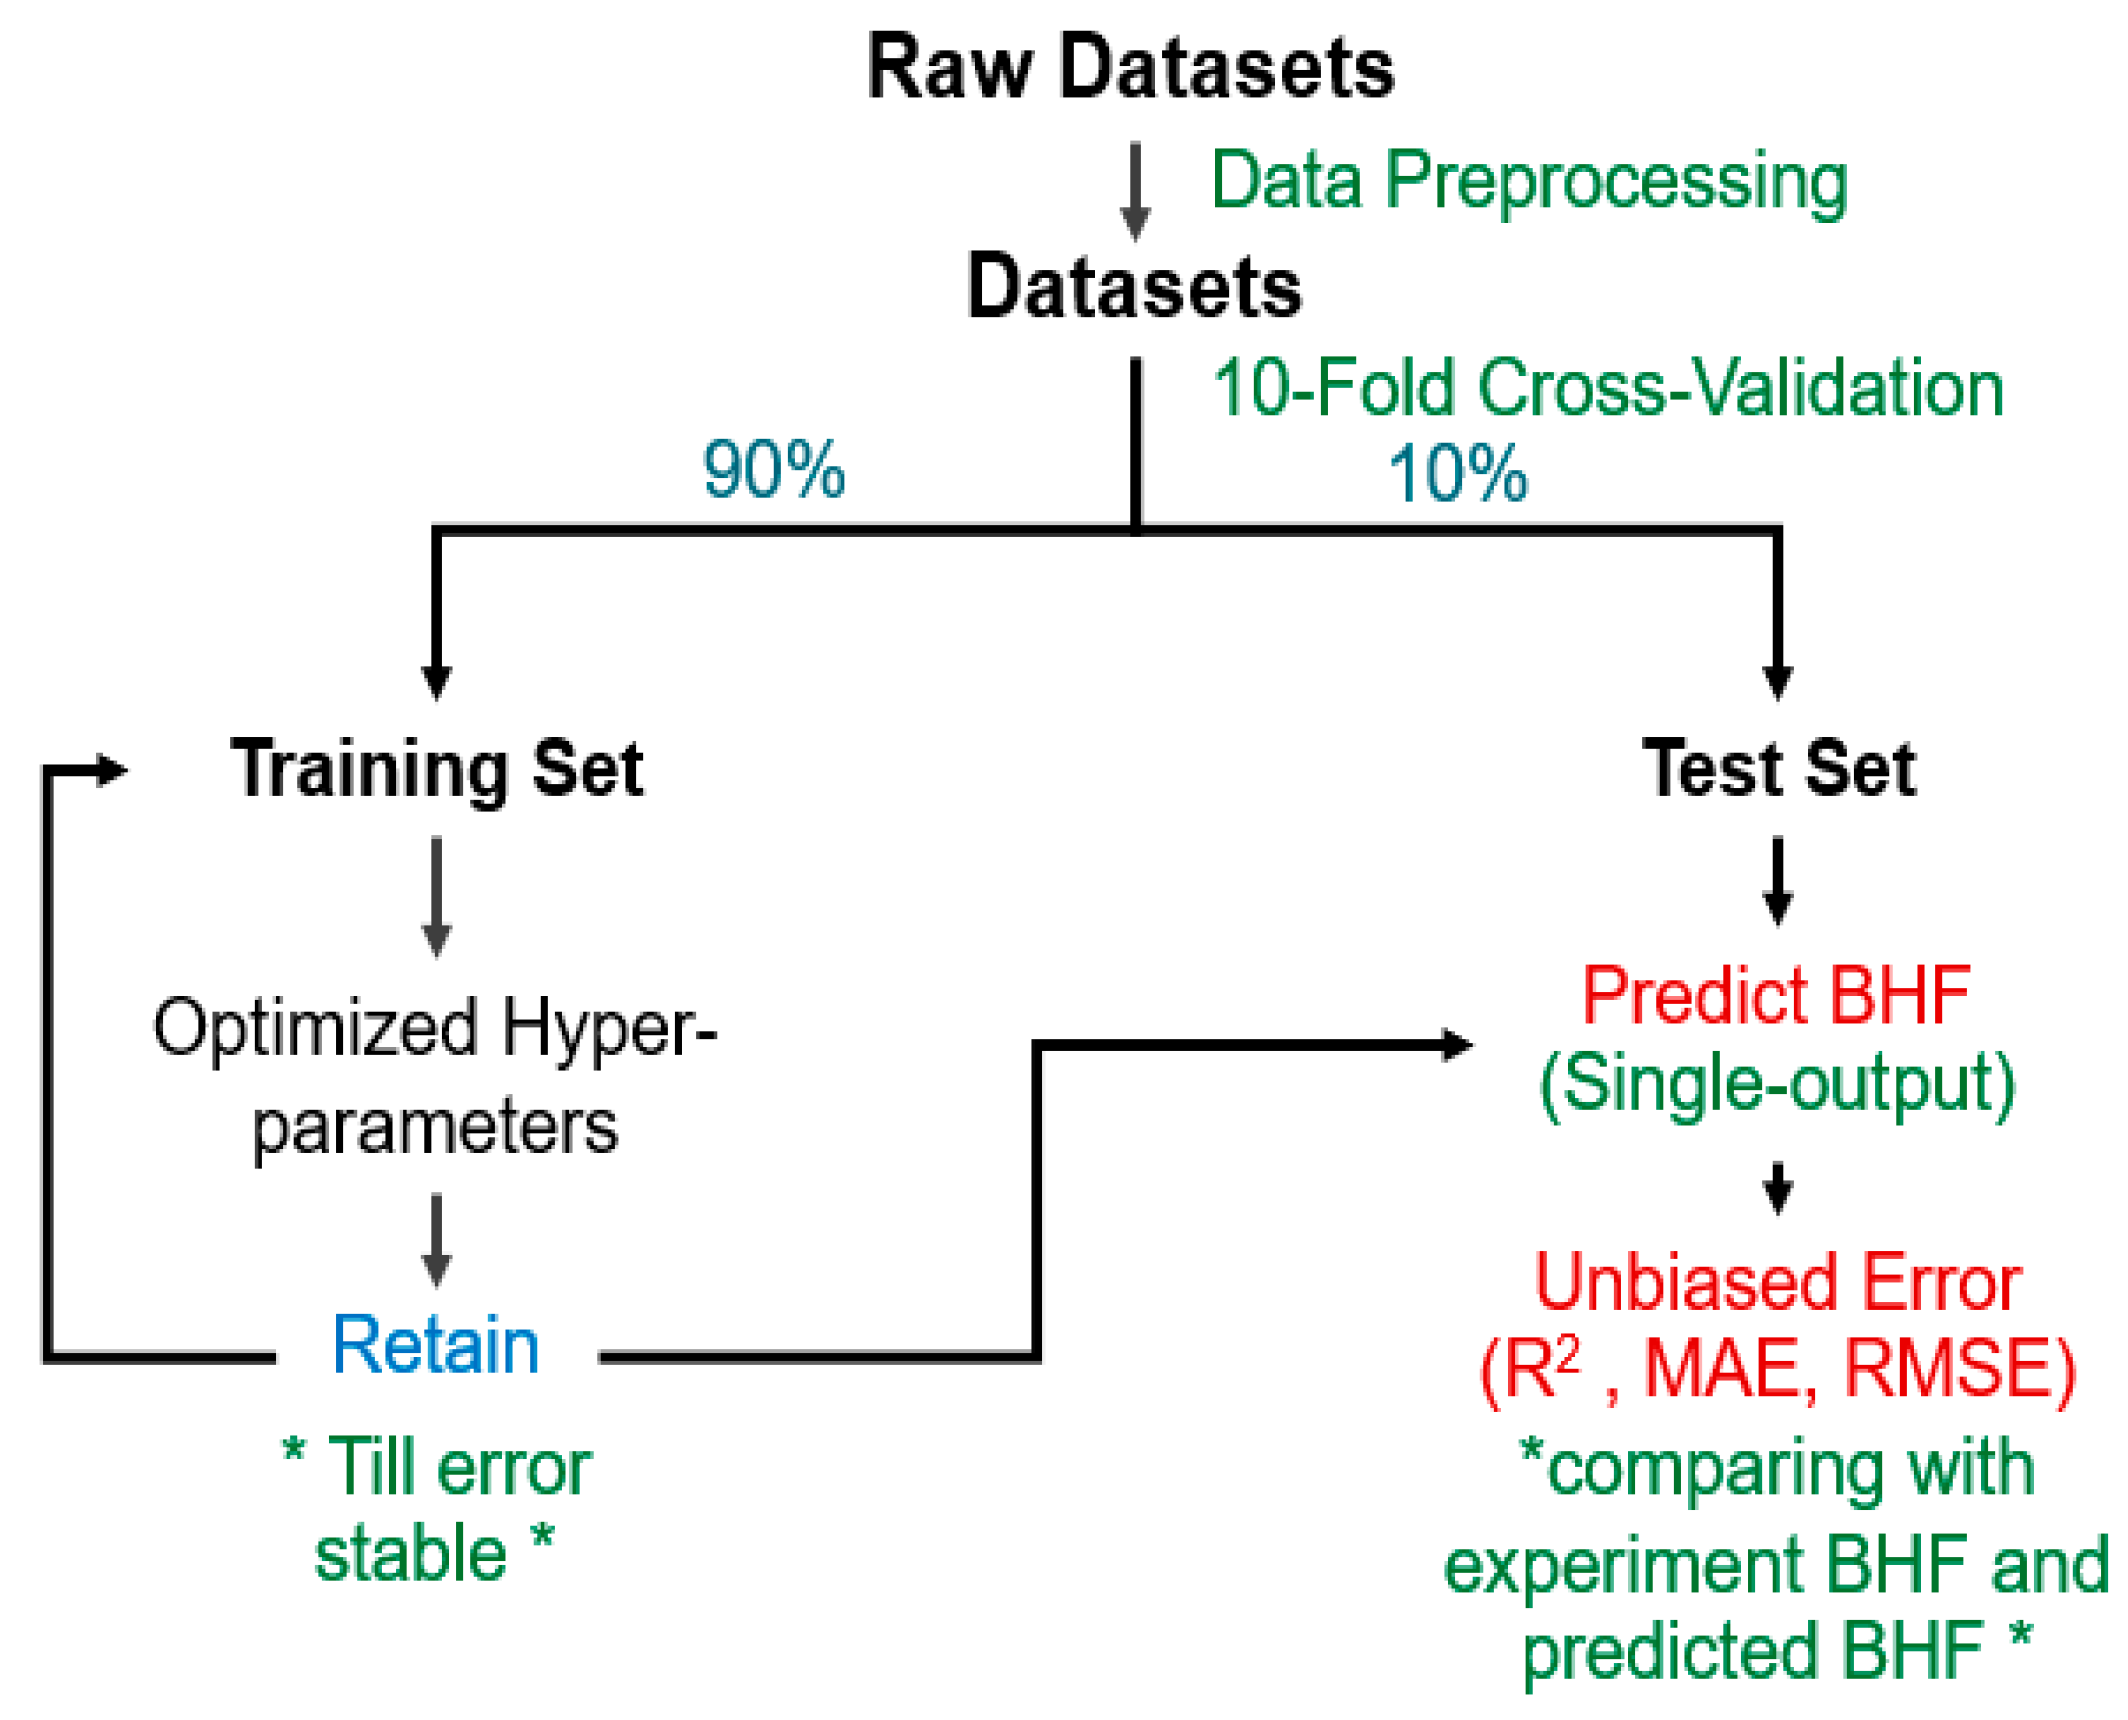
We implemented K-fold cross-validation to evaluate the ML model for our dataset. This statistical method is commonly employed to assess the model performance with minimal biases when dealing with unseen data. Essentially, the complete dataset is randomly shuffled and divided into k distinct, non-overlapping groups or “folds”. The candidate model is constructed using k-1 of these folds as the training data, while its predictive accuracy is evaluated with the remaining fold, which serves as the test data. This process is repeated for k iterations, each time employing a different fold as the test data, ensuring that all data points are utilized for both training and testing. Additionally, this approach helps reduce variance, as it is less sensitive to random data partitioning compared to other methods [12,13].
In this paper, k = 10 was specifically chosen to ensure that each group of data samples was sufficiently large to statistically represent the entire dataset [14]. In each iteration, the training data, accounting for 90% of the entire dataset, was used to compute and optimize hyper-parameters for the ML models (represented by the left route in Figure 6). These variables were subsequently applied to the test data, which constituted 10% of the dataset, in order to assess the model’s prediction accuracy. To evaluate the accuracy of machine learning models, we considered metrics such as R2 (R-squared), root mean square error (RMSE), and mean absolute error (MAE) [15].
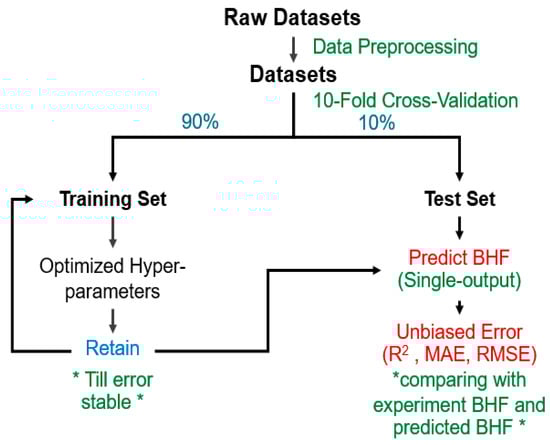
Figure 6.
Algorithm workflow.
2.3. Feature Explanation
SHAP (Shapley additive explanations) is a technique rooted in cooperative game theory that aims to enhance the transparency and interpretability of ML models [16]. In the case of linear models, one might consider using their coefficients as a metric for the overall importance of each feature. However, these coefficients are influenced by the variable’s scale, potentially leading to distortions and misinterpretations. Moreover, coefficients cannot capture the local importance of a feature and how it evolves with varying values. This limitation also applies to feature importance in tree-based models, underscoring the usefulness of SHAP for model interpretability. SHAP unravels the individual contribution of features to the model’s output for every example or observation.
3. Results and Discussion
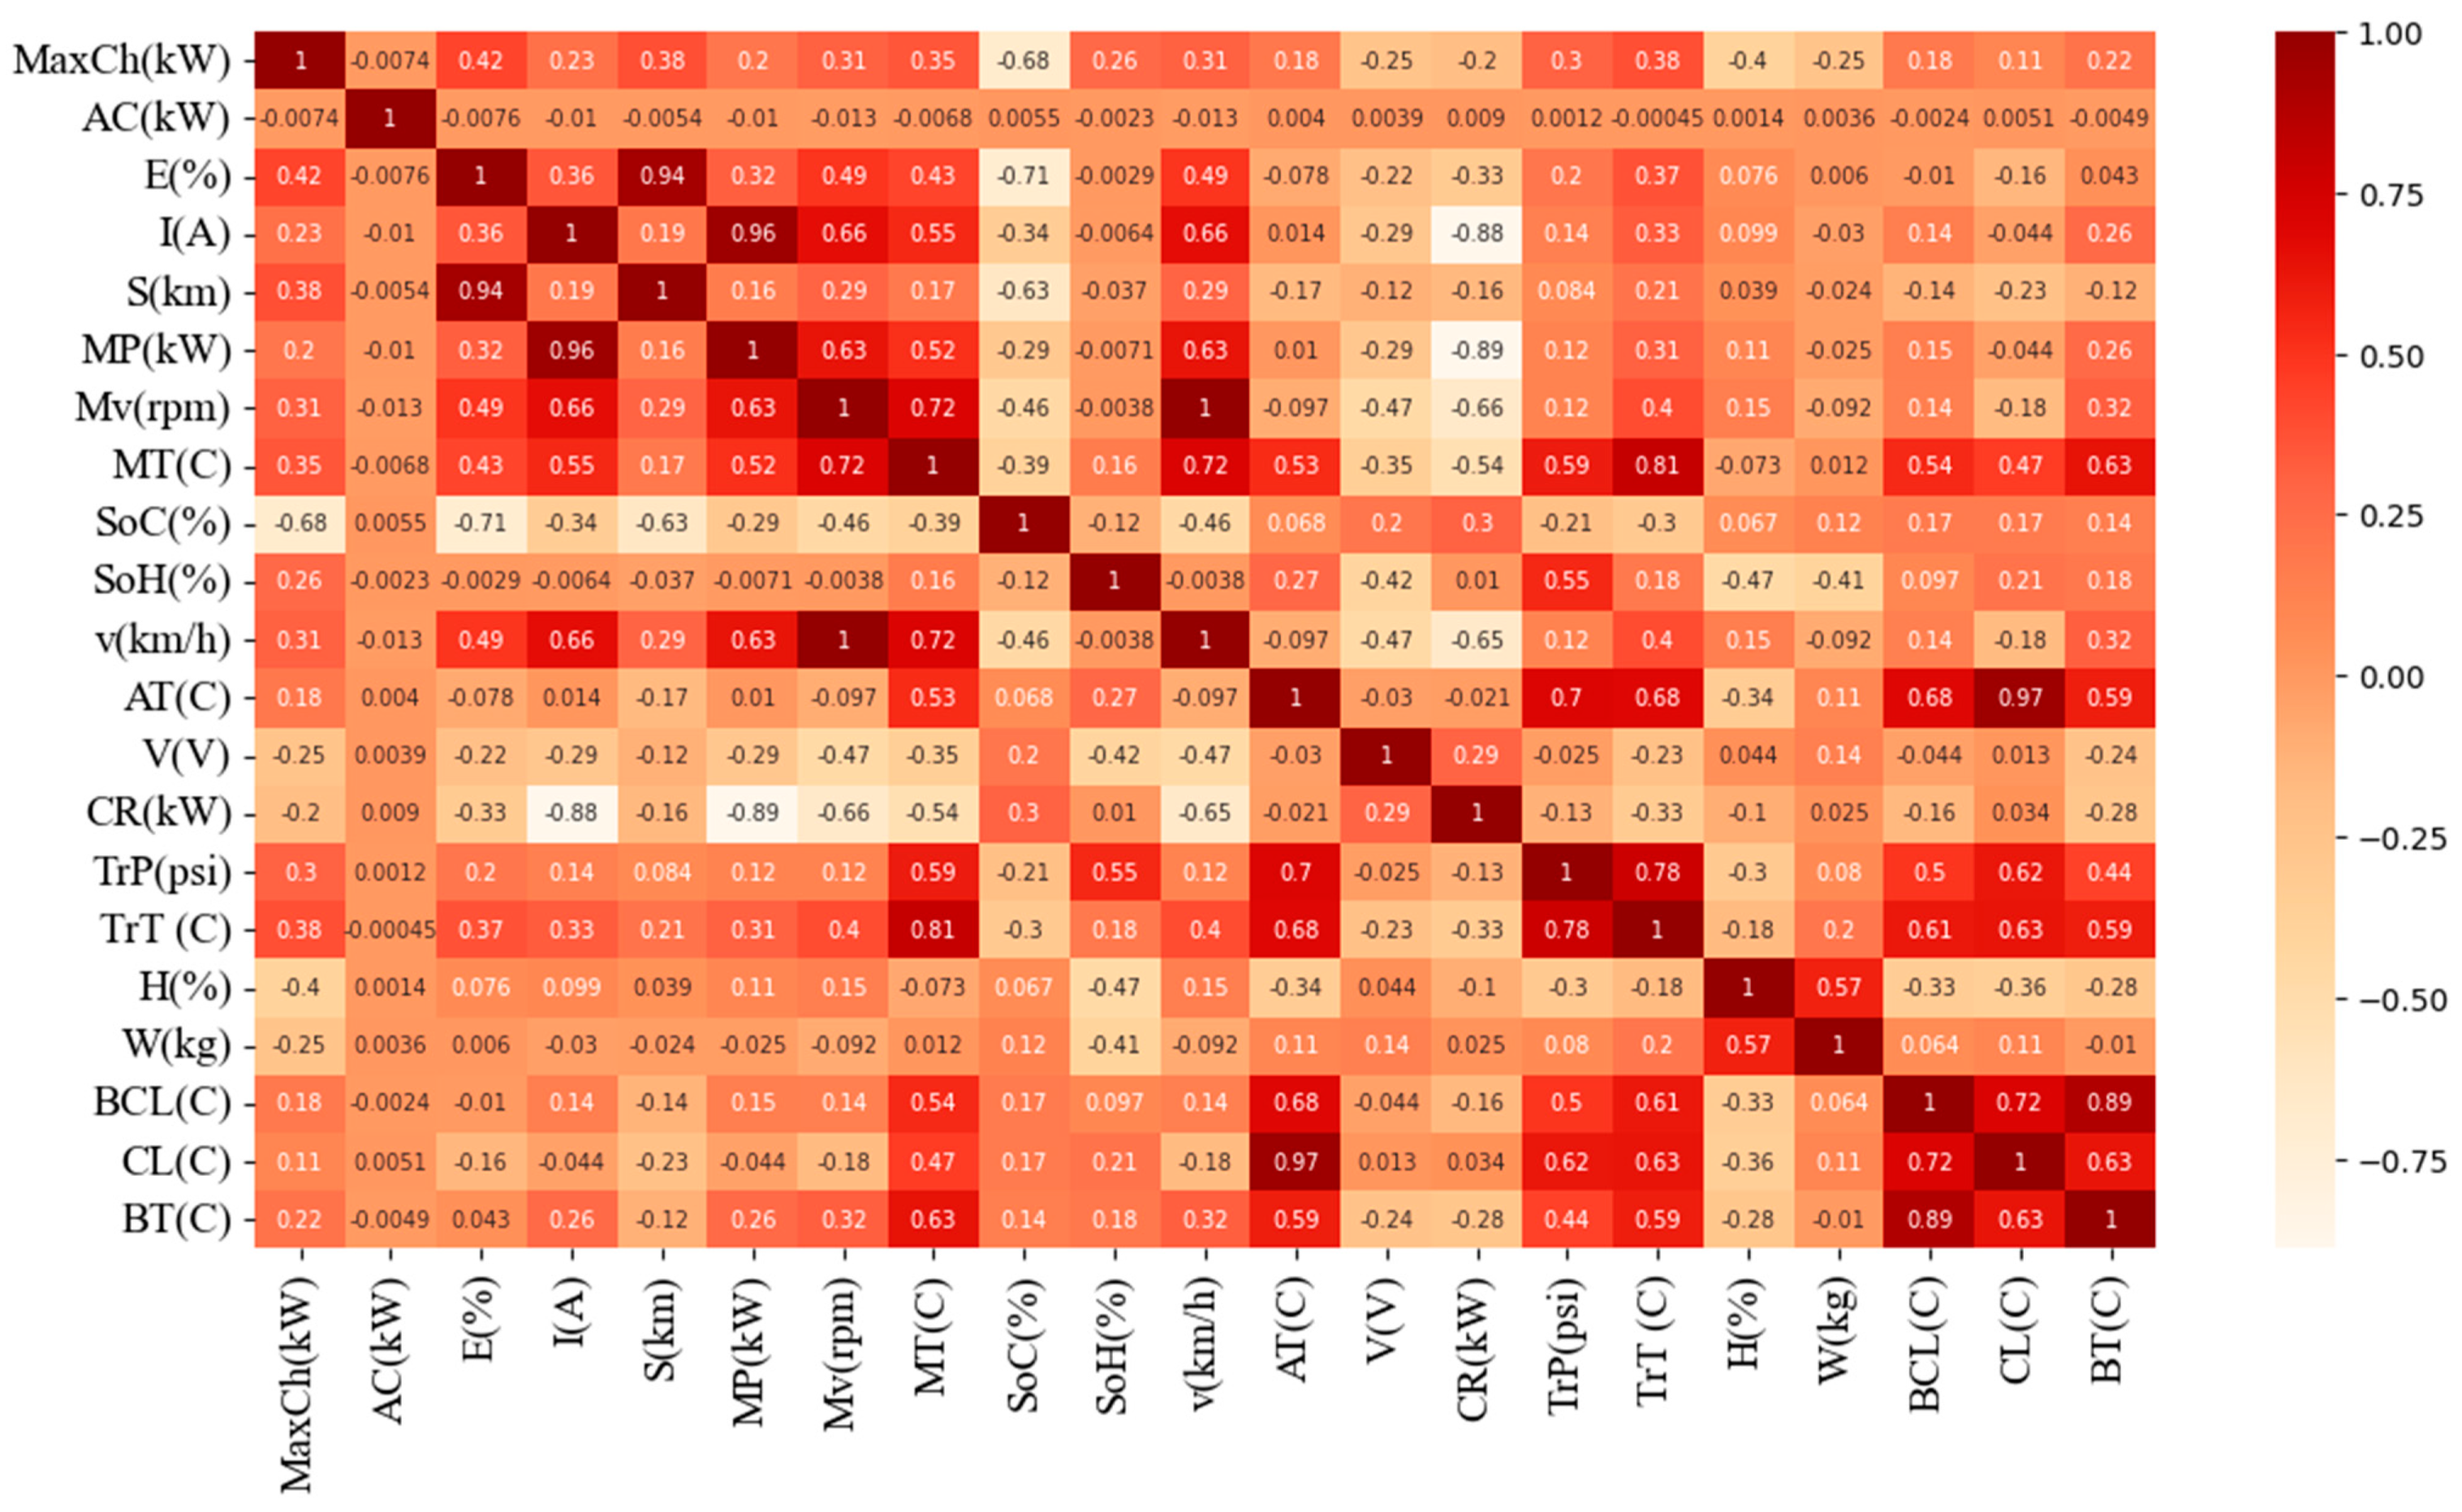
In this section, the results of the Pearson correlation coefficient, selected features, and the evaluation of the prediction accuracy of ML models are provided [17]. It was found that the best R2 score was 0.9003. The effects of input variables on the MLP model while discussing the relationship between the value of a feature and the impact on the prediction were also considered. After the data cleaning process, the data contained 104,424 data rows and 21 features, shown in Figure 7. The shape of the dataset was 104,424 data rows and 14 features, as depicted in Figure 8.

Figure 7.
Overall correlation of 21 features.
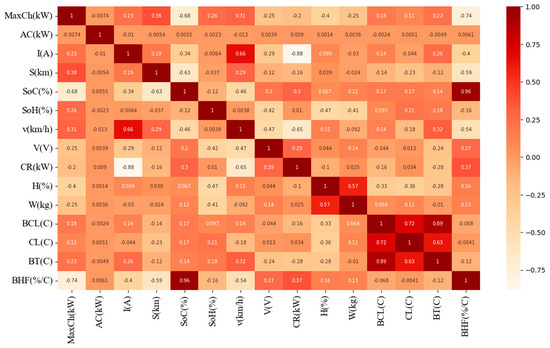
Figure 8.
Correlation between 14 features.
A description of the selected features correlation coefficient is provided in Figure 7. Table 2 shows the variable name, the range of each variable, the mean, and the standard deviation (SD). We classify the features in Table 2 into five groups as follows: (1) battery conditions including maximum charge (MaxCh), charging rate (CR), battery current (I), battery voltage (V), state of charge (SoC), state of health (SoH), and battery temperature (BT); (2) vehicle motion including velocity (v) and distance (s); (3) the ambient environment group defined as humidity (H); (4) the payload variable defined as weight (W); and (5) the cooling system including battery coolant (BCL), coolant (CL), and air compressor (AC) with the battery health factor (BHF) as the output. In this study, the battery health factor (BHF) is defined as the ratio between the state of health and the battery temperature, which could reflect the thermal behavior inside the batteries.
Table 2.
Variables of the dataset.
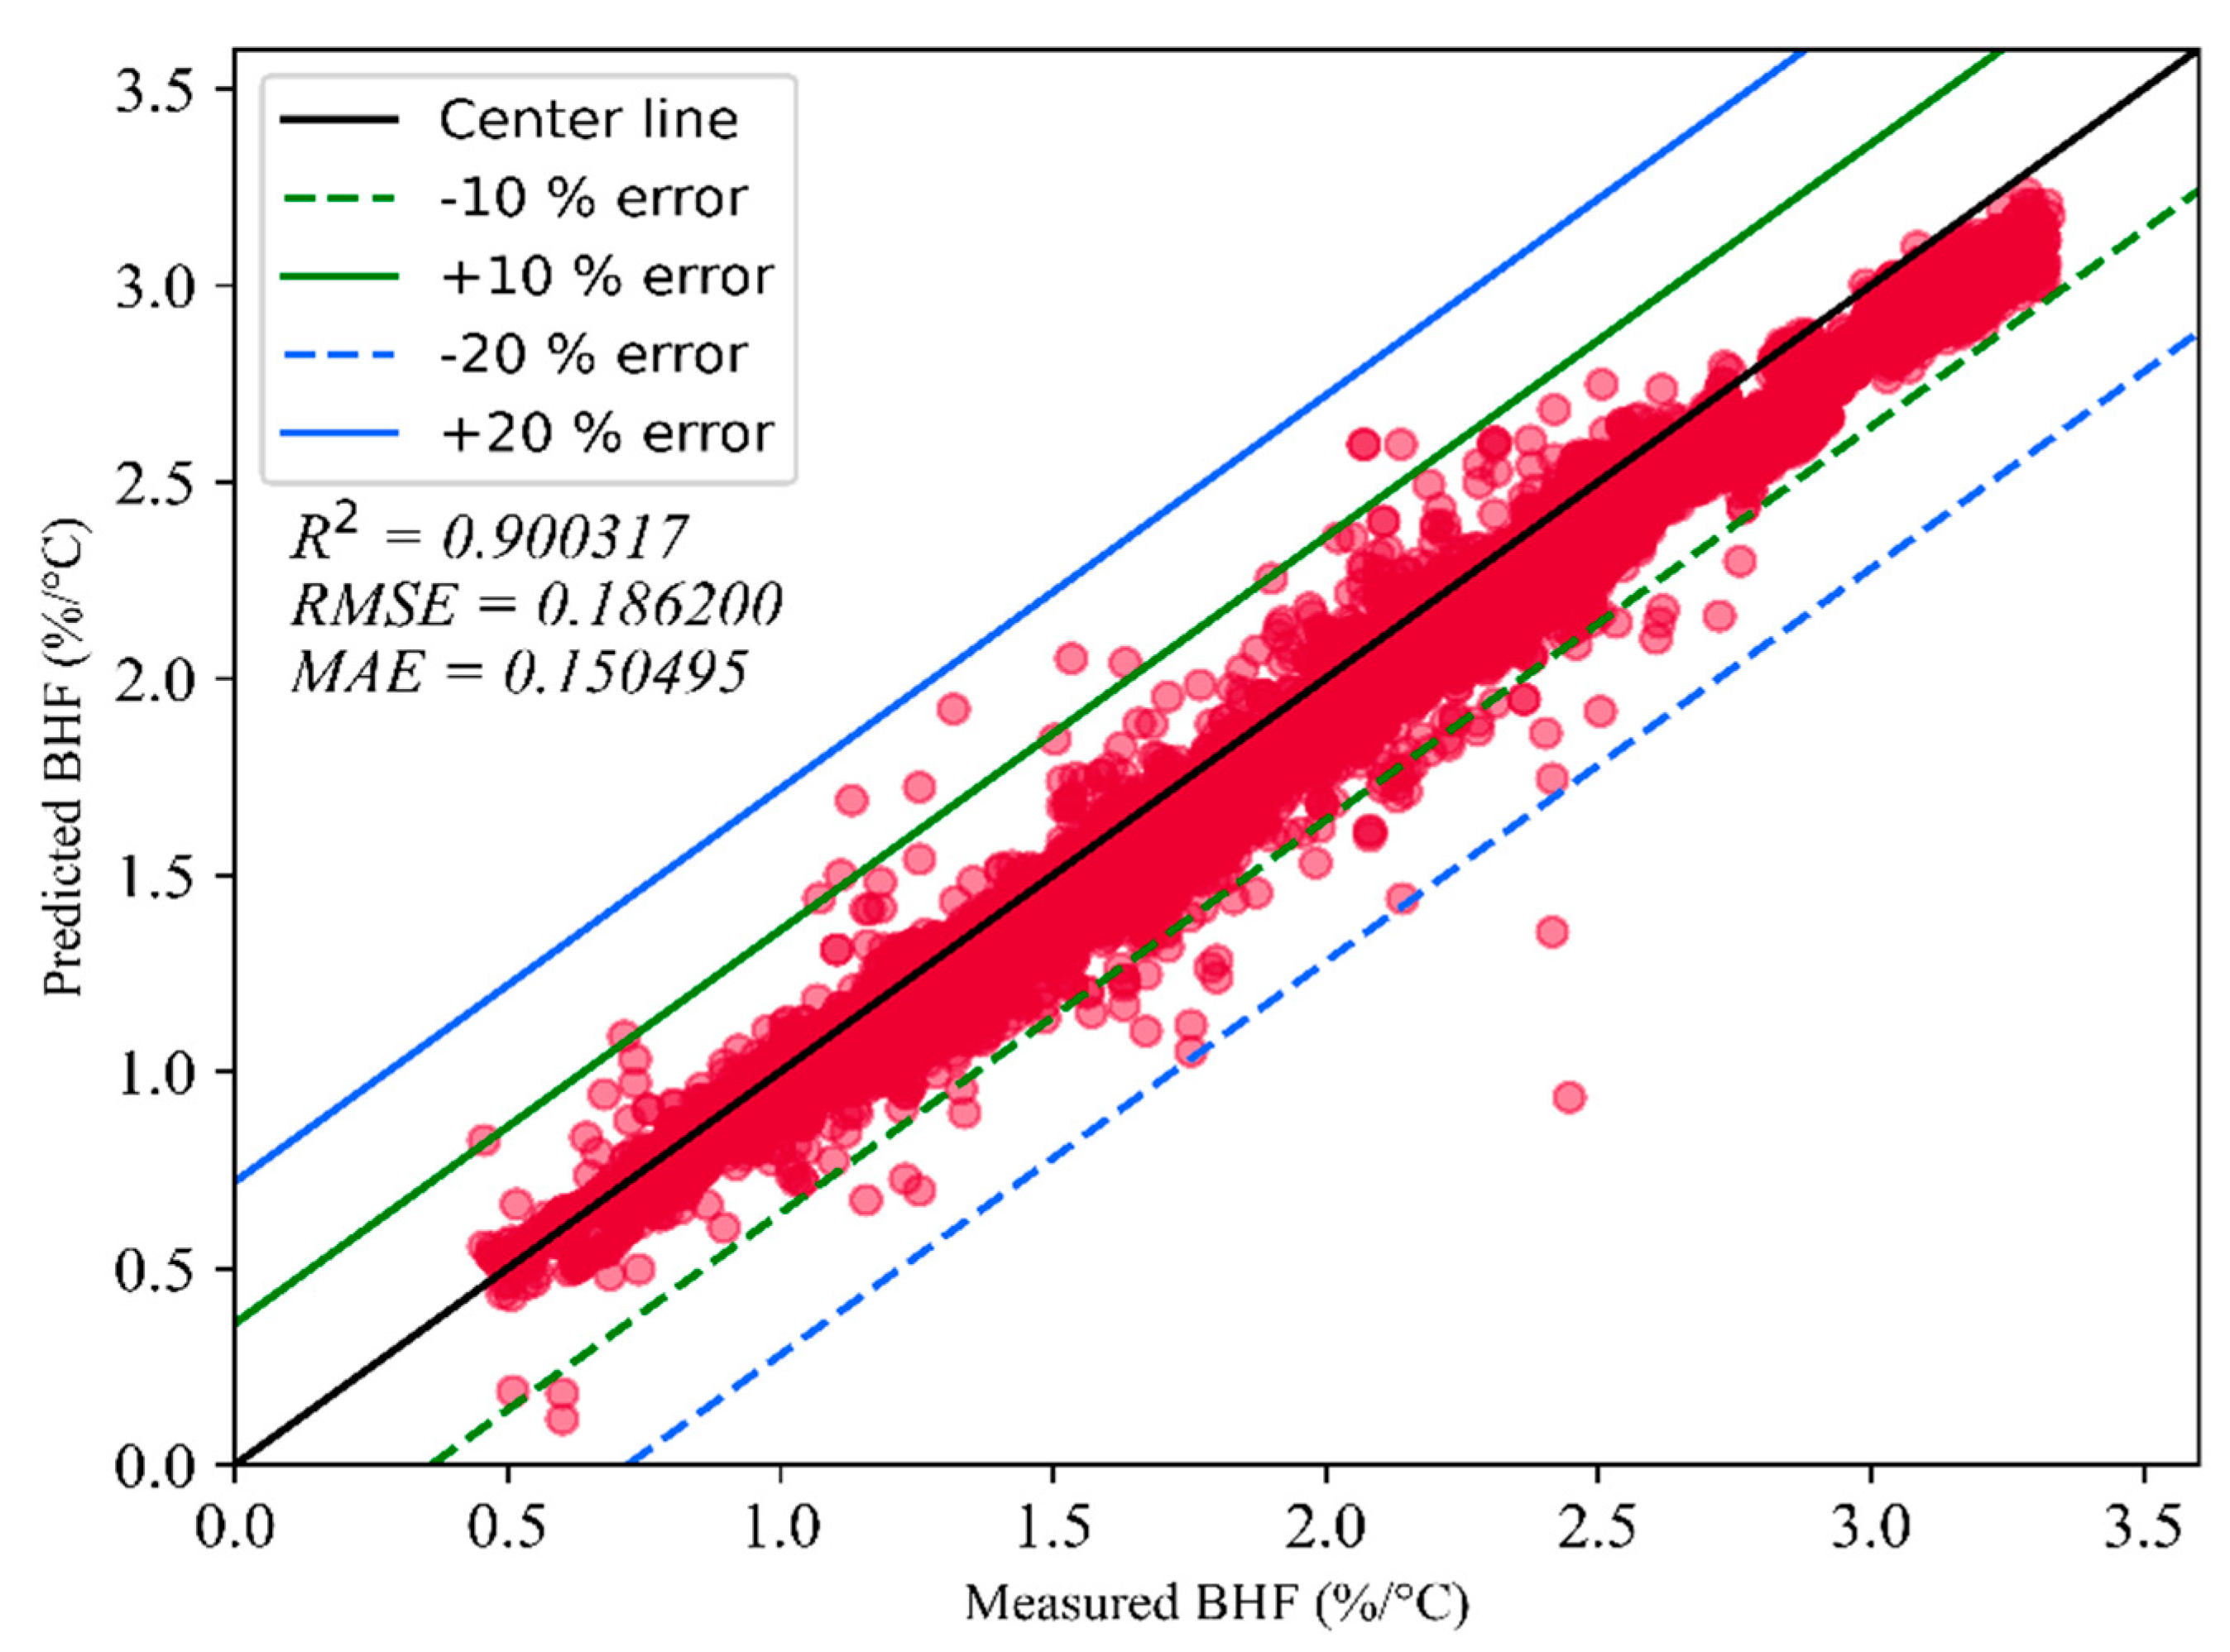
The evidence in Figure 9 shows the accuracy of the MLP model by plotting between battery health factors measured through testing and predicted battery health factors. Based on our findings, the accuracy results of R2, RMSE, and MAE are 0.900317, 0.186200, and 0.150495, as can be seen in the figure below. The central line represents the ideal estimation, while the green and blue lines in different colors represent the margins of error, with ±10% and ±20% boundaries, respectively. The predominant observation is that the majority of predicted data points align closely with the central line, signifying the model’s high accuracy in its predictions.

Figure 9.
MLP model performance.
The summary plot combines information about feature importance and feature effects. Each point within the summary plot represents a Shapley value for a specific feature and instance [18]. The vertical position of a point is determined by the feature, while the horizontal position is determined by the Shapley value. The color of the point indicates the feature’s value, transitioning from low to high. In the case of overlapping points, they are slightly shifted along the y-axis to provide an overview of the distribution of Shapley values for each feature. The features are organized based on their level of importance. The summary plot offers initial insights into the relationship between a feature’s value and its impact on predictions, as shown in Figure 10.
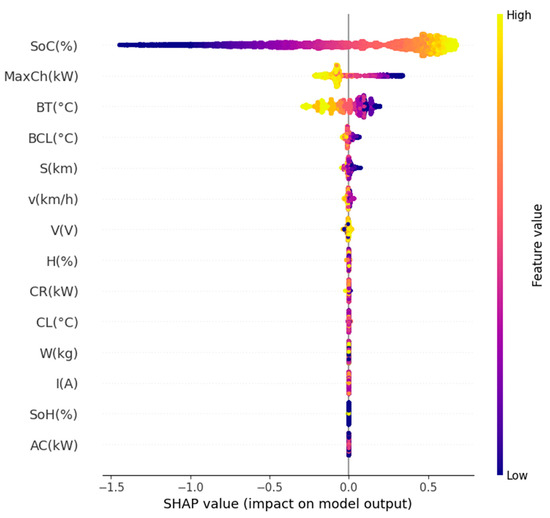
Figure 10.
SHAP summary plot.
The features are arranged based on their influence on predictions, allowing us to understand how both higher and lower feature values impact the outcomes. Each of the small dots on the plot represents an individual observation. The horizontal axis corresponds to the SHAP value, while the point’s color indicates whether the observation has a value that is higher or lower in comparison to other observations. Among all the features, the state of charge (SoC) is impacted by the factors of battery health (BHF), and it can be interpreted that higher SoCs have a positive impact on the prediction although lower values have a negative impact. On the contrary, higher max charge (MaxCh) and battery temperature (BT) have a negative impact on the prediction, while lower values have a positive impact. In the context of predefined variable groups, it is noteworthy that the majority of battery-related groups exert a detrimental effect on the prediction, whereas lower values within these groups tend to have a beneficial impact. In comparison with the other variable group, it can be seen that the other group of variables is not impacted by the battery health factor value.
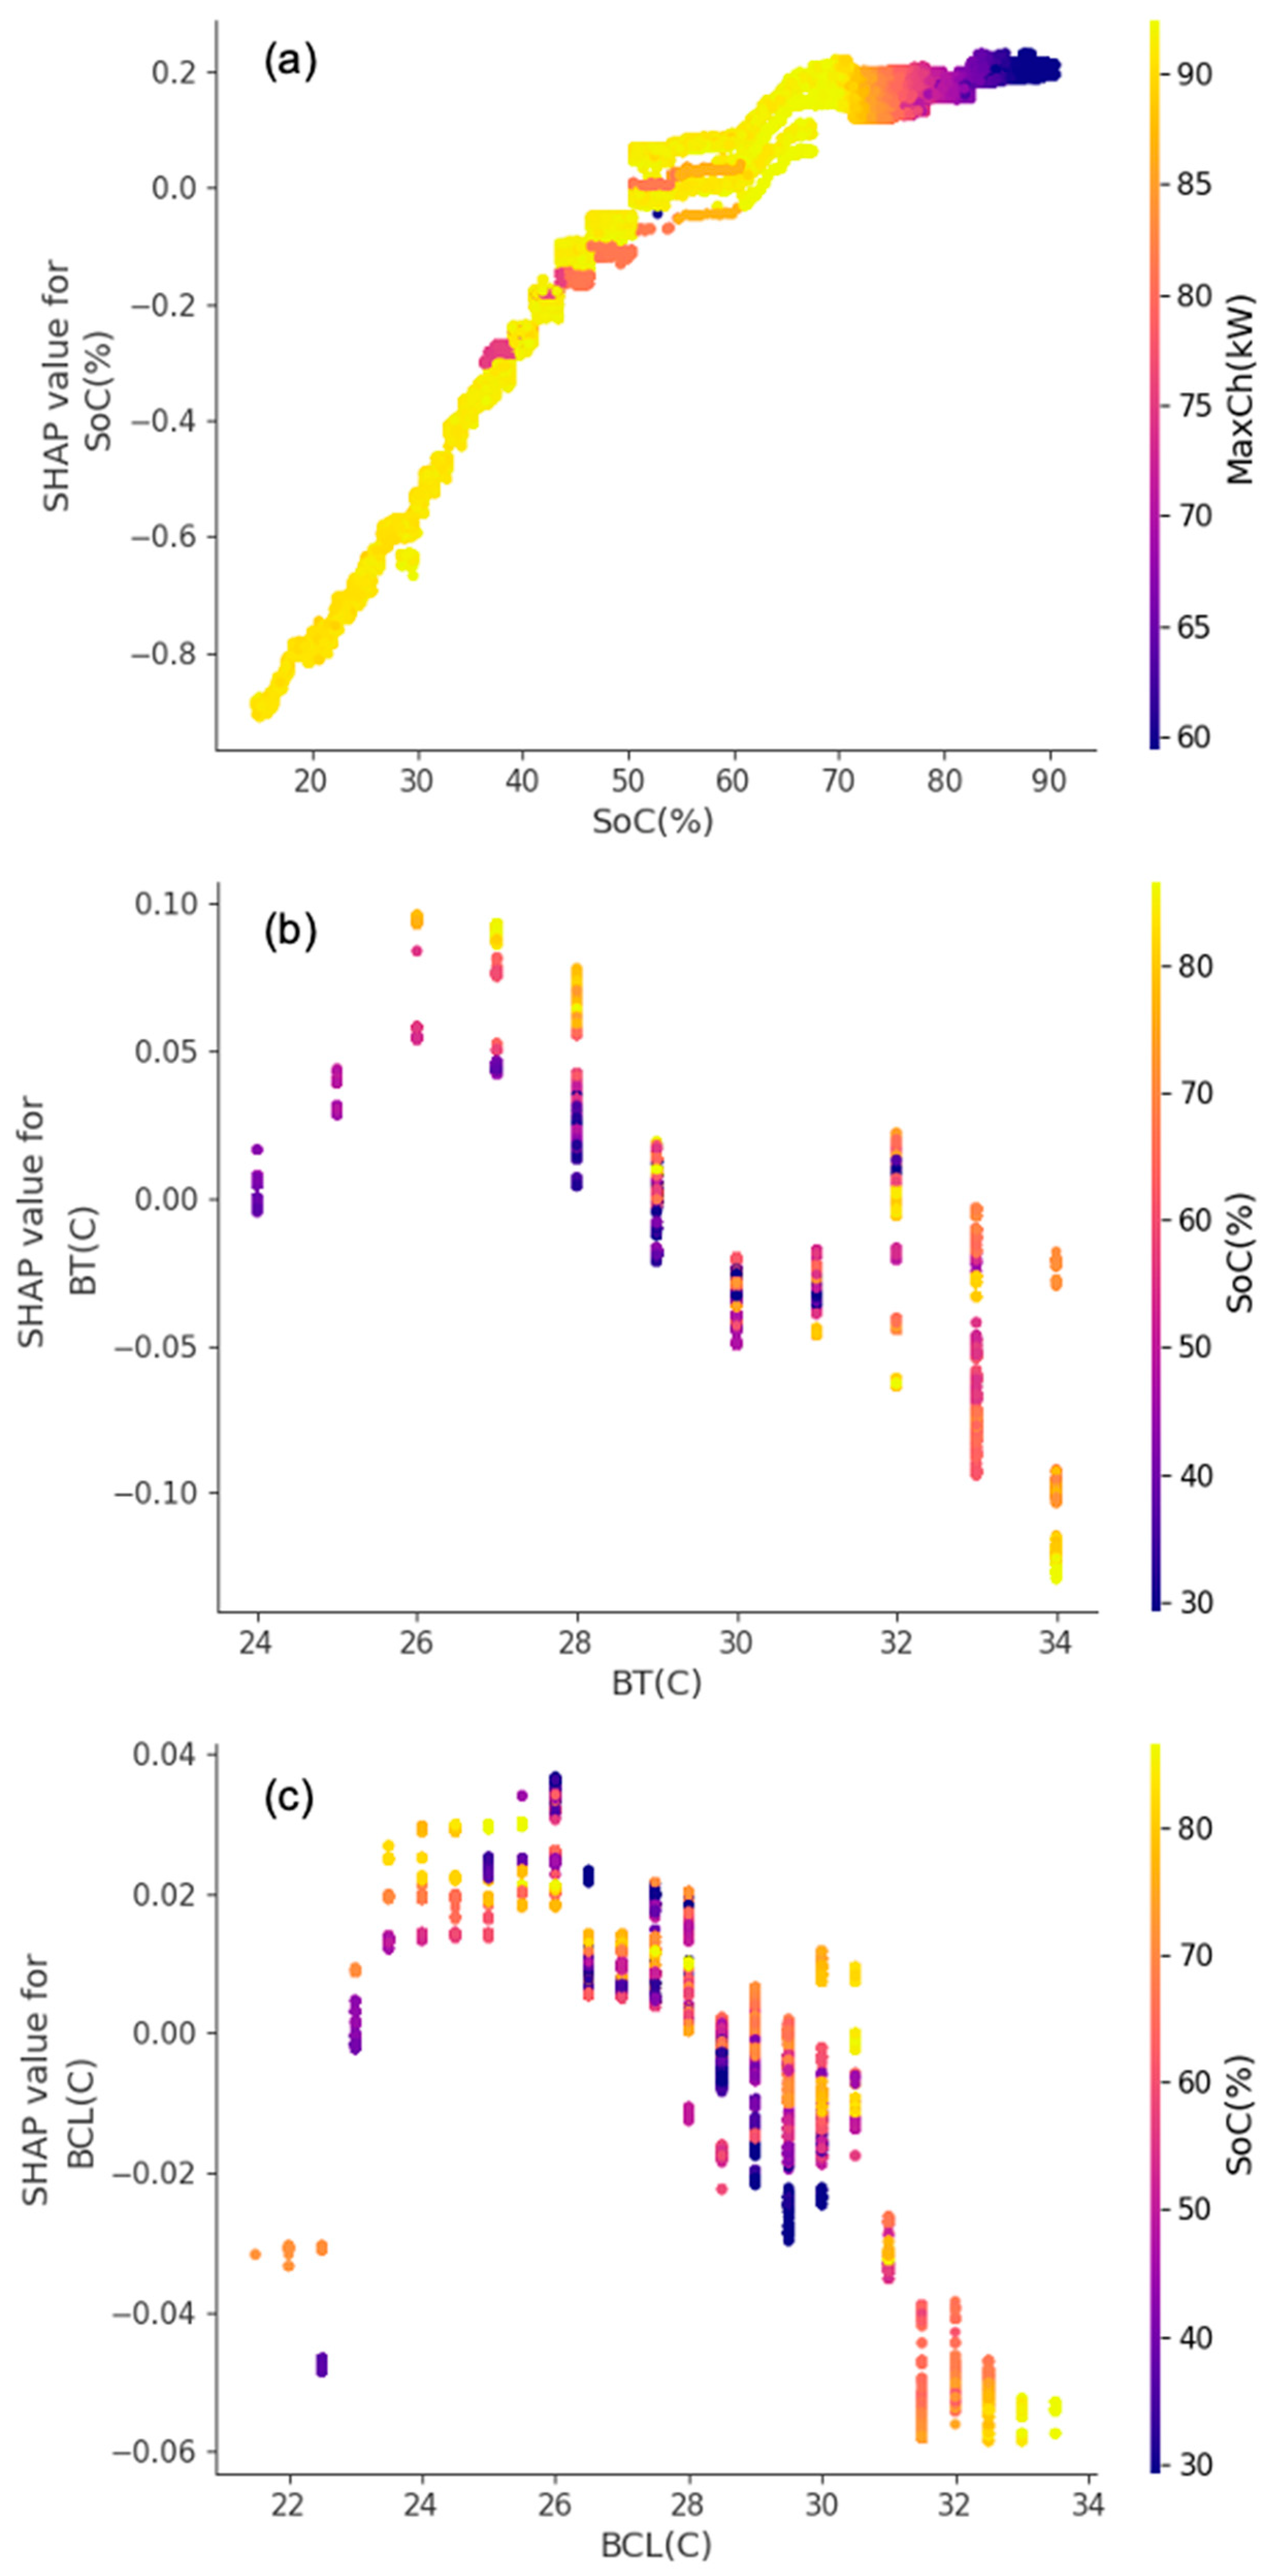
Moreover, the SHAP dependence plot is used to describe the inter-relationship among the four main features that most significantly affect the output, as shown in Figure 11.

Figure 11.
The SHAP dependence plot: (a) SoC-MaxCh, (b) BT-SoC, and (c) BCL-SoC.
The SHAP dependence plot acts as a visualization tool that clarifies the relationship between features and model predictions. It shows how this relationship changes as feature values vary, with the feature of interest on the x-axis and the corresponding SHAP value on the y-axis. Each point on the scatter plot represents an instance from the dataset, showing feature values and their associated SHAP values. In this way, SHAP values help in understanding the model’s behavior and identifying significant features, highlighting those that are less important and providing insights for improving the model. Additionally, the SHAP library offers various visualization techniques for the better understanding and debugging of models.
Figure 11a illustrates the relationship between the BHF of SoC and MaxCh. It was observed that SoC caused a significant increase in BHF within the range of 20–70%. The yellow band indicates that this range also led to an increase in the MaxCh value, which then gradually decreased after 70%. This suggests that when the SoC value is low, the MaxCh value needs to be increased more to return the SoC to its normal state. Beyond 70%, the MaxCh value decreases gradually when the SoC is between 70 and 90%. Therefore, a low SoC has a negative effect on BHF as it requires a high MaxCh value, whereas a high SoC has a positive effect on BHF since it requires only a small amount of MaxCh. The SoC significantly impacts battery health, particularly for lithium-ion batteries. Maintaining a mid-range SoC (around 20–80%) helps prolong battery life by reducing voltage and thermal stress, which are more pronounced at high SoC levels. A high SoC can accelerate chemical degradation, leading to capacity fade and reduced cycle life, while a low SoC can also cause voltage stress. Batteries stored at high SoC levels degrade faster over time due to calendar aging. To optimize battery health, it is advisable to avoid frequent full charges and discharges, manage operating temperatures, and use proper charging practices to prevent overcharging [19,20].
Moreover, charging a battery to its maximum capacity (100%) can negatively impact battery health by increasing voltage and thermal stress, accelerating the degradation of internal components and reducing lifespan. Fully charged batteries generate more heat, especially during intensive use, leading to faster capacity fade and a higher risk of thermal runaway. High charge levels also promote the growth of the solid electrolyte interphase (SEI) layer, increasing internal resistance and reducing efficiency. Additionally, batteries stored at full charge degrade faster over time due to calendar aging [21,22].
Figure 11b illustrates the relationship between the BHF of BT and SoC. It was observed that an increase in BT had a significant negative effect on BHF within the range of 27–34 °C. Furthermore, it was found that when BT is low, the SoC value is also low. Conversely, higher BT values correspond to higher SoC values. This relationship is similar to that shown in Figure 11c, which describes the relationship between BCL and SoC. As BCL increases, the BHF value decreases significantly within the range of 24–34 °C. Battery temperature significantly impacts battery health for lithium-ion batteries. High temperatures accelerate chemical reactions, leading to the faster degradation of electrolytes and electrode materials, which reduces capacity and shortens lifespan [23,24]. Excessive heat can also cause thermal runaway, posing safety risks. Conversely, low temperatures decrease battery performance and increase internal resistance, potentially causing irreversible damage like lithium plating. Battery coolant systems are crucial as they regulate the temperature within optimal ranges, typically 20–30 °C, preventing overheating during charging and discharging [25,26]. This regulation enhances battery efficiency, extends lifespan by reducing degradation, and improves overall safety by preventing thermal runaway. Efficient temperature management through coolant systems ensures consistent performance and safety across various environmental conditions, crucial for applications like electric vehicles and renewable energy storage.
It is clear that there is great potential in utilizing ML to develop predictive models for battery thermal health checks within BEVs. However, it should be noted that neural networks like the MLP model are typically most effective when physics-based models are either unavailable or insufficient. This limitation suggests a need for a careful evaluation of model choice depending on the availability of physics-based approaches. Looking ahead, future work should focus on refining the MLP model, potentially integrating it with physics-based models to enhance predictive accuracy and robustness. Expanding the model’s application to related fields could also provide valuable insights.
4. Conclusions
This study developed an MLP model for forecasting battery health factors in real-world test vehicles. We found that the accuracy results of R2, RMSE, and MAE of the MLP model are 0.900317, 0.186200, and 0.150495. Moreover, the MLP model effectively describes the impact of different features on BHF. It was found that the three features with the most significant impact on BHF are SoC, MaxCh, and BT. Hence, the system’s ability to assess the battery’s thermal heath plays a crucial role in enabling well-informed decisions and enhancing overall system safety [27]. By using large amounts of real-world data, these models demonstrate remarkable accuracy and computational efficiency. The findings emphasize the potential of machine learning techniques to improve accuracy and performance when applied to significant datasets. However, limitations of the present approach exist, especially when physics-based models are not available. For future works, refinement of the present MLP model may be carried out and the relevant physics-learned models may be integrated. Overall, it could be stated that there is potential for the use of utilizing machine learning algorithms in creating predictive models for battery health factors within BEVs, with the potential for extending their application to related fields.
5. Declaration of Generative AI and AI-Assisted Technologies in the Writing Process
During the preparation of this work, the authors used ChatGPT in order to improve the grammar and readability of the MS. After using this tool/service, the authors reviewed and edited the content as needed and take full responsibility for the content of the publication.
Author Contributions
Conceptualization, N.T., P.S. and W.A.; Methodology, W.A. and Y.M. Software, T.K.; Formal Analysis, N.S., T.K., P.S. and W.A.; Investigation, N.S., T.K. and Y.M.; Data Curation, N.S.; Writing—Original Draft Preparation, N.S. and T.K.; Writing—Review and Editing, N.T. and K.Y.T.; Supervision, N.T.; Funding Acquisition, N.T. All authors have read and agreed to the published version of the manuscript.
Funding
This project is partially funded by National Research Council of Thailand (NRCT): contract no. N42A671047 and Chiang Mai University (CMU).
Data Availability Statement
Data can be made available upon reasonable request.
Conflicts of Interest
The authors declare no conflicts of interest.
References
- Jiang, M.; Wang, B.; Hao, Y.; Chen, S.; Wen, Y.; Yang, Z. Quantification of CO2 emissions in transportation: An empirical analysis by modal shift from road to waterway transport in Zhejiang, China. Transp. Policy 2024, 145, 177–186. [Google Scholar] [CrossRef]
- Paw, J.K.S.; Kiong, T.S.; Kamarulzaman, M.K.; Adam, A.; Hisham, S.; Kadirgama, K.; Ramasamy, D.; Yaw, C.T.; Yusop, A.F.; Yusaf, T.; et al. Advancing renewable fuel integration: A comprehensive response surface methodology approach for internal combustion engine performance and emissions optimization. Heliyon 2023, 9, e22238. [Google Scholar] [CrossRef] [PubMed]
- Achariyaviriya, W.; Suttakul, P.; Phuphisith, S.; Mona, Y.; Wanison, R.; Phermkorn, P. Potential reductions of CO2 emissions from the transition to electric vehicles: Thailand’s scenarios towards 2030. Energy Rep. 2023, 9, 124–130. [Google Scholar] [CrossRef]
- Rauf, M.; Kumar, L.; Zulkifli, S.A. Aspects of artificial intelligence in future electric vehicle technology for sustainable environmental impact. Environ. Chall. 2024, 14, 100854. [Google Scholar] [CrossRef]
- Choi, W.; Yoo, E.; Seol, E.; Kim, M.; Song, H.H. Greenhouse gas emissions of conventional and alternative vehicles: Predictions based on energy policy analysis in South Korea. Appl. Energy 2024, 265, 114754. [Google Scholar] [CrossRef]
- Sukkam, N.; Onsree, T.; Tippayawong, N. Overview of machine learning applications to battery thermal management systems in electric vehicles. AIP Conf. Proc. 2022, 2681, 020004. [Google Scholar]
- Cheng, P.; Jianjun, X.; Kumar, J.; Almujibah, H.; Ali, H.E.; Alkhalifah, T.; Alkhalaf, S.; Alturise, F.; Ghandour, R. Improving efficiency and optimizing heat transfer in a novel tesla valve through multi-layer perceptron models. Case Stud. Therm. Eng. 2023, 49, 103391. [Google Scholar] [CrossRef]
- Achariyaviriya, W.; Wongsapai, W.; Janpoom, K.; Katongtung, T.; Mona, Y.; Tippayawong, N.; Suttakul, P. Estimating energy consumption of battery electric vehicles using vehicle sensor data and machine learning approaches. Energies 2023, 16, 6351. [Google Scholar] [CrossRef]
- Ren, H.; Yin, L.; Dang, C.; Wu, S.; Jia, L.; Yang, L. Experimental investigation on battery thermal management using phase change materials with different arrangement schemes. Appl. Therm. Eng. 2024, 255, 123991. [Google Scholar] [CrossRef]
- Pruekpramool, C.; Jaroentaku, N.; Srisuttiyakorn, S. Efficiency of Pearson, Spearman and Kendall’s correlation coefficients when data is non-normal distributed. J. Educ. 2020, 15, 1–6. [Google Scholar]
- Carlsson, L. Using Multilayer Perceptrons as Means to Predict the End-Point Temperature in an Electric Arc Furnace. Master’s Thesis, Department of Material Science and Engineering, KTH Royal Institute of Technoligy, Stockholm, Sweden, 2015. [Google Scholar]
- Elmaz, F.; Yücel, Ö.; Mutlu, A.Y. Predictive modeling of biomass gasification with machine learning-based regression methods. Energy 2020, 191, 116541. [Google Scholar] [CrossRef]
- Katongtung, T.; Phromphithak, S.; Onsree, T.; Tippayawong, N. Machine learning approach for predicting hydrothermal liquefaction of lignocellulosic biomass. Bioenergy Res. 2024, 1–13. [Google Scholar] [CrossRef]
- Wongchai, W.; Onsree, T.; Sukkam, N.; Promwungkwa, A.; Tippayawong, N. Machine learning models for estimating above ground biomass of fast growing trees. Expert Syst. Appl. 2022, 199, 117186. [Google Scholar] [CrossRef]
- Janpoom, K.; Suttakul, P.; Achariyaviriya, W.; Fongsamootr, T.; Katongtung, T.; Tippayawong, N. Investigating the influential factors in real-world energy consumption of battery electric vehicles. Energy Rep. 2023, 9, 316–320. [Google Scholar] [CrossRef]
- Lundberg, S.; Lee, S.-I. A unified approach to interpreting model predictions. In Proceedings of the 31st Conference on Neural Information Processing Systems, Long Beach, CA, USA, 4–9 December 2017; pp. 4768–4777. [Google Scholar]
- Gong, H.; Li, Y.; Zhang, J.; Zhang, B.; Wang, X. A new filter feature selection algorithm for classification task by ensembling pearson correlation coefficient and mutual information. Eng. Appl. Artif. Intell. 2024, 131, 107865. [Google Scholar] [CrossRef]
- Antonini, A.S.; Tanzola, J.; Asiain, L.; Ferracutti, G.R.; Castro, S.M.; Bjerg, E.A.; Ganuza, M.L. Machine learning model interpretability using SHAP values: Application to igneous rock classification task. Appl. Comput. Geosci. 2024, 23, 100178. [Google Scholar] [CrossRef]
- Valverde, A.; Quintero, V.; Jaramillo, F.; Perez, A.; Orchard, M. Understanding the effect on the state of health of a lithium-ion battery caused by charging at a high current rate. IFAC-Pap. 2023, 56, 11930–11935. [Google Scholar] [CrossRef]
- Wang, C.; Cui, N.; Cui, Z.; Yuan, H.; Zhang, C. Fusion estimation of lithium-ion battery state of charge and state of health considering the effect of temperature. J. Energy Storage 2022, 53, 105075. [Google Scholar] [CrossRef]
- Hu, W.; Zhang, C.; Liu, S.; Jin, L.; Xu, Z. Multi-objective optimization estimation of state of health for lithium-ion battery based on constant current charging profile. J. Energy Storage 2024, 83, 110785. [Google Scholar] [CrossRef]
- Zhu, Z.; Zhu, J.; Gao, W.; Sun, Y.; Jin, C.; Zheng, Y. Estimation methods for the state of charge and capacity in various states of health of LiFePO4 batteries. J. Energy Storage 2024, 88, 111381. [Google Scholar] [CrossRef]
- Pelosi, D.; Gallorini, F.; Ottaviano, P.; Barelli, L. Real-time lithium-ion battery state of health evaluation based on discrete wavelet transform: The effect of operating temperature. J. Power Sources Adv. 2024, 26, 100136. [Google Scholar] [CrossRef]
- Kumar, K.; Rithvik, G.; Mittal, G.; Arya, R.; Sharma, T.K.; Pareek, K. Impact of fast charging and low-temperature cycling on lithium-ion battery health: A comparative analysis. J. Energy Storage 2024, 94, 112580. [Google Scholar] [CrossRef]
- Youssef, R.; Kalogiannis, T.; Behi, H.; Pirooz, A.; Van Mierlo, J.; Berecibar, M. A comprehensive review of novel cooling techniques and heat transfer coolant mediums investigated for battery thermal management systems in electric vehicles. Energy Rep. 2023, 10, 1014–1068. [Google Scholar] [CrossRef]
- Xu, Y.; Zhang, Y.; Zeng, M.; Huang, X.; Wang, Z. An electrothermal coupling model for estimating the internal temperature of lithium-ion battery based on microthermal resistance method. Electrochem. Commun. 2024, 166, 107776. [Google Scholar] [CrossRef]
- Zhang, R.; Li, X.; Sun, C.; Yang, S.; Tian, Y.; Tian, J. State of charge and temperature joint estimation based on ultrasonic reflection waves for lithium-ion battery applications. Batteries 2023, 9, 335. [Google Scholar] [CrossRef]


Disclaimer/Publisher’s Note: The statements, opinions and data contained in all publications are solely those of the individual author(s) and contributor(s) and not of MDPI and/or the editor(s). MDPI and/or the editor(s) disclaim responsibility for any injury to people or property resulting from any ideas, methods, instructions or products referred to in the content. |
© 2024 by the authors. Licensee MDPI, Basel, Switzerland. This article is an open access article distributed under the terms and conditions of the Creative Commons Attribution (CC BY) license (https://creativecommons.org/licenses/by/4.0/).