Abstract
Cardiometabolic syndrome (CMS) is a growing concern in children and adolescents, marked by obesity, hypertension, insulin resistance, and dyslipidemia. This study aimed to predict CMS using machine learning based on data from the CASPIAN-V study, which involved 14,226 participants aged 7–18 years, with a CMS prevalence of 82.9%. We applied the XGBoost algorithm to analyze key noninvasive variables, including self-rated health, sunlight exposure, screen time, consanguinity, healthy and unhealthy dietary habits, discretionary salt and sugar consumption, birthweight, and birth order, father and mother education, oral hygiene behavior, and family history of dyslipidemia, obesity, hypertension, and diabetes using five-fold cross-validation. The model achieved high sensitivity (94.7% ± 4.8) and specificity (78.8% ± 13.7), with an area under the ROC curve (AUC) of 0.867 ± 0.087, indicating strong predictive performance and significantly outperformed triponderal mass index (TMI) (adjusted paired t-test; p < 0.05). The most critical selected modifiable factors were sunlight exposure, screen time, consanguinity, healthy and unhealthy diet, dietary fat type, and discretionary salt consumption. This study emphasizes the clinical importance of early identification of at-risk individuals to implement timely interventions. It offers a promising tool for CMS risk screening. These findings support using predictive analytics in clinical settings to address the rising CMS epidemic in children and adolescents.
1. Introduction
Cardiometabolic syndrome (CMS) is a common metabolic dysfunction characterized by having at least one metabolic abnormalities or risk factor, including abnormal anthropometric measures, insulin resistance, systemic arterial hypertension, and hyperlipidemia []. The World Health Organization (WHO), the American Society of Endocrinology, and the National Cholesterol Education Program (NCEP) have recognized CMS as a disease entity []. About 25% of adults worldwide suffer from CMS []. Recent studies have also reported a contemporaneous growth in the incidence and prevalence of youth onset noncommunicable disease that is particularly evident among minority populations []. Hence, detecting metabolic risk factors in childhood is important to prevent future diabetes. Hence, identifying childhood metabolic risk factors is important for preventing future noncommunicable diseases (NCDs) [].
Cardiovascular disease (CVD), the most common NCD, remains the leading cause of death in the Middle East, with ischemic stroke, peripheral vascular diseases, coronary heart disease, cerebrovascular arterial diseases, and myocardial infarctions []. Approximately 20–23% of the burden of diseases and 46% of all deaths in Iran were attributed to CVDs []. Also, the latest Global Burden of Disease (GBD) version revealed that Iran was one of the countries with the highest rate of CVD, with more than 9000 cases stricken by CVD per 100,000 persons []. The sharp rise in cases of cardiometabolic disorders, including type 2 diabetes and hypertension, highlights the urgent need for improved prevention strategies. This shift should move away from a universal approach towards a more individualized, precision-based method for the broader population [].
Cardiometabolic syndrome in children implicates the early start of metabolic dysfunction and related metabolic risk factors (e.g., high blood pressure (BP), dyslipidemia, insulin resistance, hypertension, etc.) in childhood, which are important in the development of the risk of CVDs, and type 2 diabetes mellitus in adulthood []. Therefore, predicting the onset of CMS in advance is significant, which can prevent it from evolving into a more serious disease. Identifying high-risk individuals on a trajectory to develop the disease is used to focus on modifiable risk factors.
In recent years, machine learning (ML) methods have verified improved performance in predicting various diseases or clinical conditions. Compared with other traditional statistical methods like regression modeling, ML models can capture multifaceted, nonlinear relationships and identify unknown correlations in big data, thus enabling deeper perceptions to be gained from clinical data []. With the help of such ML methods, noninvasive indirect indicators that do not require blood samples can be applied to predict CMS, enabling early diagnosis of metabolic syndrome (MS) and CMS in children and adolescents.
While machine learning methods, including the XGBoost algorithm, have been applied to predict various health conditions, the existing studies in this domain predominantly focus on MS rather than CMS [,]. Few studies have been performed to predict cardiometabolic risk factors (CMRs) using noninvasive and low-cost diagnosis methods. Kupusinac et al. developed an initial estimation of CMR using artificial neural networks (ANNs) to assess cardiometabolic risk in a Serbian cohort of 1281 individuals, achieving a model accuracy of 82.76% []. The selected features were gender, age, waist-to-height ratio, body mass index, and systolic and diastolic BP, and the ages of the participants ranged from 18 to 67 years old. Regression logistics is the other approach used by Hollenbeck et al. for predicting the prevalence of CMR factors on the National Health and Nutrition Examination Survey (NHANES) in the United States with a study sample of 5275 adults, achieving an area under the ROC curve (AUC) of 0.77 for abdominal obesity, indicating good discrimination []. This study included all adults aged 18 or older (an average of 45). Ashley-Martin et al. examined the predictive power of the triponderal mass index (TMI) and body mass index (BMI) for cardiometabolic markers in 5814 Canadian children aged 6–19 years, finding both indices to have similar predictive accuracy, achieving AUC values of 0.81 for insulin resistance and 0.83 for having ≥3 abnormal tests []. Ojanen et al. [] conducted a comprehensive study on the early prediction of cardiometabolic syndrome in children and adolescents, following a cohort of 396 Finnish girls (mean age 11.2 years) to early adulthood. They identified key serum metabolic biomarkers such as glycoprotein acetyls (GlycA), large high-density lipoprotein phospholipids (L-HDL-PL), and the apolipoprotein B to apolipoprotein A-1 (ApoB/ApoA) ratio. Using LASSO regression and random intercept cross-lagged panel models, the study achieved AUC values between 0.641 and 0.802, explaining 32.7% to 36.3% of the variance in MS scores, with findings validated across a larger longitudinal cohort of 2664 participants and multiple cross-sectional datasets. Among the studies mentioned above, Ashley-Martin et al. [] and Ojanen et al. [] focused on diagnosing CMS in children and adolescents.
Our research addresses this critical gap by specifically targeting CMS. This more comprehensive construct integrates additional cardiovascular risk factors beyond those typically considered in MS. This distinction is vital, as CMS encompasses a broader array of risk factors, such as BMI, total cholesterol (TC), and low-density lipoprotein-cholesterol (LDL-C), which are more directly linked to cardiovascular diseases. Our study applies machine learning methods, particularly extreme gradient boosting (XGBoost), to predict CMS in children using noninvasive factors, providing a more holistic and accurate assessment of cardiovascular risks from an early age.
The rationale for focusing on CMS over MS lies in its ability to offer a more comprehensive evaluation of a child’s health by considering both metabolic and cardiovascular risks. This broader perspective is crucial for early identification and intervention in children who may be at an elevated risk of cardiovascular diseases later in life. By addressing CMS, our study aims to provide a robust and comprehensive tool for early risk stratification in pediatric populations. Rather than the more narrowly defined MS, this focus on CMS represents a significant and novel contribution to the field. We have thoroughly revised our manuscript to highlight this distinction, emphasizing the importance of our approach in advancing the prediction and prevention of cardiovascular diseases from an early age. Furthermore, our research stands out in the literature by being the first to explore and predict CMS using a variety of noninvasive risk factors in a pediatric population, filling a critical gap and offering a new direction for future studies.
2. Materials and Methods
2.1. Materials
Data for this study were taken from part of the “National survey of school student high risk 86 behaviors”, started in 2014. The data were collected in a comprehensive database entitled “The Prevalence and Dissemination of Non-Communicable Diseases in Children and Adolescents (CASPIAN-V)” [].
The study population was children aged 7–18 years; all were in primary and secondary schools and came from urban and rural areas. The sampling was conducted in 30 provinces of Iran according to sex (male and female), place of residence (rural and urban), and educational level (primary and secondary) via stratified clustering sampling method []. The dataset is a collection of 510 features with a sample size 14,226. The protocol was mainly based on the WHO-Global School student Health Survey. A minimal dataset is included in the Supplementary Material.
2.2. Procedure and Measurements
2.2.1. Questionnaires
Two sets of questionnaires were developed for both students and their parents. The student questionnaire was adapted from the Persian-translated version of the WHO’s Global School-based Student Health Survey (WHO-GSHS). The reliability and validity of these questionnaires have been previously established. Eligible students were identified, and questions regarding their health status and health-related behaviors were explained using simple language. Subsequently, the students’ parents were invited to complete a separate questionnaire, which collected information on family characteristics, including household size, socioeconomic variables, and the student’s birth order. A team of healthcare professionals supervised and controlled the process []. The questionnaire included different aspects, such as variables related to students’ schools, counseling with family members, and parameters related to health status, living environment, screen time, and lifestyle components.
2.2.2. Anthropometric Measurements
The information was recorded by a team of trained healthcare experts based on approved checklists. All team members were instructed to calibrate the data according to protocols and standards. The physical measurements were as follows: BMI defines obesity and is calculated as the ratio of body mass and the square of body height. The subjects were asked to wear light clothes, and their body weight was measured on a scale placed on flat ground with a precision of 0.1 kg. Their height was measured without shoes to the nearest 0.1 cm. The WHO growth charts were used to categorize BMI []. The waist circumferences were measured with nonelastic tape with a precision of 0.1 cm around the point halfway between the iliac crest and the sides of the lower ribs []. Hip circumference was measured at the widest point around the buttocks to the nearest 0.1 cm []. Wrist circumference was measured with the precision of 0.1 cm using a tape meter on the dominant arm while subjects held their arm on a flat surface like a table. The measuring tape was positioned over the Lister tubercle of the distal radius and the distal ulna []. Neck circumference was measured using nonelastic tape with an accuracy of 0.1 cm at the lower margin of the thyroid cartilage, with the head erect [].
2.2.3. Blood Pressure Measurement
BP was measured on the right arm using a mercury sphygmomanometer with an appropriately sized cuff. BP measurement was carried out two times at 5 min intervals. Then, the average systolic and diastolic pressures were registered [].
2.2.4. Blood Sampling
Blood samples were drawn from selected students. After 12 h overnight fasting, a 6 mL venous blood sample was collected from the students whose parents accompanied them. The blood samples were centrifuged at 2500–3000× g for 10 min. The resulting serum was divided into 200-microliter tubes and stored at −70 °C. Then, the samples were transferred to a referral laboratory by a cold chain. Fasting blood glucose (FBG), TC, triglyceride (TG), high-density lipoprotein-cholesterol (HDL-C), and LDL-C concentrations were determined using a Hitachi autoanalyzer (Tokyo, Japan). The flow chart of the CASPIAN-V study is presented in Figure 1.
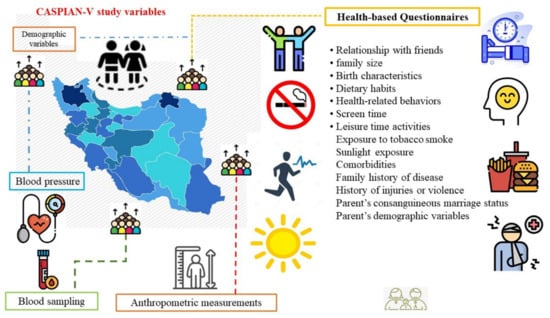
Figure 1.
Flow chart of the Prevalence and Dissemination of Non-Communicable Diseases in Children and Adolescents (CASPIAN-V) study design.
2.2.5. Outcome Definition
We used metabolic syndrome defined as central obesity (waist circumference (WC) ≥ 80 cm for women; WC ≥ 90 cm for men aged 16 years or older; WC > 90th percentile for age and sex) plus any two or more of the following components: high FBG (FBG ≥ 100 mg/dL), high BP (systolic and/or diastolic BP > 90th percentile for age, sex, and height), low HDL-C (HDL-C < 40 mg/dL), and high TG (TG > 150 mg/dL), according to the International Diabetes Federation (IDF) [,]. Furthermore, BMI ≥ 85th percentile for age and sex, TC > 200 mg/dL, and LDL-C > 130 mg/dL were considered as other CMS components following the American Heart Association [] and American Diabetes Association [], for children and adolescents at high risk of CVD (a.k.a., cardiometabolic risks; CMR). A total of 6832 subjects with CMR labels were included in the analysis.
2.2.6. Ethical Statement
This study received approval from the Research and Ethics Council of Isfahan University of Medical Sciences (project number: 194049) and complied with the Declaration of Helsinki guidelines. Both written and verbal informed consent were obtained from parents and students following a detailed explanation of the study’s goals and procedures.
2.3. Predictors and Feature Extraction
All participants were assessed according to demographic variables, anthropometric measures, laboratory variables, blood pressure, and health-related variables such as relationship with friends, family size, birth characteristics, and dietary habits.
Health-related behaviors, screen time, leisure time activities, smoking status, sunlight exposure, comorbidities, family history of the disease, student injuries, parent’s consanguineous marriage, and demographic variables were recorded. The details regarding the related questions and the categorization methods for each variable are provided in Table 1 and Table 2. Table 1 includes 20 input variables derived from single-item questions, while Table 2 presents four composite variables.

Table 1.
Questions, response options, and references for the rationale of including single-item variables in the questionnaire.
Table 2.
Questions, response options, and combination methods for composite variables in the questionnaire.
2.4. Model Construction and Interpretation
The categorical variables were transferred into an interval scale using the logit function (Equation (1)), whose parameters were estimated by maximum likelihood estimating (MLE) on the training set []:
where and are the intercept and rate parameters, respectively, and I(x) is an indicator variable of the categorical input variable. An indicator variable is an axillary binary variable showing the category of a categorical variable. For example, the “unhealthy diet” categorical variable has three groups (“low”, “medium”, and “high”). It, thus, has two indicator variables of “medium” and “high”. The reference “low” category is not used, as it creates multicollinearity in the predictors [].
Since there was some information missing in some of the variables, the missing completely at random (MCAR) assumption was examined using Little’s MCAR test (p = 0.106) []. Multivariate imputation by chained equations (MICE) [] was then used for missing data imputation.
For classifying subjects with CMR from healthy subjects, we used the XGBoost algorithm []. XGBoost is a scalable machine learning algorithm for tree boosting that can solve complex problems with different sizes of datasets. It is a free library that efficiently implements a gradient-boosting framework [,].
The XGBoost algorithm uses samples and features as a given data to predict the target with a tree ensemble model with K different trees:
where , and is the space of the regression tree. In this formula, is related to the structure of each tree, and it can map a sample to a leaf. is the number of leaves in the tree and is an independent tree with a structure of and a leaf with weight of . This function gives each sample to different trees, and, at the end, it sums all of the results. Because we have a regression tree, the scores on each leaf are continuous. For each sample, classification is performed by applying the decision rules from the trees, leading to a final prediction based on the sum of all scores in the leaves. The model learns the set of functions by minimizing the following regularization function:
where and represent the differentiable convex loss function that quantifies the discrepancy between the prediction and the target. The second term acts as a penalty for model complexity to prevent overfitting.
To tune the hyperparameters of the XGBoost algorithm, we used grid search (brute force) [,]. After hyperparameter optimization, we separated the dataset into five subsets using stratified random sampling for five-fold cross-validation.
2.5. Validation
Five-fold cross-validation was used in our study to guard against testing hypotheses suggested by the data (Type III errors). The signal detection theory parameters (true positive (TP), true negative (TN), false positive (FP), and false negative (FN)) were then calculated on each test fold. The performance indices introduced as the following were calculated. Finally, the indices’ mean and standard deviation were provided over the test folds, and the cross-validated indices and their confidence interval (CI) of 95% were reported, following the Standards for Reporting Diagnostic Accuracy (STARD) and Transparent Reporting of a multivariable prediction model for Individual Prognosis Or Diagnosis (TRIPOD) guidelines [].
TPs are cases where the model correctly predicts CMS, while FPs are incorrect predictions of CMS in patients who do not have it. FNs occur when the model fails to identify CMS in affected patients, and TNs are correct predictions of no CMS in unaffected patients. These outcomes are essential for evaluating the model’s performance:
where Se, Sp, PPV, and NPV are sensitivity, specificity, positive predictive value, and negative predictive value, respectively.
We further calculated the following composite performance indices based on the ISO/IEC TS:2022 standard []:
where LR+, LR−, DOR, DP, AUC, MCC, Kappa, and F1 are positive likelihood ratio, negative likelihood ratio, diagnostic odds ratio, discriminant power, area under the receiver operating characteristic (ROC) curve (balanced accuracy), Matthew’s correlation coefficient, Cohen’s kappa coefficient (also known as the agreement between the predicted class labels and the gold standard), and F1 score, respectively.
2.6. Statistical Analysis
Results were reported frequencies (for categorical variables) and mean ± standard deviation (for interval variables). p-values less than 0.05 were considered significant. The association between the interval variables with normal distribution to the CMR or healthy group was tested using the independent-sample t-test. Mann–Whitney U-test was used for interval variables with non-normal distribution or ordinal data. For the entire nominal variables, the χ2 test was used since frequencies in all groups were greater than five. Fisher’s exact test was used otherwise. We compared the performance of our proposed method with the TMI index using an adjusted paired t-test []. The statistical analysis and calculations were performed using the SPSS statistical package, version 22.0 (IBM Corp. Released 2013. Armonk, NY, USA: IBM Corp.).
3. Results
3.1. Descriptive and Inferential Statistics
The average age of the participants was 12.4 ± 3.0, and 48.6% were female. A total of 5663 subjects (82.9%) were in the CMR group. The characteristics of the participants in the healthy and CMR group are shown in Table 3.
Table 3.
Demographic and behavioral characteristics of participants by cardiometabolic syndrome status.
The descriptive and univariate statistics table highlights several key characteristics and behaviors among individuals with CMS compared to those without it. The data reveal significant demographic, social, and health-related differences.
3.1.1. Demographic Characteristics
There are statistically significant differences (p = 0.0107) across age groups, with a higher proportion of individuals aged 15–18 years in the CMS group (26.9%) compared to the non-CMS group (22.9%). A notable difference in residence is observed (p < 0.001), with a higher percentage of urban dwellers in the CMS group (75.9%) compared to the non-CMS group (69.2%).
3.1.2. Social and Family Characteristics
Differences in father’s education levels are significant (p = 0.0413), with the CMS group having a slightly higher percentage of fathers with education beyond a bachelor’s degree (5.0%) compared to the non-CMS group (4.6%). The mean birth order is slightly lower in the CMS group (2.17) compared to the non-CMS group (2.27), with a significant p-value of 0.0485.
3.1.3. Health Behaviors
No significant differences were found in oral hygiene behaviors between the groups (p = 0.6016), with similar proportions practicing daily oral hygiene. There is a significant difference in discretionary salt usage (p = 0.0154), with the CMS group reporting slightly higher daily usage (22.4% vs. 20.3%). Daily fast-food consumption is higher in the CMS group (7.8%) compared to the non-CMS group (5.2%), with a significant p-value of 0.0014.
3.1.4. Dietary Habits
The CMS group consumes less fresh fruit daily (51.7%) than the non-CMS group (57.0%), with a significant p-value of 0.0101. A significant difference (p = 0.0354) is observed in dried fruit consumption, with the CMS group having lower daily consumption (31.9% vs. 34.2%). There are significant differences in sweets consumption (p = 0.0143), with the CMS group consuming sweets more frequently daily (24.9%) compared to the non-CMS group (24.5%).
3.1.5. Family Health History and Lifestyle Factors
A significant difference is observed in the family history of obesity (p = 0.0327), with the CMS group having a higher percentage of individuals with a family history of obesity (49.2% vs. 45.7%). Differences in sunlight exposure are observed, although not statistically significant overall. However, the CMS group reports slightly higher exposure.
Overall, the findings suggest that individuals with cardiometabolic syndrome tend to have distinct demographic profiles, dietary habits, and health behaviors compared to those without the syndrome. These differences highlight the importance of targeted interventions considering these factors to manage and prevent CMS effectively.
3.2. Classification Results
Running XGBoost, the following features were selected: Self-rated health, sunlight exposure, screen time, consanguinity, unhealthy diet, gender, healthy diet, rural or urban residence, dietary fat type, birth order, discretionary salt, family history of hypertension, dyslipidemia, diabetes, and obesity and oral hygiene behavior.
The performance of the proposed system and the TMI index (Ashley-Martin et al. []) on the test sets during cross-validation and the cross-validated confusion matrix are provided in Table 4. The comparison between their ROC curves is provided in Figure 2. The cross-validated TMI cut-off was 13.50. The proposed system significantly outperformed TMI (adjusted paired t-test; p < 0.05).
Table 4.
Performance comparison between the proposed system and the TMI index. The first row of each metric shows the results for the proposed system, while the second row presents the results for the TMI index.
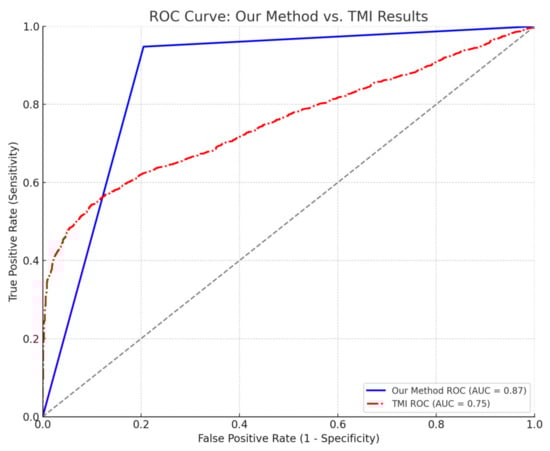
Figure 2.
Comparison of ROC curves between our method and the TMI index. The ROC curve for “our method” (blue, solid line) shows an AUC of 0.87. The ROC curve for the TMI index (red, dashed-dot line) is also compared, illustrating its discriminative performance (AUC = 0.75). The diagonal grey dashed line represents the line of no discrimination (AUC = 0.50).
The classification system for cardiometabolic syndrome showed robust performance across multiple test folds, demonstrating high sensitivity and specificity values. Sensitivity averaged 0.947 (SD = 0.048), indicating that the method reliably identifies positive cases. Specificity, the mean of 0.788 (SD = 0.137) suggests a moderate to high capability to correctly identify true negatives, though it shows more variability than sensitivity.
PPV and NPV are also noteworthy, with mean values of 0.955 (SD = 0.030) and 0.772 (SD = 0.167), respectively. The PPV indicates a high probability that patients classified as having the syndrome actually do, while the NPV reflects a more variable but substantial probability that patients not classified as having the syndrome truly do not.
Key metrics like the likelihood ratios (LR+ and LR−), DOR, and DP further affirm the system’s effectiveness. The mean LR+ was 6.857 (SD = 5.437), indicating a significant increase in the odds of having the syndrome when the test is positive. Conversely, a mean LR− of 0.077 (SD = 0.086) indicates a low likelihood of having the syndrome when the test is negative. The DOR averaged 171.545 (SD = 136.910), indicating a strong discriminatory test.
Kappa statistic and MCC both averaged 0.728 (SD = 0.182) and 0.730 (SD = 0.181), respectively, suggesting substantial agreement and strong association between predicted and actual classifications. The AUC was 0.867 (SD = 0.087), indicating “very-good” discriminative ability.
The DP of the classification system averaged 1.955 (SD = 0.619), which falls into the category of “moderate to good” discrimination according to conventional ranges where a DP of 1–2 is considered moderate, and 2–3 is good. This metric underscores the system’s ability to effectively differentiate between patients with and without the syndrome.
Overall, the consistency across different test folds is commendable, with key metrics showing relatively low standard deviations, indicating stable performance of the classification system. The results suggest that the method is highly reliable and effective for identifying cardiometabolic syndrome, with strong predictive capabilities and good agreement with actual conditions.
4. Discussion
4.1. Choice of the Classifier
We chose the XGBoost classifier for our binary classification problem due to its ability to handle mixed-type data effectively, which includes features with different measurement scales. XGBoost is an ensemble learning method that uses gradient boosting to optimize prediction performance. It is particularly well suited for problems where feature types and scales vary because it can automatically handle different data types and is less sensitive to feature scaling than other classifiers. Additionally, XGBoost offers strong regularization options to prevent overfitting, and its ability to handle missing data internally further enhances its suitability for our dataset. These advantages, combined with its robust performance in various machine learning tasks, make XGBoost an appropriate choice for our classification problem.
4.2. Comparison with the State-of-the-Art
To our knowledge, this is the first study to classify CMS using a comprehensive set of noninvasive factors in children and adolescents through machine learning techniques. While previous research has explored the relationship between various lifestyle behaviors and cardiometabolic health [], our study uniquely focuses on CMS—a broader and more encompassing construct than MS—and employs noninvasive measures such as self-rated health, dietary habits, physical activity, and family history. Additionally, while TMI has been proposed as a similar method for predicting cardiometabolic markers [], it is a single demographic index. Incorporating a broader range of factors, our method significantly outperformed TMI (adjusted paired t-test; p < 0.05) (Figure 2; Table 4), providing a more robust and accurate tool for early risk stratification. This novel approach enhances early detection by offering a practical and accessible tool for predicting long-term cardiovascular outcomes in younger populations, thereby addressing a critical gap in the existing literature. Additionally, the large sample size and the relatively homogeneous nature of our population enhanced the statistical significance of the findings.
Few studies have attempted to classify CMS using invasive markers, such as GlycA, L-HDL-PL, and the ApoB/ApoA ratio []. While these biomarkers can provide detailed insights into metabolic health, their reliance on blood samples and laboratory analysis makes them less practical for widespread use, especially in large-scale screenings or settings with limited resources. In contrast, our study’s noninvasive approach, which utilizes easily accessible indicators like self-rated health and dietary habits, offers a more practical and scalable solution for the early identification of cardiometabolic risks in children and adolescents. Thus, it suits broader public health initiatives and routine clinical assessments.
4.3. Selected Predictors
Research has shown that SRH status significantly influences children and adolescents’ CMR. Zhang et al.’s comprehensive meta-analysis demonstrated that higher SRH is associated with more favorable CMR outcomes in this population []. Similarly, Näslindh-Ylispangar et al. found a strong correlation between SRH and MS in middle-aged men in Helsinki, highlighting the importance of clinical health status in preventing conditions like diabetes, heart attack, or stroke []. Additionally, a cross-sectional study of 533 adolescent girls in the Porto District indicated that better SRH is linked to lower cardiorespiratory risk factors and reduced obesity [].
Sunlight exposure is a significant factor influencing CMR in children and adolescents. A 2021 study in Iran found that vitamin D deficiency, associated with insufficient sunlight, was linked to higher rates of metabolic syndrome, abdominal obesity, low HDL-C, and high fasting blood sugar in children []. Similarly, a 2020 study from Spain demonstrated that vitamin D deficiency correlated with increased BMI, body fat, LDL-C, insulin, and other CMR components in children []. Supporting this, a 2016 animal study showed that low-dose ultraviolet radiation (UVR) exposure reduced weight gain and cardiometabolic dysfunction, suggesting that regular, safe sunlight exposure could mitigate obesity risks [].
Screen time (ST) significantly influences CMR in children and adolescents. Studies have shown that high ST positively correlates with increased obesity, BMI, waist circumference, TG, LDL-C, blood pressure, and lower HDL-C. Research from Iran in 2016 and Brazil in 2017 highlighted the link between high ST and elevated CMR, especially in overweight or obese adolescents [,]. Additionally, a 2011 study in the US found that children who watched TV for four or more hours per day had a significantly higher risk of CMR than those who watched less [].
Consanguineous marriage, or autozygosity, is a significant factor associated with increased CMR among children and adolescents. A 2020 study involving over 10,000 Sub-Saharan African individuals found a strong link between autozygosity and several cardiometabolic traits, particularly in men []. Similarly, a 2014 study in Gujarat, India, revealed that children of consanguineous marriages had significantly higher odds of developing heart disease, diabetes, and hypertension []. Another 2020 study in Saudi Arabia found that individuals with consanguineous parents were three times more likely to develop obesity compared to those without consanguineous parents [].
Junk food consumption is strongly associated with increased CMR among children and adolescents, contributing to obesity, hypertension, and diabetes. A 2020 study involving 14,400 students from 30 provinces in Iran found that while junk food was not directly linked to MS incidence, it was associated with higher odds of high blood pressure, elevated diastolic and systolic blood pressure, overweight, and excess weight []. A 2017 meta-analysis of 364 articles confirmed the correlation between unhealthy dietary patterns—characterized by ultra-processed foods, high sodium, fat, and refined carbohydrates—and cardiometabolic alterations in young populations []. Additionally, a 2015 study highlighted the link between fast-food consumption and the occurrence of MS and its components in children and adolescents [].
Our study found that CMR among children and adolescents is gender-dependent. A 2006 meta-analysis highlighted significant differences in MS incidence between males and females, noting greater insulin resistance among girls during puberty and different lipid accumulation patterns between genders []. Similarly, a 2018 study observed that boys had higher TG levels, higher SBP, and lower HDL cholesterol compared to girls []. Additionally, a 2017 literature review indicated that women are at a higher risk for MS than men [].
A healthy diet is strongly associated with a reduction in CMR among children and adolescents. A 2022 longitudinal analysis by Peterson et al. found that higher diet quality was linked to improved CMR outcomes among Mexican youth, with at least one CMR factor being positively influenced by better diet quality []. Additionally, a meta-analysis confirmed similar findings in adults, demonstrating that healthy dietary patterns—rich in vitamin D, mono- and polyunsaturated fatty acids, fiber, fruits, and vegetables—are associated with better cardiovascular health and lower CMR [].
Our findings indicate that living in rural or urban areas affects CMR status. Similar studies have shown that the region of residence can significantly impact CMR factors. For example, a 2011 study involving 19,256 Thai adults found a higher prevalence of MS in urban areas compared to rural areas, particularly among men (23.1% vs. 17.9%, p < 0.05), with low HDL and hypertriglyceridemia being more common in rural areas []. Conversely, a systematic review and meta-analysis of 74,168 American children and adolescents revealed that obesity was more prevalent among those living in rural areas compared to urban counterparts []. However, in contrast to these findings, a 2021 study in Eastern Poland found a significant association between MS and rural residency, with rural children exhibiting higher levels of glucose, TGs, blood pressure, and abnormal waist circumference compared to urban residents [].
Our study showed that the type of dietary fat is strongly linked to CMR in children and adolescents. Supporting this, a systematic review found that replacing saturated fats (SFAs) with monounsaturated (MUFAs) or polyunsaturated fats (PUFAs) lowers total and LDL cholesterol, reducing the risk of CVD, particularly in men []. Recent reviews and meta-analyses also confirmed that reducing SFAs and trans-fatty acids (TFAs) intake in youth significantly decreases TG levels and CVD risk later in life [,].
Birth order is significantly associated with CMR among children and adolescents. A study involving over 1 million Swedish children found that later-born children had lower BMI than first-borns, though there was no significant link between birth order and BP in young men []. Similarly, a 2021 study in Thailand observed that first-borns had a 3.3-times greater risk of obesity compared to later-borns, though no significant associations were found with other cardiometabolic outcomes [].
Adding extra salt to food is another significant factor linked to CMR in children and adolescents. A review study found a strong positive association between reducing salt and sugar intake and lowering cardiometabolic risks []. Similarly, a study in Greece highlighted that reducing added salt intake significantly improves blood pressure control, a key CMR factor in young populations [].
A family history of NCDs, such as cancer or diabetes, is significantly associated with increased CMR in children and adolescents. A study among Asian Indian adolescents found that those with one or both diabetic parents had higher BMI, waist circumference, impaired glucose levels, hypertension, and lower HDL-C compared to those with parents having normal glucose tolerance []. Similarly, a study of African American and Mexican American children aged 12–19 revealed that impaired fasting glucose (IFG), impaired glucose tolerance (IGT), and prediabetes were prevalent mainly among those with a family history of NCDs, with rates of 25% for type 2 diabetes, 21% for obesity, and 35% for other NCDs []. Additionally, a study in Iran involving 14,400 children and adolescents found a significant link between parental NCDs and abnormal CMR in their offspring, particularly in relation to cardiovascular disease, type 2 diabetes, and certain cancers [].
Tooth health status was the last factor we discussed that significantly impacts CMRs among children and adolescents. Based on a study published in the same region among 5258 students aged 10–18, the authors found an association between tooth brushing frequency and CMRs among adolescents. The results demonstrated that there was an association between higher frequency of tooth brushing and lower mean levels of LDL-C in both genders (p < 0.0001), lower frequency of evaluated LDL-C among girls (p = 0.03), and lower frequency of elevated BP among boys (p = 0.03) [].
A Japanese 5-year follow-up study found that infrequent tooth brushing was associated with a higher prevalence of MS and CMRs, such as obesity, elevated TGs, high blood pressure, fasting glucose, and reduced HDL cholesterol. Participants who brushed their teeth ≤1 time per day had significantly higher odds of these CMRs compared to those brushing ≥3 times per day (odds ratio = 0.64, 95% confidence interval: 0.45–0.92) []. Similarly, a recent study on children aged 12–15 years found that those with poor oral hygiene had higher frequencies of abnormal CMRs, including elevated C-reactive protein, insulin resistance, interleukin-6, and lower adiponectin levels, compared to children with healthier tooth status [].
4.4. Limitations
A dependable medical diagnosis system must meet specific criteria. It is deemed clinically reliable if it adheres to specific Type I and Type II statistical error rates [], maintains a false discovery rate (FDR = 1-precision) [], and achieves DORs []. To fulfill these conditions, the system must have minimum sensitivity, specificity, precision, and DOR values of 80%, 95%, 95%, and 100, respectively []. Our proposed system meets three conditions: sensitivity, precision, and DOR. However, the system’s specificity must be improved to be considered reliable.
All information except laboratory factors used in this study is self-reported by the students and their parents. It might be disposed to recall bias or social desirability bias, especially for the birth-related questions.
One limitation of our study is its cross-sectional design, which can provide valuable insights into associations between various factors and CMR at a specific time. However, it cannot be used to predict future events or establish causality. A cohort study design would be necessary for accurate predictions of future health outcomes, which is the focus of our future work. Despite this limitation, our study offers important and valuable data that contribute to understanding CMR among children and adolescents.
Additionally, due to cross-sectional data collection, we cannot verify the causality between life-related risk factors and CMRs. In addition, we cannot exclude any extra information due to genetic factors. Primary prevention through lifestyle modification should focus on high-risk behavior patterns in children. Given the complex impact of lifestyle factors on CMRs, well-designed, prospective, or genome-wide studies in adolescents are necessary.
5. Conclusions
In conclusion, this study provides a promising advancement in the early identification of CMS in children and adolescents by employing noninvasive factors and machine learning techniques. Addressing the initial research questions, our findings highlight the superior predictive accuracy of our model over traditional methods such as TMI, emphasizing the practical advantages of using easily accessible, noninvasive indicators. This approach not only allows for more effective early intervention strategies but also has broader implications for improving long-term pediatric health outcomes by preventing the progression of CMS into more severe cardiovascular conditions. Our study underscores the importance of integrating advanced predictive analytics into clinical practice to better manage and reduce the burden of cardiometabolic risks in young populations.
Supplementary Materials
The following supporting information can be downloaded at: https://www.mdpi.com/article/10.3390/info15090564/s1, Table S1. Minimal Dataset: A representative dataset with age, living region, and gender information for CMS/non-CMS groups.
Author Contributions
Conceptualization, H.R.M., M.M. (Marjan Mansourian), M.A.M. and R.K.; methodology, H.R.M., M.M. (Mahsa Mansourian), A.K., M.S., S.Z. and M.M. (Marjan Mansourian); software, H.R.M. and M.S.; validation, H.R.M., M.S., S.Z. and M.M. (Marjan Mansourian); formal analysis, H.R.M. and M.M. (Marjan Mansourian); investigation, M.M. (Mahsa Mansourian) and A.K.; resources, H.R.M. and M.A.M.; data curation, R.K. and M.M. (Mahsa Mansourian); writing—original draft preparation, H.R.M., A.K. and M.M. (Marjan Mansourian); writing—review and editing, M.M. (Mahsa Mansourian), M.S., S.Z., M.A.M. and R.K.; visualization, M.M. (Marjan Mansourian); supervision, H.R.M., M.M. (Marjan Mansourian), M.A.M. and R.K.; project administration, M.M. (Marjan Mansourian) and R.K.; funding acquisition, H.R.M. and M.A.M. All authors have read and agreed to the published version of the manuscript.
Funding
This research was funded by the Beatriu de Pinós postdoctoral program from the Office of the Secretary of Universities and Research from the Ministry of Business and Knowledge of the Government of Catalonia program: 2020 BP 00261 (H.M.).
Institutional Review Board Statement
This study was conducted in accordance with the Declaration of Helsinki, and approved by the Ethics Committee of Isfahan University of Medical Sciences (protocol code 194049 and date of approval of 2015).
Informed Consent Statement
Written informed and verbal consent was obtained from the parents and students after explaining the study objectives and protocols.
Data Availability Statement
The data are not publicly available due to confidentiality agreements and privacy concerns but can be accessed upon reasonable request to ensure proper use and adherence to ethical guidelines. Additionally, we have provided a representative dataset.
Acknowledgments
This large observational study was performed with the cooperation of the Ministry of Health and Medical Education, Ministry of Education and Training, Child Growth and Development Research Center, Isfahan University of Medical Sciences and Alborz University of Medical Sciences.
Conflicts of Interest
The authors declare no conflicts of interest. The funders had no role in the design of the study; in the collection, analyses, or interpretation of data; in the writing of the manuscript; or in the decision to publish the results.
References
- Zhang, Z.; Fan, S.; Xue, Z.; Yuan, J.; Zhou, Z.; Wang, T.; Liu, J.; Bawudun, A.; Nurmamat, N.; Wang, Y.; et al. Evaluation of the appropriate predictive contributor and diagnostic threshold for the cardio-metabolic syndrome in Chinese Uyghur adults. BMC Public Health 2019, 19, 613. [Google Scholar] [CrossRef] [PubMed]
- Castro, J.P.; El-Atat, F.A.; McFarlane, S.I.; Aneja, A.; Sowers, J.R. Cardiometabolic syndrome: Pathophysiology and treatment. Curr. Hypertens. Rep. 2003, 5, 393–401. [Google Scholar] [CrossRef] [PubMed]
- Srivastava, A.K. Challenges in the treatment of cardiometabolic syndrome. Indian J. Pharmacol. 2012, 44, 155–156. [Google Scholar] [CrossRef] [PubMed]
- Dabelea, D.; Mayer-Davis, E.J.; Saydah, S.; Imperatore, G.; Linder, B.; Divers, J.; Bell, R.; Badaru, A.; Talton, J.W.; Crume, T.; et al. Prevalence of type 1 and type 2 diabetes among children and adolescents from 2001 to 2009. Jama 2014, 311, 1778–1786. [Google Scholar] [CrossRef] [PubMed]
- Ong, K.L.; Stafford, L.K.; McLaughlin, S.A.; Boyko, E.J.; Vollset, S.E.; Smith, A.E.; Dalton, B.E.; Duprey, J.; Cruz, J.A.; Hagins, H.; et al. Global, regional, and national burden of diabetes from 1990 to 2021, with projections of prevalence to 2050: A systematic analysis for the Global Burden of Disease Study 2021. Lancet 2023, 402, 203–234. [Google Scholar] [CrossRef] [PubMed]
- Kelli, H.M.; Kassas, I.; Lattouf, O.M. Cardio metabolic syndrome: A global epidemic. J. Diabetes Metab. 2015, 6, 2. [Google Scholar] [CrossRef]
- Sarrafzadegan, N.; Mohammmadifard, N. Cardiovascular Disease in Iran in the Last 40 Years: Prevalence, Mortality, Morbidity, Challenges and Strategies for Cardiovascular Prevention. Arch. Iran. Med. 2019, 22, 204–210. [Google Scholar]
- Shams-Beyranvand, M.; Farzadfar, F.; Naderimagham, S.; Tirani, M.; Maracy, M.R. Estimation of burden of ischemic heart diseases in Isfahan, Iran, 2014: Using incompleteness and misclassification adjustment models. J. Diabetes Metab. Disord. 2017, 16, 12. [Google Scholar] [CrossRef]
- Alberti, K.G.M.M.; Eckel, R.H.; Grundy, S.M.; Zimmet, P.; Fruchart, J.; Smith, S. Harmonizing the Metabolic syndrome. Circulation 2009, 120, 1640–1645. [Google Scholar] [CrossRef]
- Tanrikulu, M.A.; Agirbasli, M.; Berenson, G. Primordial prevention of cardiometabolic risk in childhood. In Hypertension: From Basic Research to Clinical Practice; Springer: Berlin/Heidelberg, Germany, 2016; pp. 489–496. [Google Scholar]
- Marateb, H.R.; Tasdighi, Z.; Mohebian, M.R.; Naghavi, A.; Hess, M.; Motlagh, M.E.; Heshmat, R.; Mansourian, M.; Mañanas, M.A.; Binder, H.; et al. Classification of psychiatric symptoms using deep interaction networks: The CASPIAN-IV study. Sci. Rep. 2021, 11, 15706. [Google Scholar] [CrossRef]
- Trigka, M.; Dritsas, E. Predicting the Occurrence of Metabolic Syndrome Using Machine Learning Models. Computation 2023, 11, 170. [Google Scholar] [CrossRef]
- Kim, J.; Mun, S.; Lee, S.; Jeong, K.; Baek, Y. Prediction of metabolic and pre-metabolic syndromes using machine learning models with anthropometric, lifestyle, and biochemical factors from a middle-aged population in Korea. BMC Public Health 2022, 22, 664. [Google Scholar] [CrossRef] [PubMed]
- Kupusinac, A.; Doroslovački, R.; Malbaški, D.; Srdić, B.; Stokić, E. A primary estimation of the cardiometabolic risk by using artificial neural networks. Comput. Biol. Med. 2013, 43, 751–757. [Google Scholar] [CrossRef]
- Hollenbeak, C.S.; Spackman, D.E.; Ben-Joseph, R.H.; Okamoto, L.J.; Luce, B.R.; Schwartz, J.S.; Sullivan, S.D. Predicting the prevalence of cardiometabolic risk factors when clinical data are limited. Value Health 2007, 10, S4–S11. [Google Scholar] [CrossRef][Green Version]
- Ashley-Martin, J.; Ensenauer, R.; Maguire, B.; Kuhle, S. Predicting cardiometabolic markers in children using tri-ponderal mass index: A cross-sectional study. Arch. Dis. Child. 2019, 104, 577–582. [Google Scholar] [CrossRef]
- Ojanen, X.; Cheng, R.; Törmäkangas, T.; Rappaport, N.; Wilmanski, T.; Wu, N.; Fung, E.; Nedelec, R.; Sebert, S.; Vlachopoulos, D.; et al. Towards early risk biomarkers: Serum metabolic signature in childhood predicts cardio-metabolic risk in adulthood. eBioMedicine 2021, 72, 103611. [Google Scholar] [CrossRef]
- Kelishadi, R.; Heidari-Beni, M.; Qorbani, M.; Motamed-Gorji, N.; Motlagh, M.E.; Ziaodini, H.; Taheri, M.; Ahadi, Z.; Aminaee, T.; Heshmat, R. Association between neck and wrist circumferences and cardiometabolic risk in children and adolescents: The CASPIAN-V study. Nutrition 2017, 43–44, 32–38. [Google Scholar] [CrossRef]
- WHO. Physical status: The use and interpretation of anthropometry. In Report of a WHO Expert Committee; WHO Technical Report Series 854; World Health Organization: Geneva, Switzerland, 1995. [Google Scholar]
- Fredriks, A.M.; van Buuren, S.; Wit, J.M.; Verloove-Vanhorick, S. Body index measurements in 1996–1997 compared with 1980. Arch. Dis. Child. 2000, 82, 107–112. [Google Scholar] [CrossRef]
- Knowles, K.; Paiva, L.; Sanchez, S.; Revilla, L.; Lopez, T.; Yasuda, M.; Yanez, N.; Gelaye, B.; Williams, M. Waist circumference, body mass index, and other measures of adiposity in predicting cardiovascular disease risk factors among Peruvian adults. Int. J. Hypertens. 2011, 2011, 931402. [Google Scholar] [CrossRef]
- Rosner, B.; Cook, N.R.; Daniels, S.; Falkner, B. Childhood blood pressure trends and risk factors for high blood pressure: The NHANES experience 1988–2008. Hypertension 2013, 62, 247–254. [Google Scholar] [CrossRef]
- Zimmet, P.; Alberti, K.G.; Kaufman, F.; Tajima, N.; Silink, M.; Arslanian, S.; Wong, G.; Bennett, P.; Shaw, J.; Caprio, S. The metabolic syndrome in children and adolescents-an IDF consensus report. Pediatr. Diabetes 2007, 8, 299–306. [Google Scholar] [CrossRef] [PubMed]
- Kavey, R.-E.W.; Daniels, S.R.; Lauer, R.M.; Atkins, D.L.; Hayman, L.L.; Taubert, K. American Heart Association guidelines for primary prevention of atherosclerotic cardiovascular disease beginning in childhood. Circulation 2003, 107, 1562–1566. [Google Scholar] [CrossRef] [PubMed]
- Genuth, S.; Alberti, K.; Bennett, P.; Buse, J.; DeFronzo, R.; Kahn, R.; Kitzmiller, J.; Knowler, W.C.; Lebovitz, H.; Lernmark, A. Follow-up report on the diagnosis of diabetes mellitus. Diabetes Care 2003, 26, 3160–3168. [Google Scholar] [PubMed]
- Soofi, M.; Pasdar, Y.; Karami Matin, B.; Hamzeh, B.; Rezaei, S.; Kazemi Karyani, A.; Moradi Nazar, M.; Soltani, S.; Hajizadeh, M.; Salimi, Y.; et al. Socioeconomic-related inequalities in oral hygiene behaviors: A cross-sectional analysis of the PERSIAN cohort study. BMC Oral. Health 2020, 20, 63. [Google Scholar] [CrossRef]
- Alharbi, K.K.; Al-Sheikh, Y.A.; Alsaadi, M.M.; Mani, B.; Udayaraja, G.K.; Kohailan, M.; Ali Khan, I. Screening for obesity in the offspring of first-cousin consanguineous couples: A Phase-I study in Saudi Arabia. Saudi J. Biol. Sci. 2020, 27, 242–246. [Google Scholar] [CrossRef]
- Meller, F.O.; Loret de Mola, C.; Assunção, M.C.F.; Schäfer, A.A.; Dahly, D.L.; Barros, F.C. Birth order and number of siblings and their association with overweight and obesity: A systematic review and meta-analysis. Nutr. Rev. 2018, 76, 117–124. [Google Scholar] [CrossRef]
- Evensen, E.; Emaus, N.; Kokkvoll, A.; Wilsgaard, T.; Furberg, A.-S.; Skeie, G. The relation between birthweight, childhood body mass index, and overweight and obesity in late adolescence: A longitudinal cohort study from Norway, The Tromsø Study, Fit Futures. BMJ Open 2017, 7, e015576. [Google Scholar] [CrossRef]
- Kelishadi, R.; Farajian, S. The protective effects of breastfeeding on chronic non-communicable diseases in adulthood: A review of evidence. Adv. Biomed. Res. 2014, 3, 3. [Google Scholar] [CrossRef]
- Angoorani, P.; Mostafaei, S.; Kiani, T.; Ejtahed, H.-S.; Motlagh, M.E.; Shafiee, G.; Gorabi, A.M.; Qorbani, M.; Heshmat, R.; Kelishadi, R. Determinants of childhood blood pressure using structure equation model: The CASPIAN–V study. BMC Cardiovasc. Disord. 2020, 20, 193. [Google Scholar] [CrossRef]
- Marateb, H.R.; Mohebian, M.R.; Javanmard, S.H.; Tavallaei, A.A.; Tajadini, M.H.; Heidari-Beni, M.; Mañanas, M.A.; Motlagh, M.E.; Heshmat, R.; Mansourian, M.; et al. Prediction of dyslipidemia using gene mutations, family history of diseases and anthropometric indicators in children and adolescents: The CASPIAN-III study. Comput. Struct. Biotechnol. J. 2018, 16, 121–130. [Google Scholar] [CrossRef]
- Heshmat, R.; Hemati, Z.; Payab, M.; Hamzeh, S.S.; Motlagh, M.E.; Shafiee, G.; Taheri, M.; Ziaodini, H.; Qorbani, M.; Kelishadi, R. Prevalence of different metabolic phenotypes of obesity in Iranian children and adolescents: The CASPIAN V study. J. Diabetes Metab. Disord. 2018, 17, 211–221. [Google Scholar] [CrossRef] [PubMed]
- Khashayar, P.; Kasaeian, A.; Heshmat, R.; Motlagh, M.E.; Mahdavi Gorabi, A.; Noroozi, M.; Qorbani, M.; Kelishadi, R. Childhood overweight and obesity and associated factors in iranian children and adolescents: A multilevel analysis; the CASPIAN-IV study. Front. Pediatr. 2018, 6, 393. [Google Scholar] [CrossRef] [PubMed]
- Shah, B.; Cost, K.T.; Fuller, A.; Birken, C.S.; Anderson, L.N. Sex and gender differences in childhood obesity: Contributing to the research agenda. BMJ Nutr. Prev. Health 2020, 3, 387. [Google Scholar] [CrossRef] [PubMed]
- Angoorani, P.; Mahmoodi, Z.; Ejtahed, H.-S.; Heshmat, R.; Motlagh, M.E.; Qorbani, M.; Kelishadi, R. Determinants of life satisfaction and self-rated health in Iranian children and adolescents: A structure equation model. BMC Pediatr. 2022, 22, 4. [Google Scholar] [CrossRef]
- Pipoyan, D.; Stepanyan, S.; Stepanyan, S.; Beglaryan, M.; Costantini, L.; Molinari, R.; Merendino, N. The Effect of Trans Fatty Acids on Human Health: Regulation and Consumption Patterns. Foods 2021, 10, 2452. [Google Scholar] [CrossRef]
- Unal, I. Defining an Optimal Cut-Point Value in ROC Analysis: An Alternative Approach. Comput. Math. Methods Med. 2017, 2017, 3762651. [Google Scholar] [CrossRef]
- Baradaran Mahdavi, S.; Mansourian, M.; Shams, E.; Qorbani, M.; Heshmat, R.; Motlagh, M.E.; Ziaodini, H.; Dashti, R.; Taheri, M.; Kelishadi, R. Association of Sunlight Exposure with Sleep Hours in Iranian Children and Adolescents: The CASPIAN-V Study. J. Trop. Pediatr. 2020, 66, 4–14. [Google Scholar] [CrossRef]
- Bishop, C.M. Pattern Recognition and Machine Learning; Springer: New York, NY, USA, 2006; p. 738. [Google Scholar]
- Lafi, S.Q.; Kaneene, J.B. An explanation of the use of principal-components analysis to detect and correct for multicollinearity. Prev. Vet. Med. 1992, 13, 261–275. [Google Scholar] [CrossRef]
- Jakobsen, J.C.; Gluud, C.; Wetterslev, J.; Winkel, P. When and how should multiple imputation be used for handling missing data in randomised clinical trials—A practical guide with flowcharts. BMC Med. Res. Methodol. 2017, 17, 162. [Google Scholar] [CrossRef]
- van Buuren, S.; Groothuis-Oudshoorn, K. mice: Multivariate Imputation by Chained Equations in R. J. Stat. Softw. 2011, 45, 1–67. [Google Scholar] [CrossRef]
- Chen, T.; Guestrin, C. Xgboost: A scalable tree boosting system. In Proceedings of the 22nd ACM Sigkdd International Conference on Knowledge Discovery and Data Mining, San Francisco, CA, USA, 13–17 August 2016; pp. 785–794. [Google Scholar]
- Friedman, J.; Hastie, T.; Tibshirani, R. Additive logistic regression: A statistical view of boosting (With discussion and a rejoinder by the authors). Ann. Stat. 2000, 28, 337–407. [Google Scholar] [CrossRef]
- Friedman, J.H. Greedy Function Approximation: A Gradient Boosting Machine. Ann. Stat. 2001, 29, 1189–1232. [Google Scholar] [CrossRef]
- Bergstra, J.; Bardenet, R.; Bengio, Y.; Kégl, B. Algorithms for hyper-parameter optimization. Adv. Neural Inf. Process. Syst. 2011, 24, 2546–2554. [Google Scholar]
- Yu, T.; Zhu, H. Hyper-parameter optimization: A review of algorithms and applications. arXiv 2020, arXiv:2003.05689. [Google Scholar]
- Mansourian, M.; Marateb, H.R.; Mansourian, M.; Mohebbian, M.R.; Binder, H.; Mañanas, M.Á. Rigorous performance assessment of computer-aided medical diagnosis and prognosis systems: A biostatistical perspective on data mining. In Modelling and Analysis of Active Biopotential Signals in Healthcare; IOP Publishing: Bristol, UK, 2020; Volume 2. [Google Scholar] [CrossRef]
- ISO/IEC TS 4213; Information Technology—Artificial Intelligence—Assessment of Machine Learning Classification Performance. International Organization for Standardization: Geneva, Switzerland, 2022.
- Kuncheva, L. Fundamentals of Pattern Recognition. In Combining Pattern Classifiers; Kuncheva, L., Ed.; John Wiley & Sons: Hoboken, NJ, USA, 2004; pp. 1–43. [Google Scholar]
- Forseth, B.; Noel-MacDonnell, J.R.; Hampl, S.; Carlson, J.A.; Halpin, K.; Davis, A.; Phillips, T.; Shook, R.P. Relationship between youth cardiometabolic health and physical activity in medical records. PLoS ONE 2024, 19, e0303583. [Google Scholar] [CrossRef] [PubMed]
- Gul Siraz, U.; Hatipoglu, N.; Mazicioglu, M.M.; Ozturk, A.; Cicek, B.; Kurtoglu, S. Triponderal mass index is as strong as body mass index in the determination of obesity and adiposity. Nutrition 2023, 105, 111846. [Google Scholar] [CrossRef]
- Zhang, T.; Lu, G.; Wu, X.Y. Associations between physical activity, sedentary behaviour and self-rated health among the general population of children and adolescents: A systematic review and meta-analysis. BMC Public Health 2020, 20, 1343. [Google Scholar] [CrossRef]
- Näslindh-Ylispangar, A.; Sihvonen, M.; Vanhanen, H.; Kekki, P. Self-rated health and risk factors for metabolic syndrome among middle-aged men. Public Health Nurs. 2005, 22, 515–522. [Google Scholar] [CrossRef]
- Mota, J.; Santos, R.M.; Silva, P.; Aires, L.; Martins, C.; Vale, S. Associations between self-rated health with cardiorespiratory fitness and obesity status among adolescent girls. J. Phys. Act. Health 2012, 9, 378–381. [Google Scholar] [CrossRef]
- Qorbani, M.; Heidari-Beni, M.; Ejtahed, H.-S.; Shafiee, G.; Goodarzi, F.; Tamehri Zadeh, S.S.; Khademian, M.; Mohammadian Khonsari, N.; Motlagh, M.E.; Asayesh, H. Association of vitamin D status and cardio-metabolic risk factors in children and adolescents: The CASPIAN-V study. BMC Nutr. 2021, 7, 71. [Google Scholar] [CrossRef]
- Durá-Travé, T.; Gallinas-Victoriano, F.; Peñafiel-Freire, D.M.; Urretavizcaya-Martinez, M.; Moreno-González, P.; Chueca-Guindulain, M.J. Hypovitaminosis D and cardiometabolic risk factors in adolescents with severe obesity. Children 2020, 7, 10. [Google Scholar] [CrossRef] [PubMed]
- Fleury, N.; Geldenhuys, S.; Gorman, S. Sun exposure and its effects on human health: Mechanisms through which sun exposure could reduce the risk of developing obesity and cardiometabolic dysfunction. Int. J. Environ. Res. Public Health 2016, 13, 999. [Google Scholar] [CrossRef] [PubMed]
- Heshmat, R.; Qorbani, M.; Shahr Babaki, A.E.; Djalalinia, S.; Ataei-Jafari, A.; Motlagh, M.E.; Ardalan, G.; Arefirad, T.; Rezaei, F.; Asayesh, H. Joint association of screen time and physical activity with cardiometabolic risk factors in a national sample of Iranian adolescents: The CASPIANIII study. PLoS ONE 2016, 11, e0154502. [Google Scholar] [CrossRef]
- Cureau, F.; Ekelund, U.; Bloch, K.; Schaan, B. Does body mass index modify the association between physical activity and screen time with cardiometabolic risk factors in adolescents? Findings from a country-wide survey. Int. J. Obes. 2017, 41, 551–559. [Google Scholar] [CrossRef] [PubMed]
- Carson, V.; Janssen, I. Volume, patterns, and types of sedentary behavior and cardio-metabolic health in children and adolescents: A cross-sectional study. BMC Public Health 2011, 11, 274. [Google Scholar] [CrossRef]
- Ceballos, F.C.; Hazelhurst, S.; Clark, D.W.; Agongo, G.; Asiki, G.; Boua, P.R.; Xavier Gómez-Olivé, F.; Mashinya, F.; Norris, S.; Wilson, J.F. Autozygosity influences cardiometabolic disease-associated traits in the AWI-Gen sub-Saharan African study. Nat. Commun. 2020, 11, 5754. [Google Scholar] [CrossRef]
- Bhasin, P.; Kapoor, S. Impact of consanguinity on cardio-metabolic health and other diseases: Findings from an Afro-Indian tribal community. J. Community Genet. 2015, 6, 129–135. [Google Scholar] [CrossRef]
- Azemati, B.; Kelishadi, R.; Ahadi, Z.; Shafiee, G.; Taheri, M.; Ziaodini, H.; Qorbani, M.; Heshmat, R. Association between junk food consumption and cardiometabolic risk factors in a national sample of Iranian children and adolescents population: The CASPIAN-V study. Eat. Weight. Disord. EWD 2020, 25, 329–335. [Google Scholar] [CrossRef]
- Rocha, N.P.; Milagres, L.C.; Longo, G.Z.; Ribeiro, A.Q.; Novaes, J.F. Association between dietary pattern and cardiometabolic risk in children and adolescents: A systematic review. J. Pediatr. 2017, 93, 214–222. [Google Scholar] [CrossRef]
- Asghari, G.; Yuzbashian, E.; Mirmiran, P.; Mahmoodi, B.; Azizi, F. Fast Food Intake Increases the Incidence of Metabolic Syndrome in Children and Adolescents: Tehran Lipid and Glucose Study. PLoS ONE 2015, 10, e0139641. [Google Scholar] [CrossRef]
- Regitz-Zagrosek, V.; Lehmkuhl, E.; Mahmoodzadeh, S. Gender Aspects of the Role of the Metabolic Syndrome as a Risk Factor for Cardiovascular Disease. Gend. Med. 2007, 4 (Suppl. B), S162–S177. [Google Scholar] [CrossRef] [PubMed]
- Barstad, L.H.; Júlíusson, P.B.; Johnson, L.K.; Hertel, J.K.; Lekhal, S.; Hjelmesæth, J. Gender-related differences in cardiometabolic risk factors and lifestyle behaviors in treatment-seeking adolescents with severe obesity. BMC Pediatr. 2018, 18, 61. [Google Scholar] [CrossRef] [PubMed]
- Pucci, G.; Alcidi, R.; Tap, L.; Battista, F.; Mattace-Raso, F.; Schillaci, G. Sex- and gender-related prevalence, cardiovascular risk and therapeutic approach in metabolic syndrome: A review of the literature. Pharmacol. Res. 2017, 120, 34–42. [Google Scholar] [CrossRef] [PubMed]
- Aljahdali, A.A.; Peterson, K.E.; Cantoral, A.; Ruiz-Narvaez, E.; Tellez-Rojo, M.M.; Kim, H.M.; Hébert, J.R.; Wirth, M.D.; Torres-Olascoaga, L.A.; Shivappa, N.; et al. Diet Quality Scores and Cardiometabolic Risk Factors in Mexican Children and Adolescents: A Longitudinal Analysis. Nutrients 2022, 14, 896. [Google Scholar] [CrossRef]
- Funtikova, A.N.; Navarro, E.; Bawaked, R.A.; Fíto, M.; Schröder, H. Impact of diet on cardiometabolic health in children and adolescents. Nutr. J. 2015, 14, 118. [Google Scholar] [CrossRef]
- Aekplakorn, W.; Kessomboon, P.; Sangthong, R.; Chariyalertsak, S.; Putwatana, P.; Inthawong, R.; Nitiyanant, W.; Taneepanichskul, S.; The NHES IV Study Group. Urban and rural variation in clustering of metabolic syndrome components in the Thai population: Results from the fourth National Health Examination Survey 2009. BMC Public Health 2011, 11, 854. [Google Scholar] [CrossRef]
- Johnson III, J.A.; Johnson, A.M. Urban-rural differences in childhood and adolescent obesity in the United States: A systematic review and meta-analysis. Child. Obes. 2015, 11, 233–241. [Google Scholar] [CrossRef]
- Nowicki, G.J.; Ślusarska, B.; Naylor, K.; Prystupa, A.; Rudnicka-Drożak, E.; Halyuk, U.; Pokotylo, P. The relationship between the metabolic syndrome and the place of residence in the local community on the example of the janów lubelski district in eastern Poland: A population-based study. Diabetes Metab. Syndr. Obes. 2021, 14, 2041–2056. [Google Scholar] [CrossRef]
- Schwab, U.; Lauritzen, L.; Tholstrup, T.; Haldorsson, T.I.; Riserus, U.; Uusitupa, M.; Becker, W. Effect of the amount and type of dietary fat on cardiometabolic risk factors and risk of developing type 2 diabetes, cardiovascular diseases, and cancer: A systematic review. Food Nutr. Res. 2014, 58, 25145. [Google Scholar] [CrossRef]
- Morenga, L.T.; Montez, J.M. Health effects of saturated and trans-fatty acid intake in children and adolescents: Systematic review and meta-analysis. PLoS ONE 2017, 12, e0186672. [Google Scholar] [CrossRef]
- Micha, R.; Mozaffarian, D. Saturated fat and cardiometabolic risk factors, coronary heart disease, stroke, and diabetes: A fresh look at the evidence. Lipids 2010, 45, 893–905. [Google Scholar] [CrossRef] [PubMed]
- Jelenkovic, A.; Silventoinen, K.; Tynelius, P.; Myrskylä, M.; Rasmussen, F. Association of birth order with cardiovascular disease risk factors in young adulthood: A study of one million Swedish men. PLoS ONE 2013, 8, e63361. [Google Scholar] [CrossRef] [PubMed]
- Aurpibul, L.; Butler, É.M.; Wongthanee, A.; Rerkasem, A.; Pruenglampoo, S.; Mangklabruks, A.; Rerkasem, K.; Derraik, J.G. Birth order is associated with an increased risk of obesity in young adults in Thailand. J. Epidemiol. Community Health 2021, 75, 305–308. [Google Scholar] [CrossRef] [PubMed]
- Ponzo, V.; Pellegrini, M.; Costelli, P.; Vázquez-Araújo, L.; Gayoso, L.; D’Eusebio, C.; Ghigo, E.; Bo, S. Strategies for reducing salt and sugar intakes in individuals at increased cardiometabolic risk. Nutrients 2021, 13, 279. [Google Scholar] [CrossRef] [PubMed]
- Tragomalou, A.; Moschonis, G.; Manios, Y.; Kassari, P.; Ioakimidis, I.; Diou, C.; Stefanopoulos, L.; Lekka, E.; Maglaveras, N.; Delopoulos, A. Novel e-health applications for the management of cardiometabolic risk factors in children and adolescents in Greece. Nutrients 2020, 12, 1380. [Google Scholar] [CrossRef]
- Anjana, R.M.; Lakshminarayanan, S.; Deepa, M.; Farooq, S.; Pradeepa, R.; Mohan, V. Parental history of type 2 diabetes mellitus, metabolic syndrome, and cardiometabolic risk factors in Asian Indian adolescents. Metabolism 2009, 58, 344–350. [Google Scholar] [CrossRef]
- Li, C.; Ford, E.S.; Zhao, G.; Mokdad, A.H. Prevalence of pre-diabetes and its association with clustering of cardiometabolic risk factors and hyperinsulinemia among U.S. adolescents: National Health and Nutrition Examination Survey 2005–2006. Diabetes Care 2009, 32, 342–347. [Google Scholar] [CrossRef]
- Ejtahed, H.-S.; Heshmat, R.; Motlagh, M.E.; Hasani-Ranjbar, S.; Ziaodini, H.; Taheri, M.; Ahadi, Z.; Aminaee, T.; Shafiee, G.; Goodarzi, A. Association of parental obesity with cardiometabolic risk factors in their children: The CASPIAN-V study. PLoS ONE 2018, 13, e0193978. [Google Scholar] [CrossRef]
- Kelishadi, R.; Mirmoghtadaee, P.; Qorbani, M.; Motlagh, M.E.; Heshmat, R.; Taslimi, M.; Mahmoudarabi, M.; Ardalan, G.; Larijani, B. Tooth brushing and cardiometabolic risk factors in adolescents: Is there an association? The CASPIAN-III study. Int. J. Prev. Med. 2013, 4, 271. [Google Scholar]
- Tanaka, A.; Takeuchi, K.; Furuta, M.; Takeshita, T.; Suma, S.; Shinagawa, T.; Shimazaki, Y.; Yamashita, Y. Relationship of toothbrushing to metabolic syndrome in middle-aged adults. J. Clin. Periodontol. 2018, 45, 538–547. [Google Scholar] [CrossRef]
- Baskaradoss, J.K.; Tavares, M.; Al-Mulla, F.; Al-Ozairi, E.; Abu-Farha, M.; Bin-Hasan, S.; Alsumait, A.; Devarajan, S.; Alqaderi, H. Association between Frequency of Toothbrushing and Metabolic Syndrome among Adolescents: A 5-Year Follow-Up Study. Int. J. Environ. Res. Public Health 2022, 19, 508. [Google Scholar] [CrossRef]
- Ellis, P.D. The Essential Guide to Effect Sizes: Statistical Power, Meta-Analysis, and the Interpretation of Research Results; Cambridge University Press: Cambridge, UK, 2010. [Google Scholar]
- Colquhoun, D. An investigation of the false discovery rate and the misinterpretation of p-values. R. Soc. Open Sci. 2014, 1, 140216. [Google Scholar] [CrossRef]
- Guilherme, H.O.; Nesbitt, G.C.; Murphy, J.G.; Habermann, T.M. Mayo Clinic Medical Manual and Mayo Clinic Internal Medicine Review; CRC Press: Boca Raton, FL, USA, 2007. [Google Scholar]
- Ghosh, A.K. Mayo Clinic Internal Medicine Review, 8th ed.; mcGraw-Hill: New York, NY, USA, 2008; 1101p, ISBN 978-1420084788. [Google Scholar]
Disclaimer/Publisher’s Note: The statements, opinions and data contained in all publications are solely those of the individual author(s) and contributor(s) and not of MDPI and/or the editor(s). MDPI and/or the editor(s) disclaim responsibility for any injury to people or property resulting from any ideas, methods, instructions or products referred to in the content. |
© 2024 by the authors. Licensee MDPI, Basel, Switzerland. This article is an open access article distributed under the terms and conditions of the Creative Commons Attribution (CC BY) license (https://creativecommons.org/licenses/by/4.0/).