Dual Classification Approach for the Rapid Discrimination of Metabolic Syndrome by FTIR
Abstract
:1. Introduction
2. Materials and Methods
2.1. Study Population
2.2. Sample Collection
2.3. Method
2.4. Data Analysis
3. Results and Discussion
3.1. Descriptive Statistics
3.2. Exploratory Analysis with PCA
3.3. Supervised Techniques
3.3.1. SELECT
3.3.2. LDA on Clinical Parameters
3.3.3. SELECT-LDA on IR Wavenumbers
3.3.4. SIMCA
SIMCA on Clinical Parameters
SELECT-SIMCA on IR Wavenumbers
3.3.5. Biochemical Reasoning of Ten Extracted Signals
4. Conclusions
Author Contributions
Funding
Institutional Review Board Statement
Informed Consent Statement
Data Availability Statement
Conflicts of Interest
References
- Saklayen, M.G. The Global Epidemic of the Metabolic Syndrome. Curr. Hypertens. Rep. 2018, 20, 12. [Google Scholar] [CrossRef] [PubMed] [Green Version]
- Esposito, K.; Chiodini, P.; Capuano, A.; Bellastella, G.; Maiorino, M.I.; Giugliano, D. Metabolic Syndrome and Endometrial Cancer: A Meta-Analysis. Endocrine 2014, 45, 28–36. [Google Scholar] [CrossRef] [PubMed]
- Mili, N.; Paschou, S.A.; Goulis, D.G.; Dimopoulos, M.-A.; Lambrinoudaki, I.; Psaltopoulou, T. Obesity, Metabolic Syndrome, and Cancer: Pathophysiological and Therapeutic Associations. Endocrine 2021, 74, 478–497. [Google Scholar] [CrossRef] [PubMed]
- Esposito, K.; Chiodini, P.; Colao, A.; Lenzi, A.; Giugliano, D. Metabolic Syndrome and Risk of Cancer: A Systematic Review and Meta-Analysis. Diabetes Care 2012, 35, 2402–2411. [Google Scholar] [CrossRef] [PubMed] [Green Version]
- Alexandra, K.; Konstantinos, I.; Konstantinos, S.; Alexandros, S.; Michalis, D.; Vasilios, A.; Katsimardou, A.; Imprialos, K.; Stavropoulos, K.; Sachinidis, A.; et al. Hypertension in Metabolic Syndrome: Novel Insights. Curr. Hypertens. Rev. 2019, 16, 12–18. [Google Scholar] [CrossRef]
- Isomaa, B.; Almgren, P.; Tuomi, T.; Forsén, B.; Lahti, K.; Nissén, M.; Taskinen, M.R.; Groop, L. Cardiovascular Morbidity and Mortality Associated with the Metabolic Syndrome. Diabetes Care 2001, 24, 683–689. [Google Scholar] [CrossRef] [Green Version]
- Federspil, G.; Nisoli, E.; Vettor, R. A Critical Reflection on the Definition of Metabolic Syndrome. Pharmacol. Res. 2006, 53, 449–456. [Google Scholar] [CrossRef]
- Abebe, S.M.; Demisse, A.G.; Alemu, S.; Abebe, B.; Mesfin, N. Magnitude of Metabolic Syndrome in Gondar Town, Northwest Ethiopia: A Community-Based Cross-Sectional Study. PLoS ONE 2021, 16, e0257306. [Google Scholar] [CrossRef]
- Motuma, A.; Gobena, T.; Roba, K.T.; Berhane, Y.; Worku, A. Metabolic Syndrome Among Working Adults in Eastern Ethiopia. Diabetes Metab. Syndr. Obes. Targets Ther. 2020, 13, 4941–4951. [Google Scholar] [CrossRef]
- Misra, A.; Khurana, L. The Metabolic Syndrome in South Asians: Epidemiology, Determinants, and Prevention. Metab. Syndr. Relat. Disord. 2009, 7, 497–514. [Google Scholar] [CrossRef]
- Huang, P.L. A Comprehensive Definition for Metabolic Syndrome. Dis. Models Mech. 2009, 2, 231–237. [Google Scholar] [CrossRef] [PubMed] [Green Version]
- Punthakee, Z.; Goldenberg, R.; Katz, P. Definition, Classification and Diagnosis of Diabetes, Prediabetes and Metabolic Syndrome. Can. J. Diabetes 2018, 42 (Suppl. 1), S10–S15. [Google Scholar] [CrossRef] [PubMed] [Green Version]
- Alberti, K.G.M.M.; Zimmet, P.; Shaw, J. Metabolic Syndrome—A New World-Wide Definition. A Consensus Statement from the International Diabetes Federation. Diabet. Med. 2006, 23, 469–480. [Google Scholar] [CrossRef] [PubMed]
- KG Alberti, R.E.S.G.P.Z.J.C.K.D.J.F.W.J.C.L.S.S. Harmonizing the Metabolic Syndrome: A Joint Interim Statement of the International Diabetes Federation Task Force on Epidemiology and Prevention. Circulation 2009, 120, 1640–1645. [Google Scholar] [CrossRef] [Green Version]
- Reddy, P.; Leong, J.; Jialal, I. Amino Acid Levels in Nascent Metabolic Syndrome: A Contributor to the pro-Inflammatory Burden. J. Diabetes Complicat. 2018, 32, 465–469. [Google Scholar] [CrossRef] [PubMed]
- Smith, M.; Honce, R.; Schultz-Cherry, S. Metabolic Syndrome and Viral Pathogenesis: Lessons from Influenza and Coronaviruses. J. Virol. 2020, 94, e00665-20. [Google Scholar] [CrossRef]
- O’Neill, S.; O’Driscoll, L. Metabolic Syndrome: A Closer Look at the Growing Epidemic and Its Associated Pathologies. Obes. Rev. 2015, 16, 1–12. [Google Scholar] [CrossRef] [Green Version]
- Lee, Y.H.; Pratley, R.E. The Evolving Role of Inflammation in Obesity and the Metabolic Syndrome. Curr. Diabetes Rep. 2005, 5, 70–75. [Google Scholar] [CrossRef]
- Bovolini, A.; Garcia, J.; Andrade, M.A.; Duarte, J.A. Metabolic Syndrome Pathophysiology and Predisposing Factors. Int. J. Sports Med. 2021, 42, 199–214. [Google Scholar] [CrossRef]
- Fanta, K.; Daba, F.B.; Asefa, E.T.; Chelkeba, L.; Melaku, T. Prevalence and Impact of Metabolic Syndrome on Short-Term Prognosis in Patients with Acute Coronary Syndrome: Prospective Cohort Study. Diabetes Metab. Syndr. Obes. 2021, 14, 3253–3262. [Google Scholar] [CrossRef]
- Wiklund, P.K.; Pekkala, S.; Autio, R.; Munukka, E.; Xu, L.; Saltevo, J.; Cheng, S.; Kujala, U.M.; Alen, M.; Cheng, S. Serum Metabolic Profiles in Overweight and Obese Women with and without Metabolic Syndrome. Diabetol. Metab. Syndr. 2014, 6, 40. [Google Scholar] [CrossRef] [PubMed] [Green Version]
- Esposito, K.; Chiodini, P.; Capuano, A.; Bellastella, G.; Maiorino, M.I.; Rafaniello, C.; Panagiotakos, D.B.; Giugliano, D. Colorectal Cancer Association with Metabolic Syndrome and Its Components: A Systematic Review with Meta-Analysis. Endocrine 2013, 44, 634–647. [Google Scholar] [CrossRef]
- Lemieux, I.; Després, J.P. Metabolic Syndrome: Past, Present and Future. Nutrients 2020, 12, 3501. [Google Scholar] [CrossRef]
- Shao, Y.; Le, W. Recent Advances and Perspectives of Metabolomics-Based Investigations in Parkinson’s Disease. Mol. Neurodegener. 2019, 14, 3. [Google Scholar] [CrossRef] [PubMed] [Green Version]
- González-Domínguez, R.; García-Barrera, T.; Gómez-Ariza, J.L. Combination of Metabolomic and Phospholipid-Profiling Approaches for the Study of Alzheimer’s Disease. J. Proteom. 2014, 104, 37–47. [Google Scholar] [CrossRef] [PubMed]
- Alonso, A.; Marsal, S.; Julià, A. Analytical Methods in Untargeted Metabolomics: State of the Art in 2015. Front. Bioeng. Biotechnol. 2015, 3, 23. [Google Scholar] [CrossRef] [Green Version]
- Spalding, K.; Bonnier, F.; Bruno, C.; Blasco, H.; Board, R.; Benz-de Bretagne, I.; Byrne, H.J.; Butler, H.J.; Chourpa, I.; Radhakrishnan, P.; et al. Enabling Quantification of Protein Concentration in Human Serum Biopsies Using Attenuated Total Reflectance–Fourier Transform Infrared (ATR-FTIR) Spectroscopy. Vib. Spectrosc. 2018, 99, 50–58. [Google Scholar] [CrossRef] [Green Version]
- Gika, H.G.; Wilson, I.D. Global Metabolic Profiling for the Study of Alcohol-Related Disorders. Bioanalysis 2014, 6, 59–77. [Google Scholar] [CrossRef]
- Serkova, N.J.; Standiford, T.J.; Stringer, K.A. The Emerging Field of Quantitative Blood Metabolomics for Biomarker Discovery in Critical Illnesses. Am. J. Respir. Crit. Care Med. 2011, 184, 647–655. [Google Scholar] [CrossRef] [Green Version]
- Finlayson, D.; Rinaldi, C.; Baker, M.J. Is Infrared Spectroscopy Ready for the Clinic? Anal. Chem. 2019, 19, 12117–12128. [Google Scholar] [CrossRef]
- Lovergne, L.; Lovergne, J.; Bouzy, P.; Untereiner, V.; Offroy, M.; Garnotel, R.; Thiéfin, G.; Baker, M.J.; Sockalingum, G.D. Investigating Pre-Analytical Requirements for Serum and Plasma Based Infrared Spectro-Diagnostic. J. Biophotonics 2019, 12, e201900177. [Google Scholar] [CrossRef] [PubMed]
- Maitra, I.; Morais, C.L.M.; Lima, K.M.G.; Ashton, K.M.; Date, R.S.; Martin, F.L. Attenuated Total Reflection Fourier-Transform Infrared Spectral Discrimination in Human Bodily Fluids of Oesophageal Transformation to Adenocarcinoma. Analyst 2019, 144, 7447–7456. [Google Scholar] [CrossRef] [PubMed]
- Roy, S.; Perez-Guaita, D.; Bowden, S.; Heraud, P.; Wood, B.R. Spectroscopy Goes Viral: Diagnosis of Hepatitis B and C Virus Infection from Human Sera Using ATR-FTIR Spectroscopy. Clin. Spectrosc. 2019, 1, 100001. [Google Scholar] [CrossRef]
- Kaznowska, E.; Depciuch, J.; Łach, K.; Kołodziej, M.; Koziorowska, A.; Vongsvivut, J.; Zawlik, I.; Cholewa, M.; Cebulski, J. The Classification of Lung Cancers and Their Degree of Malignancy by FTIR, PCA-LDA Analysis, and a Physics-Based Computational Model. Talanta 2018, 186, 337–345. [Google Scholar] [CrossRef]
- Perez-Guaita, D.; Garrigues, S.; de la Miguel, G. Infrared-Based Quantification of Clinical Parameters. TrAC Trends Anal. Chem. 2014, 62, 93–105. [Google Scholar] [CrossRef]
- Wang, X.; Wu, Q.; Li, C.; Zhou, Y.; Xu, F.; Zong, L.; Ge, S. A Study of Parkinson’s Disease Patients’ Serum Using FTIR Spectroscopy. Infrared Phys. Technol. 2020, 106, 103279. [Google Scholar] [CrossRef]
- Baioumi, A.Y.A.A. Comparing Measures of Obesity: Waist Circumference, Waist-Hip, and Waist-Height Ratios. In Nutrition in the Prevention and Treatment of Abdominal Obesity; Elsevier: Amsterdam, The Netherlands, 2019; pp. 29–40. [Google Scholar]
- Pizarro, C.; Arenzana-Rámila, I.; Pérez-del-Notario, N.; Pérez-Matute, P.; González-Sáiz, J.M. Thawing as a Critical Pre-Analytical Step in the Lipidomic Profiling of Plasma Samples: New Standardized Protocol. Anal. Chim. Acta 2016, 912, 1–9. [Google Scholar] [CrossRef]
- Forina, M.; Lanteri, S.; Oliveros, M.C.C.; Millan, C.P. Selection of Useful Predictors in Multivariate Calibration. Anal. Bioanal. Chem. 2004, 380, 397–418. [Google Scholar] [CrossRef]
- Pizarro, C.; Esteban-Díez, I.; Arenzana-Rámila, I.; González-Sáiz, J.M. Discrimination of Patients with Different Serological Evolution of HIV and Co-Infection with HCV Using Metabolic Fingerprinting Based on Fourier Transform Infrared. J. Biophotonics 2018, 11, e201700035. [Google Scholar] [CrossRef]
- Pizarro, C.; Esteban-Díez, I.; Espinosa, M.; Rodríguez-Royo, F.; González-Sáiz, J.M. An NMR-Based Lipidomic Approach to Identify Parkinson’s Disease-Stage Specific Lipoprotein-Lipid Signatures in Plasma. Analyst 2019, 144, 1334–1344. [Google Scholar] [CrossRef]
- Tkachenko, K.; Espinosa, M.; Esteban-Díez, I.; González-Sáiz, J.M.; Pizarro, C. Extraction of Reduced Infrared Biomarker Signatures for the Stratification of Patients Affected by Parkinson’s Disease: An Untargeted Metabolomic Approach. Chemosensors 2022, 10, 229. [Google Scholar] [CrossRef]
- Cocchi, M.; Biancolillo, A.; Marini, F. Chemometric Methods for Classification and Feature Selection. In Comprehensive Analytical Chemistry; Elsevier B.V.: Amsterdam, The Netherlands, 2018; Volume 82, pp. 265–299. ISBN 9780444640444. [Google Scholar]
- Forina, M.; Lanteri, S.; Armanino, C.; Oliveros, M.C.C.; Casolino, C. V-PARVUS. An Extendable Package of Programs for Explorative Data Analysis, Classification and Regression Analysis. Dip.Chimica e Tecnologie Farmaceutiche ed Alimentari, University of Genova, Genova (Italy) 2011. Available online: https://iris.unige.it/handle/11567/202703 (accessed on 3 November 2022).
- Forina, M.; Oliveri, P.; Casale, M. Complete Validation for Classification and Class Modeling Procedures with Selection of Variables and/or with Additional Computed Variables. Chemom. Intell. Lab. Syst. 2010, 102, 110–122. [Google Scholar] [CrossRef]
- Brown, S.; Tauler, R.; Walczak, B. Comprehensive Chemometrics; Elsevier: Amsterdam, The Netherlands, 2010; ISBN 9780444527011. [Google Scholar]
- van der Greef, J.; Smilde, A.K. Symbiosis of Chemometrics and Metabolomics: Past, Present, and Future. J. Chemom. 2005, 19, 376–386. [Google Scholar] [CrossRef]
- Martin, M.; Perez-Guaita, D.; Andrew, D.W.; Richards, J.S.; Wood, B.R.; Heraud, P. The Effect of Common Anticoagulants in Detection and Quantification of Malaria Parasitemia in Human Red Blood Cells by ATR-FTIR Spectroscopy. Analyst 2017, 142, 1192–1199. [Google Scholar] [CrossRef] [PubMed]
- Tomasid, R.C.; Sayat, A.J.; Atienza, A.N.; Danganan, J.L.; Ramos, M.R.; Fellizar, A.; Notarteid, K.I.; Angeles, L.M.; Bangaoilid, R.; Santillan, A.; et al. Detection of Breast Cancer by ATR-FTIR Spectroscopy Using Artificial Neural Networks. PLoS ONE 2022, 17, e0262489. [Google Scholar] [CrossRef]
- Sitnikova, V.E.; Kotkova, M.A.; Nosenko, T.N.; Kotkova, T.N.; Martynova, D.M.; Uspenskaya, M.v. Breast Cancer Detection by ATR-FTIR Spectroscopy of Blood Serum and Multivariate Data-Analysis. Talanta 2020, 214, 120857. [Google Scholar] [CrossRef]
- Theophilou, G.; Lima, K.M.G.; Martin-Hirsch, P.L.; Stringfellow, H.F.; Martin, F.L. ATR-FTIR Spectroscopy Coupled with Chemometric Analysis Discriminates Normal, Borderline and Malignant Ovarian Tissue: Classifying Subtypes of Human Cancer. Analyst 2016, 141, 585–594. [Google Scholar] [CrossRef] [Green Version]
- Banerjee, A.; Gokhale, A.; Bankar, R.; Palanivel, V.; Salkar, A.; Robinson, H.; Shastri, J.S.; Agrawal, S.; Hartel, G.; Hill, M.M.; et al. Rapid Classification of COVID-19 Severity by ATR-FTIR Spectroscopy of Plasma Samples. Anal. Chem 2021, 93, 10391–10396. [Google Scholar] [CrossRef]
- el Khoury, Y.; Collongues, N.; de Sèze, J.; Gulsari, V.; Patte-Mensah, C.; Marcou, G.; Varnek, A.; Mensah-Nyagan, A.G.; Hellwig, P. Serum-Based Differentiation between Multiple Sclerosis and Amyotrophic Lateral Sclerosis by Random Forest Classification of FTIR Spectra. Analyst 2019, 144, 4647–4652. [Google Scholar] [CrossRef]
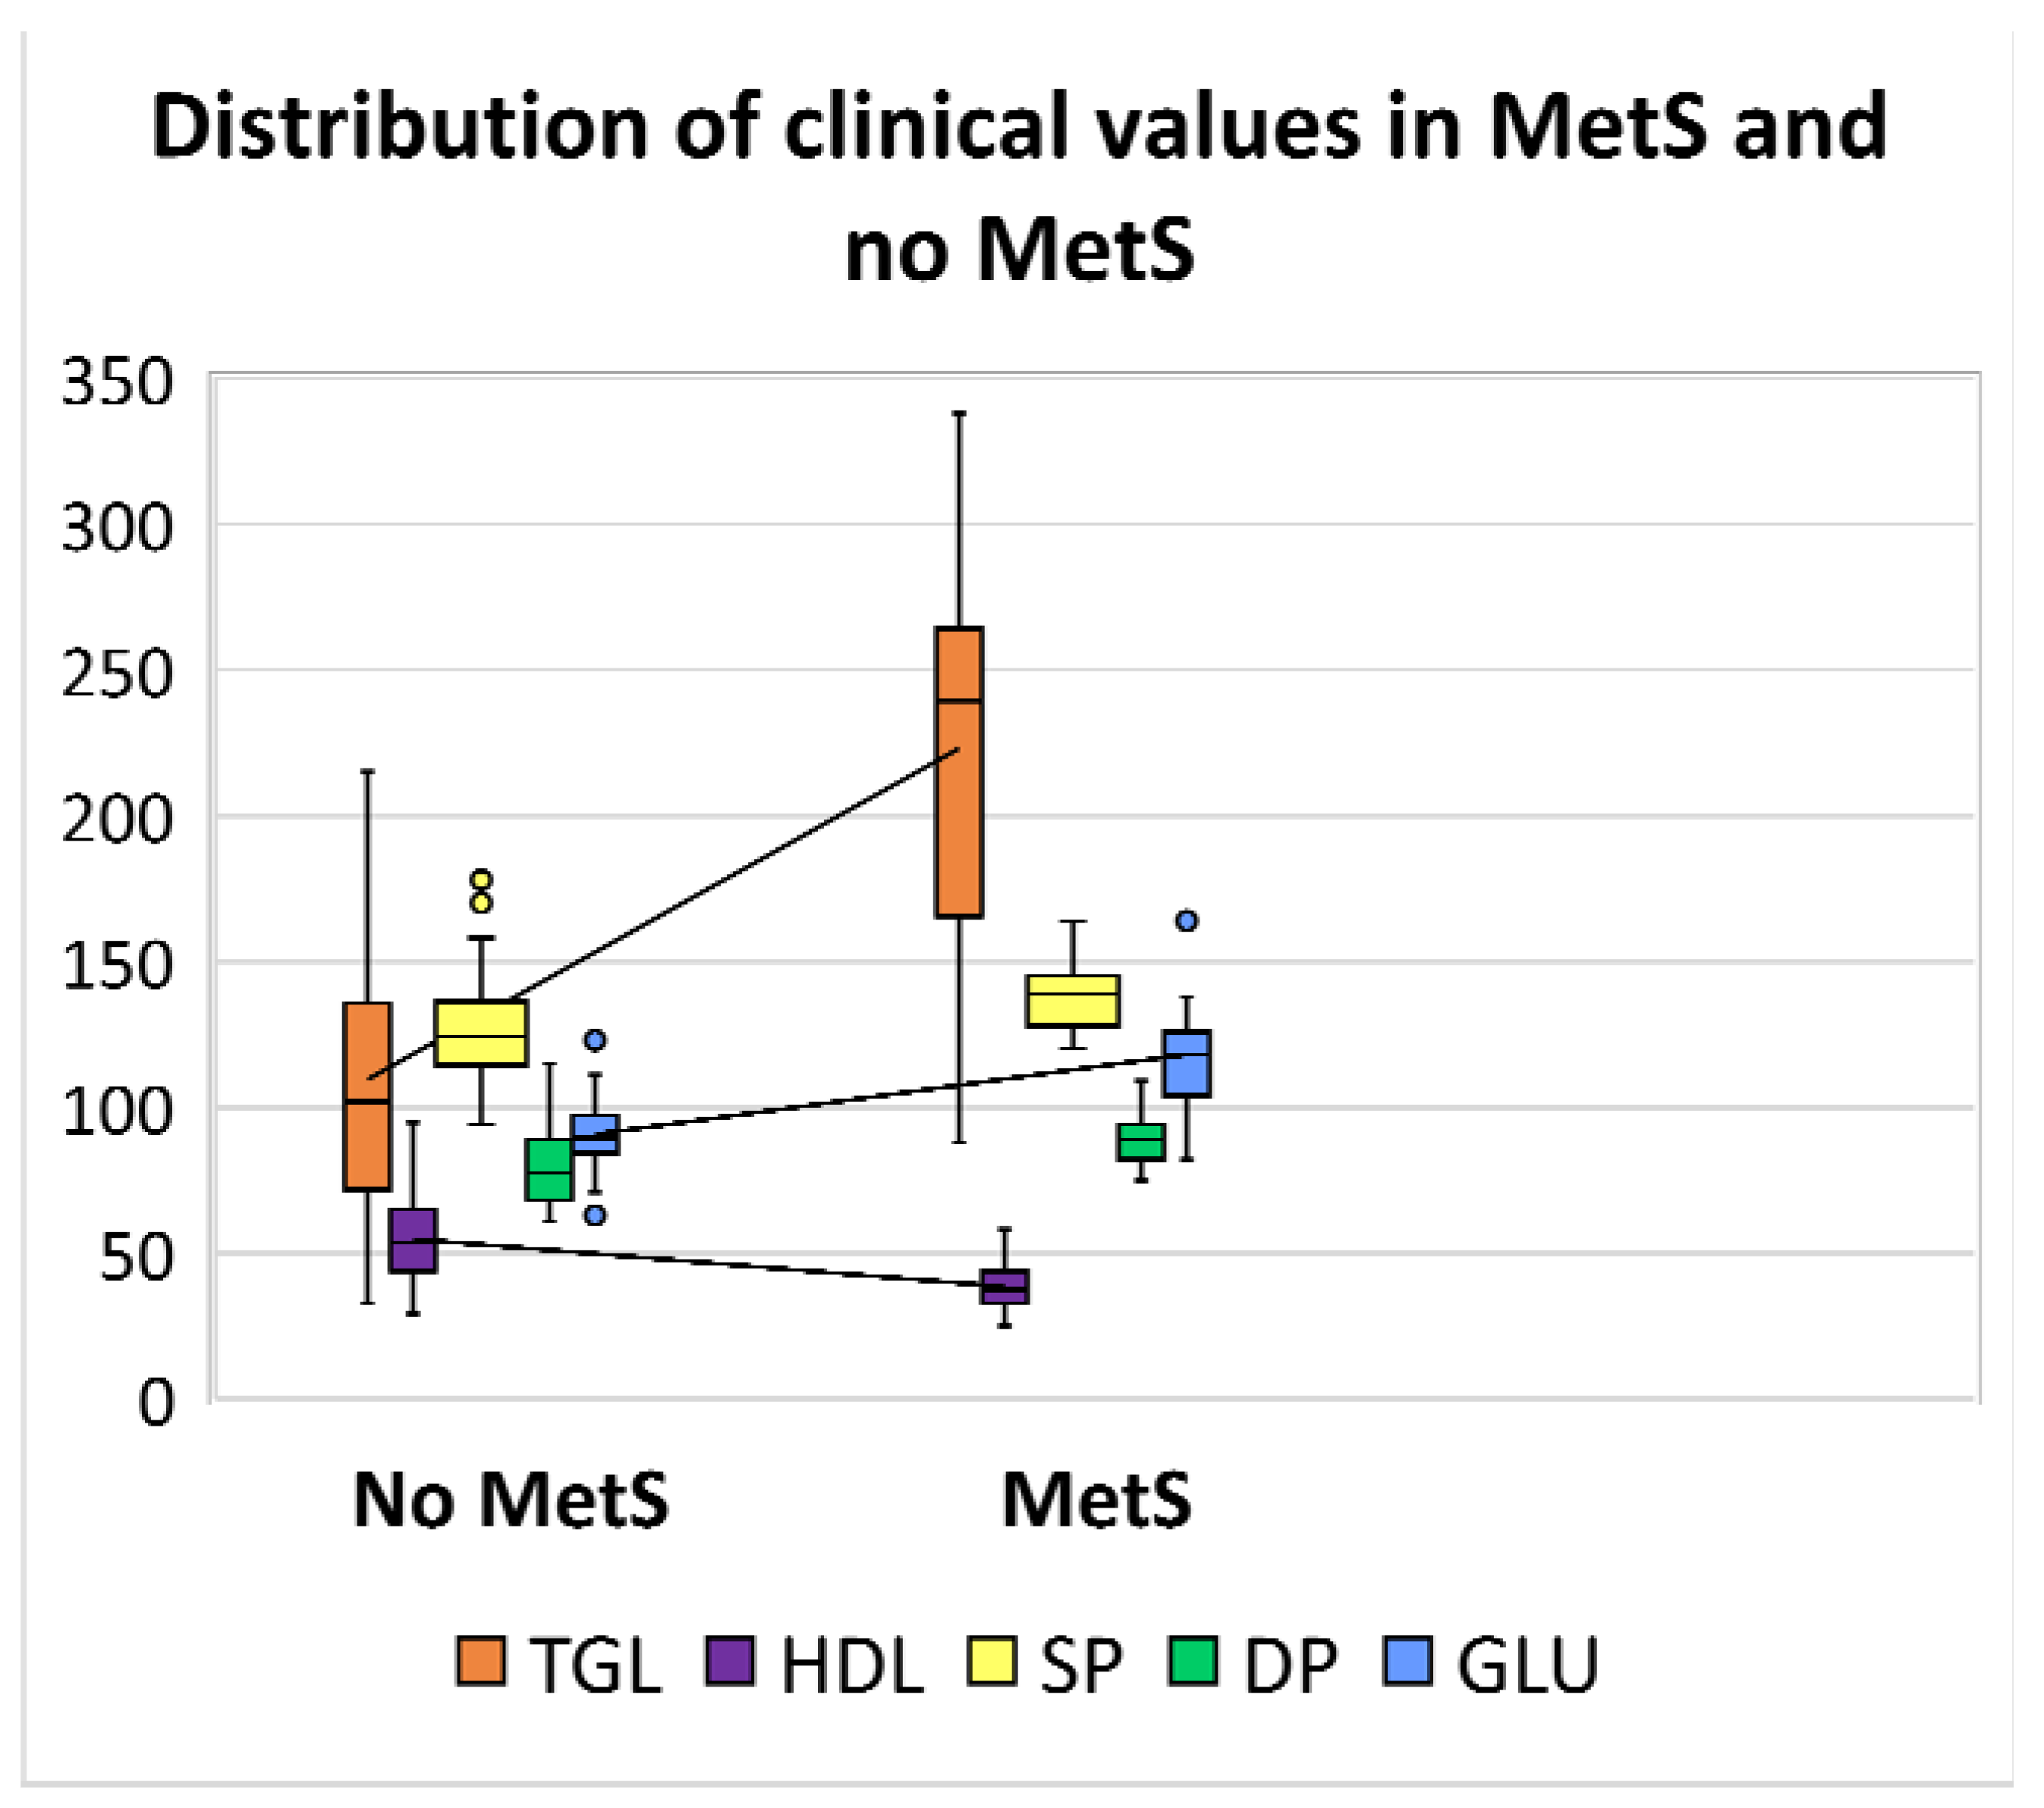
 ); high density lipoprotein (HDL) in violet (
 ); systolic pressure (SP) in yellow (
 ); diastolic pressure (DP) in green (
 ); and glucose (GLU) in blue (
 ).
).
 ); high density lipoprotein (HDL) in violet (
 ); systolic pressure (SP) in yellow (
 ); diastolic pressure (DP) in green (
 ); and glucose (GLU) in blue (
 ).
).
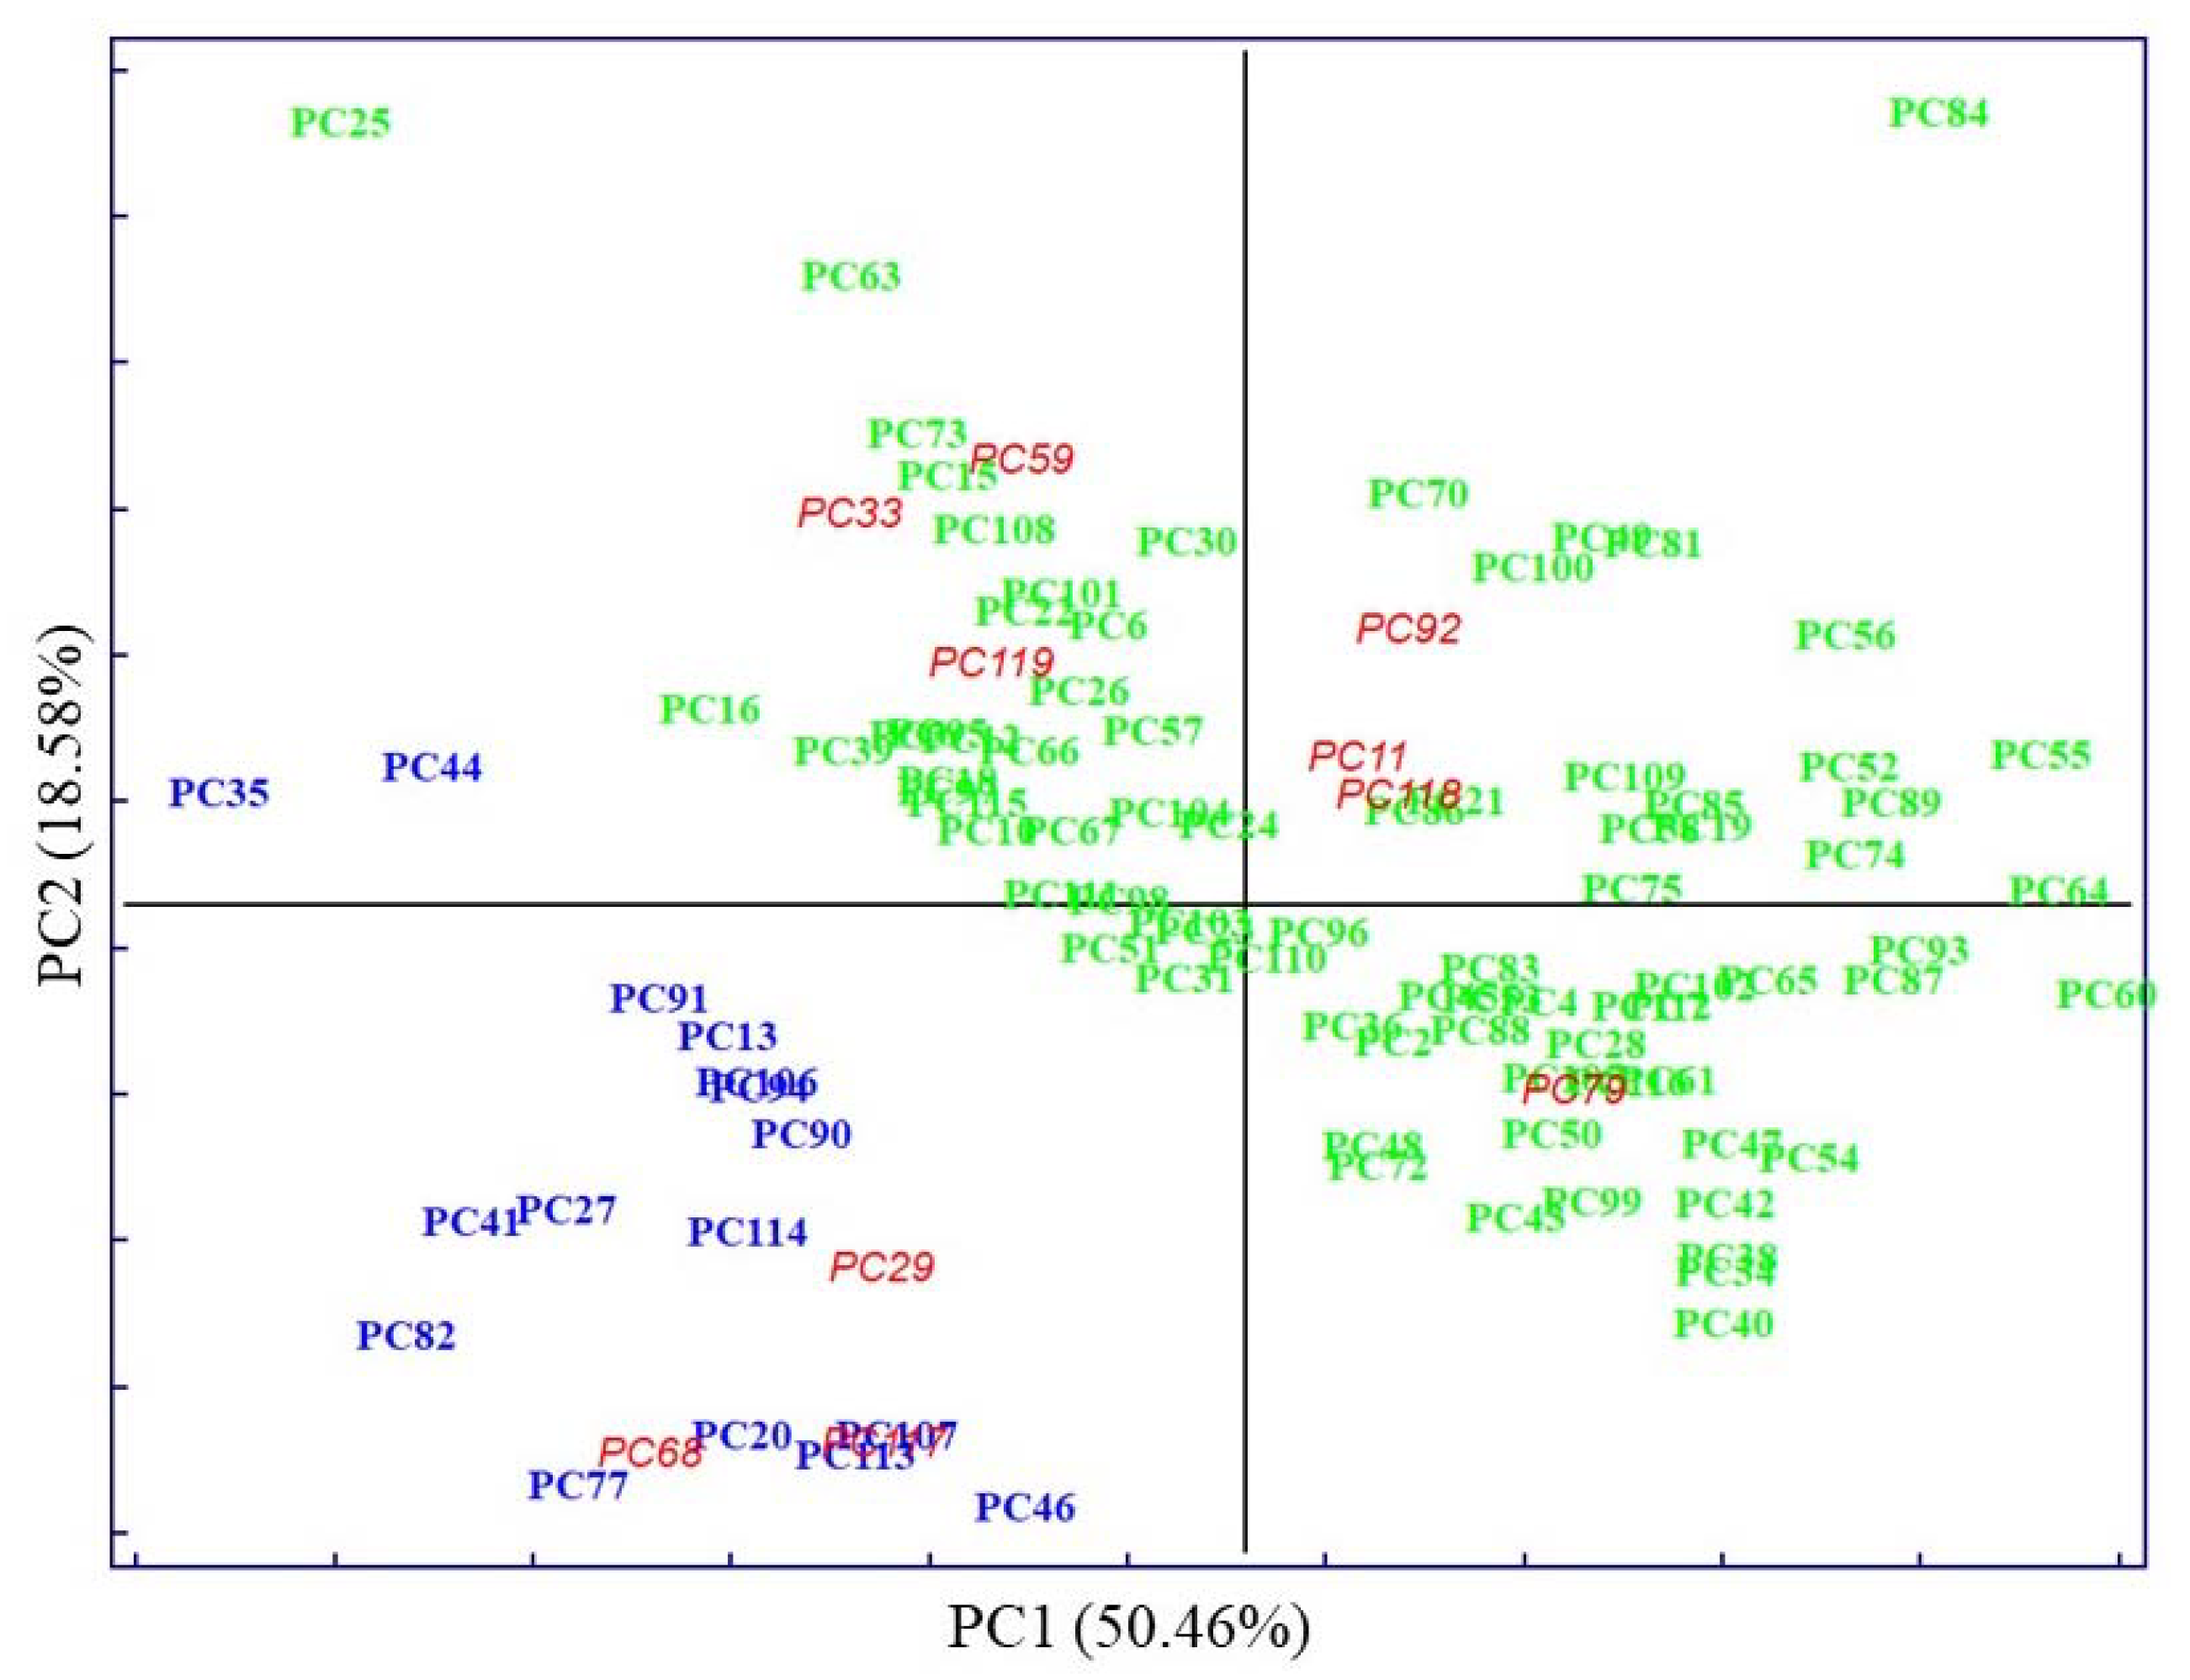
 ), MetS (
 ), and external test samples (
 ).
).
 ), MetS (
 ), and external test samples (
 ).
).
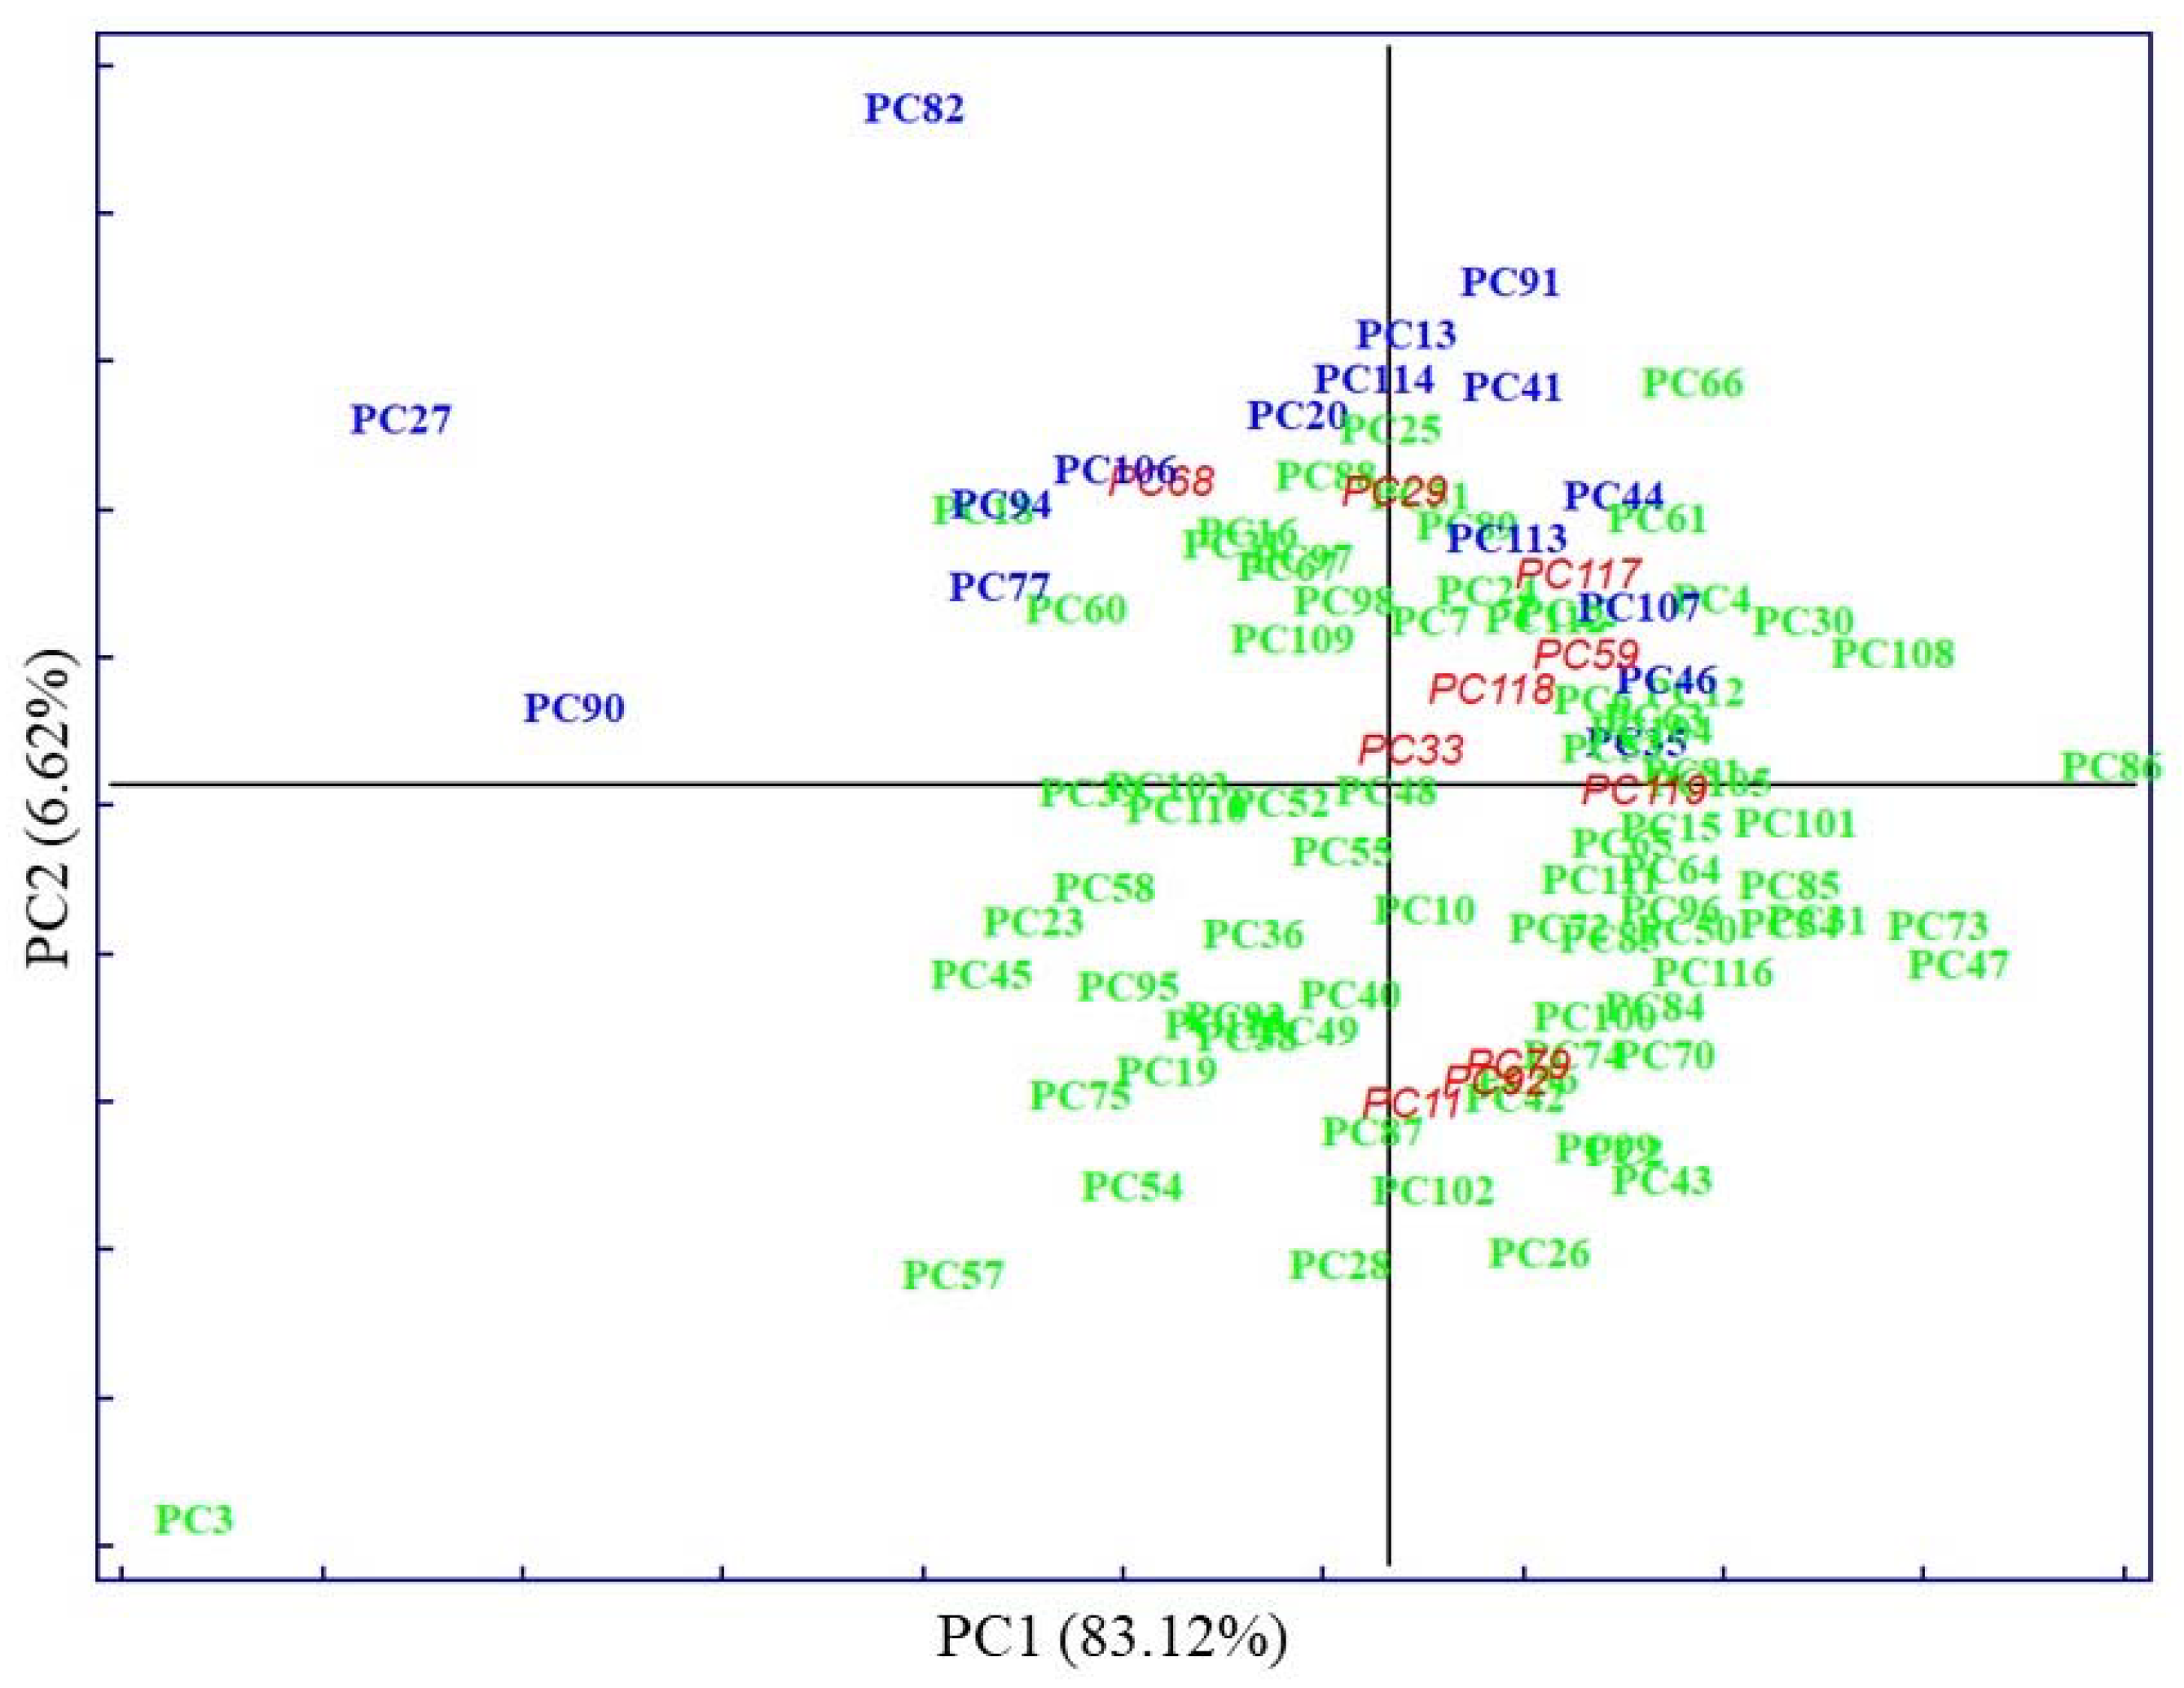
 ), MetS (
 ), and external test samples (
 ).
).
 ), MetS (
 ), and external test samples (
 ).
).
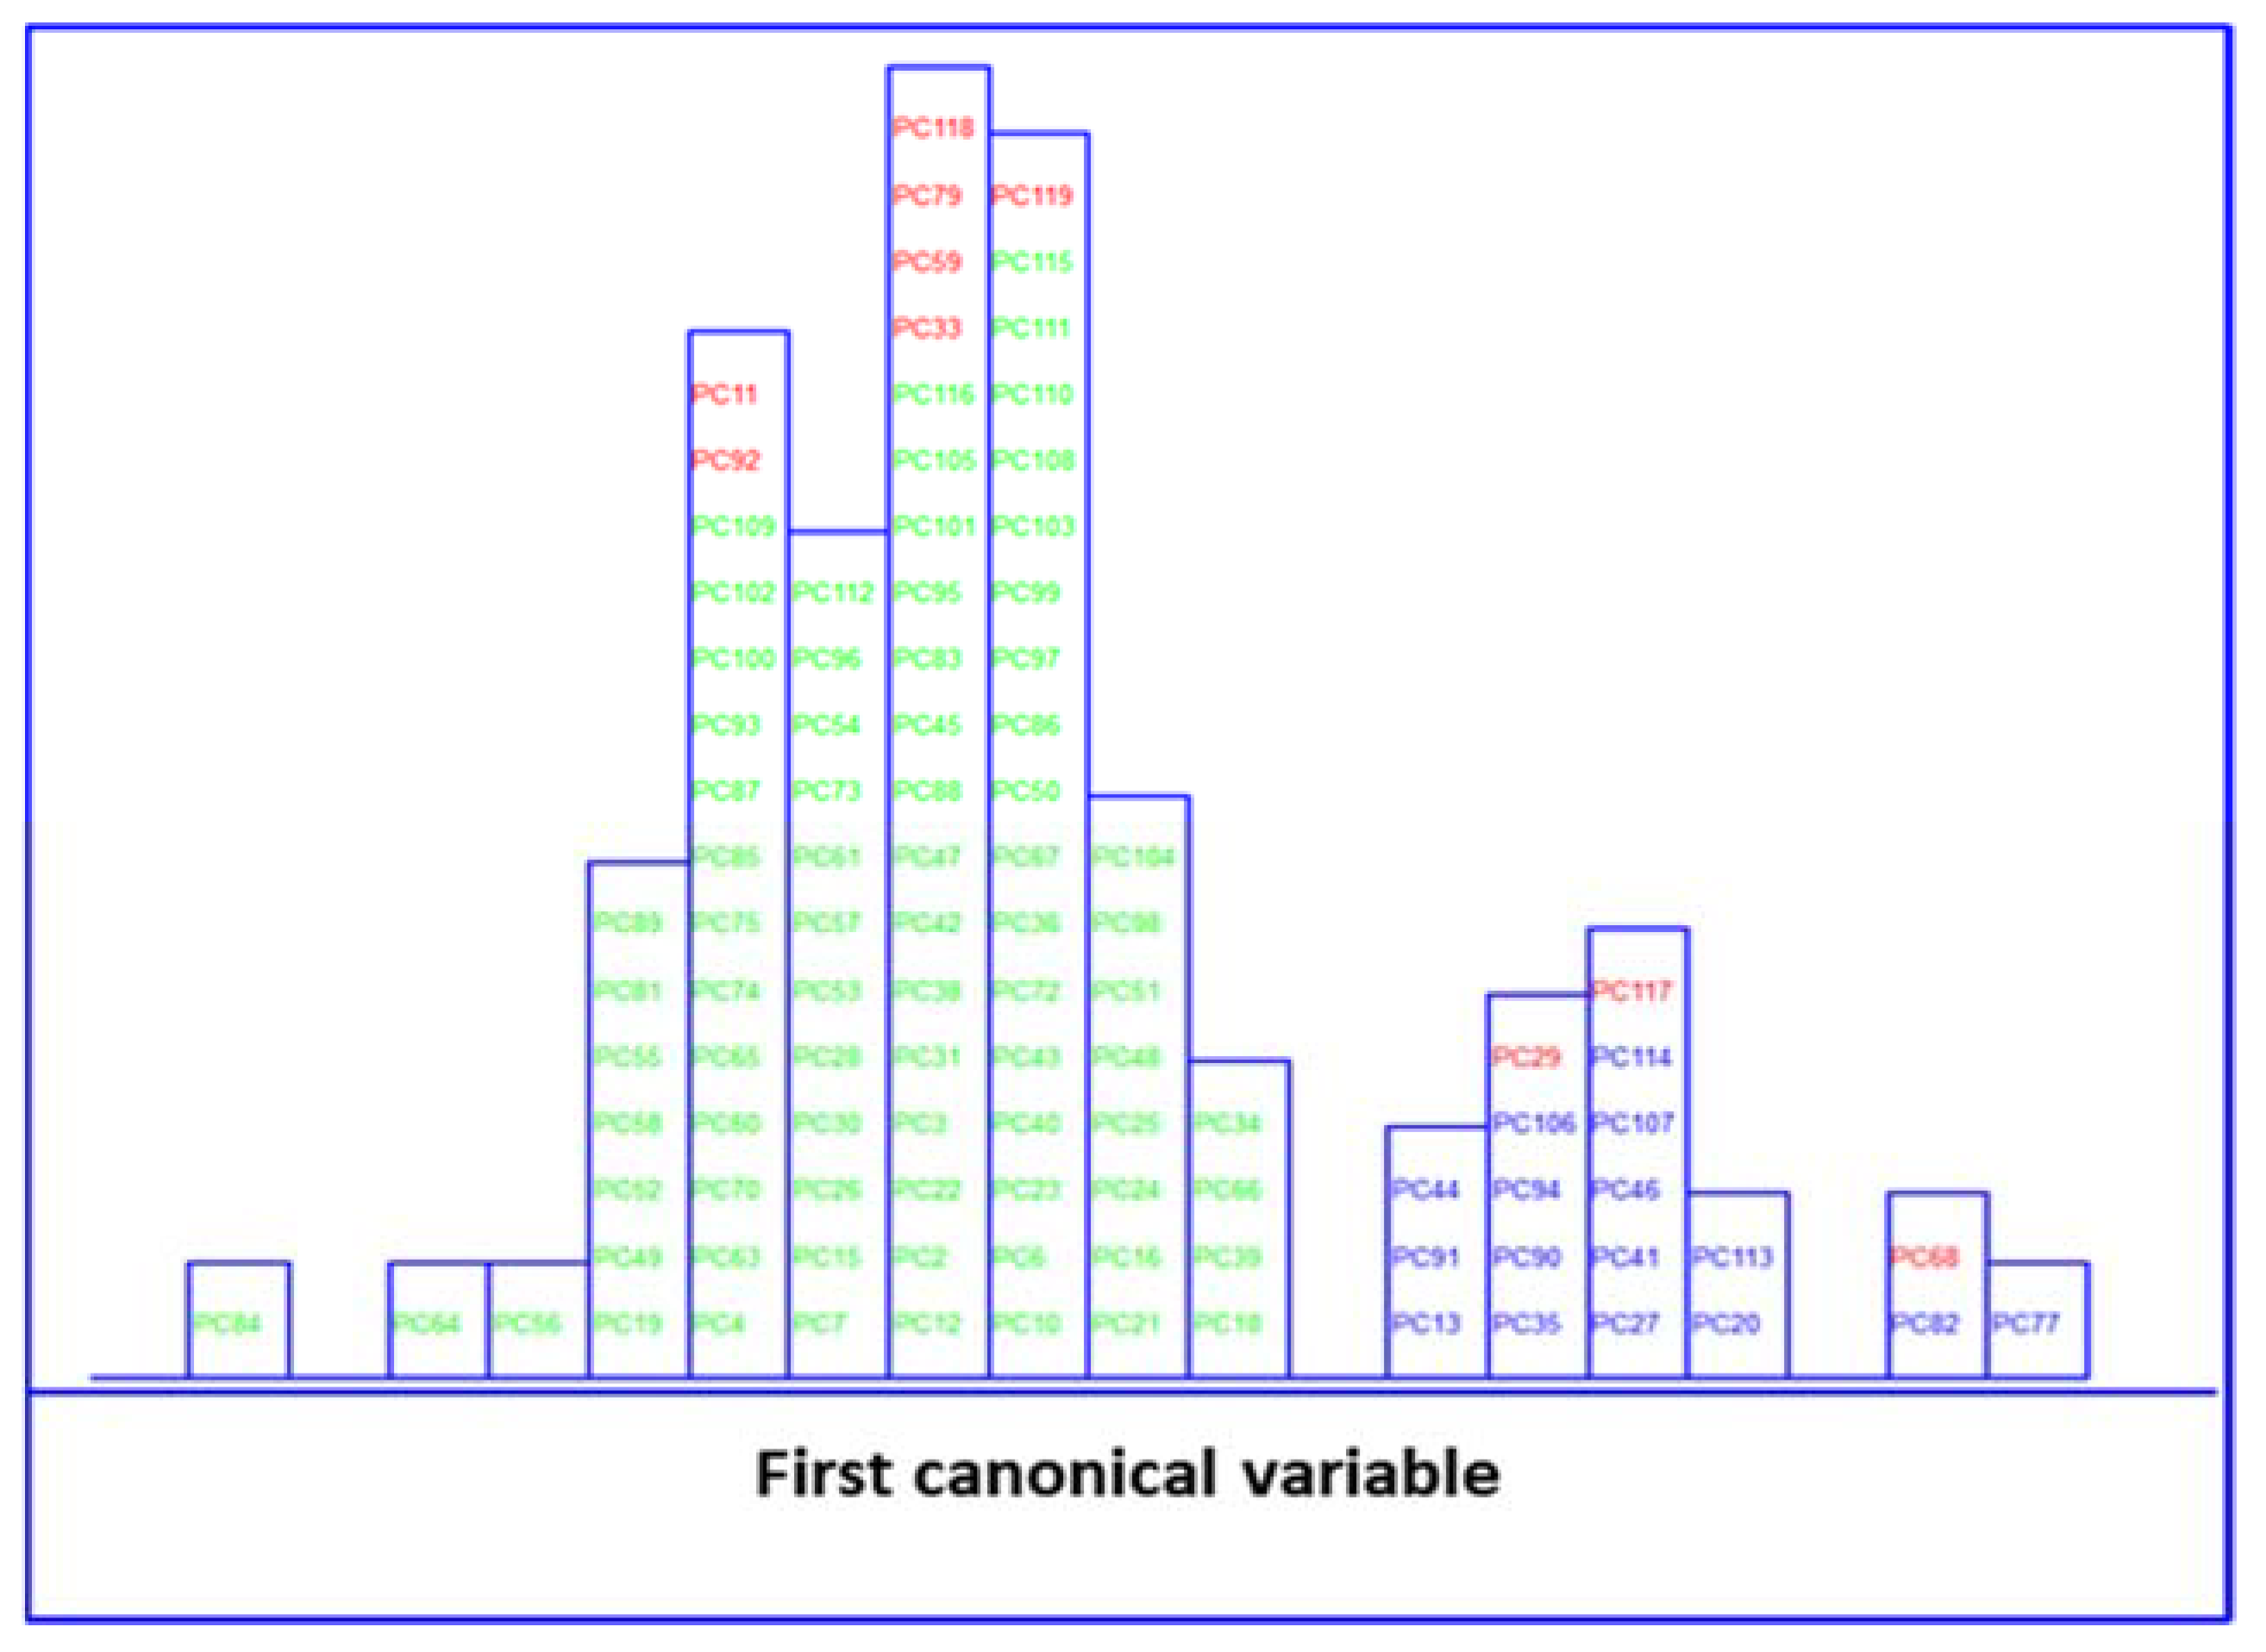
 ) and no MetS (
 ) patients within included (
 ) test set, after performing LDA in the stratification approach based on clinical parameters (y-axis indicates the maximum discrimination power between categories).
 ) and no MetS (
 ) patients within included (
 ) test set, after performing LDA in the stratification approach based on clinical parameters (y-axis indicates the maximum discrimination power between categories).
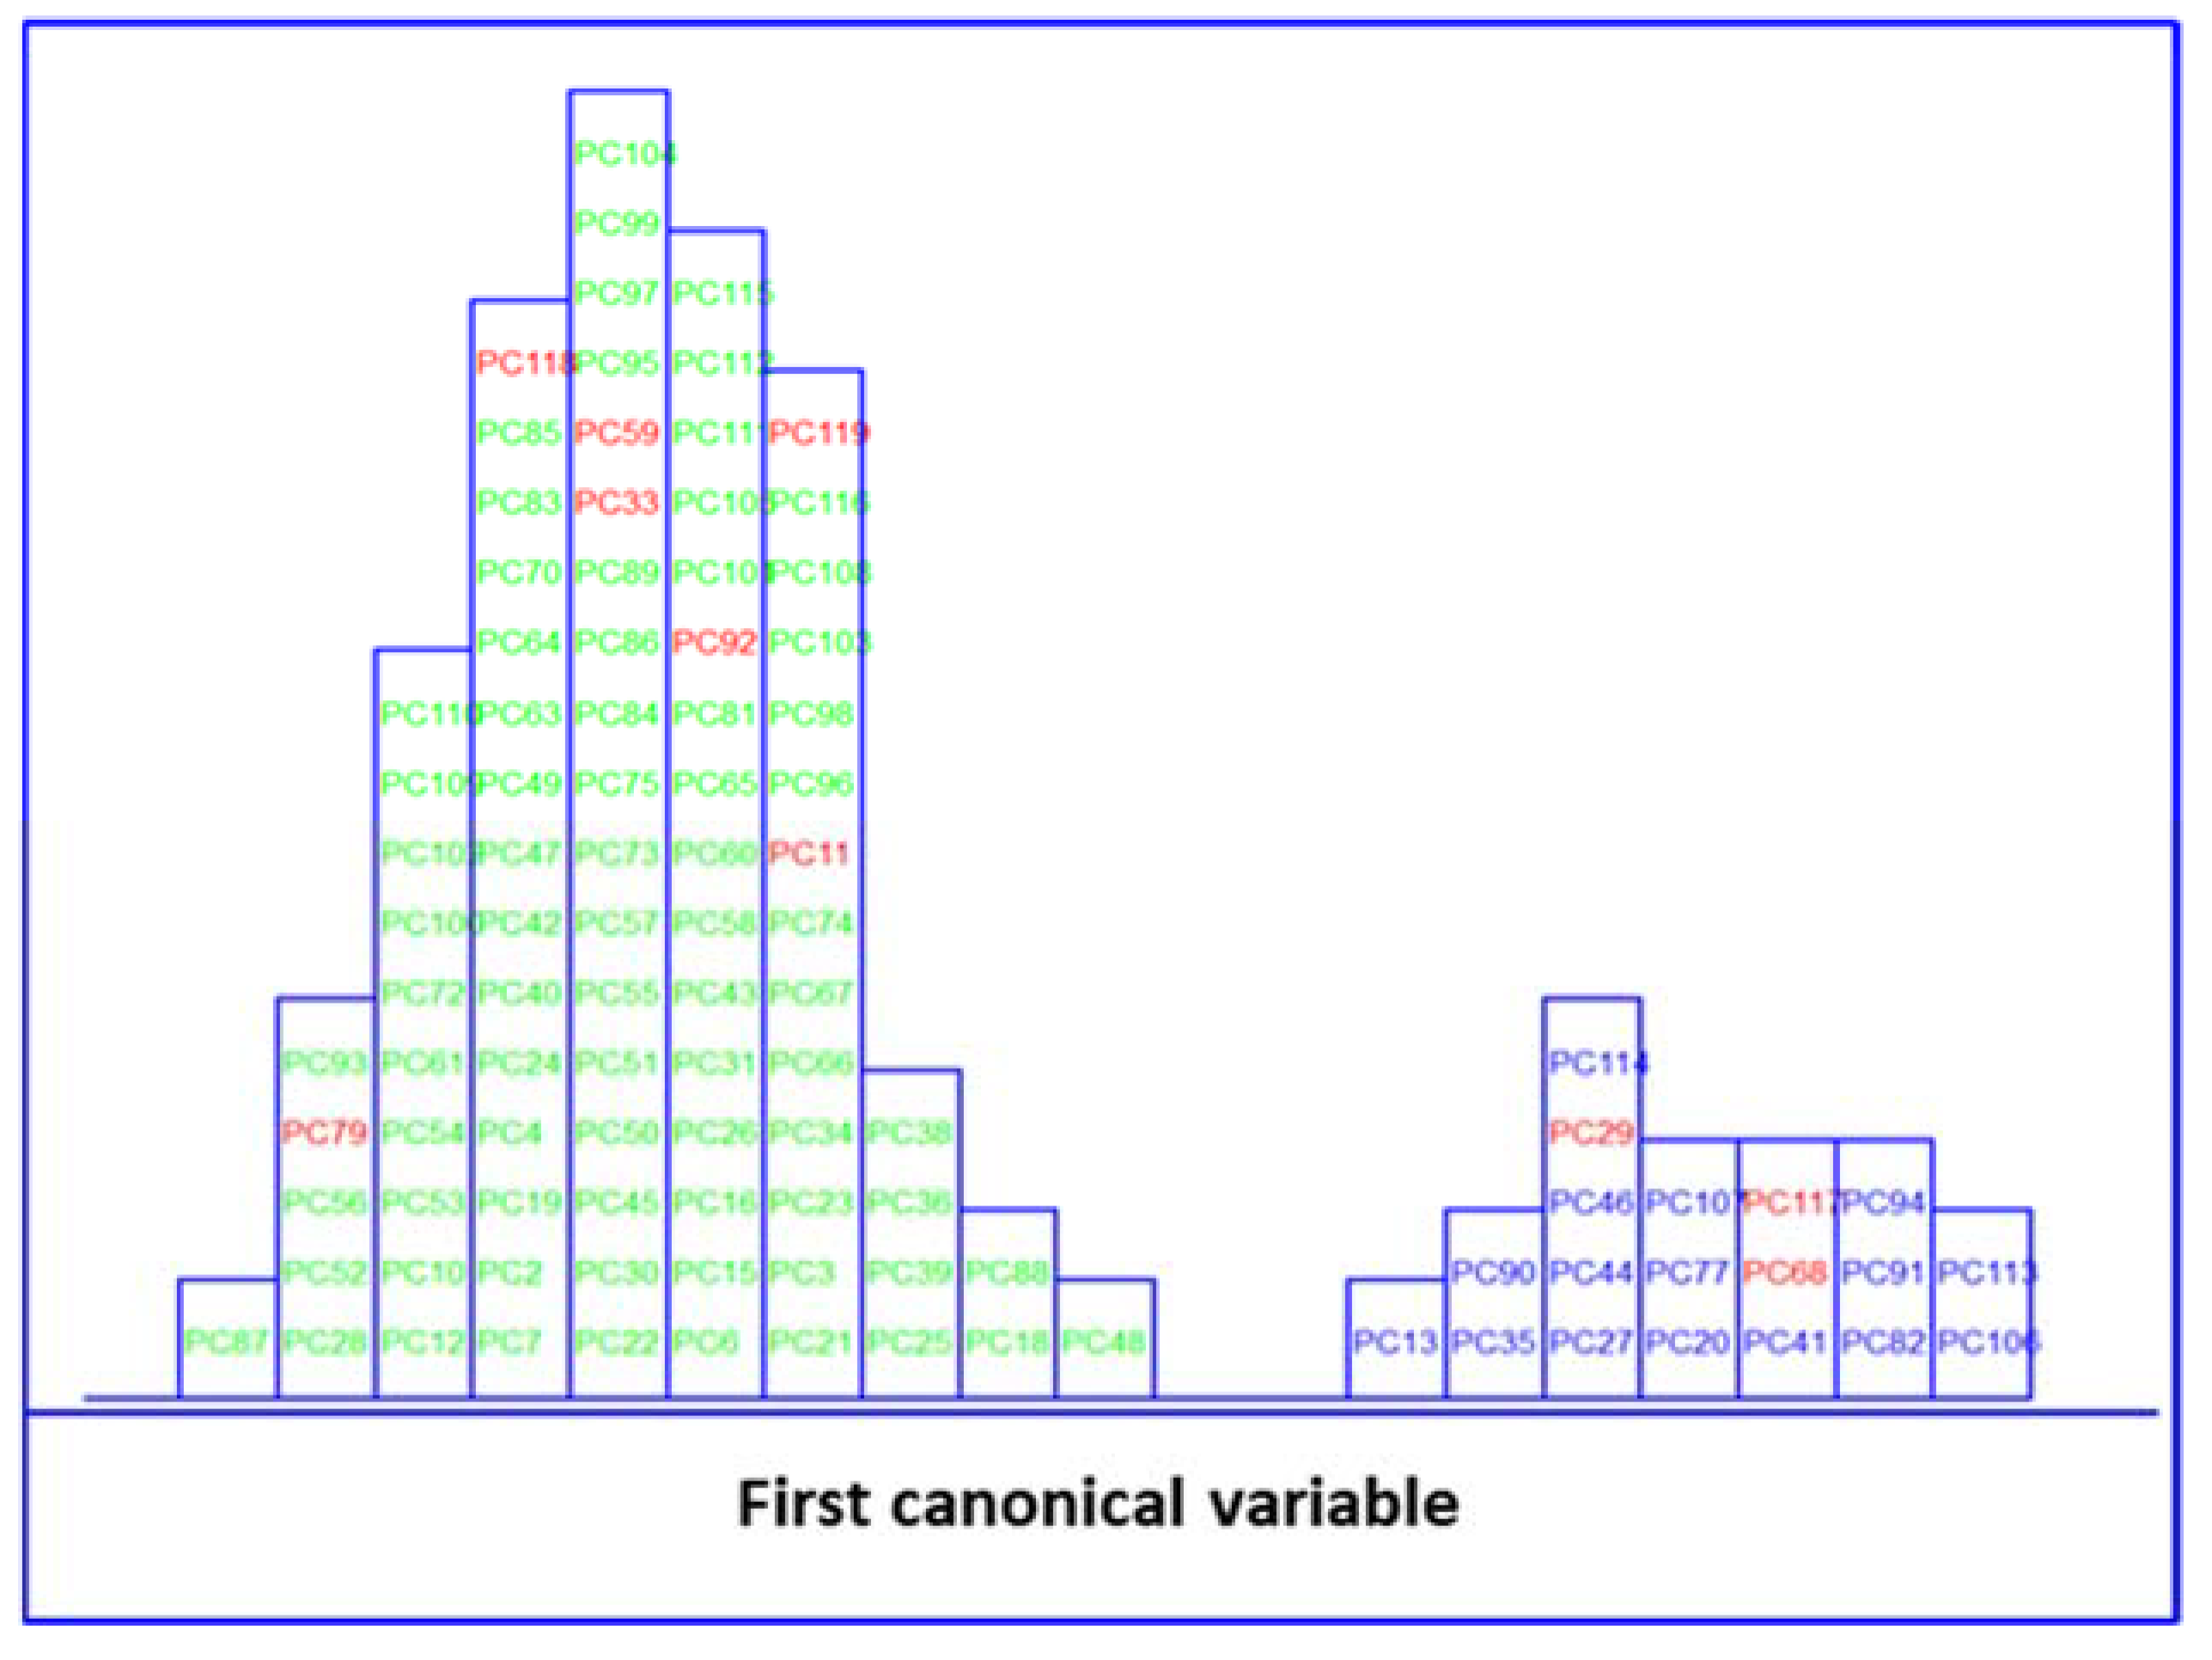
 ) and no MetS (
 ) patients within the included (
 ) test set, after performing SELECT-LDA in the stratification approach based on 20 IR variables (y-axis indicates the maximum discrimination power between categories).
 ) and no MetS (
 ) patients within the included (
 ) test set, after performing SELECT-LDA in the stratification approach based on 20 IR variables (y-axis indicates the maximum discrimination power between categories).
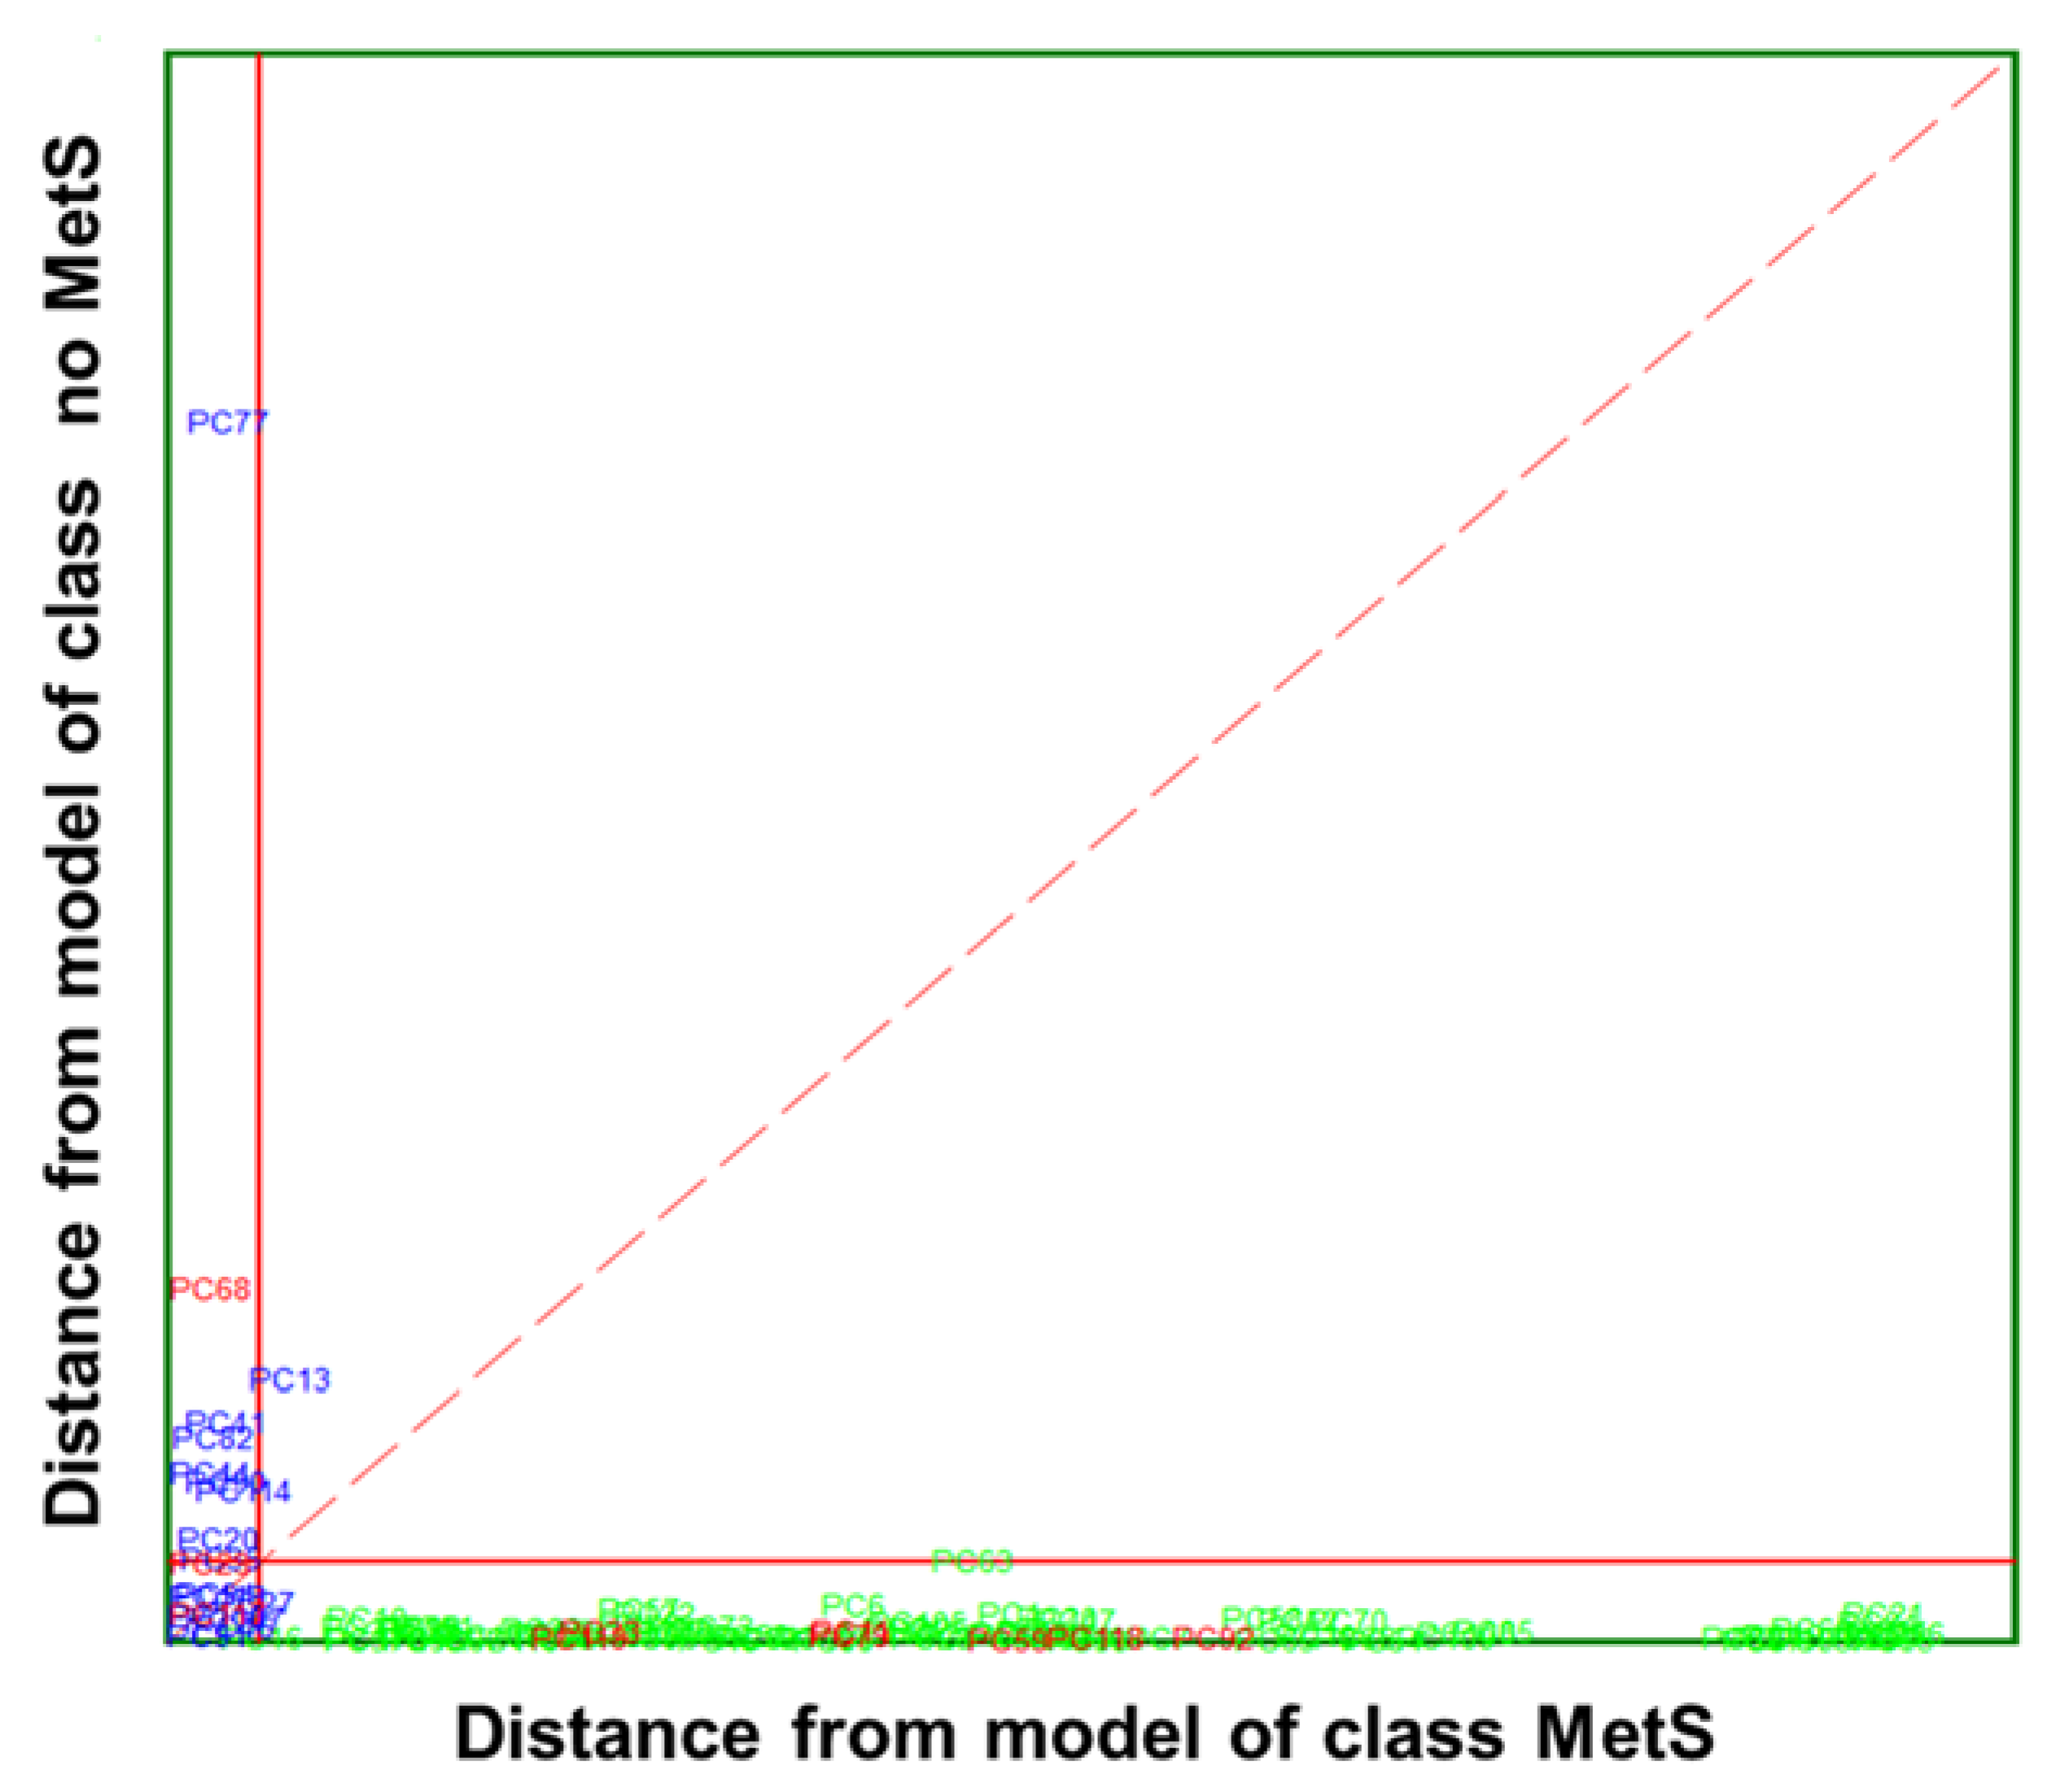
 ) and no MetS (
 ) patients within the included (
 ) test set. The red solid line indicates a confidence level for class space at 95%. The red dashed line indicates equal class distance.
 ) and no MetS (
 ) patients within the included (
 ) test set. The red solid line indicates a confidence level for class space at 95%. The red dashed line indicates equal class distance.
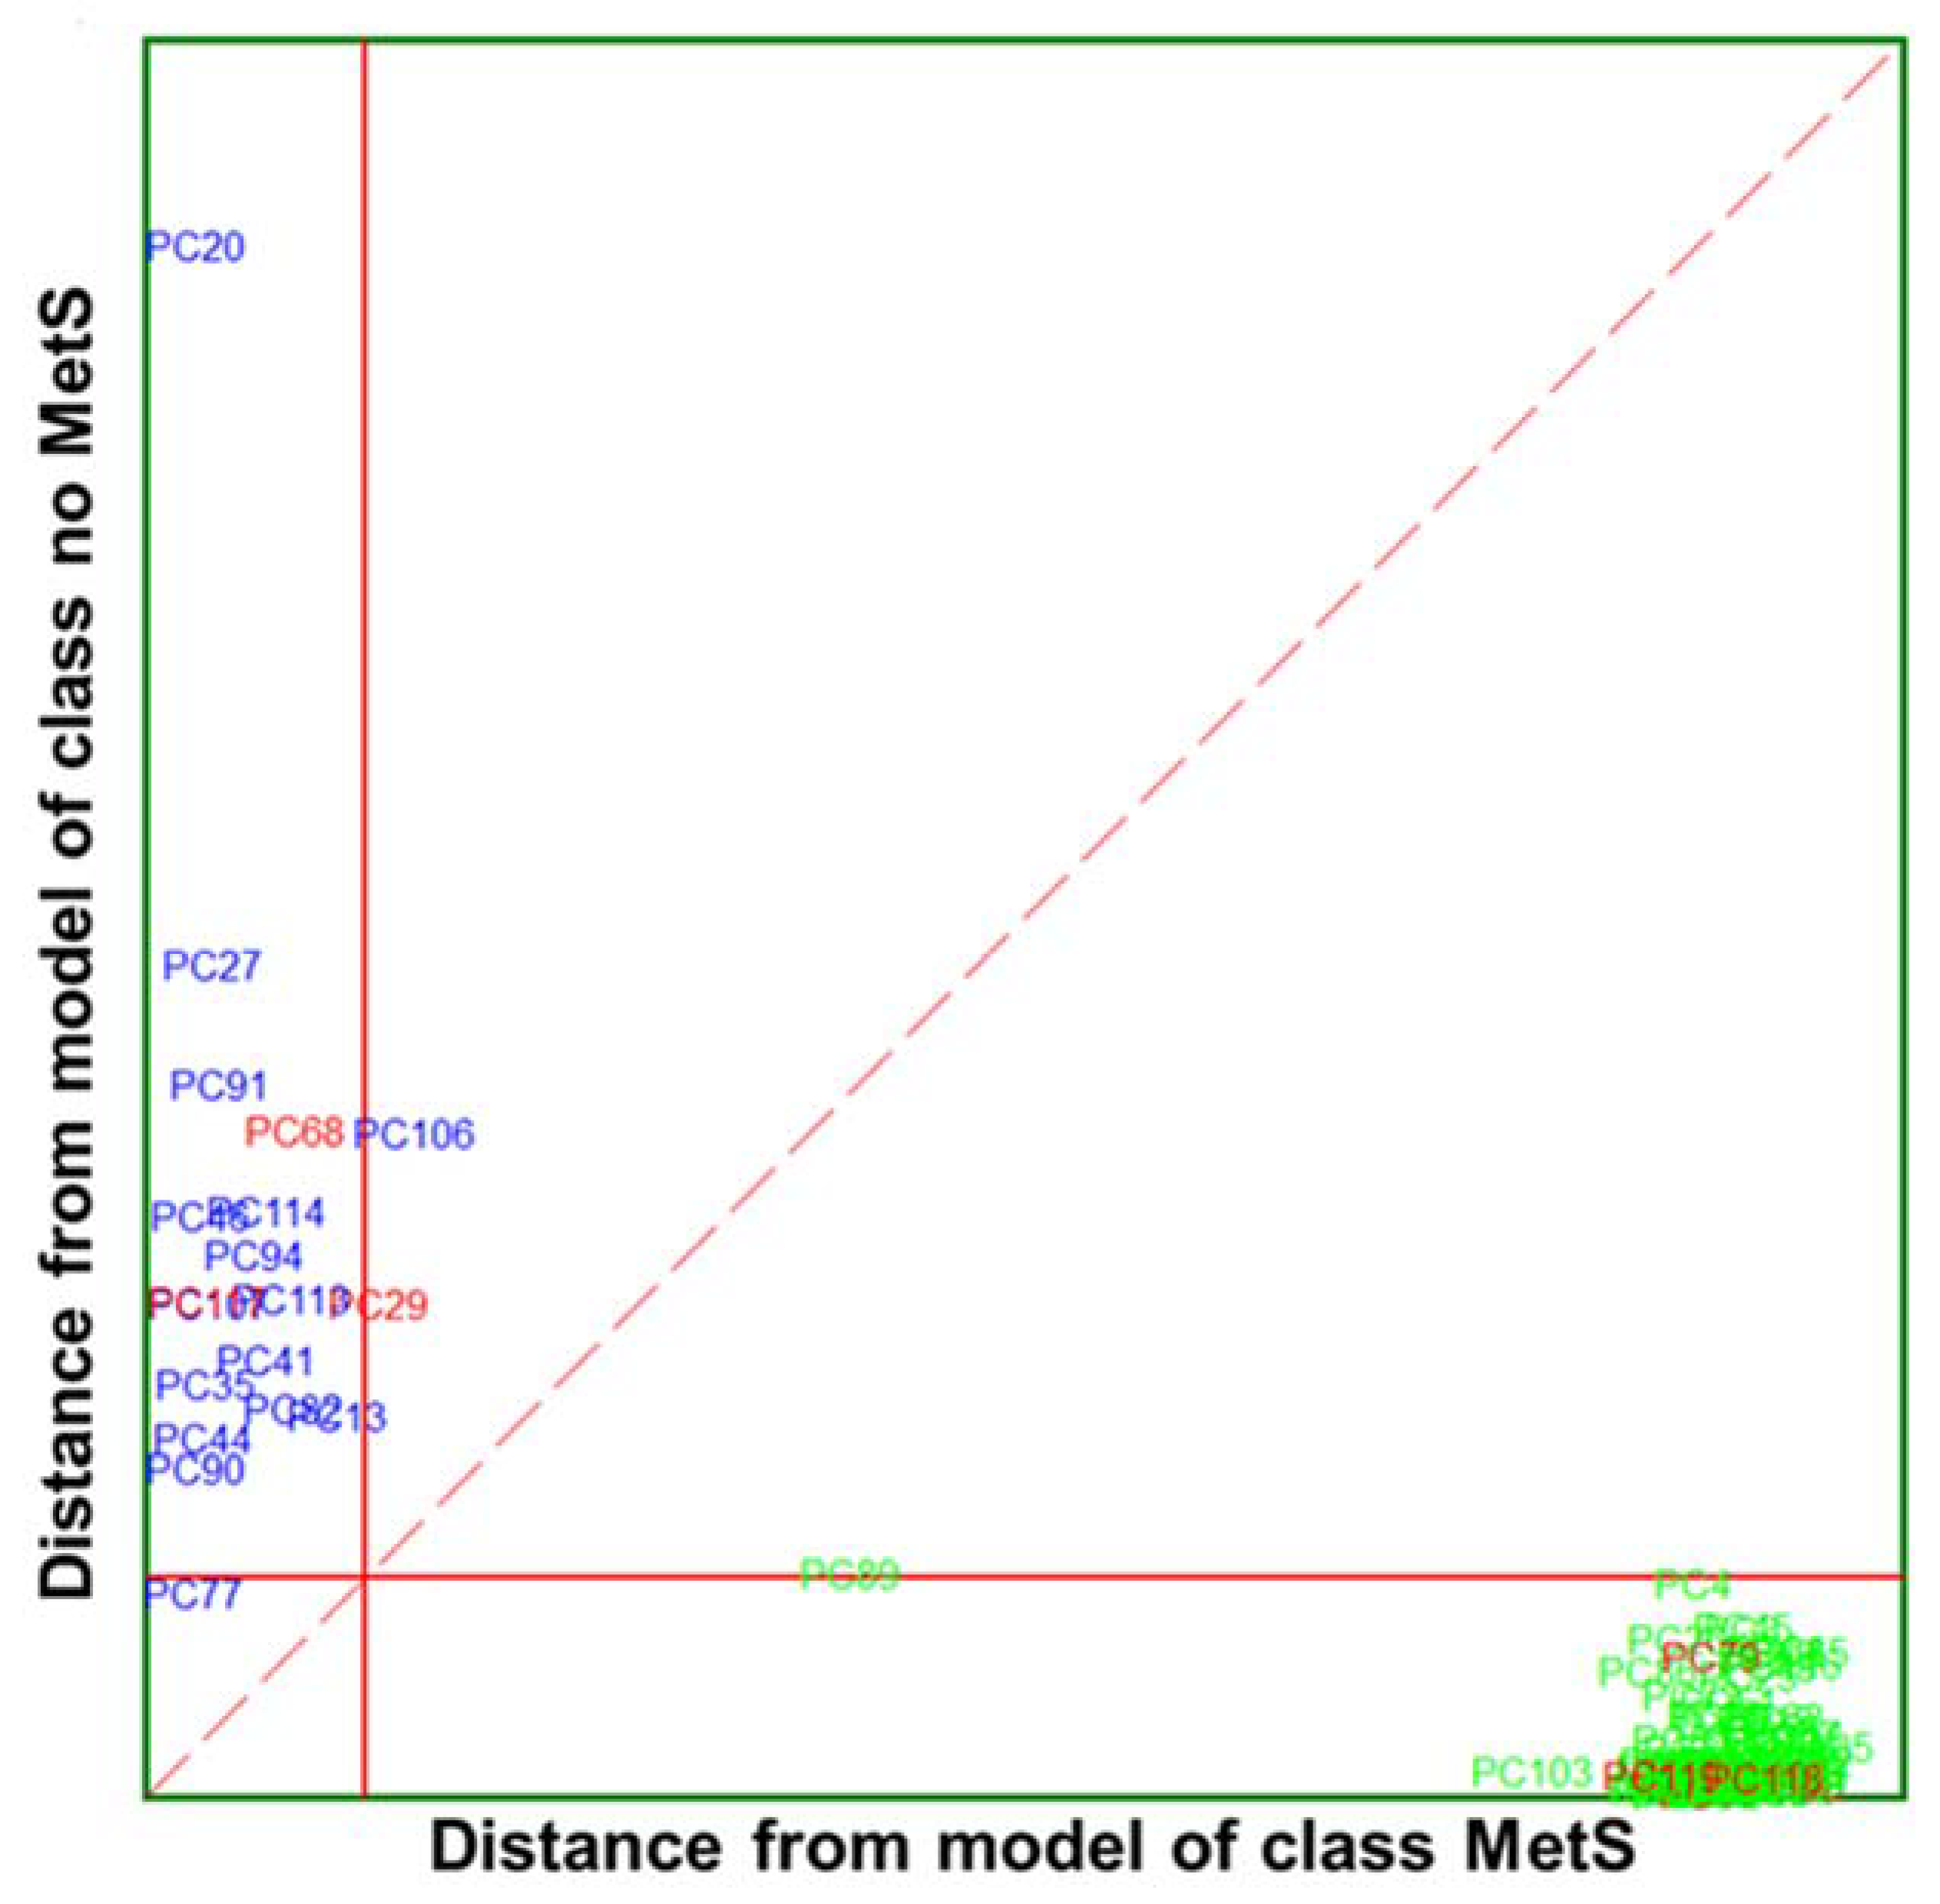
 ) and no MetS (
 ) patients within included (
 ) test set. The red solid line indicates a confidence level for class space at 95%. The red dashed line indicates equal class distance.
 ) and no MetS (
 ) patients within included (
 ) test set. The red solid line indicates a confidence level for class space at 95%. The red dashed line indicates equal class distance.
| Category | MetS | No MetS | ||||
|---|---|---|---|---|---|---|
| Clinical Parameters | Max | Min | Mean | Max | Min | Mean |
| Systolic blood pressure | 174 | 120 | 136 | 178 | 94 | 126 |
| Diastolic blood pressure | 109 | 75 | 87 | 115 | 61 | 79 |
| Triglycerides | 338 | 88 | 242 | 215 | 33 | 109 |
| HDL | 58 | 25 | 37 | 95 | 29 | 55 |
| Glucose | 164 | 82 | 114 | 123 | 63 | 91 |
| Clinical Parameters | Classification (%) | External Prediction (%) | Total Rate (%) |
|---|---|---|---|
| MetS | 100 | 100 | 100 |
| No MetS | 100 | 98.73 (1)1 | 99.36 |
| Total rate | 100 | 98.94 | 99.47 |
| Clinical Parameters | Classification (%) | External Prediction (%) | Total Rate (%) |
|---|---|---|---|
| MetS | 100 | 100 | 100 |
| No MetS | 100 | 100 | 100 |
| Total rate | 100 | 100 | 100 |
| Clinical Parameters | Discriminant Power | Modelling Power | |
|---|---|---|---|
| Category MetS | Category No MetS | ||
| Systolic blood pressure | 1.99 | 0.70 | 0.73 |
| Diastolic blood pressure | 2.01 | 0.70 | 0.73 |
| Triglycerides | 2.18 | 0.94 | 0.96 |
| HDL | 2.34 | 0.79 | 0.94 |
| Glucose | 2.36 | 0.84 | 0.97 |
| Variables | Classification (%) | LOO (%) | CV Efficiency (%) | Efficiency Forced Model (%) | Total Rate (%) |
|---|---|---|---|---|---|
| 5 clinical measurements | 98.59 | 97.18 | 87.05 | 95.68 | 100 |
| 10 IR selected wavenumbers | 97.18 | 94.37 | 87.92 | 97.86 | 100 |
| Wavenumber (cm−1) | Discriminant Power | Modelling Power | |
|---|---|---|---|
| Category MetS | Category No MetS | ||
| 2860.22 | 3.77 | 1.00 | 1.00 |
| 1423.36 | 4.23 | ||
| 1562.22 | 3.66 | ||
| 1578.61 | 3.75 | ||
| 1108.98 | 3.70 | ||
| 1316.32 | 3.64 | ||
| 2948.94 | 4.29 | ||
| 1557.40 | 4.31 | ||
| 1133.09 | 5.86 | ||
| 1247.85 | 3.58 | ||
Disclaimer/Publisher’s Note: The statements, opinions and data contained in all publications are solely those of the individual author(s) and contributor(s) and not of MDPI and/or the editor(s). MDPI and/or the editor(s) disclaim responsibility for any injury to people or property resulting from any ideas, methods, instructions or products referred to in the content. |
© 2022 by the authors. Licensee MDPI, Basel, Switzerland. This article is an open access article distributed under the terms and conditions of the Creative Commons Attribution (CC BY) license (https://creativecommons.org/licenses/by/4.0/).
Share and Cite
Tkachenko, K.; Esteban-Díez, I.; González-Sáiz, J.M.; Pérez-Matute, P.; Pizarro, C. Dual Classification Approach for the Rapid Discrimination of Metabolic Syndrome by FTIR. Biosensors 2023, 13, 15. https://doi.org/10.3390/bios13010015
Tkachenko K, Esteban-Díez I, González-Sáiz JM, Pérez-Matute P, Pizarro C. Dual Classification Approach for the Rapid Discrimination of Metabolic Syndrome by FTIR. Biosensors. 2023; 13(1):15. https://doi.org/10.3390/bios13010015
Chicago/Turabian StyleTkachenko, Kateryna, Isabel Esteban-Díez, José M. González-Sáiz, Patricia Pérez-Matute, and Consuelo Pizarro. 2023. "Dual Classification Approach for the Rapid Discrimination of Metabolic Syndrome by FTIR" Biosensors 13, no. 1: 15. https://doi.org/10.3390/bios13010015
APA StyleTkachenko, K., Esteban-Díez, I., González-Sáiz, J. M., Pérez-Matute, P., & Pizarro, C. (2023). Dual Classification Approach for the Rapid Discrimination of Metabolic Syndrome by FTIR. Biosensors, 13(1), 15. https://doi.org/10.3390/bios13010015


