Article

Simultaneous Determination of Uric Acid and Caffeine by Flow Injection Using Multiple-Pulse Amperometry

by
Ademar Wong
1,2,
Anderson M. Santos
3,
Maria H. A. Feitosa
3,
Orlando Fatibello-Filho
3,
Fernando C. Moraes
3,* and
Maria D. P. T. Sotomayor
1,2
1
Institute of Chemistry, São Paulo State University (UNESP), Araraquara 14801-970, SP, Brazil
2
National Institute for Alternative Technologies of Detection, Toxicological Evaluation and Removal of Micropollutants and Radioactives (INCT-DATREM), Araraquara 14801-970, SP, Brazil
3
Department of Chemistry, Federal University of São Carlos (UFSCar), São Carlos 13560-970, SP, Brazil
*
Author to whom correspondence should be addressed.
Biosensors 2023, 13(7), 690; https://doi.org/10.3390/bios13070690
Submission received: 6 June 2023 / Revised: 25 June 2023 / Accepted: 27 June 2023 / Published: 29 June 2023
(This article belongs to the Special Issue Biochips and Biosensors for Health-Care and Diagnostics)

Abstract

:
The present study reports the development and application of a flow injection analysis (FIA) system for the simultaneous determination of uric acid (UA) and caffeine (CAF) using cathodically pretreated boron-doped diamond electrode (CPT-BDD) and multiple-pulse amperometry (MPA). The electrochemical profiles of UA and CAF were analyzed via cyclic voltammetry in the potential range of 0.20–1.7 V using 0.10 mol L−1 H2SO4 solution as supporting electrolyte. Under optimized conditions, two oxidation peaks at potentials of 0.80 V (UA) and 1.4 V (CAF) were observed; the application of these potentials using multiple-pulse amperometry yielded concentration linear ranges of 5.0 × 10⁻⁸–2.2 × 10⁻⁵ mol L−1 (UA) and 5.0 × 10⁻⁸–1.9 × 10⁻⁵ mol L−1 (CAF) and limits of detection of 1.1 × 10⁻⁸ and 1.3 × 10⁻⁸ mol L−1 for UA and CAF, respectively. The proposed method exhibited good repeatability and stability, and no interference was detected in the electrochemical signals of UA and CAF in the presence of glucose, NaCl, KH2PO4, CaCl2, urea, Pb, Ni, and Cd. The application of the FIA-MPA method for the analysis of environmental samples resulted in recovery rates ranging between 98 and 104%. The results obtained showed that the BDD sensor exhibited a good analytical performance when applied for CAF and UA determination, especially when compared to other sensors reported in the literature.

1. Introduction

Uric acid (UA) is the final decomposition product generated from the metabolism of purine (constituent of nucleic acids). It is present in the blood and can be detected in urine. The monitoring of UA in human serum is found to be essentially important, as the amount of UA present therein can be used as a relevant parameter for the diagnosis of many diseases including heart disease, Lesch–Nyhan syndrome, gout, diabetes, arthritis, rheumatic pain, and hyperuricemia [1]. The normal level of uric acid in urine is 2.0 mmol L−1 and may range between 0.12 and 0.45 mmol L−1 in the blood. To maintain a healthy level of uric acid, it is highly recommended that one avoids the excess consumption of purine-based foods (meat and seafood, sugar-sweetened beverages, and alcohol) [2,3].
Caffeine (CAF) is a xanthine alkaloid compound (1,3,7-trimethylxanthine), which is a naturally occurring substance found in the leaves, seeds, and fruits of various plant species; this compound is widely applied in pharmacological formulations, including analgesics and flu medication, and acts as stimulant in the central nervous system, where it increases alertness in addition to reducing sleepiness and improving short-term memory [4,5]. CAF can be found in chocolate, coffee, tea, cocoa, and in energy drinks. Excessive consumption of caffeine can provoke health disorders, such as irregular heartbeat, upset stomach, trembling hands, restlessness, diminished memory, asthma, and sleeping difficulty [6]. According to the FDA (Food Drug Administration), for health safety purposes, the amount of caffeine intake per day must not exceed 400 mg [7].
UA and CAF can be detected simultaneously in the human body, and the presence of these analytes above the recommended threshold or in excess can cause, as mentioned above, different health problems. These analytes can be found in biological matrices through food consumption and production in our body and in environmental matrices when disposed in the domestic sewage. Several studies reported in the literature have employed a wide range of methods for the determination of uric acid and caffeine; some of the methods applied have included the following: fluorescence [8], colorimetry [9], high-performance liquid chromatography (HPLC) [10], spectrophotometry [11,12], and electrochemical techniques [13,14]. In this context, Tasic et al. [15] published a review about recent advances in electrochemical sensors for caffeine determination. Likewise, Aafria et al. [16] and Lakshmi et al. [17] reported the use of electrochemical sensors and biosensors for the detection of uric acid in different media. Electrochemical techniques have the advantages of being simpler, cheaper, and more sensitive in addition to involving shorter analysis time compared to other traditional methods [18]. Thus, the application of an electrochemical technique in combination with flow injection analysis (FIA) provides us with relatively shorter time of analysis, greater sensitivity and selectivity, and operational simplicity in addition to low cost of analysis. The FIA technique has been applied for the determination of a wide range of compounds due to its high detection sensitivity, fast response, low reagent consumption, real-time monitoring capability, and operational simplicity. Compared to the voltammetric method, some of the main advantages of the amperometric method include real-time monitoring and the ability to analyze many samples at the same time. In addition, under the amperometric method, the contact time between the sample and the electrode surface is significantly reduced, and this helps minimize the adsorption effect [19,20].
The FIA system has been employed in combination with multiple pulse amperometry (FIA-MPA) for the simultaneous detection of analytes with different redox potentials. These analyses were primarily conducted using the activation potential, cleaning potential and redox potential of the analytes. Usually, under this type of analysis, boron-doped diamond (BDD) electrodes are often employed; these electrodes offer numerous analytical advantages, which include the following: better repeatability; ability to conduct analysis with negligible capacitive current; ease of operation/operational simplicity; low adsorption; and wide potential window [19,20]. In addition, BDD materials are found to possess sp3 hybridization, and this is one of the reasons for their high chemical and physical stability [20]. A number of studies published in the literature have reported the use of BDD electrodes for the determination of different analytes at micro and nanomolar levels [21,22].
In this work, we propose the use of a simple, highly sensitive and low-cost method for the simultaneous determination of uric acid (UA) and caffeine (CAF) in river water samples using a FIA-MPA system based on a cathodically pretreated BDD electrode. UA and CAF were chosen as matrices for the conduct of this study because these substances are commonly detected in the human body and are disposed of indiscriminately in the environment through domestic sewage.

2. Materials and Methods

2.1. Chemical

Uric acid (UA) and caffeine (CAF) were purchased from Sigma Aldrich (Brazil). Potassium phosphate monobasic (KH2PO4), potassium phosphate dibasic (K2HPO4), sodium hydroxide (NaOH), and potassium chloride (KCl) were acquired from Synth (Brazil). UA and CAF solutions were prepared in basic and acid media, respectively, using ultrapure water. A 0.10 mol L−1 concentration sulfuric acid solution was prepared from stock solution, and a 0.10 mol L−1 phosphate buffer solution was prepared using a mixture of KH2PO4 and K2HPO4. Aqueous solutions were prepared using deionized water from the Milli Q system (resistivity > 18.2 MΩ cm).

2.2. Apparatus

The working electrode was a boron-doped diamond (BDD) film (8000 ppm) on a silicon wafer obtained from the Center Suisse de Electronique et de Microtechnique SA (CSEM), Neuchatêl, Switzerland. Voltammetric and amperometric experiments were performed using potentiostat/galvanostat (model PGSTAT-30, Autolab, Utrecht, The Netherlands) controlled by the GPES 4.9 software (Eco Chemie).
HPLC-UV analysis was performed using Shimadzu® Model 20A liquid chromatograph coupled with a UV/Vis detector and C18 column (250 × 4.6 mm, Shim–Pack CLC–ODS). The analysis was conducted under the following conditions: mobile phase: 40% methanol and 60% water (v/v); total running time for each analyte: 6 min; and detection wavelength: 275 nm [23,24].

2.3. Preparation of the BDD Electrode

Initially, the BDD electrode was subjected to pretreatment using a glass cell with three electrodes: Ag/AgCl/KCl (3.0 mol L−1) for the reference electrode, platinum wire auxiliary electrode, and BDD working electrode (with exposed area of 0.66 cm2), respectively. To render the electrode surface clean without impurities, the BDD electrode was washed with ultrapure water and ethanol mixture in an ultrasonic bath for 3 min. The anodic pretreatment (APT) and cathodic pretreatment (CPT) were performed using 0.50 mol L−1 H2SO4 solution and applied potentials of 0.04 A cm−2 and −0.04 A cm−2 consecutively for 30 s and 180 s, respectively. Subsequently, the BDD electrode was applied in the electrochemical cell for the amperometric and voltammetric analyses.

2.4. Preparation of Urine and River Water Samples

River water samples were collected from a river located in São Carlos, SP, Brazil (21°59′11.0′′ S 47°52′52.1′′ W) and stocked in amber flasks in a refrigerator at 0 °C. The samples were filtered, and 10 mL of the samples was enriched using two concentration levels of uric acid and caffeine. Synthetic urine samples were prepared using 0.040 mmol L−1 KCl, 0.040 mmol L−1 NH4Cl, 20 µmol L−1 CaCl2, 30 µmol L−1 KH2PO4, 30 µmol L−1 NaCl, and 0.040 mol L−1 urea in a 5.0 mL amber flask. To determine the concentration of these analytes, the samples prepared were injected into a FIA-MPA system using 0.10 mol L−1 sulfuric acid as electrolyte and the carrier solution. The results obtained from the application of the electrochemical and chromatographic methods were then compared.

2.5. Analytical Procedure

The BDD electrode was pre-treated anodically (APT–BDD) or cathodically (CPT–BDD) in 0.5 mol L−1 H2SO4 by applying 0.04 A cm−2 or −0.04 A cm−2 for 60 s or 180 s, respectively. The analytical response (electric current) of uric acid and caffeine was evaluated separately for the anodic and cathodic processes, as these analyzes were performed after optimizing the electrolyte solution, such as electrolyte and pH. On the other hand, the applied potentials for the oxidation of the analytes using the MPA were chosen through hydrodynamic voltammograms constructed from the threshold current data recorded at each applied potential pulse. Other variables involved in this method were systematically analyzed, such as flow rate, sample injection volume and pulsation time. In this sense, the calibration curves were obtained simultaneously from continuous injections of the support electrolyte containing the target analytes in the FIA-MPA system. The limit of detection (LOD) was obtained by processing experimental data of the signal-to-noise ratio in a 3-to-1 ratio. The accuracy of the analysis method proposed here was verified from several analysis repetitions (n = 15) for UA and CAF with two different concentrations. In addition, tests of the analytes in different matrices were performed to verify the efficiency of the detection method in real systems of environmental and biological complexity, such as river water and urine samples, in which such samples were enriched with several chemical compounds that are possible interferents in samples of this magnitude. Finally, river water and urine samples were added with known concentrations of UA and CAF and analyzed (n = 3) in terms of percentage recovery of the added concentration using the analytical curves constructed under optimized conditions.

3. Results and Discussion

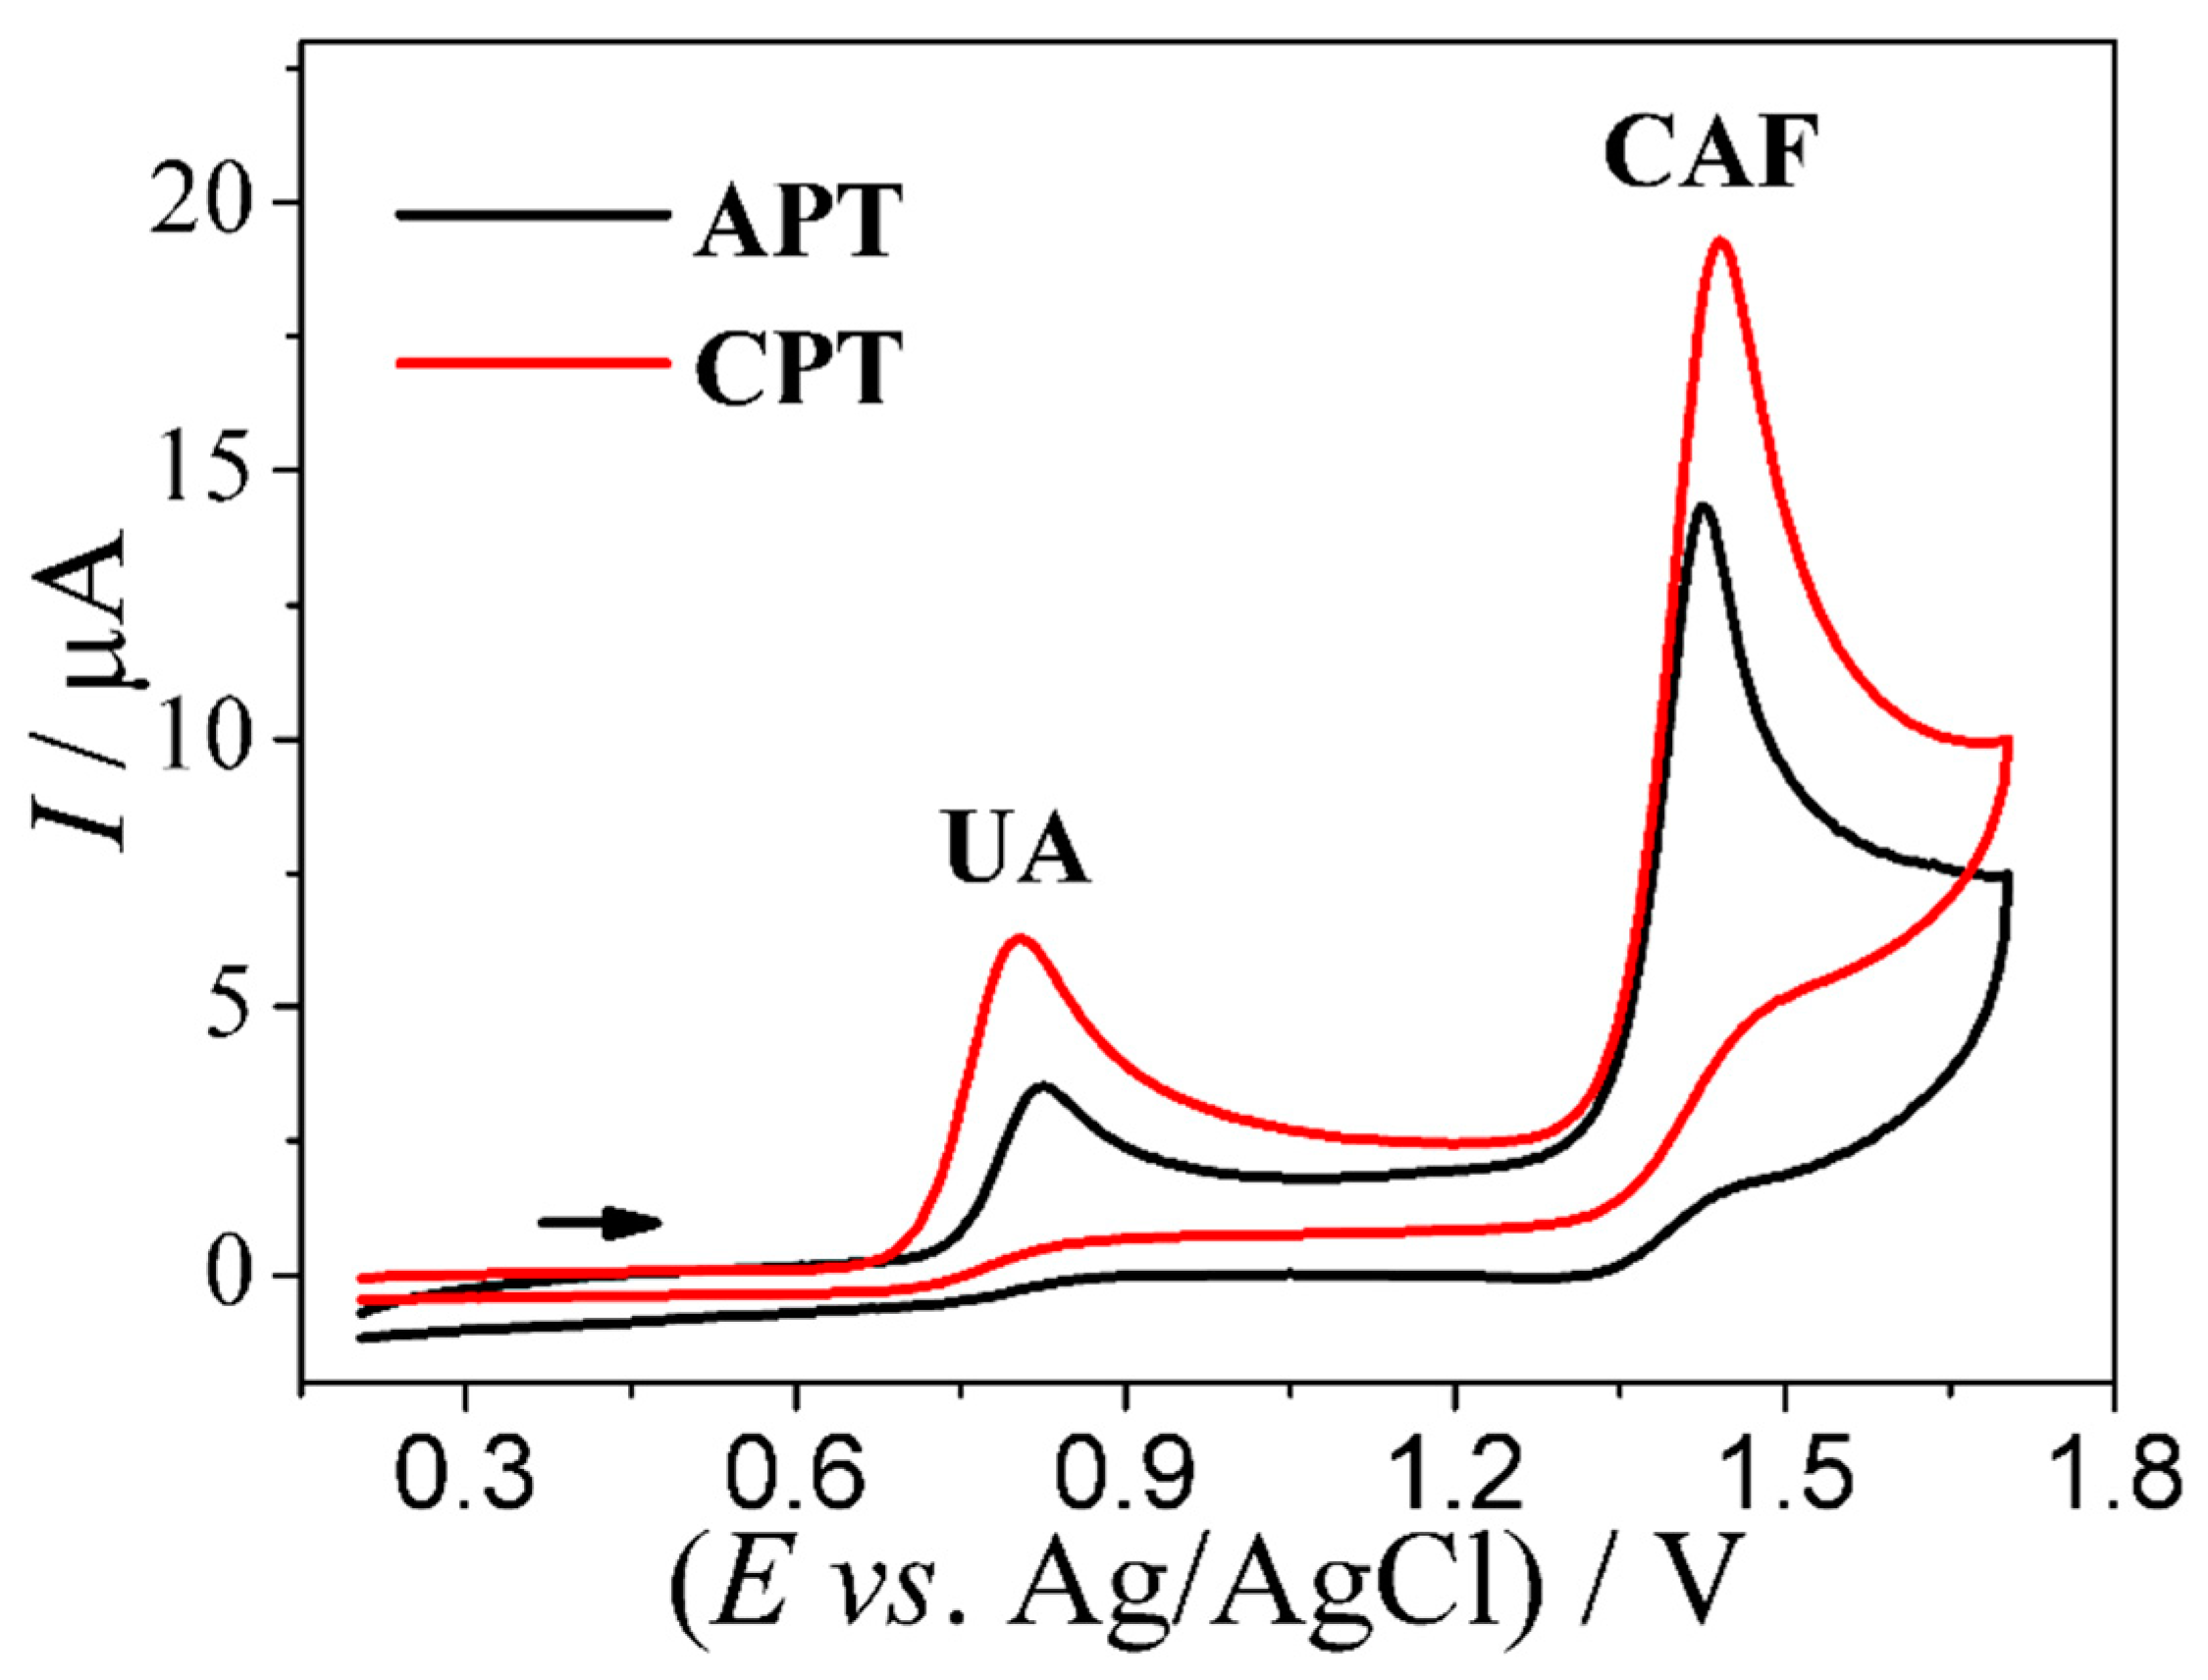
3.1. Voltammetric Profile of UA and CAF

The analysis of the electrochemical profiles of UA and CAF was performed using an anodically pretreated BDD electrode (0.04 A cm−2 for 60 s) and a cathodically pretreated BDD electrode (−0.04 A cm−2 for 180 s); this was done in order to improve the performance of the BDD electrode in the redox reaction. The cathodic pretreatment (CPT) of the BDDE presents a predominantly hydrogen-terminated surface, while the anodic pretreatment (APT) of the BDDE presents a predominantly oxygen-terminated surface. Therefore, the detection can be strongly influenced by the pretreatment on the BDDE surface [25,26].
Figure 1 shows the cyclic voltammograms obtained from the application of 5.0 × 10⁻⁵ mol L−1 UA and 5.0 × 10⁻⁵ mol L−1 CAF solutions using the anodically (APT) and cathodically (CPT) pretreated BDD electrodes. Looking at Figure 1, one can clearly observe the low background current and oxidation peaks of the analytes with good peak separation at potentials of 0.80 V and 1.4 V for UA and CAF, respectively; apart from that, no reduction peaks are observed in the potential range of 0.20 V–1.7 V (v = 50 mV s−1 and step potential = 4 mV), which is typically characteristic of irreversible processes. The anodic peak current values obtained from the application of the APT-BDD and CPT-BDD electrodes for UA and CAF were 2.8 (UA) and 10.1 µA (CAF) for APT-BDD and 6.2 (UA) and 14.5 µA (CAF) for CPT-BDD. As can be seen, the CPT of the BDD electrode surface provided a significant increase in the magnitude of the oxidation peak current for both analytes, thus indicating that a predominantly hydrogen-terminated surface significantly improves the electrochemical activity of the BDD electrode for the processes of UA and CAF oxidation. In addition, the application of the BDD electrode modified with carbon materials (nanotubes and graphene) and metallic nanoparticles yielded no significant changes in the current signal. By virtue of that, the cathodically pretreated BDD electrode was selected and used for the conduct of further experiments.

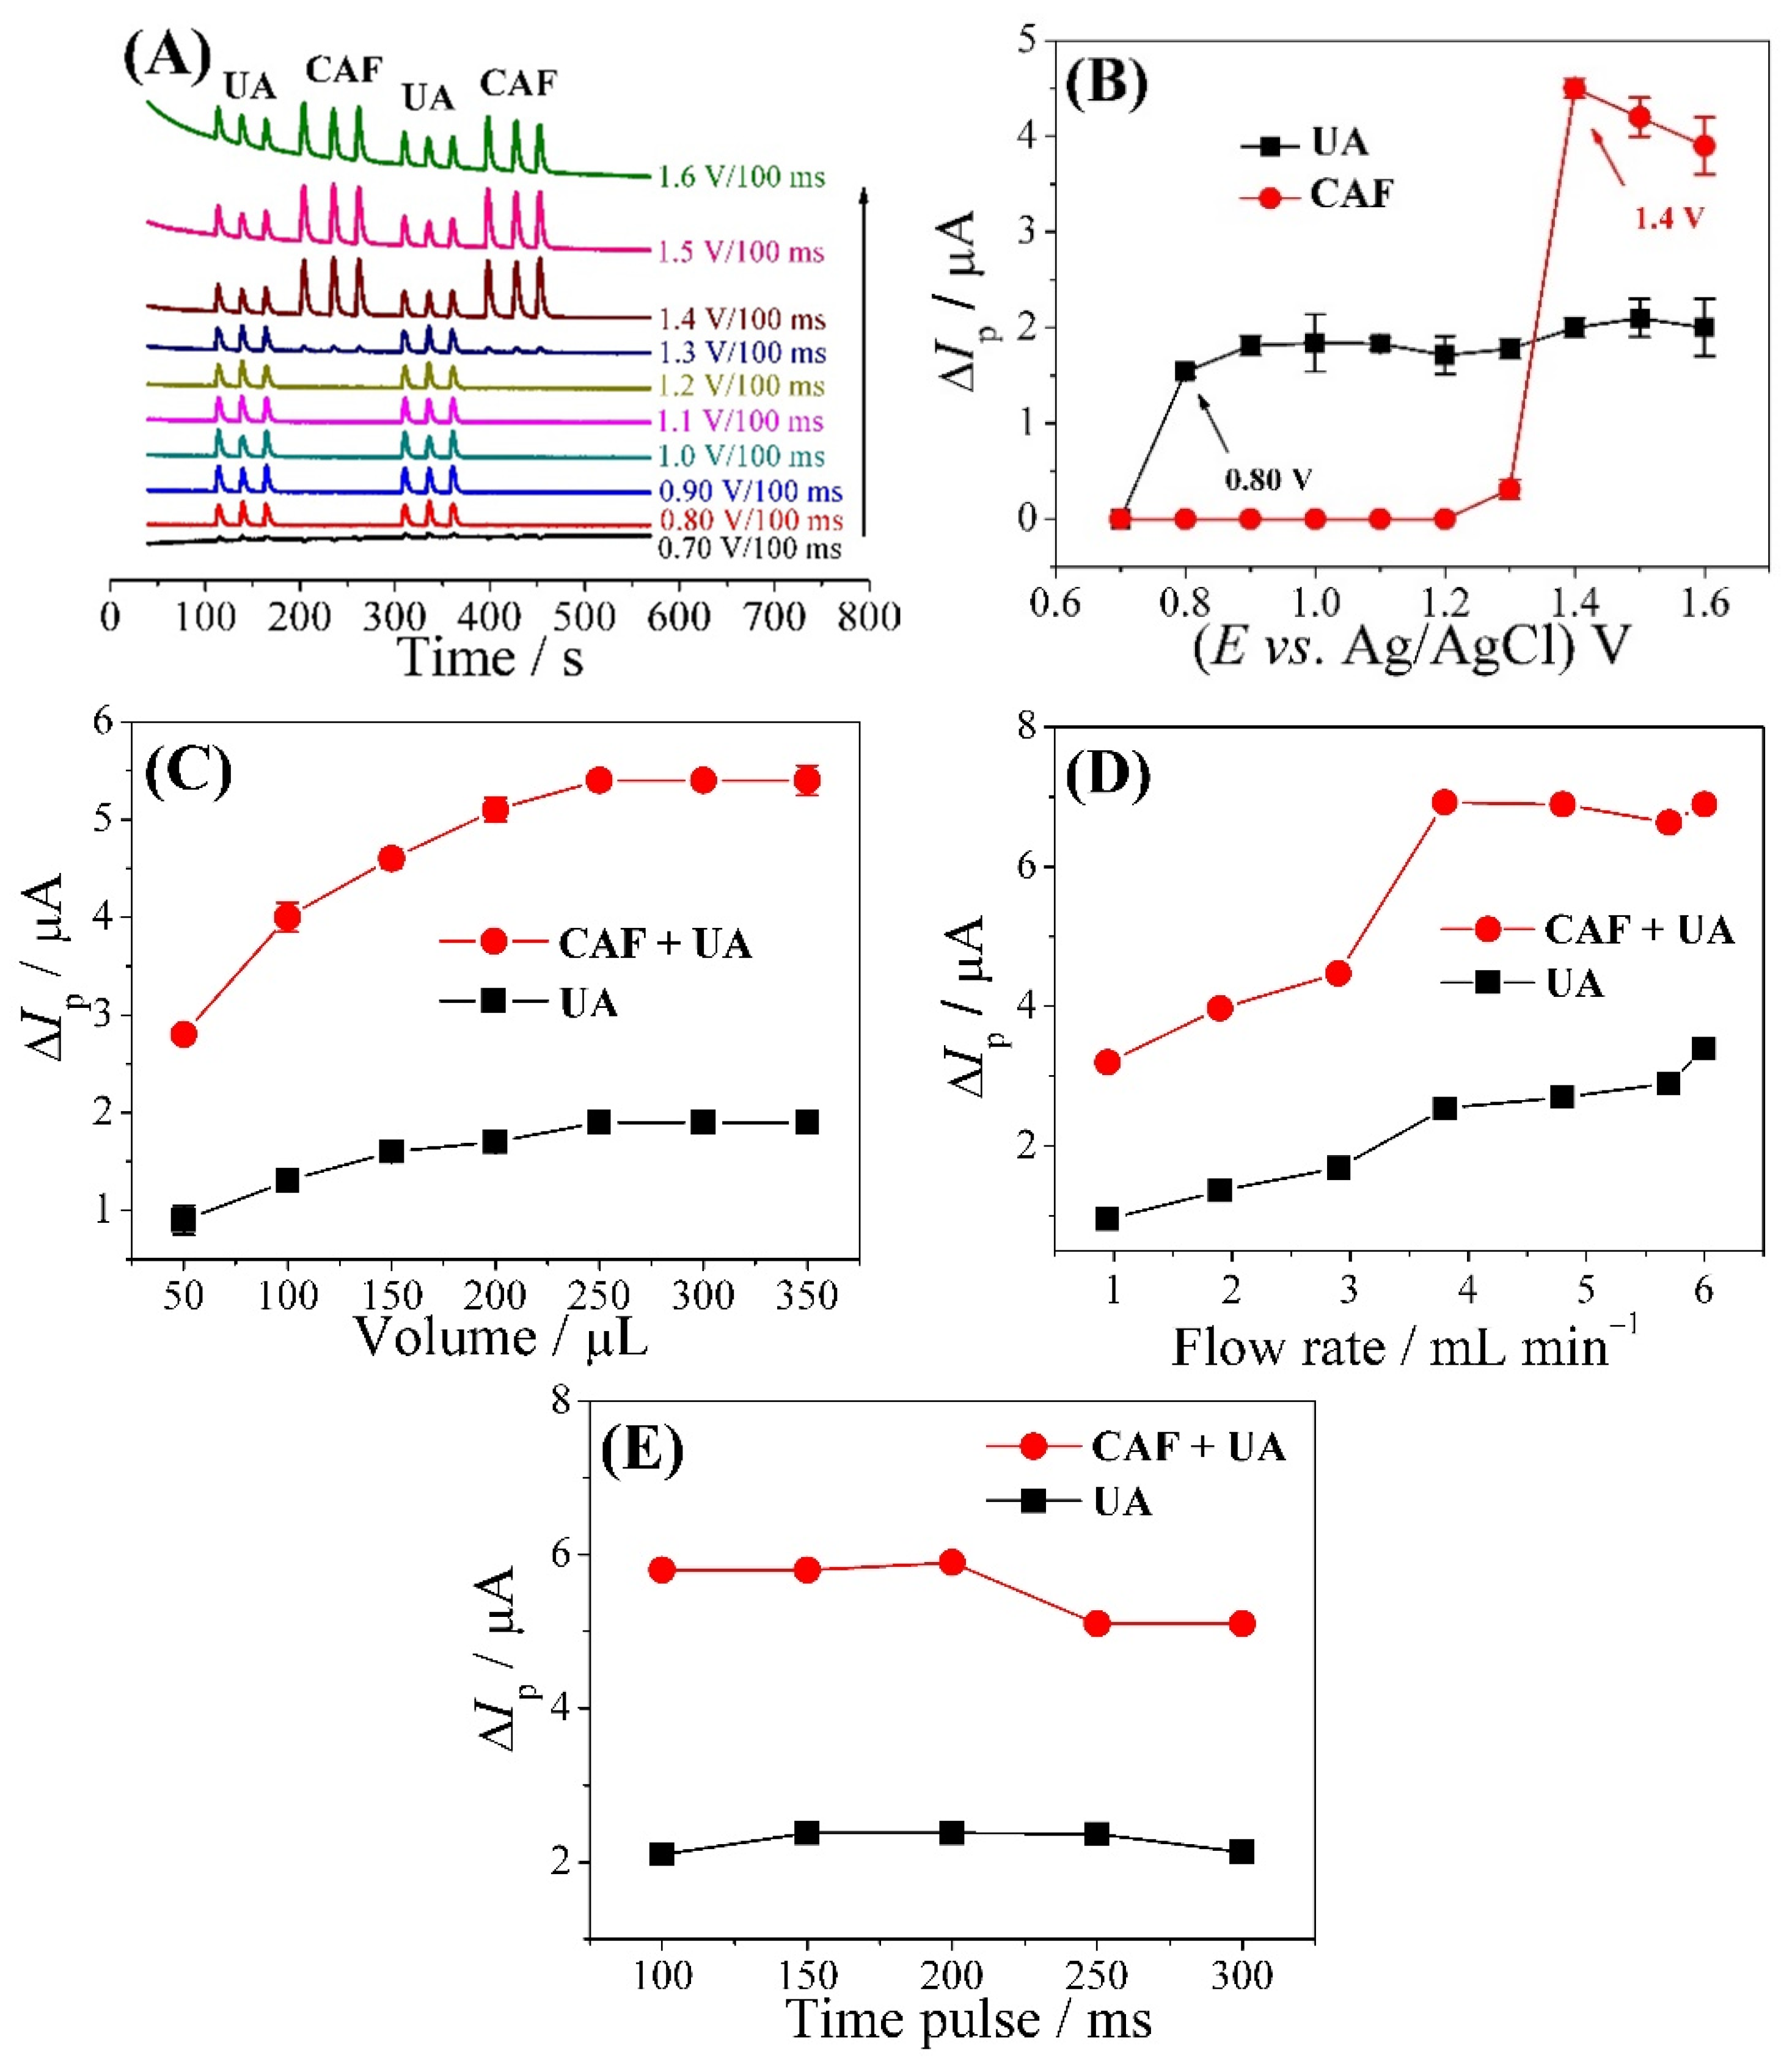
3.2. Optimization of the FIA-MPA System

First, the cyclic voltammetry technique was used to evaluate the type of electrolyte and concentration that can be used for the conduct of electrochemical measurements. The electrolytes tested were as follows: phosphate buffer solution and sulfuric acid (H2SO4) solution. The results obtained from this analysis showed that the sulfuric acid solution exhibited better electrochemical response. Figures S1 and S2 in the Supplementary Material show the electrochemical responses of these electrolytes in the presence of UA and CAF and the concentration of the H2SO4 solution evaluated. Based on the results obtained from the analysis, the 0.10 mol L−1 H2SO4 solution was chosen for further experiments.
The optimization of the FIA-MPA system was performed on the CPT-BDD electrode using 0.10 mol L−1 H2SO4 as the electrolyte solution. Figure 2A shows the amperograms based on the application of 10 sequential potential pulses (0.70 to 1.6 V), for which the best potential conditions were chosen from among the ten amperograms obtained. The magnitude of peak current for each potential pulse applied was measured and used to construct the hydrodynamic voltammogram for UA and CAF. As can be seen in the Figure 2B, UA starts to oxidize at low potentials (c.a. 0.70 V) and shows a current increase at 0.80 V. For CAF, the oxidation process starts c.a. 1.3 V and has a current increase of 1.4 V. Thus, potential pulses of 0.80 V and 1.4 V were selected, the first being for the oxidation of UA without interference from CAF and the second for when both compounds (UA and CAF) were oxidized and there is an oxidation stable for CAF.
After choosing the two best redox potentials, the injected sample volume (50 to 350 µL) (Figure 2C), flow rate (0.95 to 6.0 mL min−1) (Figure 2D), and pulse time (100 to 300 ms) (Figure 2E) were optimized in the FIA-MPA system experiments using a fixed concentration of UA and CAF of 1.5 × 10⁻⁵ mol L−1. The optimal values obtained were as follows: injection sample volume: 250 µL, flow rate: 3.8 mL min−1, and pulse time: 150 ms.
Figure 3 shows the amperograms obtained with the application of two potential pulses (0.80 V (150 ms) and 1.4 V (150 ms)) for triplicate injections of 1.5 × 10⁻⁵ mol L−1 of UA, 1.5 × 10⁻⁵ mol L−1 of CAF, or a mixture of 1.5 × 10⁻⁵ mol L−1 of UA and CAF. The analysis of the amperograms at the potentials of 0.80 V and 1.4 V showed that only UA was oxidized at 0.80 V (in the presence or absence of CAF), while both analytes (UA and CAF) were oxidized at the potential of 1.4 V, that is, there was a sum of the magnitude of the signal of the oxidation process of UA and CAF. However, based on the results obtained, the UA oxidation current intensities do not equally apply the two potential pulses (0.80 V and 1.4 V), therefore, in view of the simultaneous determination of UA (0.80 V) and CAF (1.4 V), the use of a correction factor (CF) to obtain the exact value of the AU current at potential 1.4 V is necessary. The correction factor (CF) was calculated by dividing the magnitude of the current obtained at 1.4 V by the magnitude of the current obtained at 0.8 V (Equation (1)). Thus, the CF value (of 1.2 ± 0.1) obtained was useful for calculating the oxidation current of UA (1.4 V).
To obtain the actual concentration of CAF (1.4 V) in the simultaneous determination, we subtract the value of the oxidation current UA(0.80 V) × CF from the total oxidation current at the potential of 1.4 V (UA + CAF), thus obtaining the value of the oxidation current only for CAF (Equation (2)). In this way, it is possible to quantify the two analytes simultaneously without interference.
C F = I U A   1.4   V I U A   0.80   V
I C A F = I t o t a l   1.4   V C F × I U A   0.80   V  

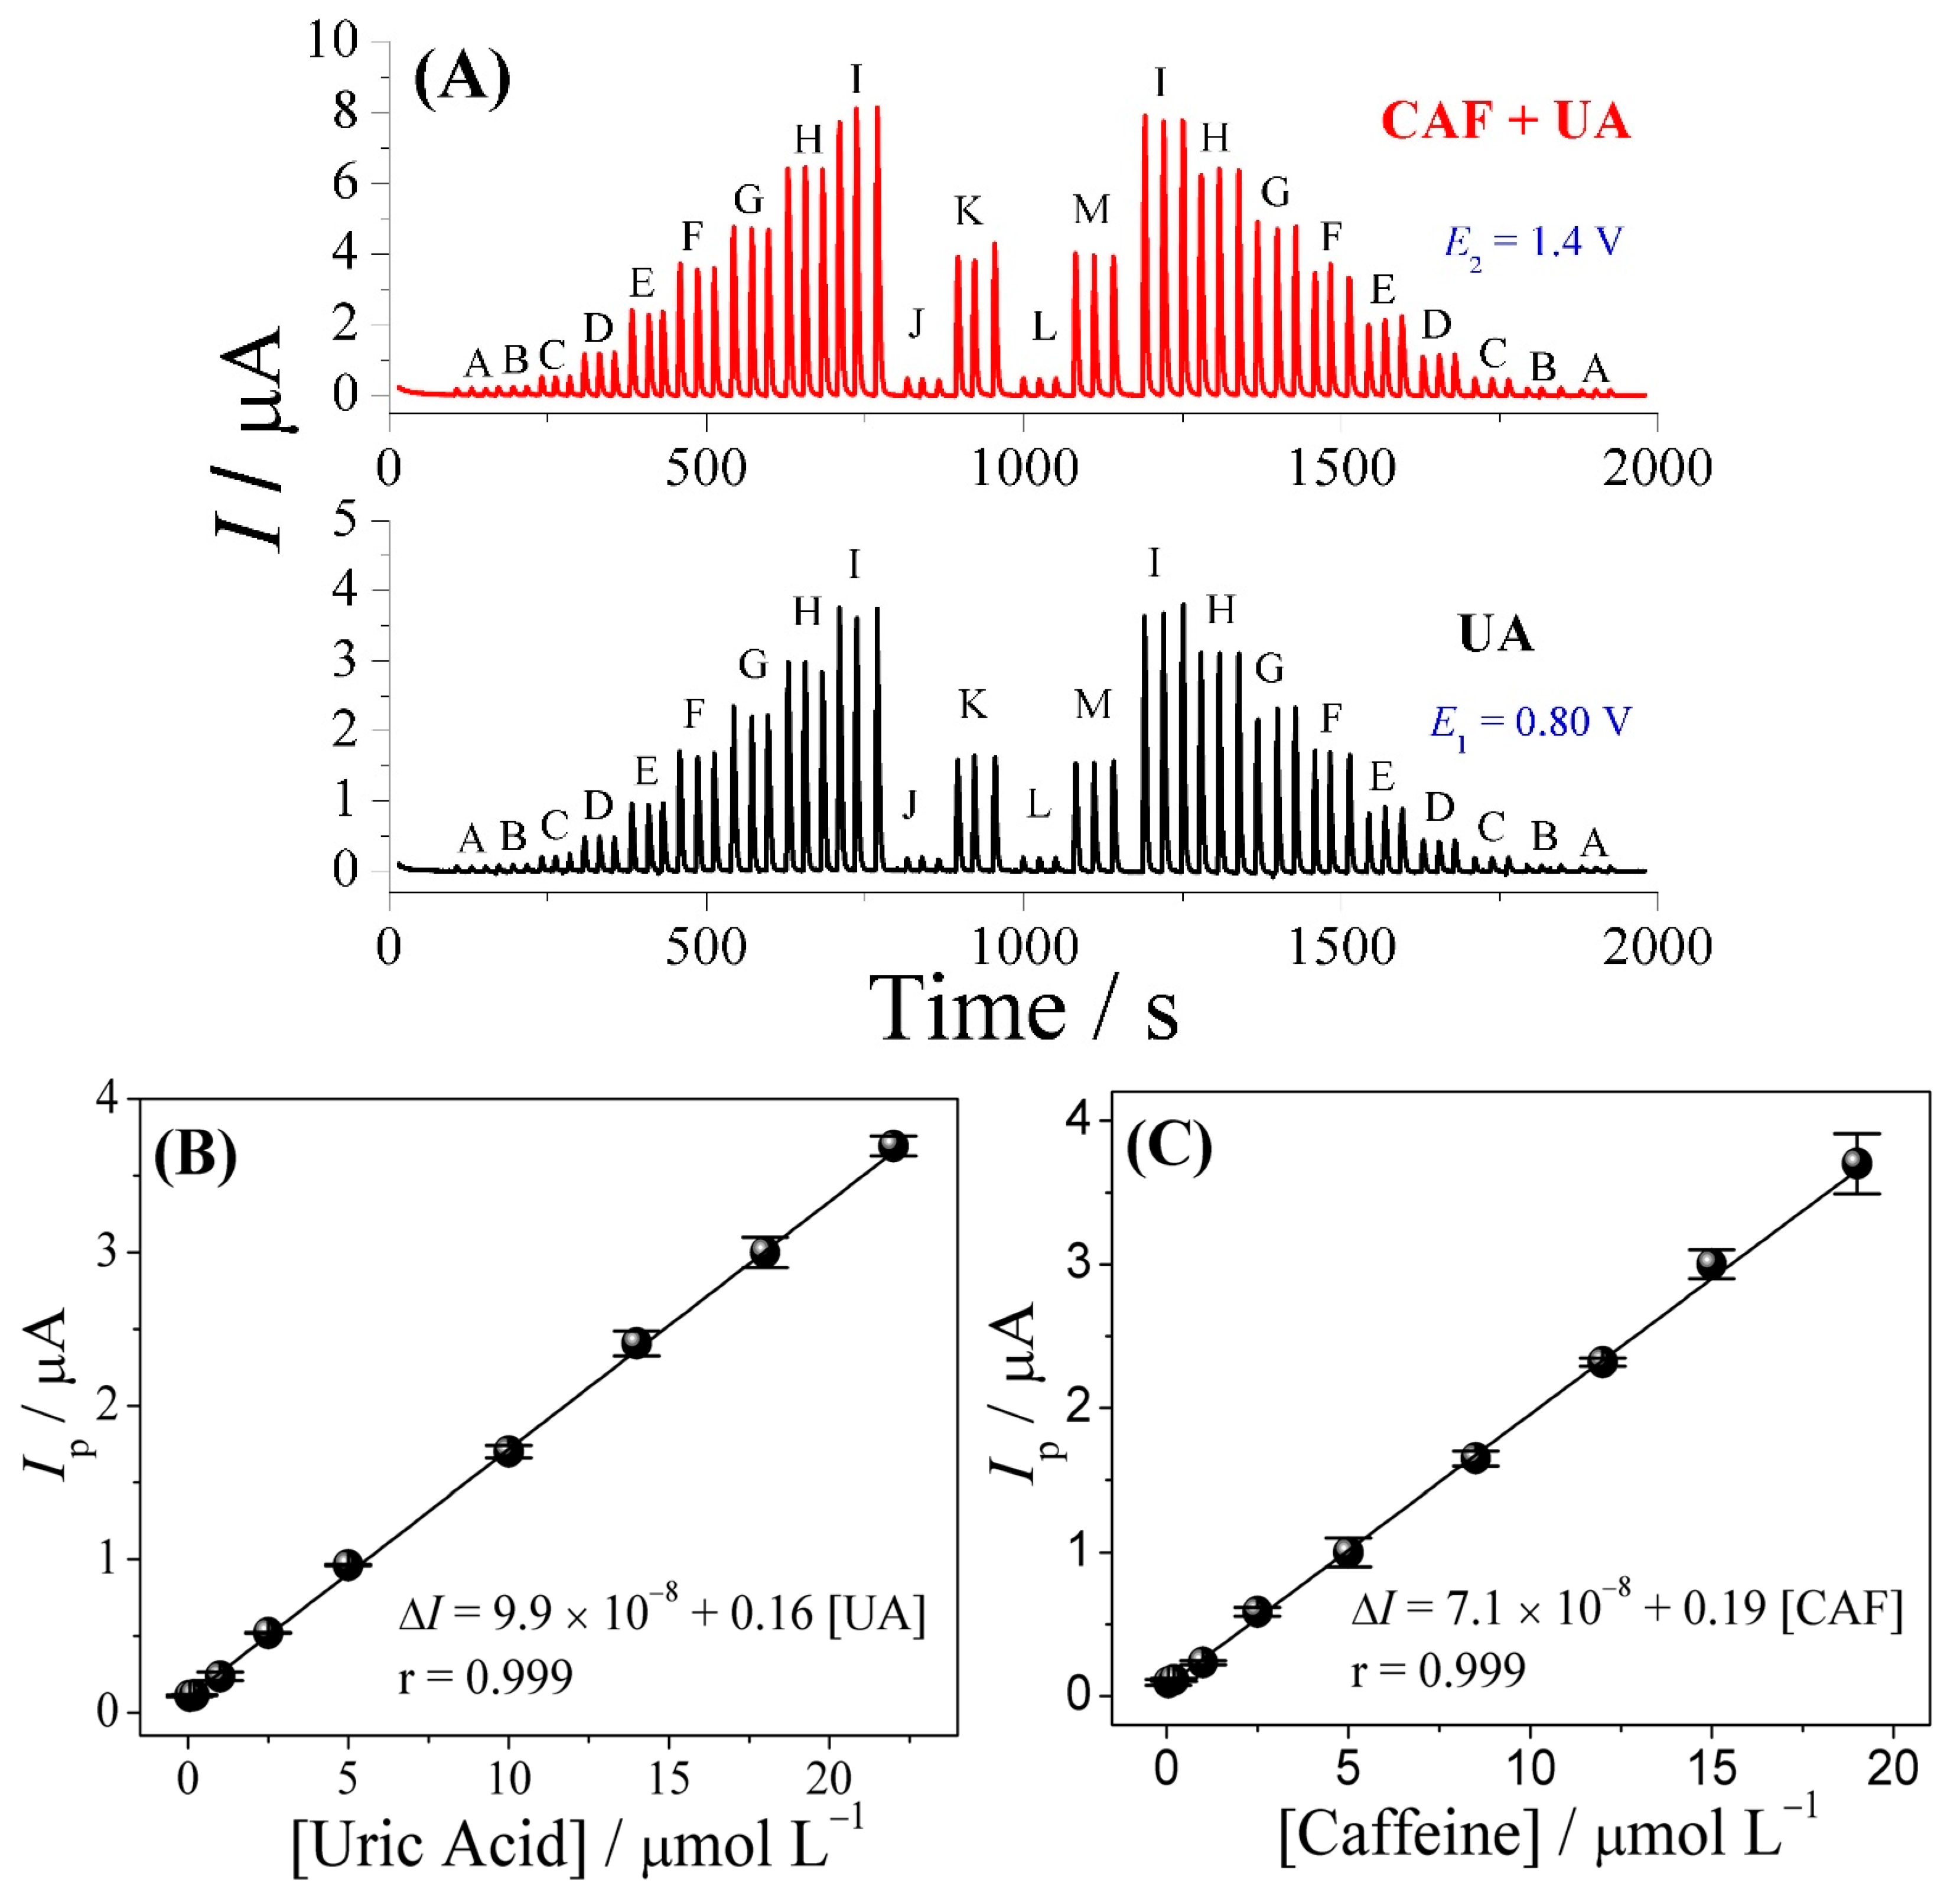
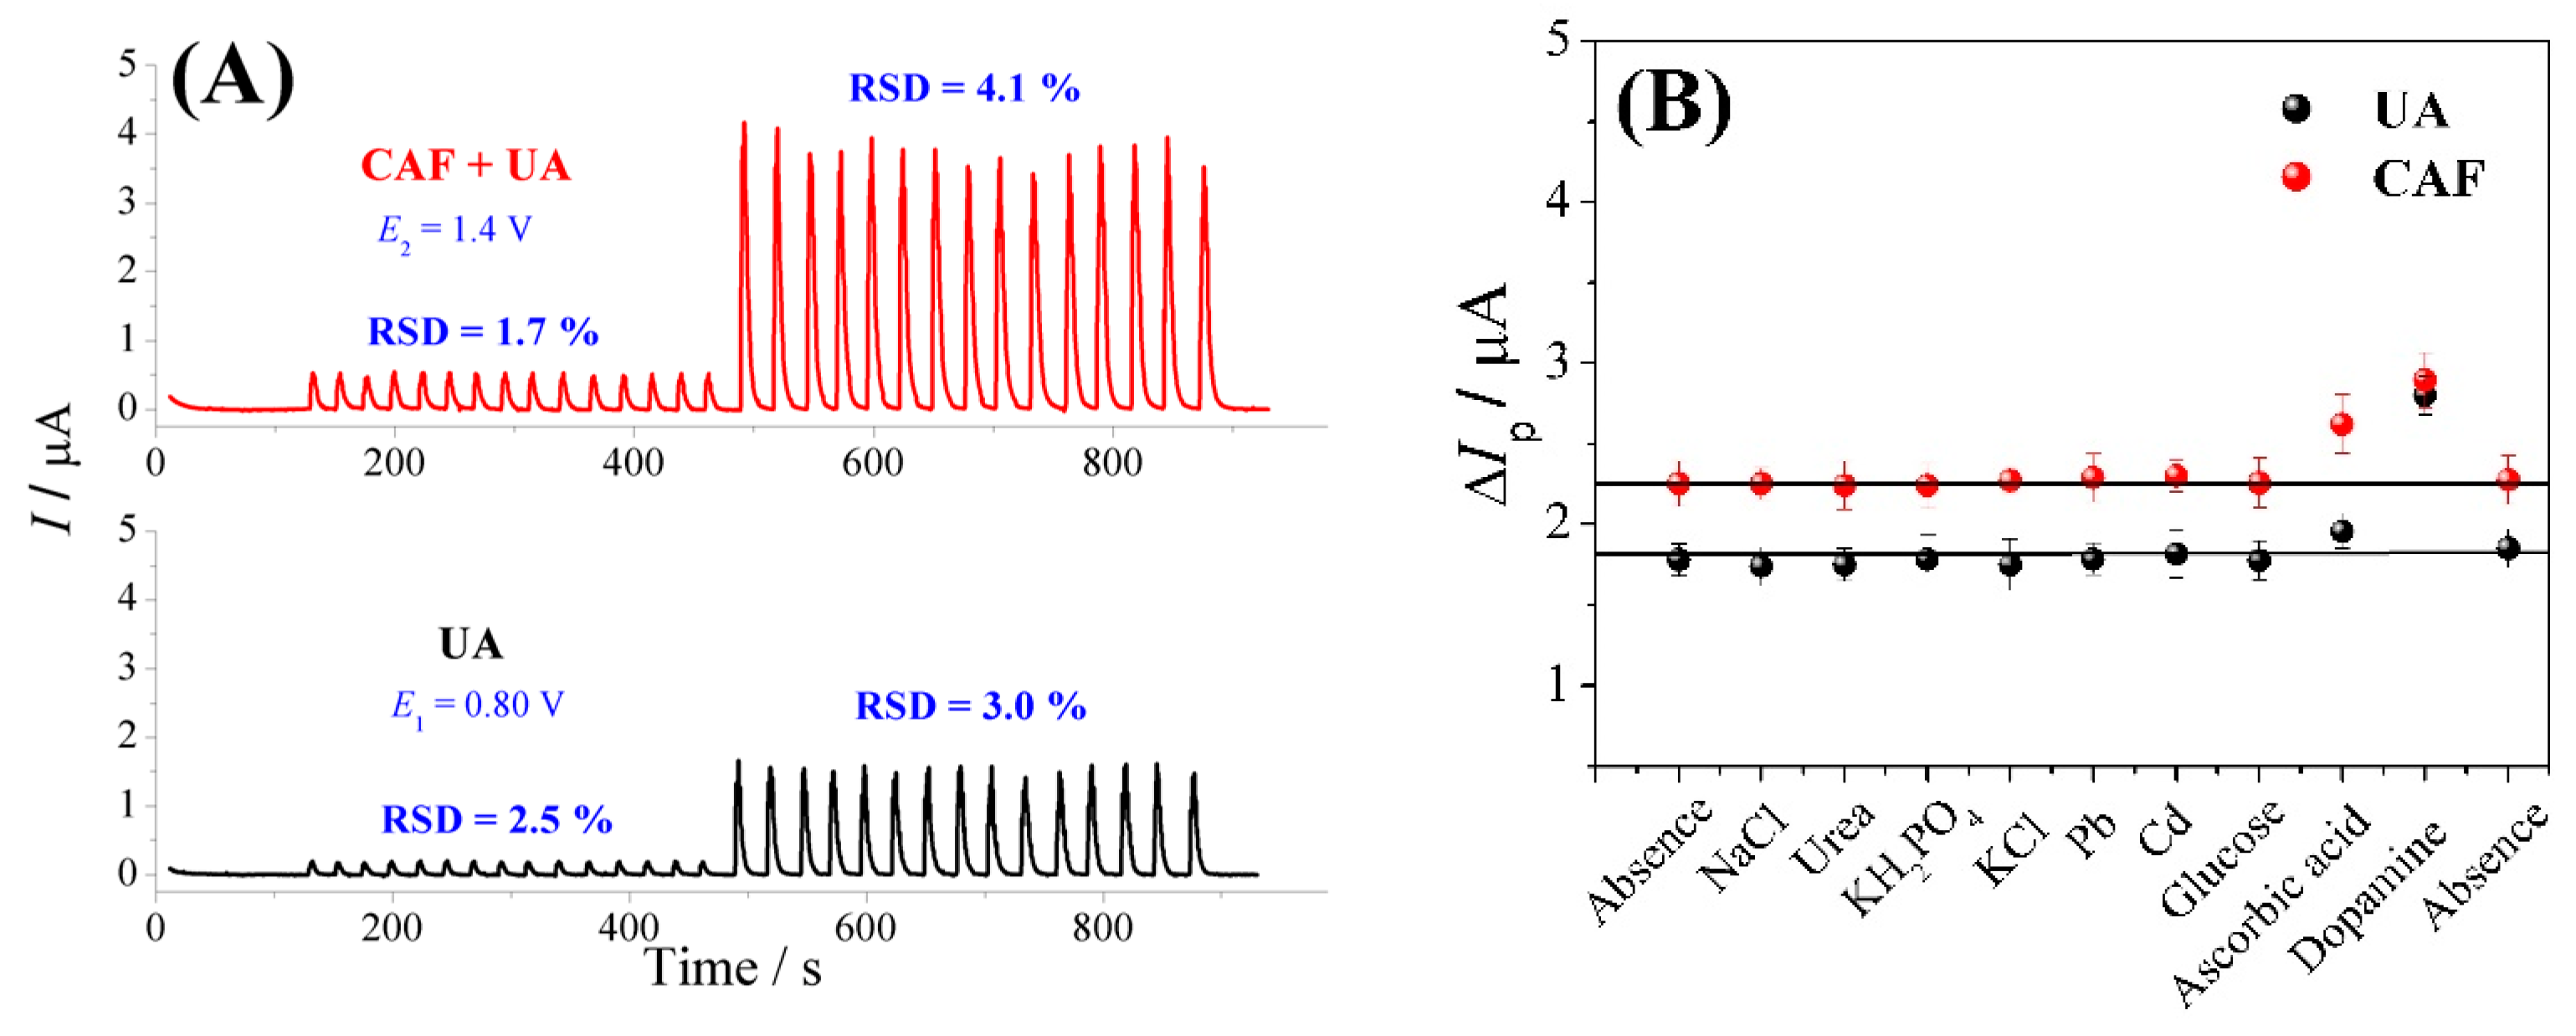
3.3. FIA-MPA of Uric Acid and Caffeine

Under optimized experimental conditions, the analytical curves for the simultaneous determination of UA and CAF were obtained and applied for the determination of UA and CAF in urine and river water samples. Figure 4A shows the amperograms obtained from the application of successive injections of different concentrations of the analytes in triplicate. The analytical curves were found to be linear in the concentration range of 5.0 × 10⁻⁸ to 2.2 × 10⁻⁵ mol L−1 for UA and 5.0 × 10⁻⁸ to 1.9 × 10⁻⁵ mol L−1 for CAF, with limits of detection (LOD) of 1.1 × 10⁻⁸ and 1.3 × 10⁻⁸ mol L−1, for UA and CAF, respectively (Figure 4B,C). The linear regression Equations (3) and (4) obtained for these analytes are given below:
UA curve: 9.9 × 10⁻⁸ + 0.16 ([UA] µmol L−1), r = 0.999
CAF curve: 7.1 × 10⁻⁸ + 0.19 ([CAF] µmol L−1), r = 0.999
In these analyses, UA and CAF standard solutions were injected in an increasing and decreasing concentration pattern, and the currents obtained at the same concentrations were found to be very similar; this outcome shows that the sensor did not exhibit any memory effects.
A comparative analysis of the analytical performance of the electrochemical method proposed in this study with other methods reported in the literature showed that the proposed method exhibited better results in terms of linear concentration range and/or limit of detection (see Table 1) [27,28,29,30,31,32,33,34,35,36,37,38], especially when the comparison is centered on methods based on BDD electrodes [36,37,38]. Among the key advantages of the method proposed in this study include the following: (i) simpler electrochemical platform; (ii) better analytical performance with low linear concentration range; (iii) relatively lower limit of detection (at nanomolar level); and applicability for the analysis of different matrices.
The proposed method is also found to be of low cost and easy to operate in addition to exhibiting high baseline stability, good repeatability (see below), and the ability to perform 126 analytical determinations per hour.
The precision of the proposed FIA-MPA method was also evaluated through the repeatability technique using two different concentrations of UA and CAF (1.0 × 10⁻⁶ and 1.0 × 10⁻⁵ mol L−1) (n = 15), as shown in Figure 5A. The relative standard deviation (RSD) values obtained from this analysis ranged between 1.7 and 4.1%; this result showed that the proposed flow-injection method has good precision.
To further prove the suitability of the proposed method for the analysis of the analytes, electrochemical tests were performed in the presence of various interfering chemical compounds (Figure 5B) which are found in river water and urine samples (NaCl, urea, KH2PO4, KCl, Pb, Cd, glucose, ascorbic acid, and dopamine) in a concentration ratio of 1:1 (analyte:interfering molecule). The results obtained from these tests were found to be satisfactory; no significant effects were observed on the anodic peak current (Ipa) intensities of the analytes after amperometric measurements with the exception of ascorbic acid and dopamine, which presented current values above the reference values for UA and CAF. The RSD values obtained for UA and CAF were less than 4.0%.

3.4. Application of the FIA-MPA Method in River Water and Urine Samples

The FIA-MPA method coupled with the CPT-BDD electrode was employed for the determination of UA and CAF in river water and urine samples, as shown in Table 2. The addition of UA and CAF in two concentration levels (8.0 × 10⁻⁷ and 8.0 × 10⁻⁶) resulted in recovery percentages ranging from 98 to 104%; clearly, this outcome points to low matrix effects. A comparative analysis of the results obtained from the application of the proposed flow-injection method and those obtained using the high-performance liquid chromatography (HPLC) reference method showed that the two methods exhibited very similar results; essentially, this shows that the proposed CPT-BDD electrode-based FIA-MPA method can be successfully applied for the simultaneous determination of UA and CAF considering that the relative error lies in the range of −2.5 to 1.2%.
The results obtained by the two methods also were statistically compared by applying the paired Student t-test (at a confidence level of 95%). Considering that the t(experimental) values calculated for UA (0.33) and CAF (1.7) were smaller than the t(critical) value (3.2), we can conclude that the results obtained using the two analytical methods did not present significant statistical difference at 95% confidence level. Hence, the here-proposed results demonstrated the precision of the FIA-MPA method and its effectiveness for the simultaneous determination of UA and CAF in river water and urine samples.

4. Conclusions

The results obtained from the cyclic voltammetry analysis conducted in the batch system showed that the cathodically pretreated BDD electrode exhibited a higher degree of efficiency compared to the anodically pretreated BDD electrode. A comparative analysis of the analytical performance of the proposed electrochemical method with other methods reported in the literature showed that the proposed method exhibited better results in terms of linear concentration range and/or limit of detection, especially when the comparison is centered on methods based on BDD electrodes. The CPT-BDD electrode-based FIA-MPA system proposed in this study exhibited good stability, satisfactory repeatability, and operational simplicity; apart from that, the technique was found to be extremely reliable and can be used for the conduct of numerous analyses per hour. The proposed method is also of low cost and has proven to be a highly efficient alternative method for the determination of UA and CAF with recovery rates close to 100% when applied in synthetic urine and river water samples. The findings of this study show that the proposed methodology is highly advantageous when compared to other analytical methods reported in the literature.

Supplementary Materials

The following supporting information can be downloaded at: https://www.mdpi.com/article/10.3390/bios13070690/s1. Figure S1. Study of supporting electrolytes phosphate buffer and sulfuric acid at pH 4.5 using CTP-BDD electrode at v = 50 mV s−1. Figure S2. Effect of sulfuric acid concentrations (0.01; 0.05; 0.1 and 0.2 mol L−1) on the cyclic voltammograms using a CPT-BDD electrode and v = 50 mV s−1.

Author Contributions

A.W.: conceptualization, methodology, formal analysis, investigation, validation, writing—original draft. A.M.S.: methodology, investigation, formal analysis, writing—review and editing. M.H.A.F.: investigation, writing—review and editing. O.F.-F.: resources, writing—review and editing. F.C.M.: resources, writing—review and editing. M.D.P.T.S.: project administration, writing—review and editing, Funding acquisition. All authors have read and agreed to the published version of the manuscript.

Funding

The authors gratefully acknowledge the financial assistance provided by PROPe (call Nº 13/2022) and the National Institute of Alternative Technologies for the Detection, Toxicological Evaluation and Removal of Micropollutants and Radioactives (FAPESP—process number 2017/10118-0 and 2022/05454-9). We are also grateful to INCT-DATREN (FAPESP #2014/50945-4 and CNPq #465571/2014-0) for the technological support provided during the conduct of the study. This study was partially funded by the Coordenação de Aperfeiçoamento de Pessoal de Nível Superior—Brazil (CAPES)—Finance Code 001.

Institutional Review Board Statement

Not applicable.

Informed Consent Statement

Not applicable.

Data Availability Statement

Not applicable.

Acknowledgments

The authors are grateful to the PROPe, CNPq, CAPES, and FAPESP for the financial assistance granted in support of this work (see the grants and grant numbers cited previously).

Conflicts of Interest

The authors have no conflict of interest to declare.

References

  1. Ragab, G.; Elshahaly, M.; Bardin, T. Gout: An old disease in new perspective—A review. J. Adv. Res. 2017, 8, 495–511. [Google Scholar] [CrossRef] [PubMed]
  2. Wang, X.; Chen, S.; Tang, X.; Lin, D.; Qiu, P. Ultrasensitive detection of uric acid in serum of patients with gout by a new assay based on Pt@Ag nanoflowers. RSC Adv. 2019, 9, 36578–36585. [Google Scholar] [CrossRef] [PubMed] [Green Version]
  3. Islam, M.N.; Ahmed, I.; Anik, M.I.; Ferdous, M.S.; Khan, M.S. Developing paper based diagnostic technique to detect uric acid in urine. Front. Chem. 2018, 6, 1–12. [Google Scholar] [CrossRef] [PubMed] [Green Version]
  4. Weldegebreal, B.; Redi-Abshiro, M.; Chandravanshi, B.S. Development of new analytical methods for the determination of caffeine content in aqueous solution of green coffee beans. Chem. Cent. J. 2017, 11, 126. [Google Scholar] [CrossRef] [Green Version]
  5. Sereshti, H.; Samadi, S. A rapid and simple determination of caffeine in teas, coffees and eight beverages. Food Chem. 2014, 158, 8–13. [Google Scholar] [CrossRef]
  6. Svorc, L. Determination of Caffeine: A Comprehensive Review on Electrochemical Methods. Int. J. Electrochem. Sci. 2013, 8, 5755–5773. [Google Scholar] [CrossRef]
  7. Fajara, B.E.P.; Susanti, H. HPLC determination of caffeine in coffee beverage. IOP Conf. Ser. Mater. Sci. Eng. 2017, 259, 012011. [Google Scholar] [CrossRef] [Green Version]
  8. Du, C.; Ma, C.; Gu, J.; Li, L.; Chen, G. Fluorescence sensing of caffeine in tea beverages with 3,5-diaminobenzoic acid. Sensors 2020, 20, 819. [Google Scholar] [CrossRef] [Green Version]
  9. Li, L.; Wang, J.; Chen, Z. Colorimetric determination of uric acid based on the suppression of oxidative etching of silver nanoparticles by chloroauric acid. Microchim. Acta 2020, 187, 18. [Google Scholar] [CrossRef]
  10. Dai, X.; Fang, X.; Zhang, C.; Xu, R.; Xu, B. Determination of serum uric acid using high-performance liquid chromatography (HPLC)/isotope dilution mass spectrometry (ID-MS) as a candidate reference method. J. Chromatogr. B Anal. Technol. Biomed. Life Sci. 2007, 857, 287–295. [Google Scholar] [CrossRef]
  11. Yamaguchi, T.; Hasegawa, K.; Kamino, S.; Miyachi, K.; Tominaga, H.; Fujita, Y. Spectrophotometric determination of uric acid based on fading of o-hydroxyhydroquinonephthalein-palladium(II)-hexadecyltrimethylammonium complex. Anal. Sci. 2007, 23, 223–226. [Google Scholar] [CrossRef] [PubMed] [Green Version]
  12. Vuletić, N.; Bardić, L.; Odžak, R. Spectrophotometric determining of caffeine content in the selection of teas, soft and energy drinks available on the Croatian market. Food Res. 2021, 5, 325–330. [Google Scholar] [CrossRef] [PubMed]
  13. Jiang, M.; Chen, J.S. A lable-free ECL biosensor for the detection of uric acid based on Au NRs at TiO2 nanocomposite. Int. J. Electrochem. Sci. 2019, 14, 2333–2344. [Google Scholar] [CrossRef]
  14. Wong, A.; Santos, A.M.; da Fonseca Alves, R.; Vicentini, F.C.; Fatibello-Filho, O.; Del Pilar Taboada Sotomayor, M. Simultaneous determination of direct yellow 50, tryptophan, carbendazim, and caffeine in environmental and biological fluid samples using graphite pencil electrode modified with palladium nanoparticles. Talanta 2021, 222, 121539. [Google Scholar] [CrossRef]
  15. Tasić, Ž.Z.; Petrović Mihajlović, M.B.; Simonović, A.T.; Radovanović, M.B.; Antonijević, M.M. Recent advances in electrochemical sensors for caffeine determination. Sensors 2022, 22, 9185. [Google Scholar] [CrossRef] [PubMed]
  16. Aafria, S.; Kumari, P.; Sharma, S.; Yadav, S.; Batra, B.; Rana, J.S.; Sharma, M. Electrochemical biosensing of uric acid: A review. Microchem. J. 2022, 182, 107945. [Google Scholar] [CrossRef]
  17. Lakshmi, D.; Whitcombe, M.J.; Davis, F.; Sharma, P.S.; Prasad, B.B. Electrochemical detection of uric acid in mixed and clinical samples: A review. Electroanalysis 2011, 23, 305–320. [Google Scholar] [CrossRef]
  18. Wong, A.; Santos, A.M.; Fatibello-Filho, O. Simultaneous determination of dopamine and cysteamine by flow injection with multiple pulse amperometric detection using a boron-doped diamond electrode. Diam. Relat. Mater. 2018, 85, 68–73. [Google Scholar] [CrossRef]
  19. Sotomayor, P.T.; Raimundo, I.M.; De Oliveira Neto, G.; De Oliveiira, W.A. Evaluation of fibre optical chemical sensors for flow analysis systems. Sens. Actuators B Chem. 1998, 51, 382–390. [Google Scholar] [CrossRef]
  20. Ghalkhani, M.; Bakirhan, N.K.; Ozkan, S.A. Combination of Efficiency with Easiness, Speed, and Cheapness in Development of Sensitive Electrochemical Sensors. Crit. Rev. Anal. Chem. 2020, 50, 538–553. [Google Scholar] [CrossRef]
  21. Hayashi, T.; Sakurada, I.; Honda, K.; Motohashi, S.; Uchikura, K. Electrochemical detection of sugar-related compounds using boron-doped diamond electrodes. Anal. Sci. 2012, 28, 127–133. [Google Scholar] [CrossRef] [PubMed] [Green Version]
  22. Lourenção, B.C.; Brocenschi, R.F.; Medeiros, R.A.; Fatibello-Filho, O.; Rocha-Filho, R.C. Analytical applications of electrochemically pretreated boron-doped diamond electrodes. ChemElectroChem 2020, 7, 1291–1311. [Google Scholar] [CrossRef]
  23. Pleskacova, A.; Brejcha, S.; Pacal, L.; Kankova, K.; Tomandl, J. Simultaneous determination of uric acid, xanthine and hypoxanthine in human plasma and serum by hplc–uv: Uric acid metabolism tracking. Chromatographia 2017, 80, 529–536. [Google Scholar] [CrossRef]
  24. Lopez-Sanchez, R.D.C.; Lara-Diaz, V.J.; Aranda-Gutierrez, A.; Martinez-Cardona, J.A.; Hernandez, J.A. HPLC method for quantification of caffeine and its three major metabolites in human plasma using fetal bovine serum matrix to evaluate prenatal drug exposure. J. Anal. Methods Chem. 2018, 2018, 2085059. [Google Scholar] [CrossRef] [Green Version]
  25. Girard, H.; Simon, N.; Ballutaud, D.; Herlem, M.; Etcheberry, A. Effect of anodic and cathodic treatments on the charge transfer of boron doped diamond electrodes. Diam. Relat. Mater. 2007, 16, 316–325. [Google Scholar] [CrossRef]
  26. Suffredini, H.B.; Pedrosa, V.A.; Codognoto, L.; Machado, S.A.S.; Rocha-Filho, R.C.; Avaca, L.A. Enhanced electrochemical response of boron-doped diamond electrodes brought on by a cathodic surface pre-treatment. Electrochim. Acta 2004, 49, 4021–4026. [Google Scholar] [CrossRef]
  27. Iyyappan, E.; Samuel Justin, S.J.; Wilson, P.; Palaniappan, A. Nanoscale hydroxyapatite for electrochemical sensing of uric acid: Roles of mesopore volume and surface acidity. ACS Appl. Nano Mater. 2020, 3, 7761–7773. [Google Scholar] [CrossRef]
  28. Du, J.; Yue, R.; Yao, Z.; Jiang, F.; Du, Y.; Yang, P.; Wang, C. Nonenzymatic uric acid electrochemical sensor based on graphene-modified carbon fiber electrode. Colloids Surf. A Physicochem. Eng. Asp. 2013, 419, 94–99. [Google Scholar] [CrossRef]
  29. Wang, Y.; Tong, L.-L. Electrochemical sensor for simultaneous determination of uric acid, xanthine and hypoxanthine based on poly (bromocresol purple) modified glassy carbon electrode. Sens. Actuators B 2010, 150, 43–49. [Google Scholar] [CrossRef]
  30. Zhang, X.; Zhang, Y.-C.; Ma, L.-X. One-pot facile fabrication of graphene-zinc oxide composite and its enhanced sensitivity for simultaneous electrochemical detection of ascorbic acid, dopamine and uric acid. Sens. Actuators B 2016, 227, 488–496. [Google Scholar] [CrossRef]
  31. Geto, A.; Brett, C.M.A. Electrochemical sensor for caffeine in coffee and beverages using a naphthalene sulfonic acid polymer film–based modified electrode. Food Anal. Methods 2021, 14, 2386–2394. [Google Scholar] [CrossRef]
  32. Brunetti, B.; Desimoni, E.; Casati, P. Determination of caffeine at a nafion-covered glassy carbon electrode. Electroanalysis 2007, 19, 385–388. [Google Scholar] [CrossRef]
  33. Muzvidziwa, T.; Moyo, M.; Okonkwo, J.O.; Shumba, M.; Nharingo, T.; Guyo, U. Electrodeposition of zinc oxide nanoparticles on multiwalled carbon nanotube-modified electrode for determination of caffeine in wastewater effluent. Int. J. Environ. Anal. Chem. 2017, 97, 623–636. [Google Scholar] [CrossRef]
  34. Tyszczuk-Rotkoz, K.; Szwagierek, A. Green electrochemical sensor for caffeine determination in environmental water samples: The bismuth film screen-printed carbon electrode. J. Electrochem. Soc. 2017, 164, B342–B348. [Google Scholar] [CrossRef]
  35. Raj, M.A.; John, S.A.; John, S.A. Simultaneous determination of uric acid, xanthine, hypoxanthine and caffeine in human blood serum and urine samples using electrochemically reduced graphene oxide modified electrode. Anal. Chim. Acta 2013, 771, 14–20. [Google Scholar] [CrossRef] [PubMed]
  36. Sarakhman, O.; Benkova, A.; Svorc, Ľ. A modern and powerful electrochemical sensing platform for purines determination: Voltammetric determination of uric acid and caffeine in biological samples on miniaturized thick-film boron-doped diamond electrode. Microchem. J. 2022, 175, 107132. [Google Scholar] [CrossRef]
  37. Silva, W.C.; Pereira, P.F.; Marra, M.C.; Gimenes, D.T.; Cunha, R.R.; da Silva, R.A.B.; Munoz, R.A.A.; Richter, E.M. A simple strategy for simultaneous determination of paracetamol and caffeine using flow injection analysis with multiple pulse amperometric detection. Electroanalysis 2011, 23, 2764–2770. [Google Scholar] [CrossRef]
  38. Ramos, D.L.O.; Ribeiro, M.M.A.C.; Munoz, R.A.A.; Richter, E.M. Portable amperometric method for selective determination of caffeine in samples with the presence of interfering electroactive chemical species. J. Electroanal. Chem. 2022, 906, 116006. [Google Scholar] [CrossRef]
Figure 1. Using cyclic voltammetry for a comparative analysis of anodically (APT) and cathodically (CPT) pretreated BDD electrodes in a batch system based on the application of 5.0 × 10⁻⁵ mol L−1 UA and 5.0 × 10⁻⁵ mol L−1 CAF in 0.10 mol L–1 H2SO4 solution. Analysis conditions: v = 50 mV s−1, step potential = 4 mV, APT (0.04 A cm−2 for 60 s), and CPT (−0.04 A cm−2 for 180 s).
Biosensors 13 00690 g001
Figure 2. Optimization of the analytical parameters of the CPT-BDD electrode-based FIA-MPA system. (A) Amperograms obtained for injections UA and CAF solution and hydrodynamic voltammograms obtained by the values of peak current as a function of the (B) potential pulses applied, (C) injection sample volume: 50 to 350 µL, (D) flow rate: 0.95 to 6.0 mL min−1, and (E) pulse time: 100 to 300 ms. Analysis conditions: [UA] = 1.5 × 10⁻⁵ mol L−1; [CAF] = 1.5 × 10⁻⁵ mol L−1; electrolyte solution: 0.10 mol L–1 H2SO4.
Biosensors 13 00690 g002
Figure 3. (A) MPA wave applied to the BDD working electrode as a function of time; (B) flow-injection pulse amperometric responses in triplicate for 1.5 × 10⁻⁵ mol L−1 UA and 1.5 × 10⁻⁵ mol L−1 UA and for UA + CAF at the same concentrations. Supporting electrolyte: 0.10 mol L−1 H2SO4; injection volume: 250 μL; and flow rate: 3.8 mL min−1.
Biosensors 13 00690 g003
Figure 4. Fiagram obtained from the application of the CPT-BDD electrode, with the injection of UA at the following concentrations: (A–I) 5.0 × 10⁻⁸, 2.0 × 10⁻⁷, 1.0 × 10⁻⁶, 2.5 × 10⁻⁶, 5.0 × 10⁻⁶, 1.0 × 10⁻⁵, 1.4 × 10⁻⁵, 1.8 × 10⁻⁵, and 2.2 × 10⁻⁵ mol L−1, CAF at the following concentrations: (A–I) 5.0 × 10⁻⁸, 2.0 × 10⁻⁷, 1.0 × 10⁻⁶, 2.5 × 10⁻⁶, 5.0 × 10⁻⁶, 8.5 × 10⁻⁶, 1.2 × 10⁻⁵, 1.5 × 10⁻⁵ and 1.9 × 10⁻⁵ mol L−1, and (J–M) urine and river water samples fortified with different concentrations of UA and CAF (A). Analytical curve (n = 3) (inset) (B,C). Analysis conditions: supporting electrolyte/carrier solution: 0.10 mol L−1 H2SO4 solution; injection volume: 250 μL; and flow rate: 3.8 mL min−1.
Biosensors 13 00690 g004
Figure 5. Analysis of repeatability of the CPT-BDD electrode-based FIA-MPA system using two concentration levels (1.0 × 10⁻⁶ and 1.0 × 10⁻⁵ mol L−1, respectively) of UA and CAF (A). Study of interference in the presence of different compounds (B). Analysis conditions: supporting electrolyte/carrier solution: 0.10 mol L−1 H2SO4 solution; injection volume: 250 μL; flow rate: 3.8 mL min−1; [UA] = 1.0 × 10⁻⁵; and CAF = 1.0 × 10⁻⁵ mol L−1.
Biosensors 13 00690 g005
Table 1. Comparison of the analytical performance of electrochemical sensors for uric acid and caffeine determination.
ElectrodeAnalyteTechniqueLinear Range (µmol L−1)LOD (µmol L−1)Reference
n-HA/CPE aUADPV0.068–500.05[27]
Graphene-modified carbon fiberUAAmperometry0.194–49.680.132[28]
Poly(bromocresol purple)/GCEUADPV0.5–1200.2[29]
RGO−ZnO/GCE bUADPV1.0–70.00.33[30]
Poly(7A4HN2SA)/GCE cCAFDPV10–5000.23[31]
Nafion/GCECAFDPV0.99–10.60.79[32]
ZnO/MWCNT/GCE dCAFDPV0.02–24.90.01[33]
BiF-SPCE/CNFs eCAFDPAdSV0.20–1.00.05[34]
FN/rGO-200/GCE fUA and CAFDPV4.0–21.51.3 and 1.6[35]
BDDUA and CAFSWV9.2–95.0 and 4.6–95.76.0 and 3.9[36]
BDDPCT and CAFFIA-MPA(0.050–1.3) × 103 and (0.051–1.3) × 1020.66 and 0.87[37]
BDDCAFBIA-MPA10–14450.26[38]
CPT-BDDUA and CAFFIA-MPA0.050–22 and 0.050–190.011 and 0.013This work
a Nanoscale HA-modified GCE; b reduced graphene oxide (RGO)−ZnO nanocomposite-modified GCE; c 7-amino-4-hydroxynaphthalene-2-sulfonic acid on a glassy carbon electrode; d zinc oxide nanoparticles on multi-walled carbon nanotube-modified glassy carbon electrode; e bismuth film screen-printed carbon electrode nickel; f ferrite/reduced graphene oxide; DPV = differential pulse voltammetry; SWV = square wave voltammetry; BIA = batch-injection analysis; PCT = paracetamol.
Table 2. Determination of UA and CAF in urine and river water samples.
SamplesAnalytesAdded/mol L−1Comparative Method/mol L−1Proposed Method/mol L−1Recovery **
(Sensor, %)
Error ***
%
Found *Found *
River waterUA8.0 × 10−7(8.2 ± 0.1) × 10−7(8.3 ± 0.1) × 10−7104+1.2
8.0 × 10⁻⁶(8.0 ± 0.1) × 10−6(7.8 ± 0.1) × 10−698−2.5
CAF8.0 × 10−7(8.1 ± 0.1) × 10−7(8.2 ± 0.1) × 10−7102+1.2
8.0 × 10⁻⁶(8.0 ± 0.2) × 10−6(8.0 ± 0.1) × 10−61000
Synthetic UrineUA8.0 × 10−7(8.1 ± 0.1) × 10−7(8.0 ± 0.1) × 10−7100−1.2
8.0 × 10⁻⁶(8.1 ± 0.2) × 10−6(8.2 ± 0.1) × 10−6102+1.2
CAF8.0 × 10−7(8.2 ± 0.2) × 10−7(8.3 ± 0.4) × 10−7104+1.2
8.0 × 10⁻⁶(7.9 ± 0.2) × 10−6(7.9 ± 0.3) × 10−6990
* Average of 3 measured concentrations; ** recovery percentage = [Found/Added] × 100; *** Relative error = [(Proposed method−Comparative method)/(Comparative method)] × 100.
Disclaimer/Publisher’s Note: The statements, opinions and data contained in all publications are solely those of the individual author(s) and contributor(s) and not of MDPI and/or the editor(s). MDPI and/or the editor(s) disclaim responsibility for any injury to people or property resulting from any ideas, methods, instructions or products referred to in the content.

