Aptamer-Based Microfluidic Assay for In-Field Detection of Salicylic Acid in Botrytis cinerea-Infected Strawberries

 , , and
Abstract
1. Introduction
2. Materials and Methods
2.1. Fabrication of the Microfluidic Devices
2.2. Aptamer-Based Assay for SA Detection
2.2.1. Reagents
2.2.2. Packing the Biomarker Detection Chamber
2.2.3. Fluorescence-Based Aptamer for SA Detection
2.3. Sample Collection and Preparation for SA Detection in Strawberries
Packing of the Sample Treatment Chamber
2.4. Fluorescence Imaging and Data Analysis
2.5. Quantification of SA Using Reverse-Phase HPLC
3. Results
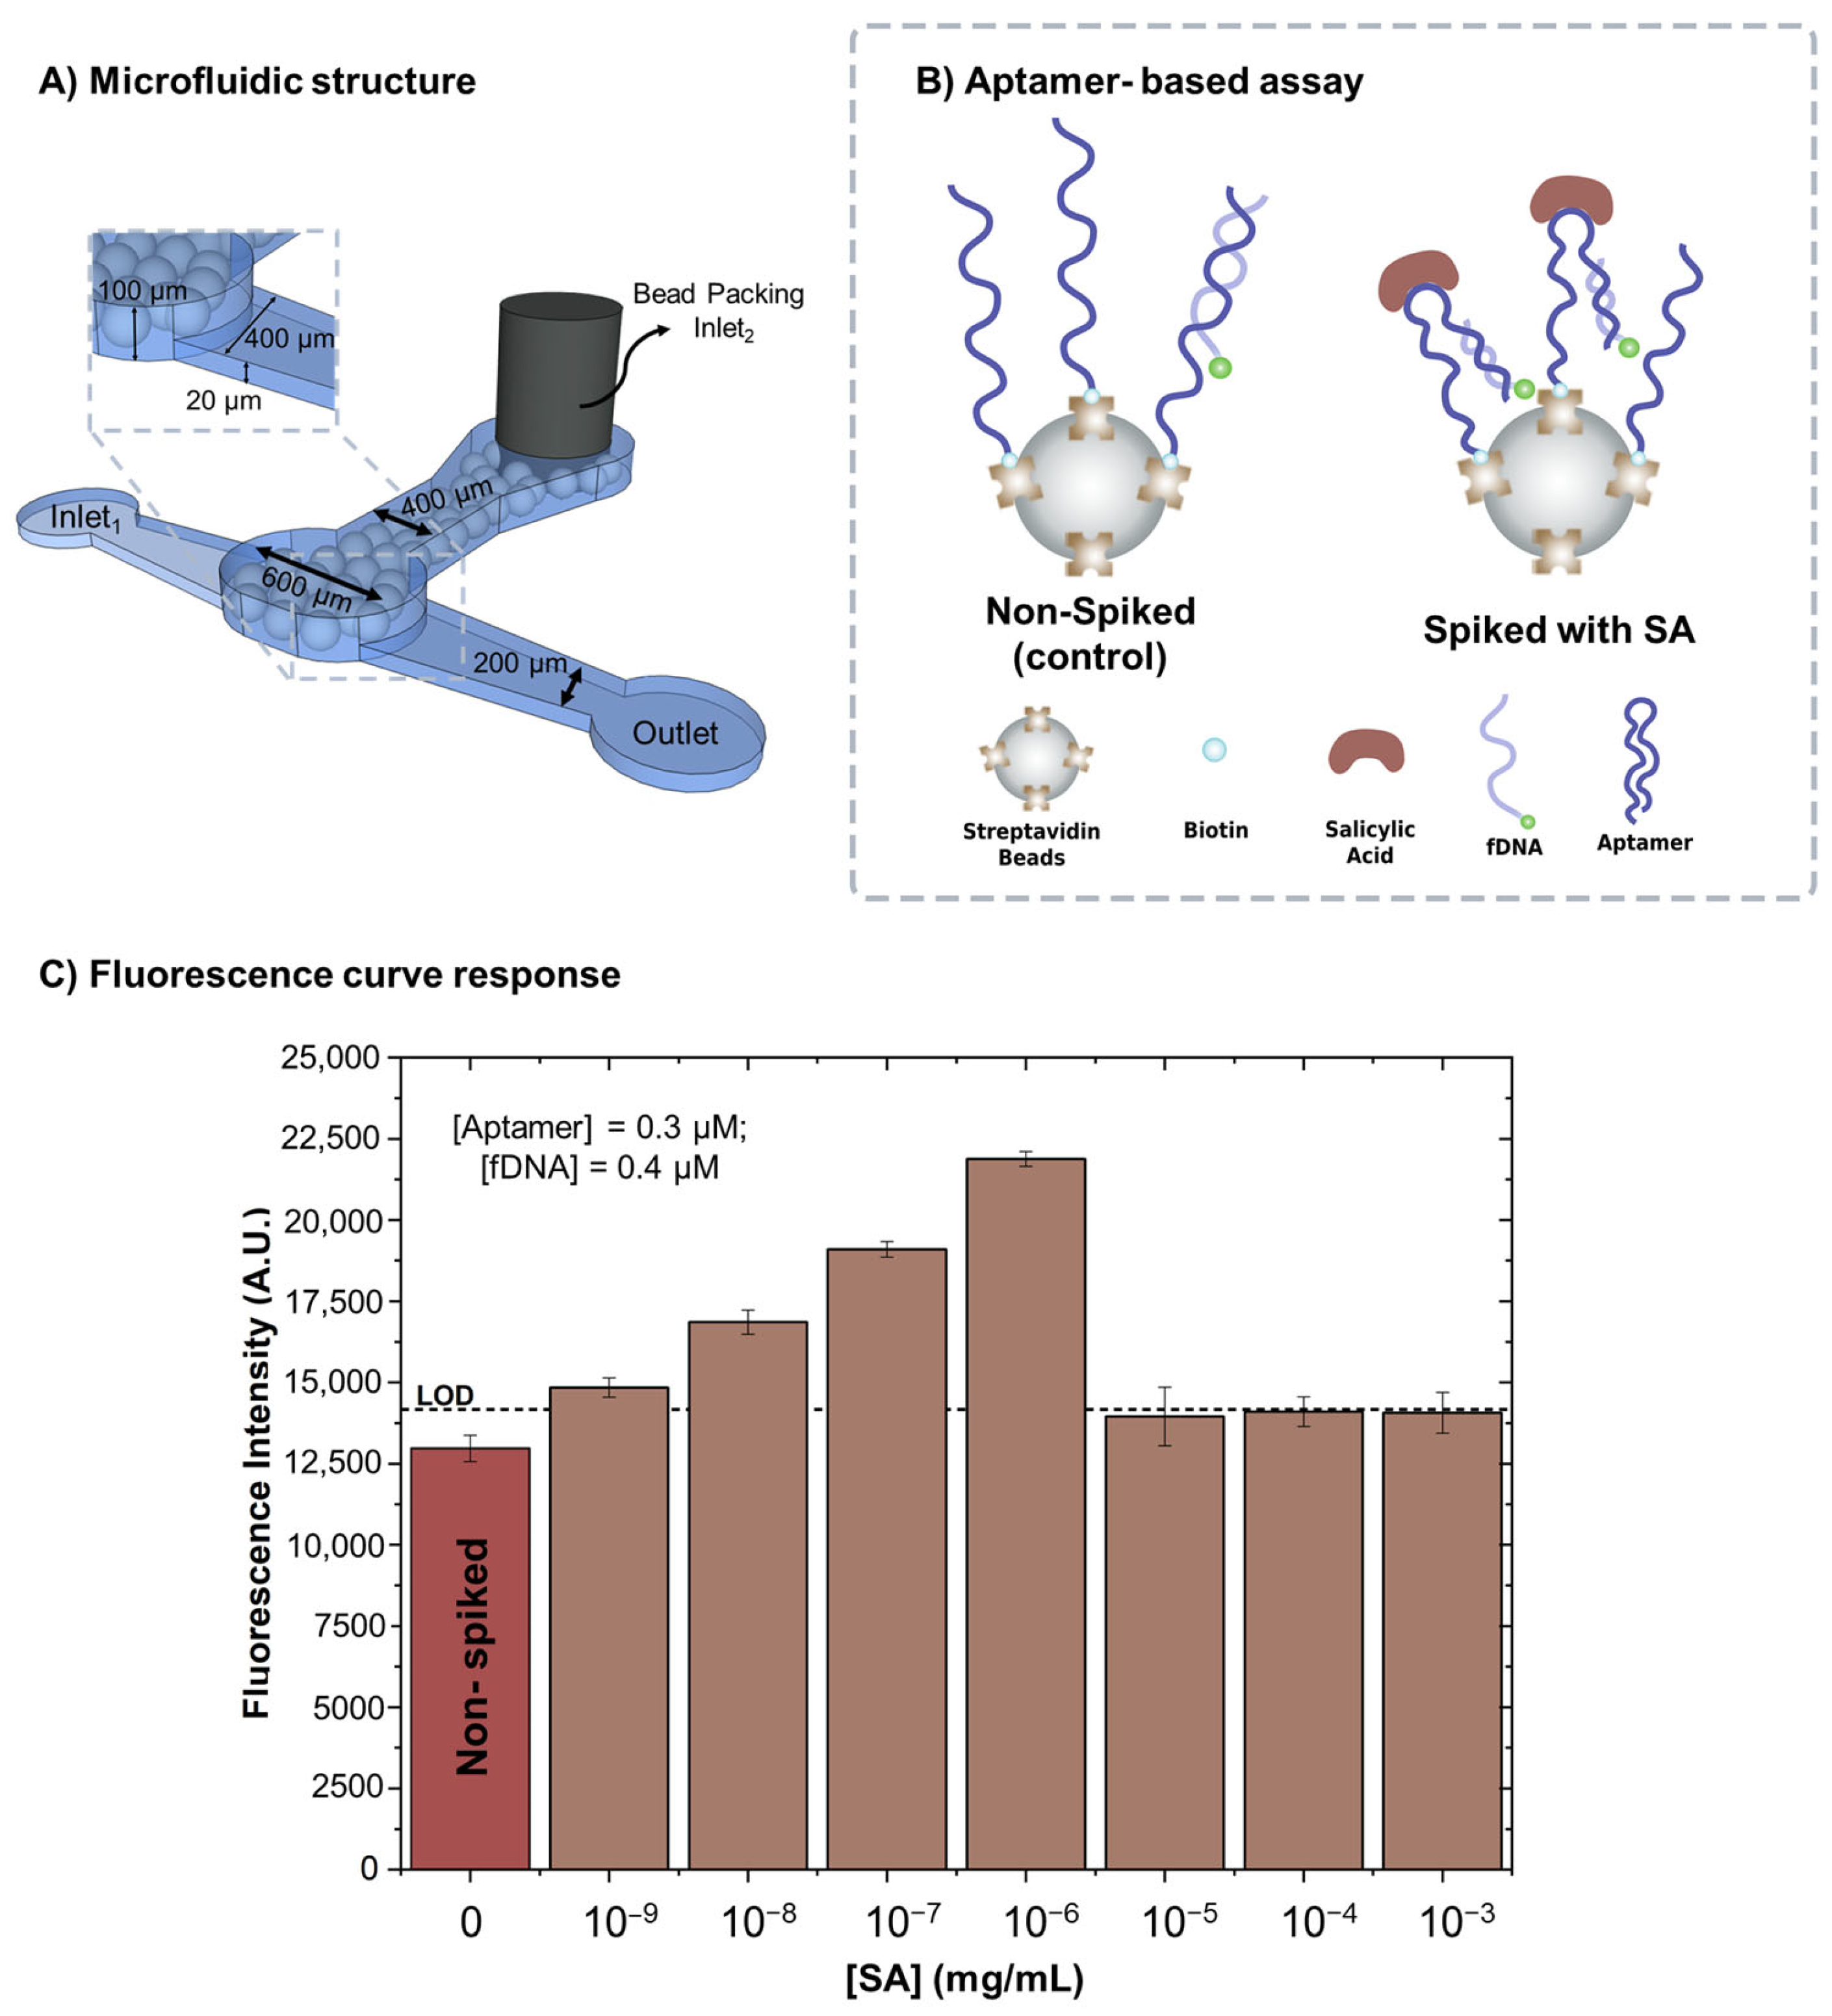
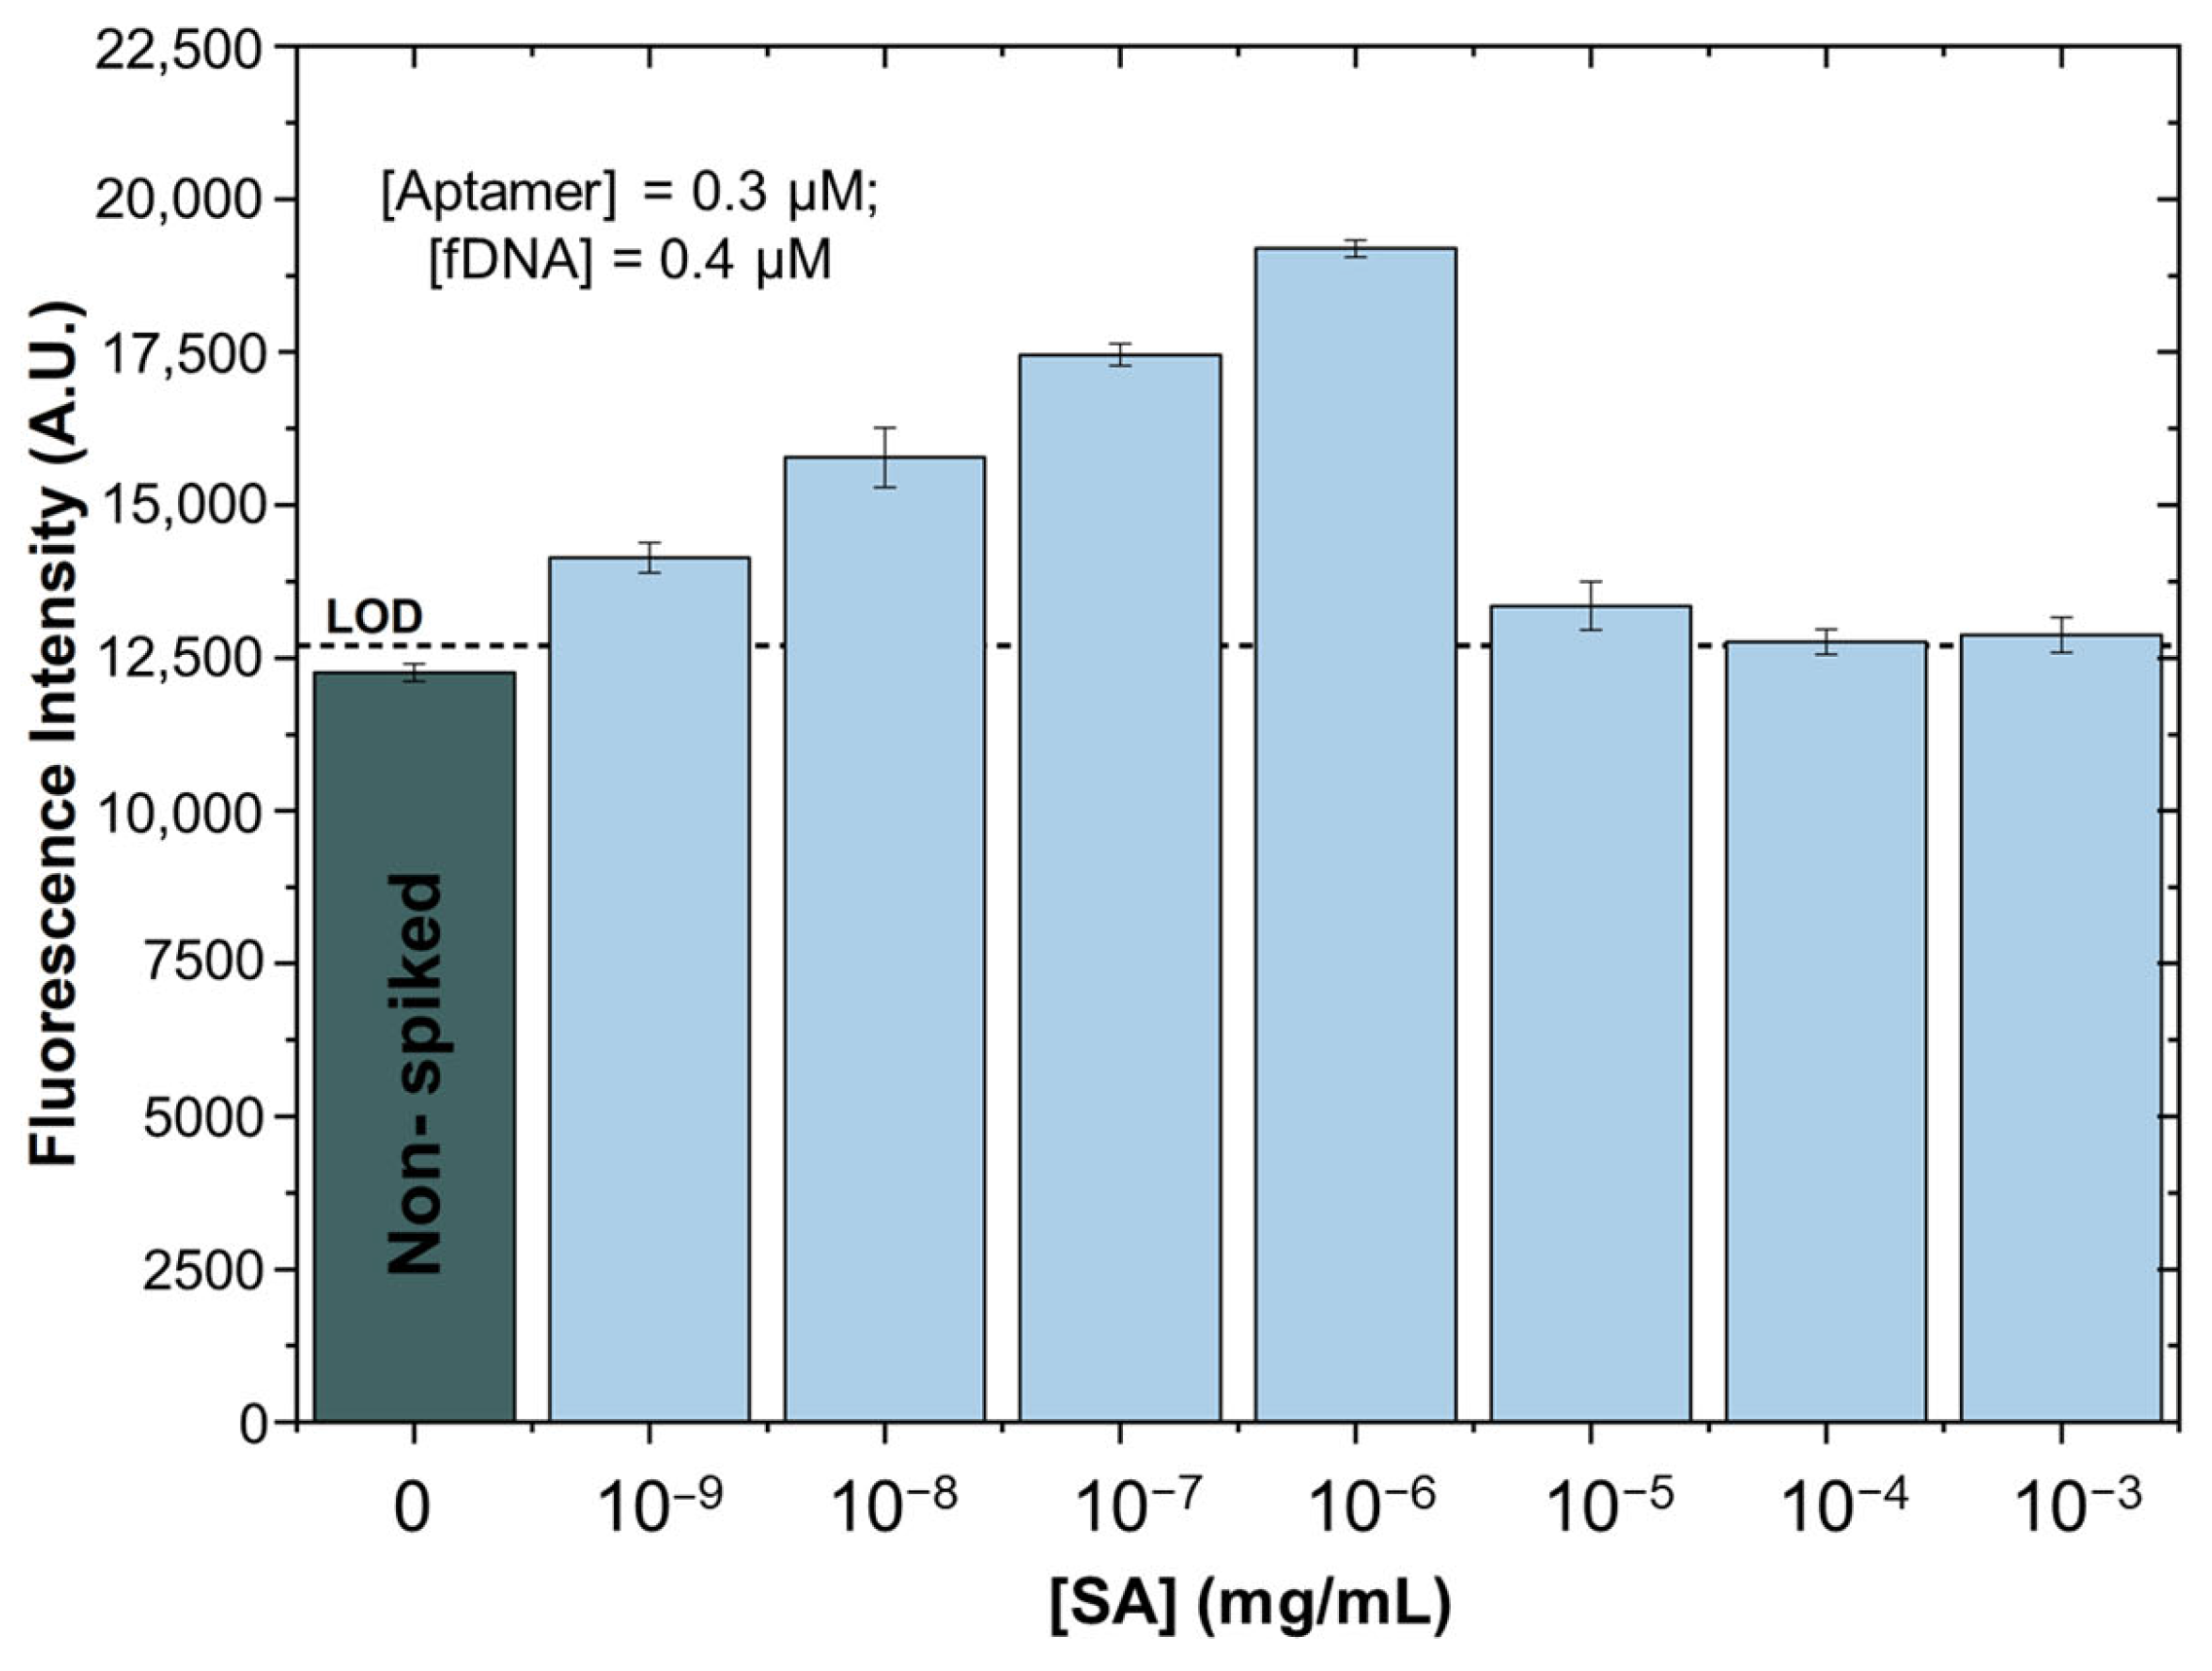
3.1. SA Spiked in Binding Buffer
3.2. SA Spiked in Treated Supermarket Strawberry Samples
3.3. SA in Naturally Infected Strawberry Samples
4. Conclusions
Supplementary Materials
Author Contributions
Funding
Institutional Review Board Statement
Informed Consent Statement
Data Availability Statement
Acknowledgments
Conflicts of Interest
References
- Zhao, X.; Zhai, L.; Chen, J.; Zhou, Y.; Gao, J.; Xu, W.; Li, X.; Liu, K.; Zhong, T.; Xiao, Y.; et al. Recent Advances in Microfluidics for the Early Detection of Plant Diseases in Vegetables, Fruits, and Grains Caused by Bacteria, Fungi, and Viruses. J. Agric. Food Chem. 2024, 72, 15401–15415. [Google Scholar] [CrossRef] [PubMed]
- Domingues, C.; Meirinho, R.; Rodrigues, R.G.; Fortes, A.M.; Chu, V.; Conde, J.P. Competitive Immunoassay in a Microfluidic Biochip for In-Field Detection of Abscisic Acid in Grapes. Biosensors 2024, 14, 123. [Google Scholar] [CrossRef] [PubMed]
- Jagannath, A.; Cong, H.; Hassan, J.; Gonzalez, G.; Gilchrist, M.D.; Zhang, N. Pathogen detection on microfluidic platforms: Recent advances, challenges, and prospects. Biosens. Bioelectron. X 2022, 10, 100134. [Google Scholar] [CrossRef]
- Nasseri, B.; Soleimani, N.; Rabiee, N.; Kalbasi, A.; Karimi, M.; Hamblin, M.R. Point-of-care microfluidic devices for pathogen detection. Biosens. Bioelectron. 2018, 117, 112–128. [Google Scholar] [CrossRef]
- Cesewski, E.; Johnson, B.N. Electrochemical biosensors for pathogen detection. Biosens. Bioelectron. 2020, 159, 112214. [Google Scholar] [CrossRef]
- Mullis, K.; Faloona, F. Specific synthesis of DNA in vitro via a polymerase-catalyzed chain reaction. Methods Enzymol. 1987, 155, 335–350. [Google Scholar] [CrossRef]
- Notomi, T.; Okayama, H.; Masubuchi, H.; Yonekawa, T.; Watanabe, K.; Amino, N.; Hase, T. Loop-mediated isothermal amplification of DNA. Nucleic Acids Res. 2000, 28, 63–663. [Google Scholar] [CrossRef]
- Amaro, R.; Diniz, I.; Santos, H.; Pimentel, D.; Rego, C.; Mithöfer, A.; Fortes, A.M. Hormone Changes in Tolerant and Susceptible Grapevine Leaves Under Powdery Mildew Infection. J. Plant Growth Regul. 2023, 42, 3606–3614. [Google Scholar] [CrossRef]
- Feng, S.; Chen, C.; Song, C.; Ding, X.; Wang, W.; Que, L. Optical Aptamer-Based Sensors for Detecting Plant Hormones. IEEE Sens. J. 2020, 21, 5743–5750. [Google Scholar] [CrossRef]
- Yang, S.-M.; Lv, S.; Zhang, W.; Cui, Y. Microfluidic Point-of-Care (POC) Devices in Early Diagnosis: A Review of Opportunities and Challenges. Sensors 2022, 22, 1620. [Google Scholar] [CrossRef]
- Choi, S.; Goryll, M.; Sin, L.Y.M.; Wong, P.K.; Chae, J. Microfluidic-based biosensors toward point-of-care detection of nucleic acids and proteins. Microfluid. Nanofluid. 2011, 10, 231–247. [Google Scholar] [CrossRef] [PubMed]
- Behera, P.P.; Kumar, N.; Kumari, M.; Kumar, S.; Mondal, P.K.; Arun, R.K. Integrated microfluidic devices for point-of-care detection of bio-analytes and disease. Sens. Diagn. 2023, 2, 1437–1459. [Google Scholar] [CrossRef]
- Wang, C.; El-Shetehy, M.; Shine, M.B.; Yu, K.; Navarre, D.; Wendehenne, D.; Kachroo, A.; Kachroo, P. Free Radicals Mediate Systemic Acquired Resistance. Cell Rep. 2014, 7, 348–355. [Google Scholar] [CrossRef] [PubMed]
- Coelho, J.; Almeida-Trapp, M.; Pimentel, D.; Soares, F.; Reis, P.; Rego, C.; Mithöfer, A.; Fortes, A.M. The study of hormonal metabolism of Trincadeira and Syrah cultivars indicates new roles of salicylic acid, jasmonates, ABA and IAA during grape ripening and upon infection with Botrytis cinerea. Plant Sci. 2019, 283, 266–277. [Google Scholar] [CrossRef]
- Tripathi, D.; Raikhy, G.; Kumar, D. Chemical elicitors of systemic acquired resistance—Salicylic acid and its functional analogs. Curr. Plant Biol. 2019, 17, 48–59. [Google Scholar] [CrossRef]
- Bhujel, A.; Khan, F.; Basak, J.K.; Jaihuni, M.; Sihalath, T.; Moon, B.-E.; Park, J.; Kim, H.-T. Detection of gray mold disease and its severity on strawberry using deep learning networks. J. Plant Dis. Prot. 2022, 129, 579–592. [Google Scholar] [CrossRef]
- Suarez, M.B.; Walsh, K.; Boonham, N.; O’neill, T.; Pearson, S.; Barker, I. Development of real-time PCR (TaqMan®) assays for the detection and quantification of Botrytis cinerea in planta. Plant Physiol. Biochem. 2005, 43, 890–899. [Google Scholar] [CrossRef]
- Petrasch, S.; Knapp, S.J.; van Kan, J.A.L.; Blanco-Ulate, B. Grey mould of strawberry, a devastating disease caused by the ubiquitous necrotrophic fungal pathogen Botrytis cinerea. Mol. Plant Pathol. 2019, 20, 877–892. [Google Scholar] [CrossRef]
- Ellington, A.D.; Szostak, J.W. Selection in vitro of single-stranded DNA molecules that fold into specific ligand-binding structures. Nature 1992, 355, 850–852. [Google Scholar] [CrossRef]
- Grozio, A.; Gonzalez, V.M.; Millo, E.; Sturla, L.; Vigliarolo, T.; Bagnasco, L.; Guida, L.; D’Arrigo, C.; De Flora, A.; Salis, A.; et al. Selection and characterization of single stranded DNA aptamers for the hormone abscisic. Nucleic Acid Ther. 2013, 23, 322–331. [Google Scholar] [CrossRef]
- Rahimizadeh, K.; AlShamaileh, H.; Fratini, M.; Chakravarthy, M.; Stephen, M.; Shigdar, S.; Veedu, R.N. Development of cell-specific aptamers: Recent advances and insight into the selection procedures. Molecules 2017, 22, 2070. [Google Scholar] [CrossRef] [PubMed]
- Ku, T.-H.; Zhang, T.; Luo, H.; Yen, T.M.; Chen, P.-W.; Han, Y.; Lo, Y.-H. Nucleic acid aptamers: An emerging tool for biotechnology and biomedical sensing. Sensors 2015, 15, 16281–16313. [Google Scholar] [CrossRef] [PubMed]
- Byun, J. Recent progress and opportunities for nucleic acid aptamers. Life 2021, 11, 193. [Google Scholar] [CrossRef] [PubMed]
- Chen, C.; Feng, S.; Zhou, M.; Ji, C.; Que, L.; Wang, W. Development of a structure-switching aptamer-based nanosensor for salicylic acid detection. Biosens. Bioelectron. 2019, 140, 111342. [Google Scholar] [CrossRef]
- Manessis, G.; Gelasakis, A.I.; Bossis, I. Point-of-Care Diagnostics for Farm Animal Diseases: From Biosensors to Integrated Lab-on-Chip Devices. Biosensors 2022, 12, 455. [Google Scholar] [CrossRef]
- Kawakatsu, Y.; Okada, R.; Hara, M.; Tsutsui, H.; Yanagisawa, N.; Higashiyama, T.; Arima, A.; Baba, Y.; Kurotani, K.-I.; Notaguchi, M. Microfluidic Device for Simple Diagnosis of Plant Growth Condition by Detecting miRNAs from Filtered Plant Extracts. Plant Phenomics 2024, 6, 0162. [Google Scholar] [CrossRef]
- DNA Folding Form. Available online: https://www.unafold.org/mfold/applications/dna-folding-form.php (accessed on 5 February 2025).
- Saito, S.; Dunne, K.; Evans, K.; Barry, K.; Cadle-Davidson, L.; Wilcox, W. Optimisation of techniques for quantification of Botrytis cinerea in grape berries and receptacles by quantitative polymerase chain reaction. Aust. J. Grape Wine Res. 2013, 19, 68–73. [Google Scholar] [CrossRef]


| Sequence (5’-3’) | Modification 5’ End | Modification 3’ End | |
|---|---|---|---|
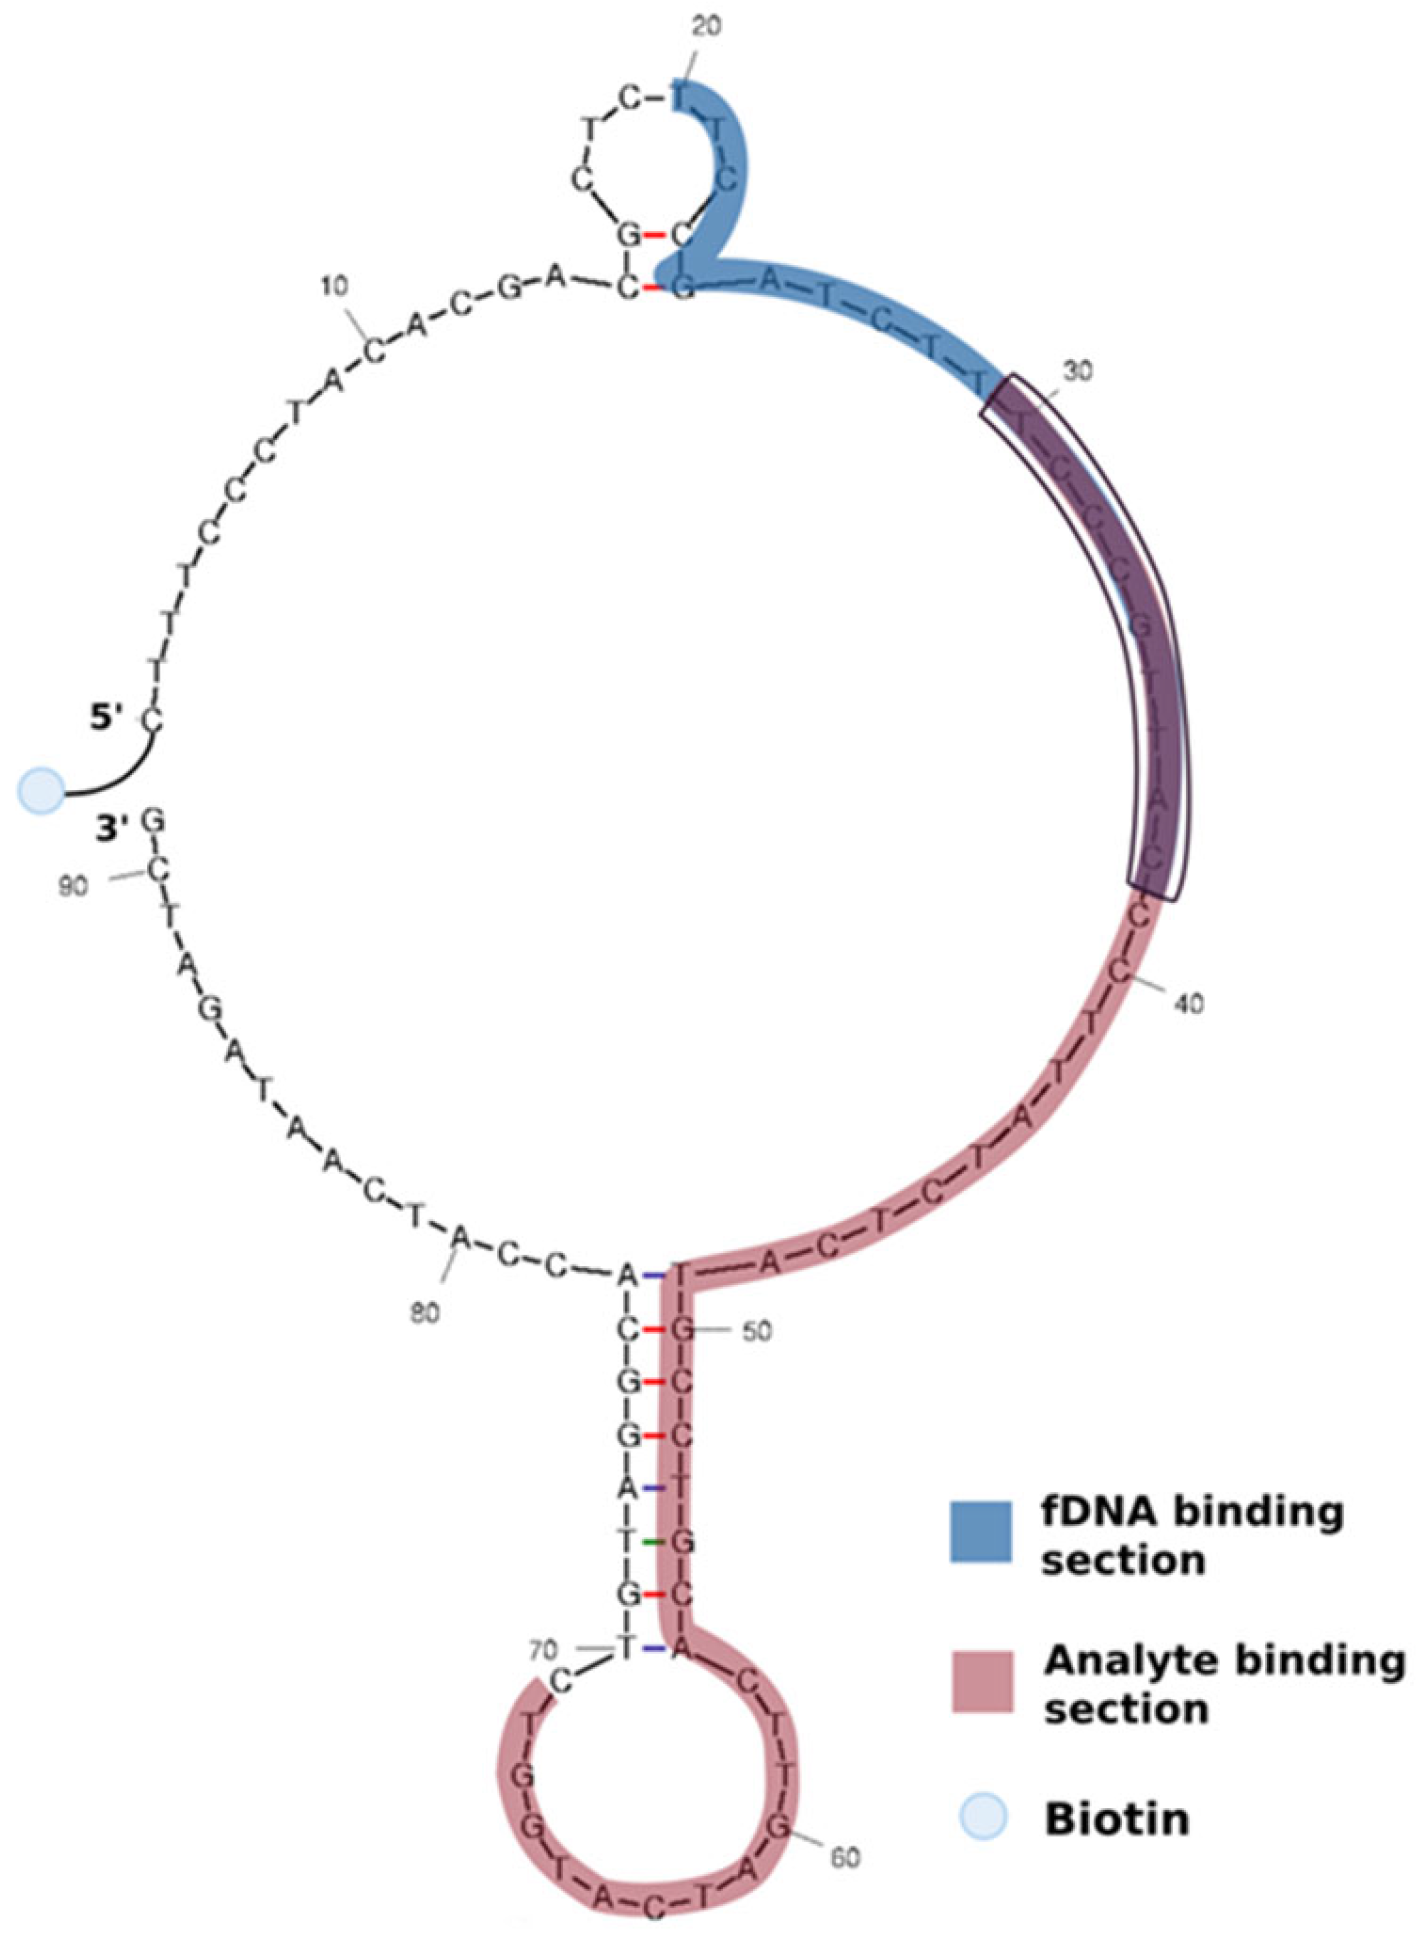
| SA Aptamer | CTTTCCCTACACGACGCTCTTCCGATCTTTCCCGTTACCCTTATCTCATGCCTGCACTTGATCATGGTCTGTAGGCACCATCAATAGATCG | Biotin | None |
| fDNA | CGG GAA AGA TCG GAA GAG | Alexa430 | None |
Disclaimer/Publisher’s Note: The statements, opinions and data contained in all publications are solely those of the individual author(s) and contributor(s) and not of MDPI and/or the editor(s). MDPI and/or the editor(s) disclaim responsibility for any injury to people or property resulting from any ideas, methods, instructions or products referred to in the content. |
© 2025 by the authors. Licensee MDPI, Basel, Switzerland. This article is an open access article distributed under the terms and conditions of the Creative Commons Attribution (CC BY) license (https://creativecommons.org/licenses/by/4.0/).
Share and Cite
Domingues, C.; Rosa, R.R.; Rodrigues, R.G.; Fortes, A.M.; Chu, V.; Conde, J.P. Aptamer-Based Microfluidic Assay for In-Field Detection of Salicylic Acid in Botrytis cinerea-Infected Strawberries. Biosensors 2025, 15, 266. https://doi.org/10.3390/bios15050266
Domingues C, Rosa RR, Rodrigues RG, Fortes AM, Chu V, Conde JP. Aptamer-Based Microfluidic Assay for In-Field Detection of Salicylic Acid in Botrytis cinerea-Infected Strawberries. Biosensors. 2025; 15(5):266. https://doi.org/10.3390/bios15050266
Chicago/Turabian StyleDomingues, Cristiana, Rafaela R. Rosa, Rodolfo G. Rodrigues, Ana Margarida Fortes, Virginia Chu, and João Pedro Conde. 2025. "Aptamer-Based Microfluidic Assay for In-Field Detection of Salicylic Acid in Botrytis cinerea-Infected Strawberries" Biosensors 15, no. 5: 266. https://doi.org/10.3390/bios15050266
APA StyleDomingues, C., Rosa, R. R., Rodrigues, R. G., Fortes, A. M., Chu, V., & Conde, J. P. (2025). Aptamer-Based Microfluidic Assay for In-Field Detection of Salicylic Acid in Botrytis cinerea-Infected Strawberries. Biosensors, 15(5), 266. https://doi.org/10.3390/bios15050266