Article

Antimicrobial Resistance Surveillance of Pigs and Chickens in the Lao People’s Democratic Republic, 2018–2021

by
Phouth Inthavong
1,
Somphaivanh Chanthavong
2,
Phounsavanh Nammanininh
2,
Phouvong Phommachanh
2,
Watthana Theppangna
1,
Agnes Agunos
3,†,‡,
Jaap A. Wagenaar
4,5,
Bounlom Douangngeun
6 and
Leo Loth
6,*
1
Department of Livestock and Fisheries, Ministry of Agriculture and Forestry, Vientiane 01001, Laos
2
National Animal Health Laboratory, Department of Livestock and Fisheries, Ministry of Agriculture and Forestry, Vientiane 01001, Laos
3
Food and Agriculture Organization of the United Nations, Regional Office for Asia and the Pacific, Bangkok 10200, Thailand
4
Department Biomolecular Health Sciences-Infectious Diseases and Immunology, Faculty of Veterinary Medicine, Utrecht University, 3584 CL Utrecht, The Netherlands
5
WHO—Collaborating Center for Campylobacter and Antimicrobial Resistance from a One Health Perspective, OIE Reference Laboratory for Campylobacteriosis, 3584 CL Utrecht, The Netherlands
6
Food and Agriculture Organization of the United Nations, Country Office for Lao PDR, Vientiane 01001, Laos
*
Author to whom correspondence should be addressed.
Current address: Center for Foodborne, Environmental and Zoonotic Infectious Diseases, Public Health Agency of Canada, Guelph, ON N1H 7M7, Canada.
At the time of study.
Antibiotics 2022, 11(2), 177; https://doi.org/10.3390/antibiotics11020177
Submission received: 10 December 2021 / Revised: 17 January 2022 / Accepted: 27 January 2022 / Published: 29 January 2022
(This article belongs to the Special Issue Antimicrobial Use and Antimicrobial Resistance in Food Animals)

Abstract

:
The use of antimicrobials in the livestock sector has been identified as a driver for the emergence of antimicrobial resistance (AMR), and AMR has become a growing public health and economic threat in the Lao PDR. We conducted surveillance for AMR in five provinces of the Lao PDR, in order to determine the antimicrobial susceptibility of Escherichia coli and Salmonella spp. isolated from caecal samples from slaughtered pigs at slaughterhouses and from slaughtered chickens at markets during two different time periods: 2018/2019 and 2020/2021. Antimicrobial susceptibility was determined using a panel of 14 antimicrobials using the broth microdilution technique. E. coli and Salmonella from chickens (62% and 33%, respectively) and pigs (88% and 81%, respectively) exhibited resistance to ≥3 classes of antimicrobials. Of important public health concern was the detection of Salmonella resistant to cefotaxime/ceftazidime, ciprofloxacin, and colistin, deemed as critically important antimicrobials in human medicine. This study aimed to evaluate a national sampling strategy at slaughterhouses and wet markets, and to pilot the laboratory methodologies for bacterial recovery and AMR testing. Experiences from this study will inform capacity development for a national AMR surveillance program, and these early data could serve as reference points for monitoring the impact of the Lao PDR’s national action plan to contain AMR.

1. Introduction

Large quantities of a variety of classes of antimicrobials are used in the livestock industry in Southeast Asia [1,2]. Unregulated and irresponsible use of antimicrobials in the animal production sector can result in antimicrobial-resistant (AMR) bacteria [3,4]. Food safety and public health threats arising from the use of antimicrobials in food animals—including antimicrobial-resistant bacteria/genetic elements and antimicrobial residues—can spread through direct contact with animals, animal excrement, wastewater, vegetables, and animal byproducts [5,6,7]. Inappropriate use of antimicrobials in people contributes to the issue of AMR, which is concerning because infections with antimicrobial-resistant organisms may lead to therapeutic failure and, thus, impact the burden of illness in a country. In animal production settings, this could potentially decrease production performance parameters, leading to substantial economic losses [8].
In the Southeast Asia region, in countries bordering the Lao PDR (Figure 1), indicator and foodborne bacterial organisms revealed high to extremely high levels of resistance to antimicrobials, suggesting that antimicrobials commonly used for the therapy of bacterial diseases may no longer be efficacious. For instance, Escherichia coli isolated from pig and chicken farms in Vietnam [9] and Cambodia [3] showed up to 97% resistance to ampicillin, 73.3% resistance to ciprofloxacin, 42.2% resistance to gentamicin, and 24.4% resistance to colistin. High AMR prevalence was measured in Salmonella enterica isolated from broiler chickens, pigs, and meat products in Thailand and Cambodia [10]. Resistance to several antimicrobials was also detected in Salmonella spp. [11] and E. coli [12] in Myanmar. Studies in border provinces in the Lao PDR reported colistin resistance in E. coli from pigs [13] and E. coli from humans and pigs [7]. As all of these countries extensively trade animals, animal products, and antimicrobials, AMR surveillance in food animals and their products in districts/provinces of the Lao PDR contiguous to these bordering countries, and where these products are distributed, are primary considerations for designing a national AMR surveillance program.
In 2019, the National Strategic Plan on Antimicrobial Resistance (NSP-AMR) in the Lao PDR, 2019–2023, was developed by the Ministry of Health and the Ministry of Agriculture and Forestry, with technical and financial support from the [14] World Health Organization (WHO), the Food and Agriculture Organization of the United Nations (FAO), and the World Organization for Animal Health (OIE) [15]. The NSP-AMR aligns with the Global Action Plan [16], the FAO Action Plan on AMR 2021–2025 [17] and its predecessor [18], and the OIE AMR strategy [19]. This strategic plan on AMR describes the vision to reduce AMR-related human and animal morbidity, mortality, and economic impact. The strategic plan encourages a multisector One Health approach to tackling AMR, involving local and national stakeholders, and demonstrates the commitment of the Lao PDR in the global fight against AMR.
One of the strategic objectives of the NSP-AMR is to strengthen the AMR surveillance system. As previously described, there are very few specific national studies on AMR in livestock in the Lao PDR. These data gaps hampered our assessment of the “state of science” of AMR in the country. Thus, in collaboration with the FAO, the Department of Livestock of Fisheries of the Ministry of Agriculture and Fisheries conducted a pilot surveillance project in chickens and pigs to inform the development of sampling and laboratory methodologies for an ongoing national AMR surveillance program, and to generate baseline bacterial recovery and AMR data that could be used by the country as reference points for monitoring the progress of the NSP-AMR. This surveillance was designed to determine the levels of resistance to antimicrobials in E. coli—an indicator organism broadly used in AMR surveillance—and Salmonella spp., an important foodborne zoonotic pathogen in the Lao PDR [20]. This pilot project sampled chickens and pigs—the two animal species deemed as essential to food security in the Lao PDR.

2. Materials and Methods

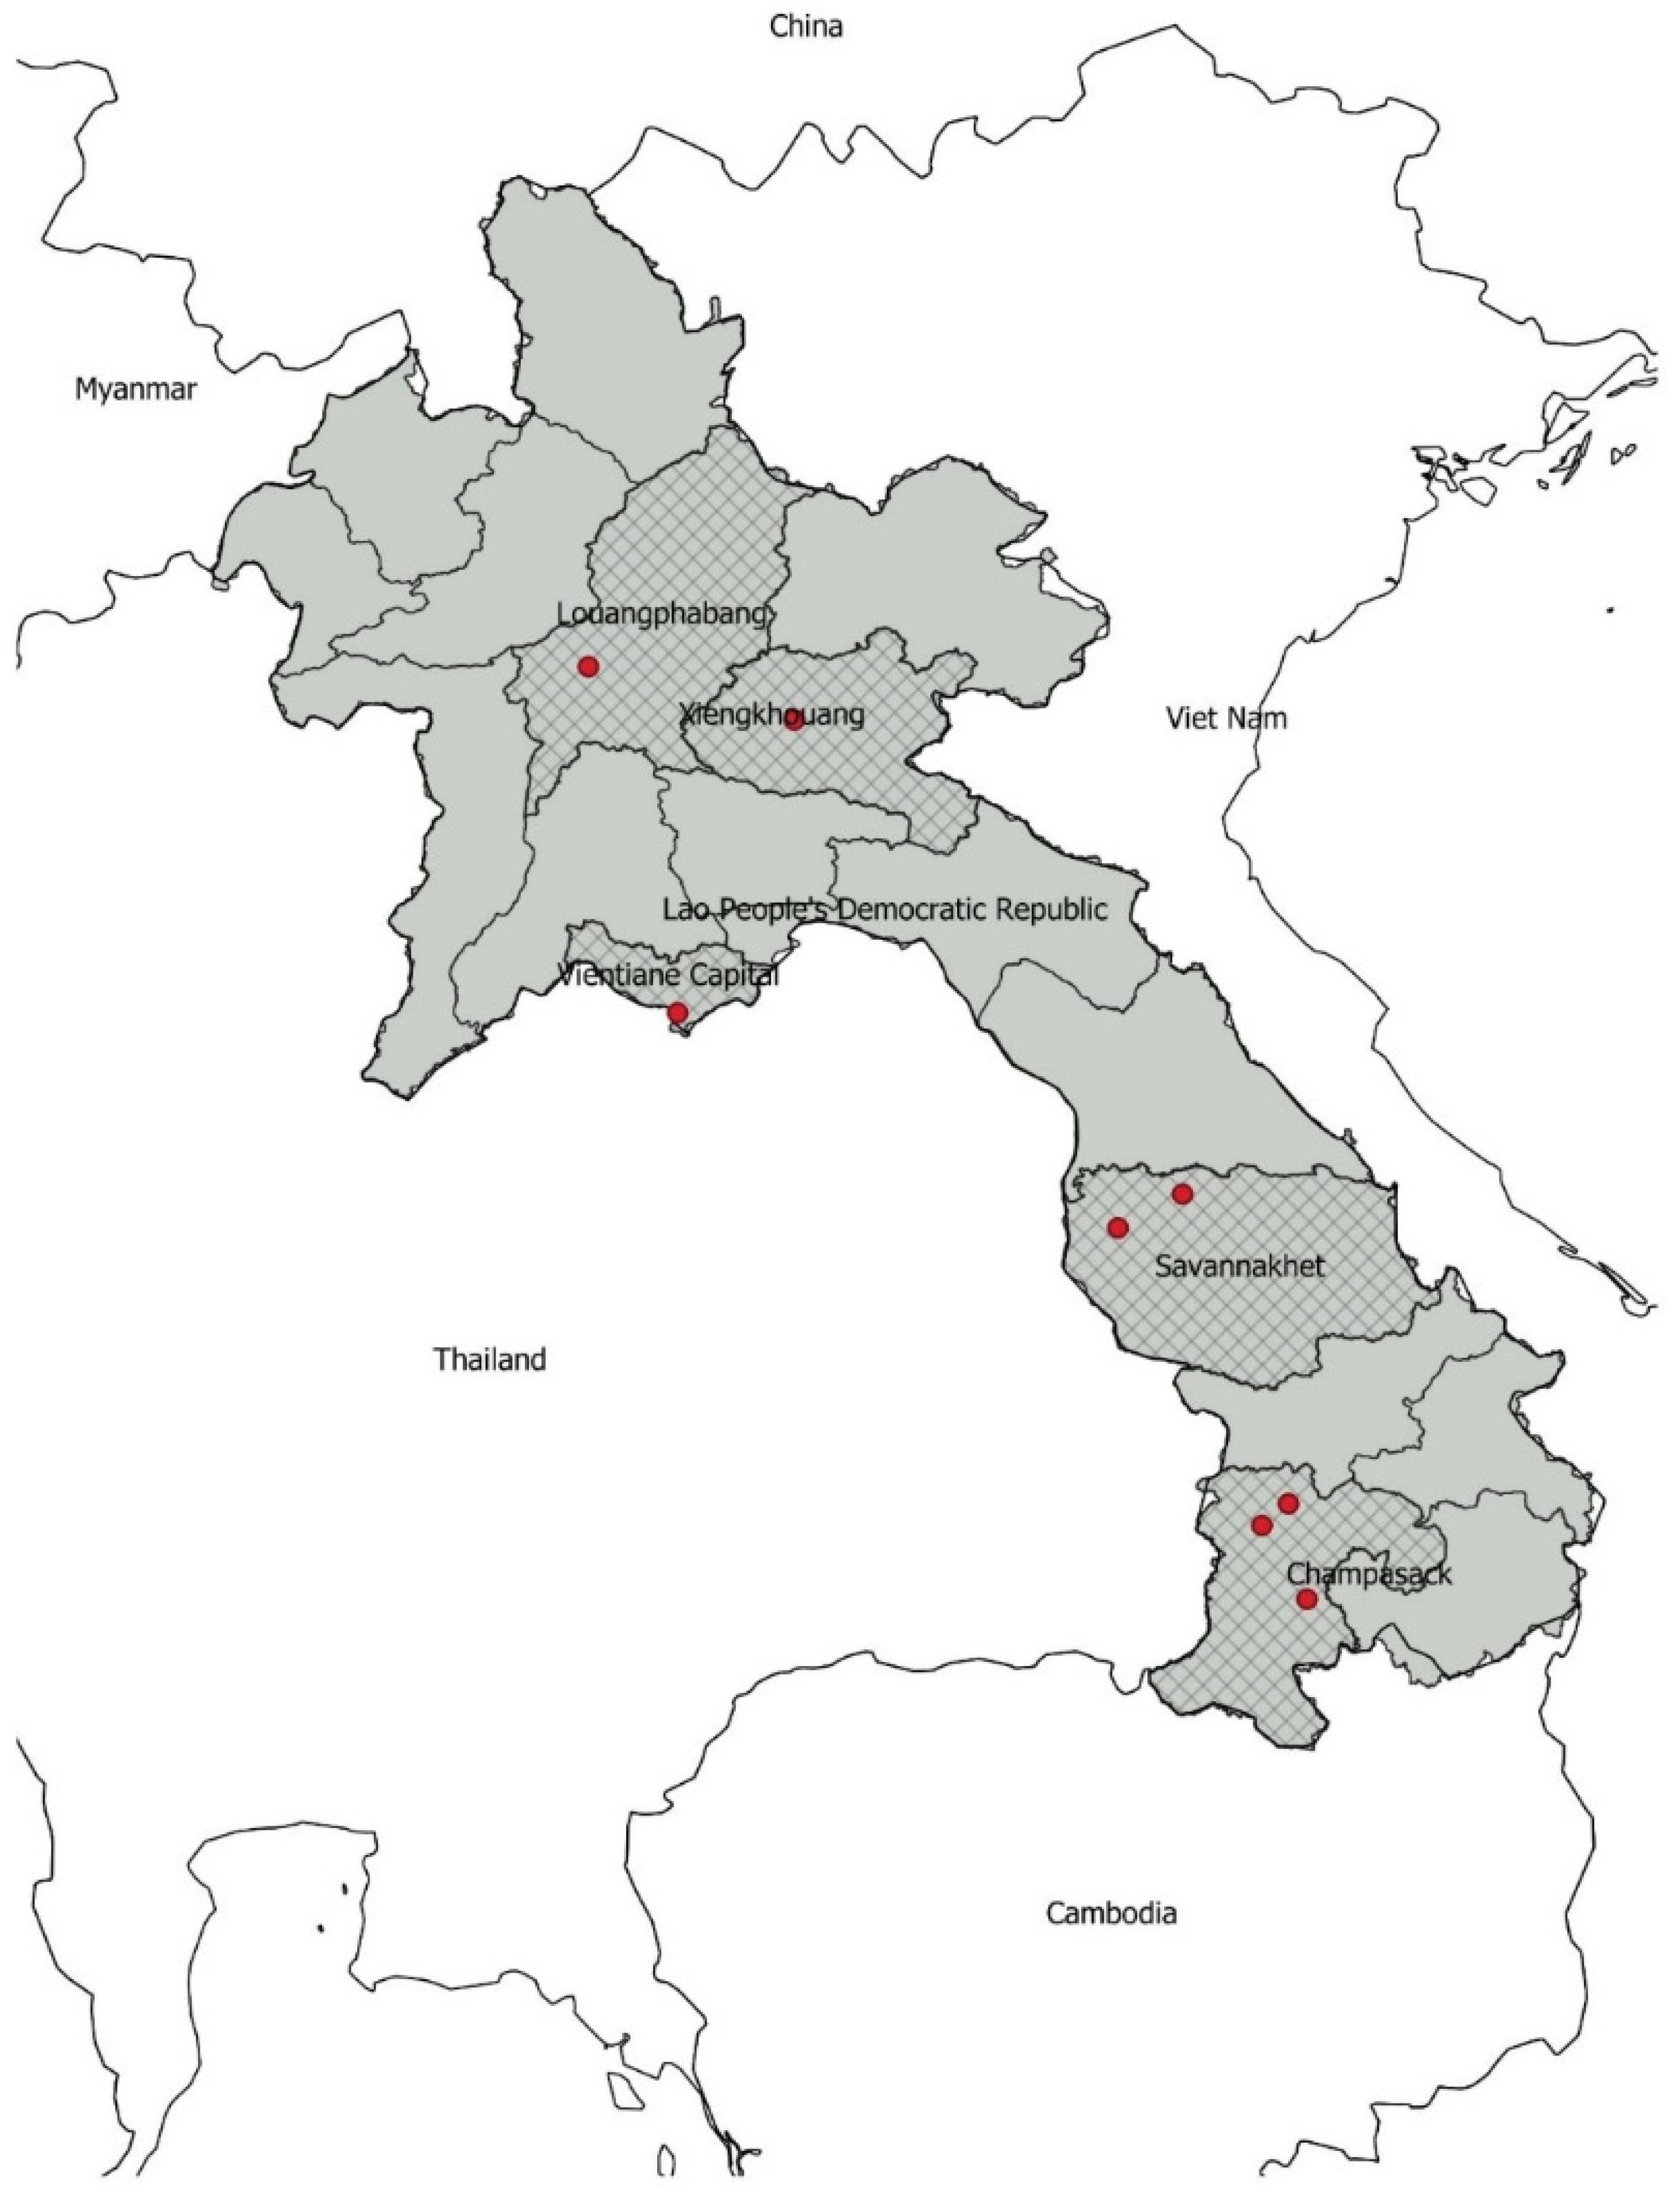
2.1. Sampling Design

The surveillance was conducted in eight districts in five provinces in the Lao PDR (Figure 1). The target population was animals closest to the consumers, such as pigs at slaughter points and chickens sold at wet markets. The surveillance was conducted in pigs with a first sampling in 2018 and 2019 in three provinces: Vientiane Capital, Savannakhet, and Champasak. The second round of sampling in pigs was conducted in 2020 and 2021, in two additional provinces: Luang Prabang and Xiengkhouang. In poultry, the sampling was performed in 2020 and 2021 in all five mentioned provinces (Vientiane Capital, Savannakhet, Champasak, Luang Prabang, and Xiengkhouang). Three types of poultry were sampled, depending on their availability in the different provinces (native breeds, commercial broilers, and layers).

2.2. Sample Collection

With the use of sterilized dissecting tools and packaging materials (labelled per sample), provincial laboratory staff aseptically collected caecal samples of slaughtered healthy pigs in the slaughterhouse and caecal samples of slaughtered healthy poultry at the slaughter points at live bird markets. In chickens, the caecum was collected by placing a ligature where the small and large intestine join and separated by scissors. In pigs, caecal content was aseptically collected by disinfecting the caecal wall, opening the intestinal wall (incision using sterile scissors as above), and collecting caecal contents directly in a sterile sampling cup. Per animal sampled, the caeca/caecal contents were placed in a sterile plastic bag and stored at 4 °C. For both sample collection rounds 1 and 2, every week, an average of 10 caecal samples were collected from pigs, broilers, layers, and native chickens in each province. Provincial laboratory staff were asked to ensure that samples were epidemiologically independent (not from animals from the same farms/flocks/herds). For the total sample size, the European Food Safety Authority’s (EFSA) target sample size of 170 isolates tested for each species [21] was used. The total sample size of 350 for each species collected each round and for each province was assumed to yield at least 170 Salmonella spp. isolates if the prevalence of Salmonella spp. was 50% in pigs and chickens [22].

2.3. Sample Processing and Bacterial Recovery

The National Animal Health Laboratory (NAHL) in Vientiane, which is an assigned laboratory for AMR surveillance, was assessed for technical capacity and biological material management before conducting the first round of the surveillance using the FAO Assessment Tool for Laboratory and AMR Surveillance Systems (ATLASS) in April 2017 [23]. All laboratory tests were performed at the NAHL based on protocols, following the FAO’s regional antimicrobial resistance surveillance and monitoring guidelines [24]. After field sample collection, the caecal samples from pigs and chickens were submitted to the NAHL for processing and the recovery of Salmonella spp. and E. coli. In brief, caeca were opened aseptically, and 25 g of caecal content was enriched in 250 mL of buffered peptone water and kept in the incubator at 35–39 °C for 18–24 h. Detection and identification of Salmonella spp. and E. coli were conducted as described in the FAO protocol [24]. All E. coli or Salmonella spp. isolates were stored at the laboratory and preserved in appropriate conditions before conducting the antimicrobial susceptibility testing. Isolates to be tested and quality control strains (E. coli ATCC 25922) were revived by using a nutrient agar medium. Salmonella spp. isolates were not further characterized (no serogrouping and no serotyping) for this study.

2.4. Antimicrobial Susceptibility Testing (AST)

The susceptibility of E. coli and Salmonella spp. isolates was determined using the commercial SensititreTM Minimum Inhibitory Concentration (MIC) EUVSEC plates (Thermo Fisher Scientific, Waltham, MA, USA) [25]. The EUVSEC comprised 14 antimicrobials belonging to 8 antimicrobial classes that have significance to public health, including ampicillin, azithromycin, cefotaxime, ceftazidime, chloramphenicol, ciprofloxacin, colistin, gentamicin, meropenem, nalidixic acid, sulfamethoxazole, tetracycline, tigecycline, and trimethoprim. The SensititreTM OptiRead Automated Fluorometric Plate-Reading System (Thermo Fisher Scientific) and SWIN software (Thermo Fisher Scientific) were used for reading the results [25]. Additional quality control test recommendations by the manufacturer [25] and the FAO’s regional recommendations [22] were followed. E. coli and Salmonella spp. isolates were classified as resistant using the European Committee on Antimicrobial Susceptibility Testing (www.EUCAST.org, accessed 24 June 2021) clinical breakpoints (CBPs) for the following antimicrobials: ampicillin, cefotaxime, ceftazidime, chloramphenicol, ciprofloxacin, colistin, gentamicin, meropenem, tigecycline, and trimethoprim. Where no EUCAST breakpoints were available, in the interim, the Clinical Laboratory Standard Institute (CLSI) [26] breakpoints were used, as with other AMR surveillance systems [27,28] (i.e., for azithromycin, nalidixic acid, sulfamethoxazole, and tetracycline; please refer to the Supplementary Materials, Table S1, for the CBPs used for these antimicrobials).

2.5. Data Entry and Storage

Sample information and basic demographics (e.g., geographical location, production type) were entered in Microsoft Excel (Microsoft Office Professional Plus 2016, Microsoft, Redmond, WA, USA) spreadsheets and linked with the MIC data generated by the SWIN software. The animal information (i.e., slaughterhouse and live bird market sources) was assigned with unique codes, and no personal identifiers of the farmer(s) or slaughterhouse operator(s) were collected.

2.6. Data Analysis and Interpretation

2.6.1. Validation and Data Preparation

Prior to analysis, data were validated and checked for errors (e.g., duplicates, data entry errors, MIC values/ranges, and missing information). Analyses were conducted using SAS Version 9.4 (SAS, Cary, NC, USA), Stata/SE V16.1 (StataCorp, College Station, TX, USA) and Microsoft Excel (Office Professional 2016, Microsoft).

2.6.2. Descriptive Statistics of MIC and Binary Resistance Information

For each animal species–antimicrobial combination, raw MIC data were tabulated in frequency tables and plotted in Microsoft Excel graphs for visualization. Descriptive statistics were obtained using Stata/SE V16.1 (e.g., percentiles, range), and the median values were marked within the Excel MIC distribution plots for each antimicrobial. For the analysis of the mean resistance and 95% confidence intervals (95% CI) for each antimicrobial, the MIC data were dichotomized into non-resistant or resistant using the EUCAST (or CLSI for the 4 antimicrobials) CBPs described in the Supplementary Materials, Table S1. Throughout this paper, the levels of resistance are described following those of the EFSA, as follows: “rare”: <0.1%, “very low”: 0.1–1.0%; “low”: >1–10.0%; “moderate”: >10.0–20.0%; “high”: >20.0–50.0%; “very high”: >50.0–70.0%; “extremely high”: >70.0% [29].
Additional AMR outcomes such as no resistance and multiclass resistance (resistances to 1–8 classes) were determined, and the distribution of isolates was compared between species. For the purposes of this paper, no resistance refers to isolates that showed susceptibility to the 14 antimicrobials included in the EUVSEC panel, while ≥3 multiclass-resistant isolates refers to those isolates that exhibited resistance to antimicrobials belonging to at least 3 antimicrobial classes [30]. Resistance phenotypes (class) in chickens and pigs were summarized.

2.6.3. Comparison between Chickens and Pigs, and Subanalysis of Chicken Types and Sampling Rounds in Pigs

Differences in resistance outcomes between chickens and pigs were assessed using logistic regression analysis (LOGISTIC procedure in Stata/SE V16.1). For each antimicrobial and other AMR outcomes (no resistance and multiclass resistances), models were built using the binary data (yes/no) as the outcome variable and the species as the categorical independent variable, and adjusted for clustering at the province level. The same modelling approach was used for evaluating the differences in resistance between chicken breeds/production types (independent categorical variable: layer, broiler, native chickens) and differences in resistance between sampling rounds/geographical locations in pigs. Effect estimates (odds ratios (OR), 95% CIs, and p-values) were noted, and a p-value of 0.05 was considered significant. An OR > 1 or <1 indicates that the probability of resistance increases (greater) or decreases (lower), respectively, between species, between chicken breeds/production profiles, and between pig sample collection rounds/geographical locations.

3. Results

3.1. Bacterial Isolation

Between 2018 and 2021, a total of 3638 samples from five provinces were tested (Table 1). The overall E. coli isolation rate was 87% (3150/3638), while the rate was 58% (2098/3638) for Salmonella. There was significantly (p < 0.001) more E. coli isolated from chickens (90%, 2236/2479) than from pigs (79%, 914/1159), while the Salmonella isolation rate was significantly higher in pigs (61%, 711/1159) compared to chickens (56%, 1387/2479) (p = 0.002). The isolation rates for E. coli (771/825, 744/829, 721/825; p = 0.086) were not significantly different when comparing the three poultry breeds (native, broiler, and layer). The isolation rates for Salmonella (36%, 301/825, 62%, 511/829, 70%, 575/825; p < 0.001) were significantly lower in native birds, compared to broiler and layer chickens. The E. coli and Salmonella tested for AMR were systematically selected (for E. coli, approximately every other isolate in the archive; for Salmonella, 66% (two out of three) of the isolates in the archive).

3.2. Antimicrobial Resistance in Escherichia coli Isolates

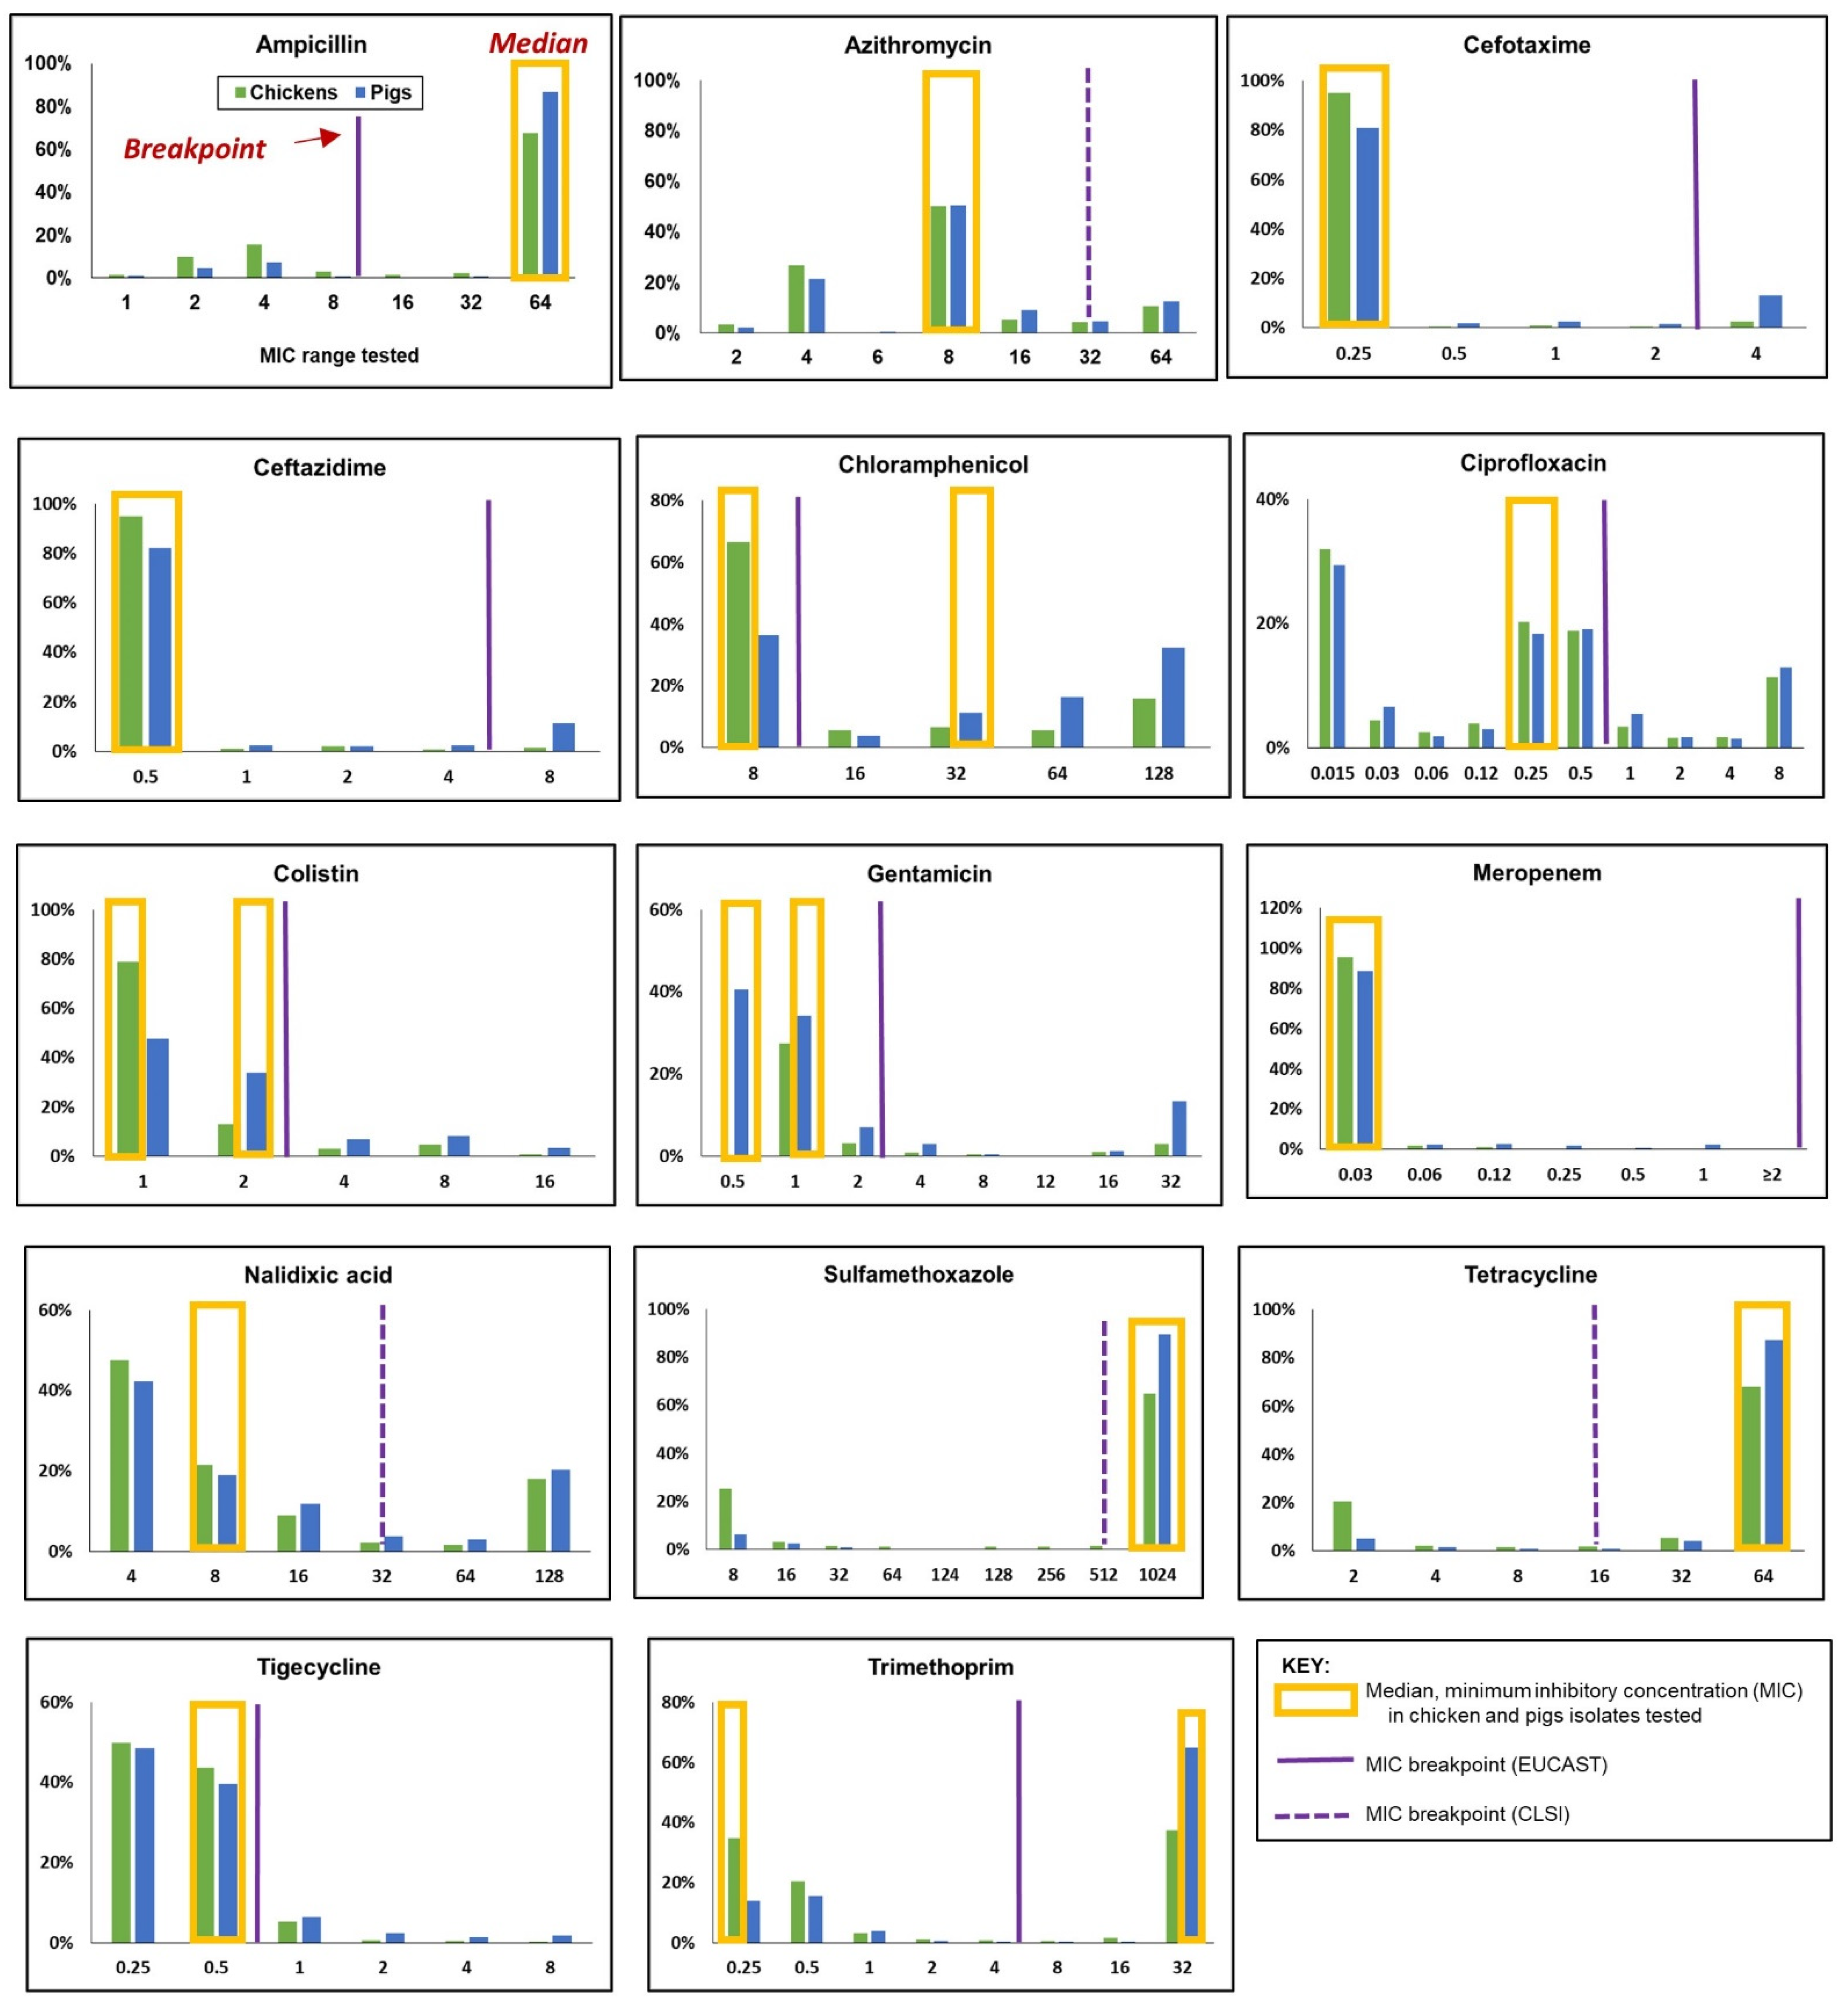
3.2.1. Minimum Inhibitory Concentration (MIC) Distribution

Figure 2 summarizes the MIC distribution of the 14 antimicrobials included in the EUVSEC panel, along with the relative positions of the CBPs against the median MIC values for chickens and pigs. The distribution of MICs varied depending on the animal species and the antimicrobial. Median MICs in 10 antimicrobials were comparable in chickens and pigs. For colistin and gentamicin, the median MICs were higher in pigs compared to chickens. The median MICs for the following antimicrobials were lower than the EUCAST CBPs: cefotaxime, ceftazidime, ciprofloxacin, colistin, gentamicin, meropenem, and tigecycline. In four antimicrobials, the CLSI CBPs were used in the absence of EUCAST CBPs to characterize the resistance levels for chickens and pigs in this study. Specifically, the median MICs detected for sulfamethoxazole and tetracycline were one dilution (1024 µg/mL) and two dilutions (64 µg/mL) above the CBPs, respectively. On the other hand, the median MICs recorded for azithromycin and nalidixic acid were two dilutions (8 µg/mL) below the CLSI CBPs. The median MICs for antimicrobials categorized as highest priority-critically important antimicrobials (HPCIAs) by the WHO [31] (e.g., cefotaxime (0.25 µg/mL), ceftazidime (0.5 µg/mL) and meropenem (0.01 µg/mL)) corresponded with the lowest dilution ranges for the antimicrobials.

3.2.2. Resistance to Single (Homologous) Antimicrobials

Figure 3 shows the resistance in E. coli isolates from poultry (combined data from layers, broilers, and native chickens) and pigs (combined rounds 1 and 2). Variations in the percentage of resistance were observed between pigs and chicken isolates, depending on the antimicrobial. Noteworthy was the significantly higher resistance to the WHO’s HPCIAs in pigs compared to chickens, including cefotaxime (pigs: 15% vs. chickens: 3%, OR 5.15, p < 0.0001), ceftazidime (pigs: 11% vs. chickens: 1%, OR 9.27, p < 0.0001). And colistin (pigs: 18% vs. chickens: 8%, OR 2.6, p < 0.0001). Relatively moderate resistance to ciprofloxacin was detected, but the difference between the species was not statistically significant (pigs: 21% vs. chickens: 18%). Very low-level resistance to meropenem (<1%) was detected in pig isolates, but not in chickens. For the remaining antimicrobials, moderate-to-high resistances were detected that were significantly higher in pigs compared to chickens: ampicillin (extremely high), chloramphenicol (very high), gentamicin (moderate), sulfamethoxazole (extremely high), tetracycline (extremely high), and trimethoprim (very high).

Comparison between Different Chicken Production Types

Variations in the percentages of resistance to antimicrobials in the different poultry types (broilers, layers, and native chickens) were observed (Supplementary Materials, Figure S1). In most cases, broilers had the highest percentage of resistance, but these levels were not statistically significant compared to layers and native chickens. Noteworthy was the lower resistance to the WHO’s HPCIAs, such as ciprofloxacin and colistin, in native chickens.

Comparison between Two Time Periods/Geographical Regions of the Lao PDR in Pig Isolates

Resistances to the WHO’s HPCIAs, such as ciprofloxacin and colistin, were not statistically significant between the two rounds of sample collection, but lower resistance during round 2 was detected for the following HPCIAs: cefotaxime (2nd round: 10% vs. 1st round: 16%, OR 0.23, p < 0.0001), ceftazidime (2nd round: 7% vs. 1st round: 13%, OR 0.15, p < 0.0001) (Supplementary Materials, Figure S2). Additionally, lower resistance during round 2 was detected for other antimicrobials, including gentamicin (2nd round: 13% vs. 1st round: 20%, p < 0.0001) and sulfamethoxazole (2nd round: 92% vs. 1st round: 92%, OR 0.19, p < 0.0001). Moderate to extremely high resistances to other antimicrobials in the panel were detected (Supplementary Materials, Figure S2), which were significantly higher during the 2nd period compared to the 1st period: ampicillin (extremely high), chloramphenicol (very high), tetracycline (extremely high), and tigecycline (moderate).

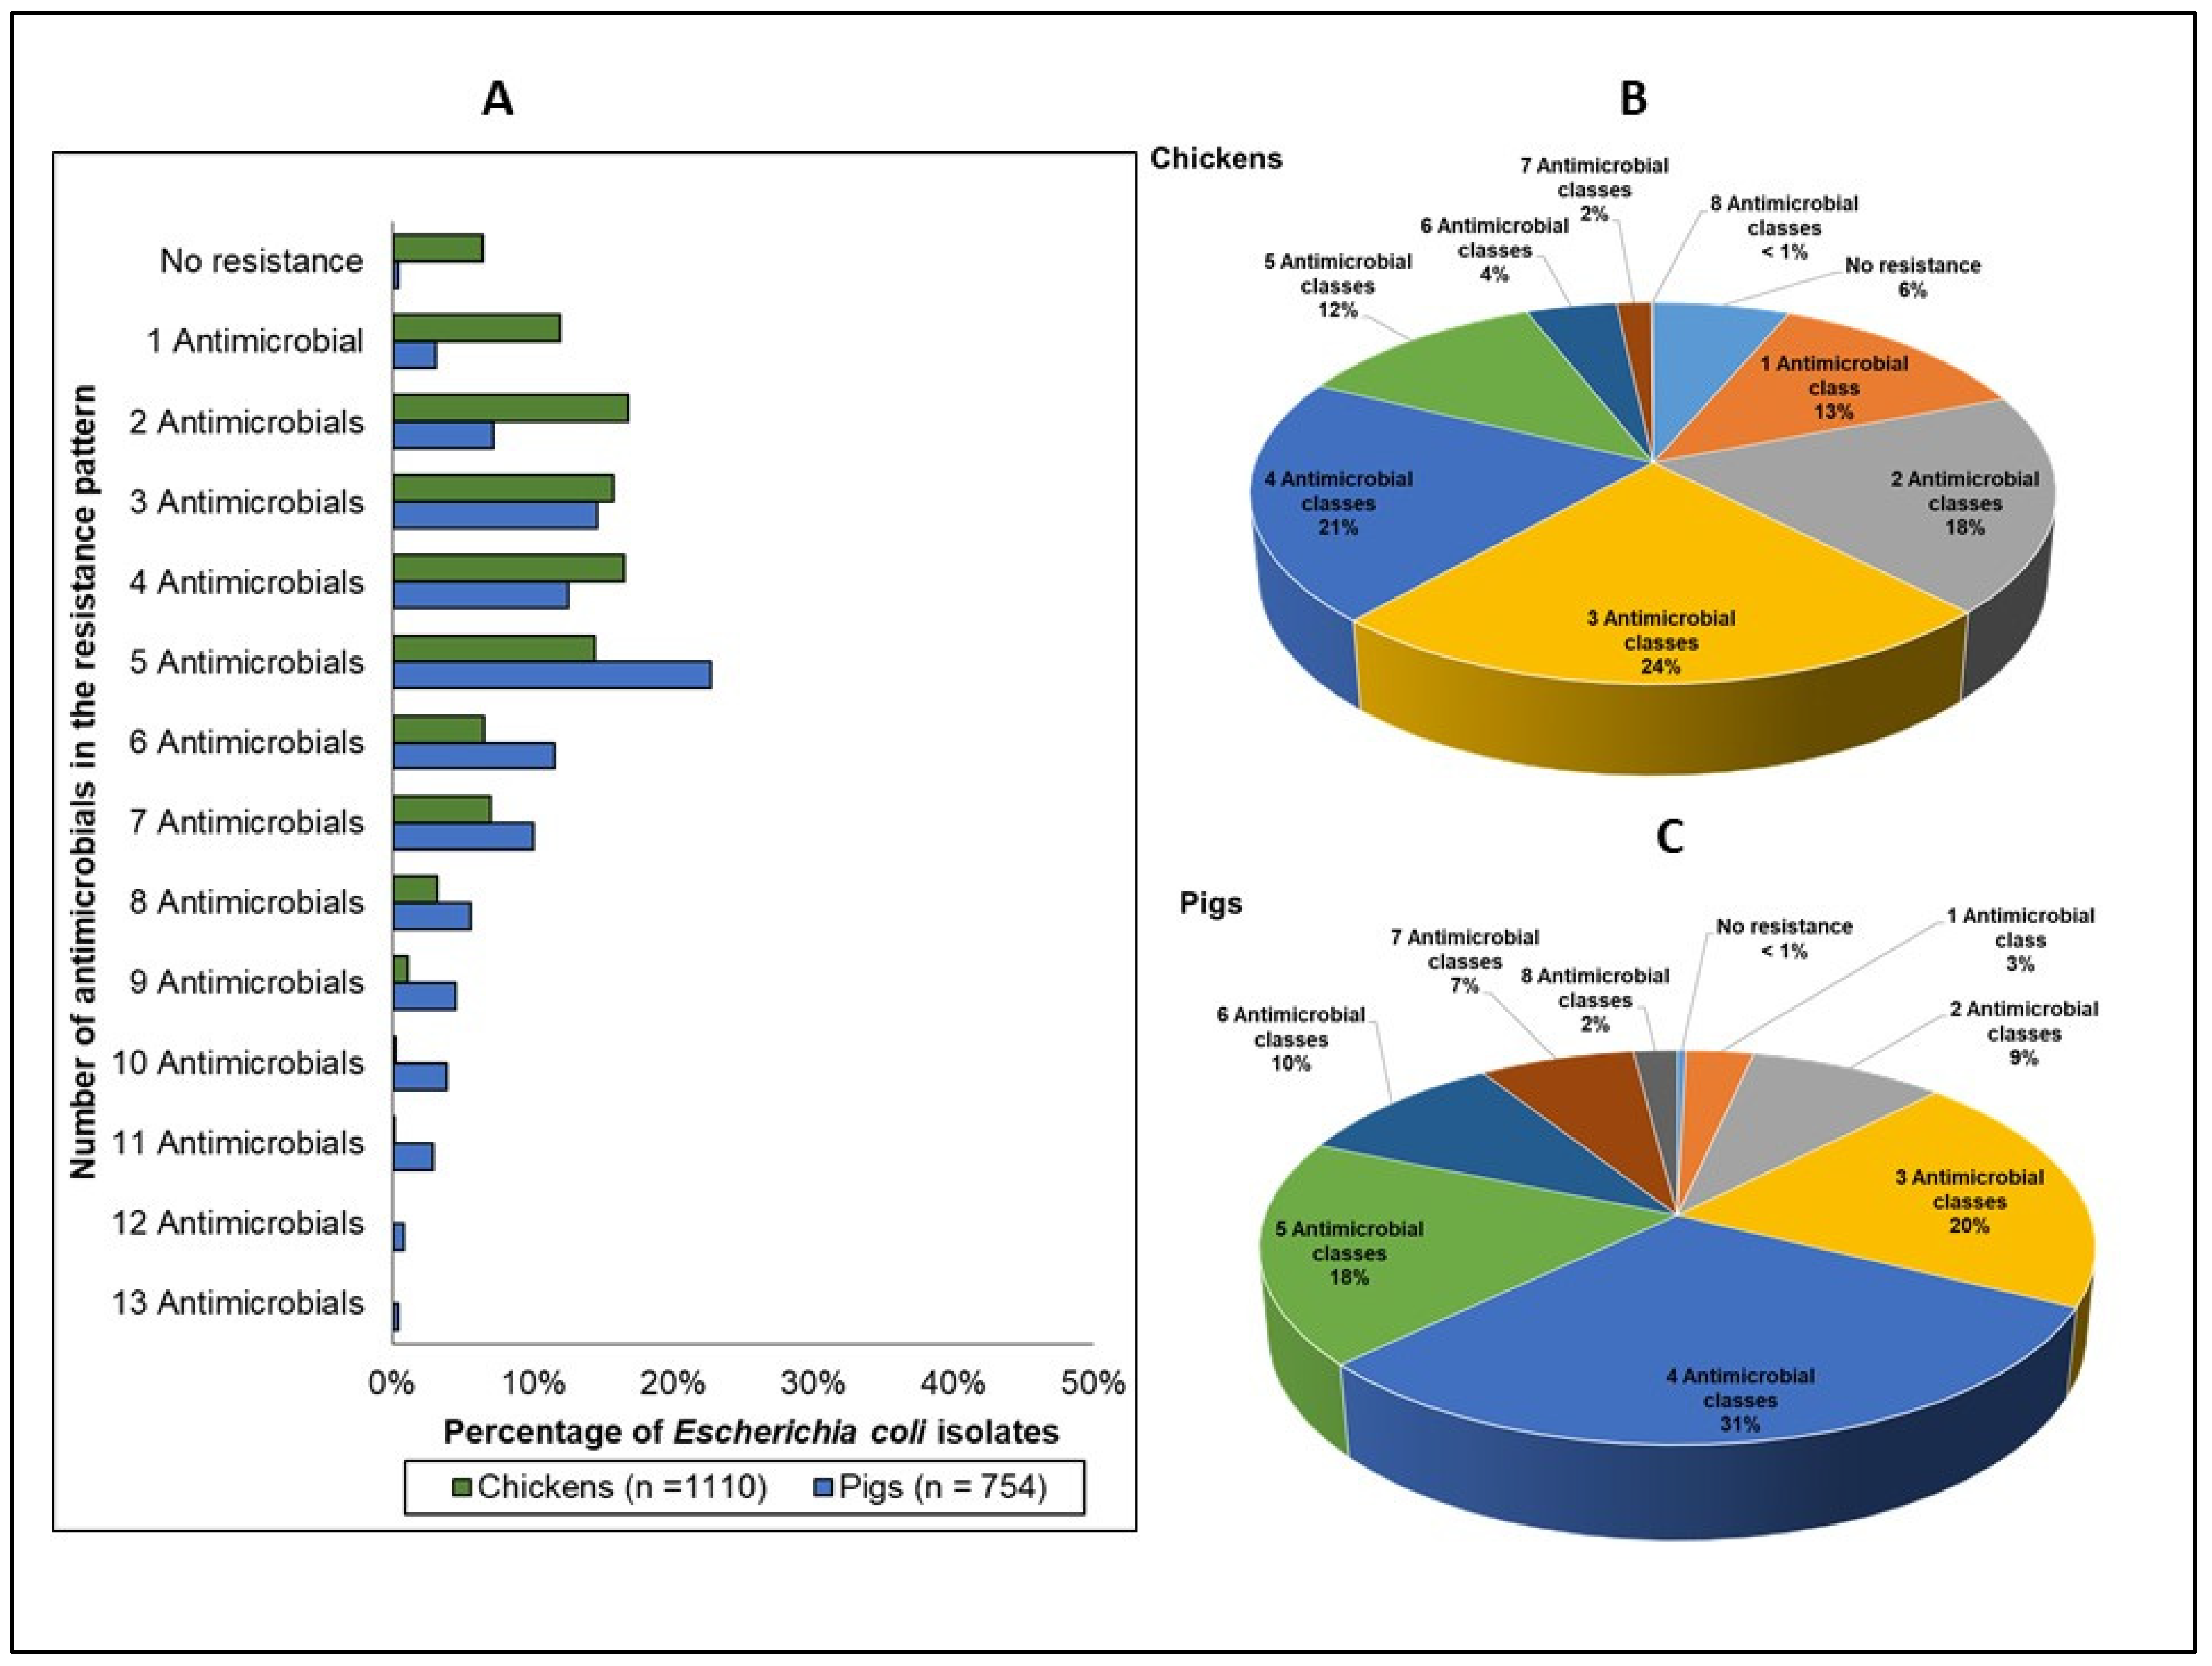
3.2.3. Multidrug and Multiclass Resistance

The distribution of E. coli resistance phenotypes is shown in Figure 4A. Isolates that exhibited no resistance to any of the 14 antimicrobials in the EUVSEC panel were less common in pigs (referent) (<1%) compared to chickens (6%) (OR 0.06, p = 0.003). The maximum number of antimicrobials to which an isolate was resistant was 11 antimicrobials (2 isolates) in chickens and 13 antimicrobials (3 isolates) in pigs.
When individual antimicrobial resistances were aggregated by antimicrobial class (Figure 4B,C), the relative distribution of the isolates varied between chickens and pigs (Table 2). Total isolates that exhibited resistance to antimicrobials belonging to three or more classes of antimicrobials (≥3 multiclass-resistant) significantly differed between the two species (pigs: 88% vs. chickens: 62%, OR 4.29, p = 0.001). There were 77 unique multiclass resistance phenotypes identified in chickens (Supplementary Materials, Table S2A), and the top two most frequently occurring phenotypes were a resistance pattern comprising beta-lactams, folate pathway inhibitors, and tetracyclines (155 isolates, 15%), followed by a resistance pattern containing the same three antimicrobial classes above, plus phenicols (131 isolates, 13%). In pigs, there were 67 different multiclass resistance phenotypes (Supplementary Materials, Table S2B), and the most frequently occurring phenotypes were a resistance pattern comprising beta-lactam antimicrobials, folate pathway inhibitors, tetracyclines, and phenicols (174 isolates, 23%), followed by a resistance pattern comprising beta lactams, folate pathway inhibitors, and tetracyclines (124 isolates, 17%).

3.3. Antimicrobial Resistance in Salmonella Isolates

3.3.1. MIC Distribution

Figure 5 summarizes the MIC distribution of the 14 antimicrobials included in the EUVSEC panel and the relative positions of the CBPs against the median MIC values for chickens and pigs. As with E. coli, the distribution of MICs varied depending on the species and the antimicrobial. Median MICs in eight antimicrobials were comparable in chickens and pigs. The median MICs for the following antimicrobials were lower than the EUCAST CBPs: cefotaxime, ceftazidime, chloramphenicol, colistin, gentamicin, meropenem, tigecycline, and trimethoprim—in both chicken and pig isolates. For ciprofloxacin, median MICs in chickens and pigs were three dilutions above the CBPs. As with E. coli, CLSI CBPs were used in the absence of EUCAST CBPs to characterize the resistance in this study. Specifically, median MICs were below the CLSI CBPs (e.g., azithromycin, nalidixic acid) in both species, but substantially varied for sulfamethoxazole (chickens: 32 µg/mL vs. pigs: 1024) and tetracycline (chickens: 2 µg/mL vs. pigs: 64 µg/mL). As with E. coli, the median MICs for the HPCIAs cefotaxime, ceftazidime, and meropenem corresponded with the lowest dilution ranges for these antimicrobials.

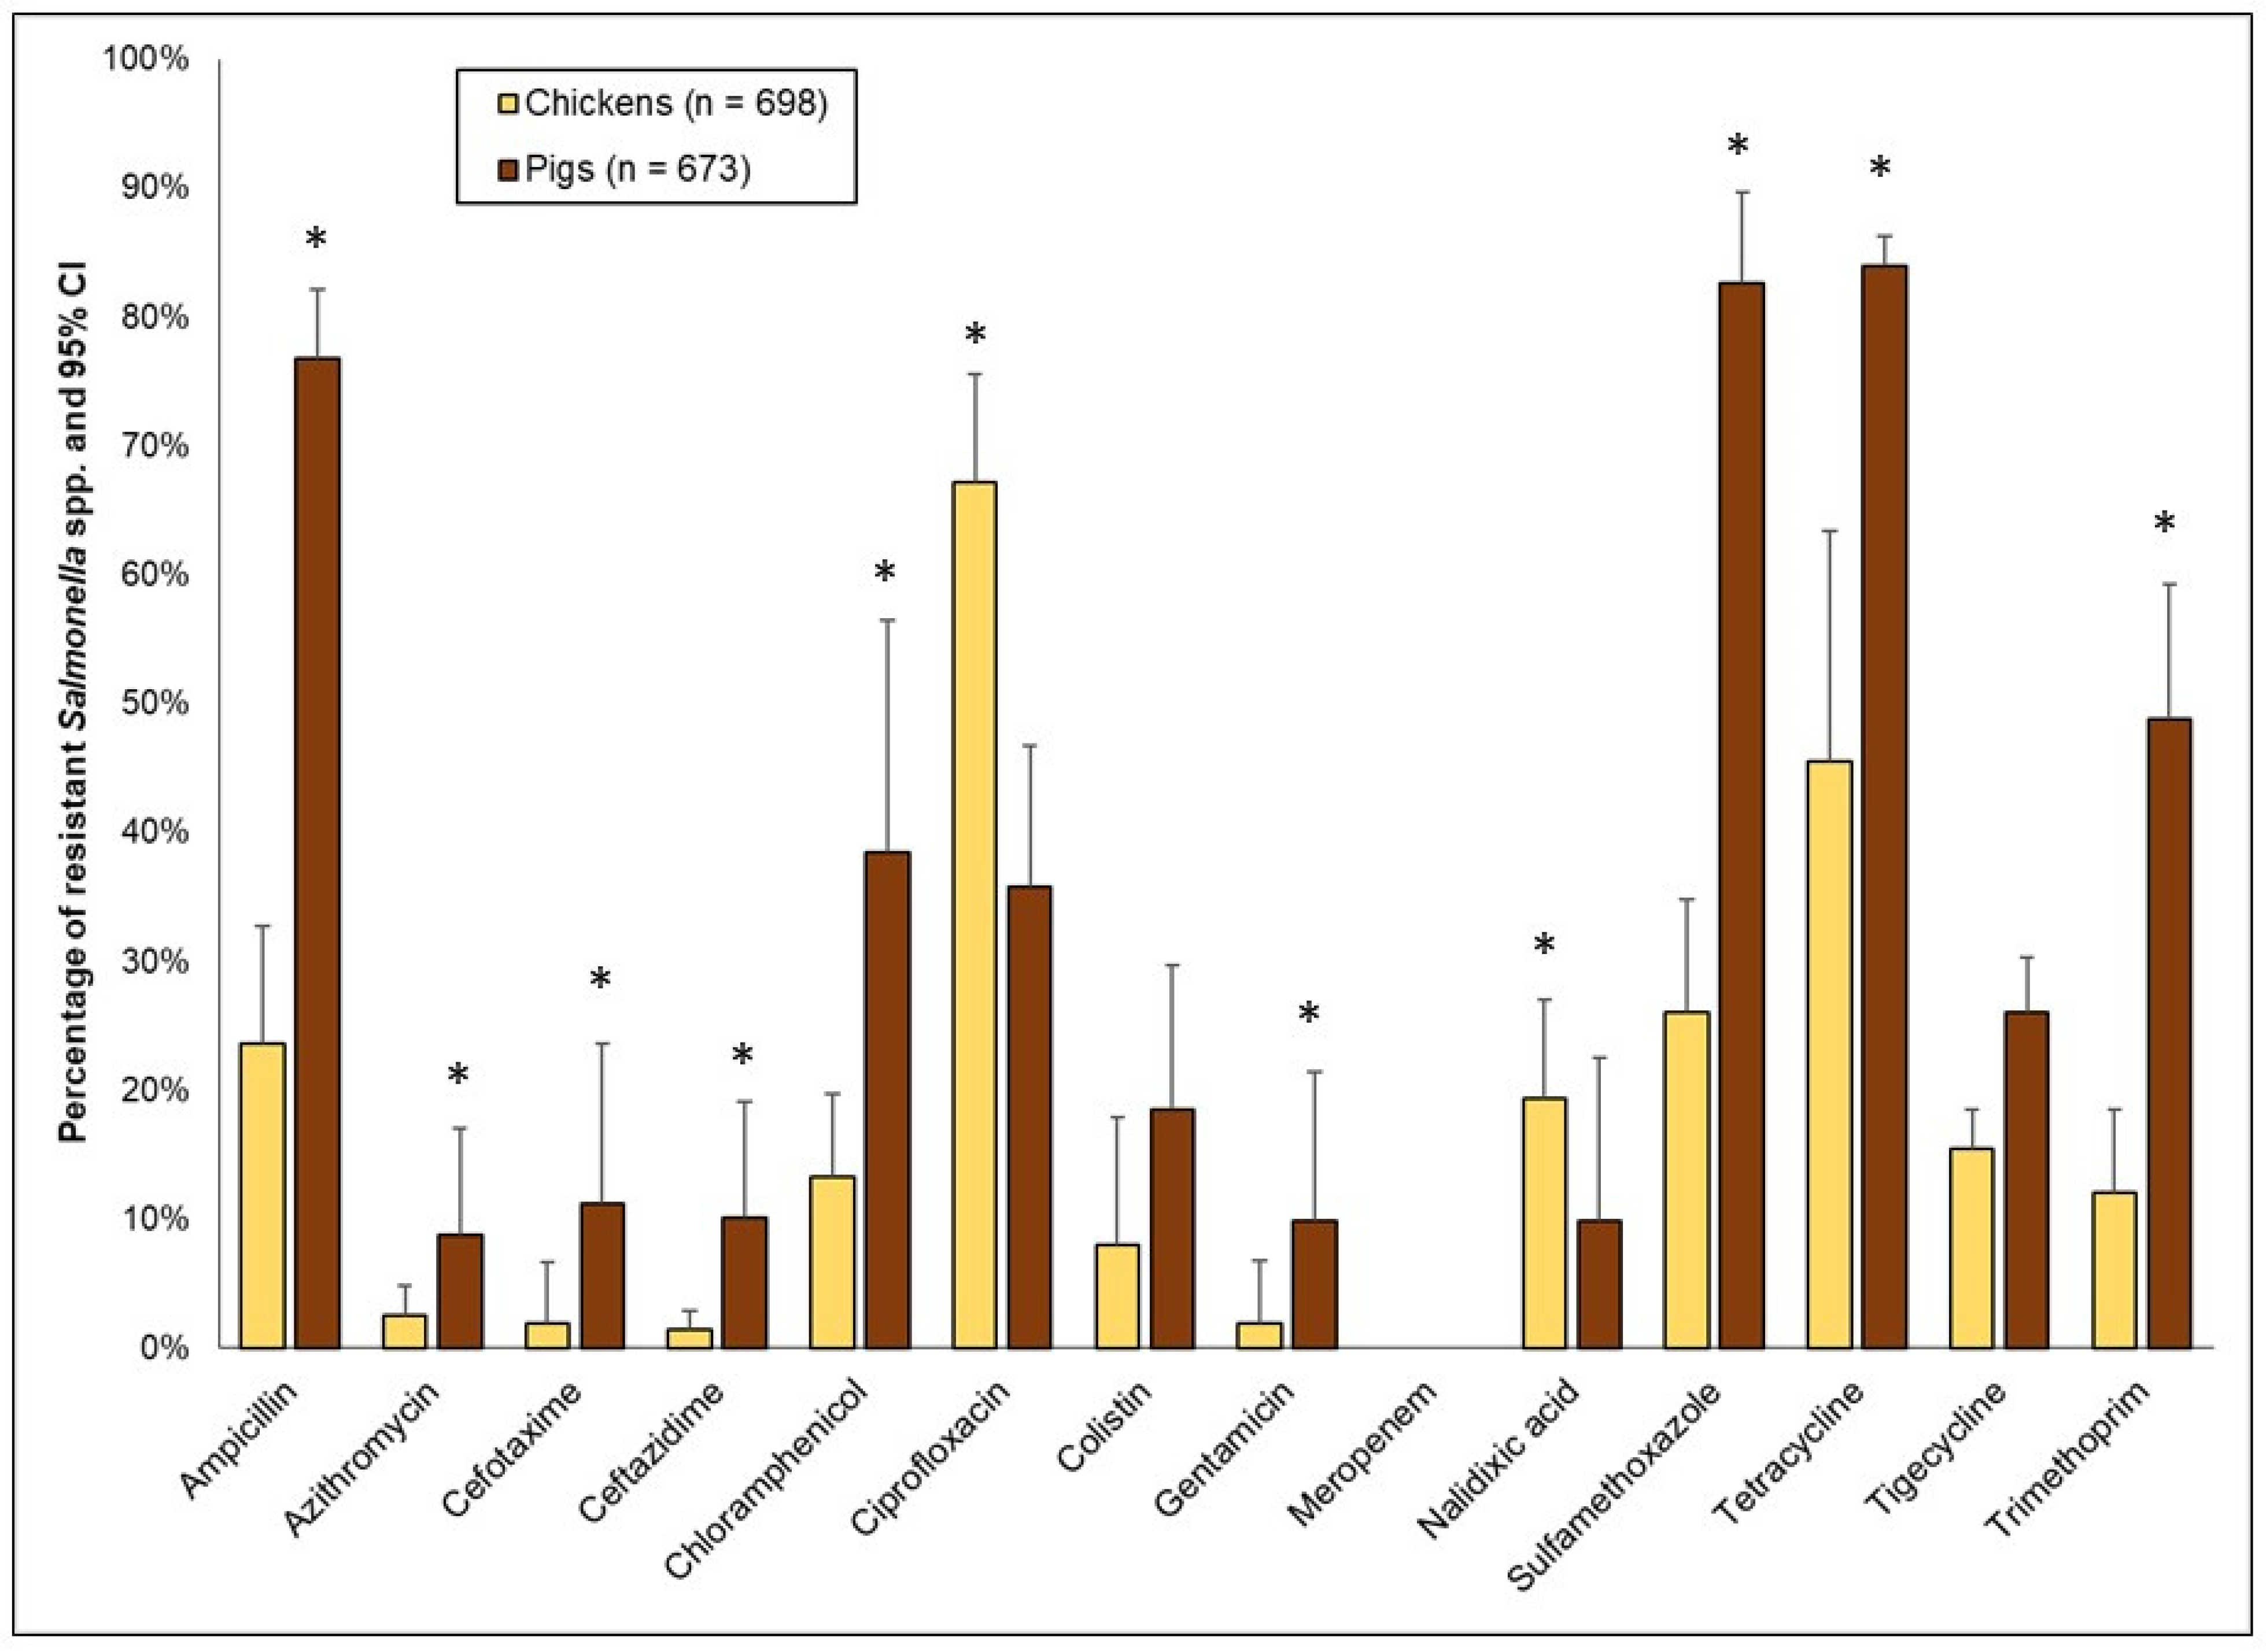
3.3.2. Resistance to Single (Homologous) Antimicrobials

Figure 6 shows the percentages of resistance to the 14 antimicrobials in Salmonella spp. isolated from poultry (combined; native, broiler, and layer birds) and pigs (combined rounds 1 and 2). As with E. coli, variations in the percentage of resistance were observed between pig and chicken isolates, depending on the antimicrobial. Low-to-moderate levels of resistance were noted for the 3rd-generation cephalosporins, and were significantly higher in pigs compared to chickens—cefotaxime (pigs: 11% vs. chickens: 2%, OR 6.55, p < 0.0001) and ceftazidime (pigs: 10% vs. chickens: 1%, OR 7.55, p < 0.0001). However, the opposite was noted for ciprofloxacin, where resistance in pigs was significantly lower compared to chickens (pigs: 36% vs. chickens: 67%, OR 0.27, p = 0.005). These findings mirrored the resistance to nalidixic acid (pigs: 10% vs. chickens: 19%, OR 0.45, p = 0.016). High to extremely high levels of resistance (Figure 6) were detected in other antimicrobials, but were significantly higher in pigs compared to chickens—ampicillin (extremely high), chloramphenicol (high), sulfamethoxazole (extremely high), tetracycline (extremely high), and trimethoprim (very high). Colistin resistance was relatively higher in pigs (18%) than in chickens (8%), but the difference was not statistically significant. Unlike in E. coli, no resistance was detected for meropenem in Salmonella spp. isolates.

Comparison between Different Chicken Production Types

Variations in the percentages of resistance to antimicrobials in the different poultry types (broilers, layers, and native chickens) were observed (Supplementary Materials, Figure S3). Notably, for colistin, resistance in layers (referent breed) (20%) was significantly higher compared to broilers (10%, OR 0.45, p = 0.013) and native chickens (10%, OR 0.45, p = 0.023). As for the quinolone antimicrobials, low-to-moderate levels of ciprofloxacin resistance were detected in the three breeds (no significant differences), but significant variations were observed for nalidixic acid, where layers (27%) were significantly higher compared to broilers (17%, OR 0.30, p < 0.0001) and native chickens (10%, OR 0.30, p = 0.0001). In most cases (except azithromycin and sulfamethoxazole), resistances in native chickens were relatively lower.

Comparison between Two Time Periods/Geographical Regions of the Lao PDR in Pig Isolates

As with E. coli, differences in resistance to ciprofloxacin, colistin, cefotaxime, and ceftazidime between the two rounds of sample collection were not statistically significant. However, for certain antimicrobials, compared to the first round, significantly lower levels were detected during the second round—chloramphenicol (2nd round: 34% vs. 1st round: 41%; OR 0.33, p = 0.002), sulfamethoxazole (2nd round: 66% vs. 1st round: 93%, OR 0.04, p < 0.0001), tetracycline (2nd round: 82% vs. 1st round: 85%, OR 0.21, p = 0.007), and trimethoprim (2nd round: 46% vs. 1st round: 40%, OR 0.27, p = 0.026) (Supplementary Materials, Figure S4).

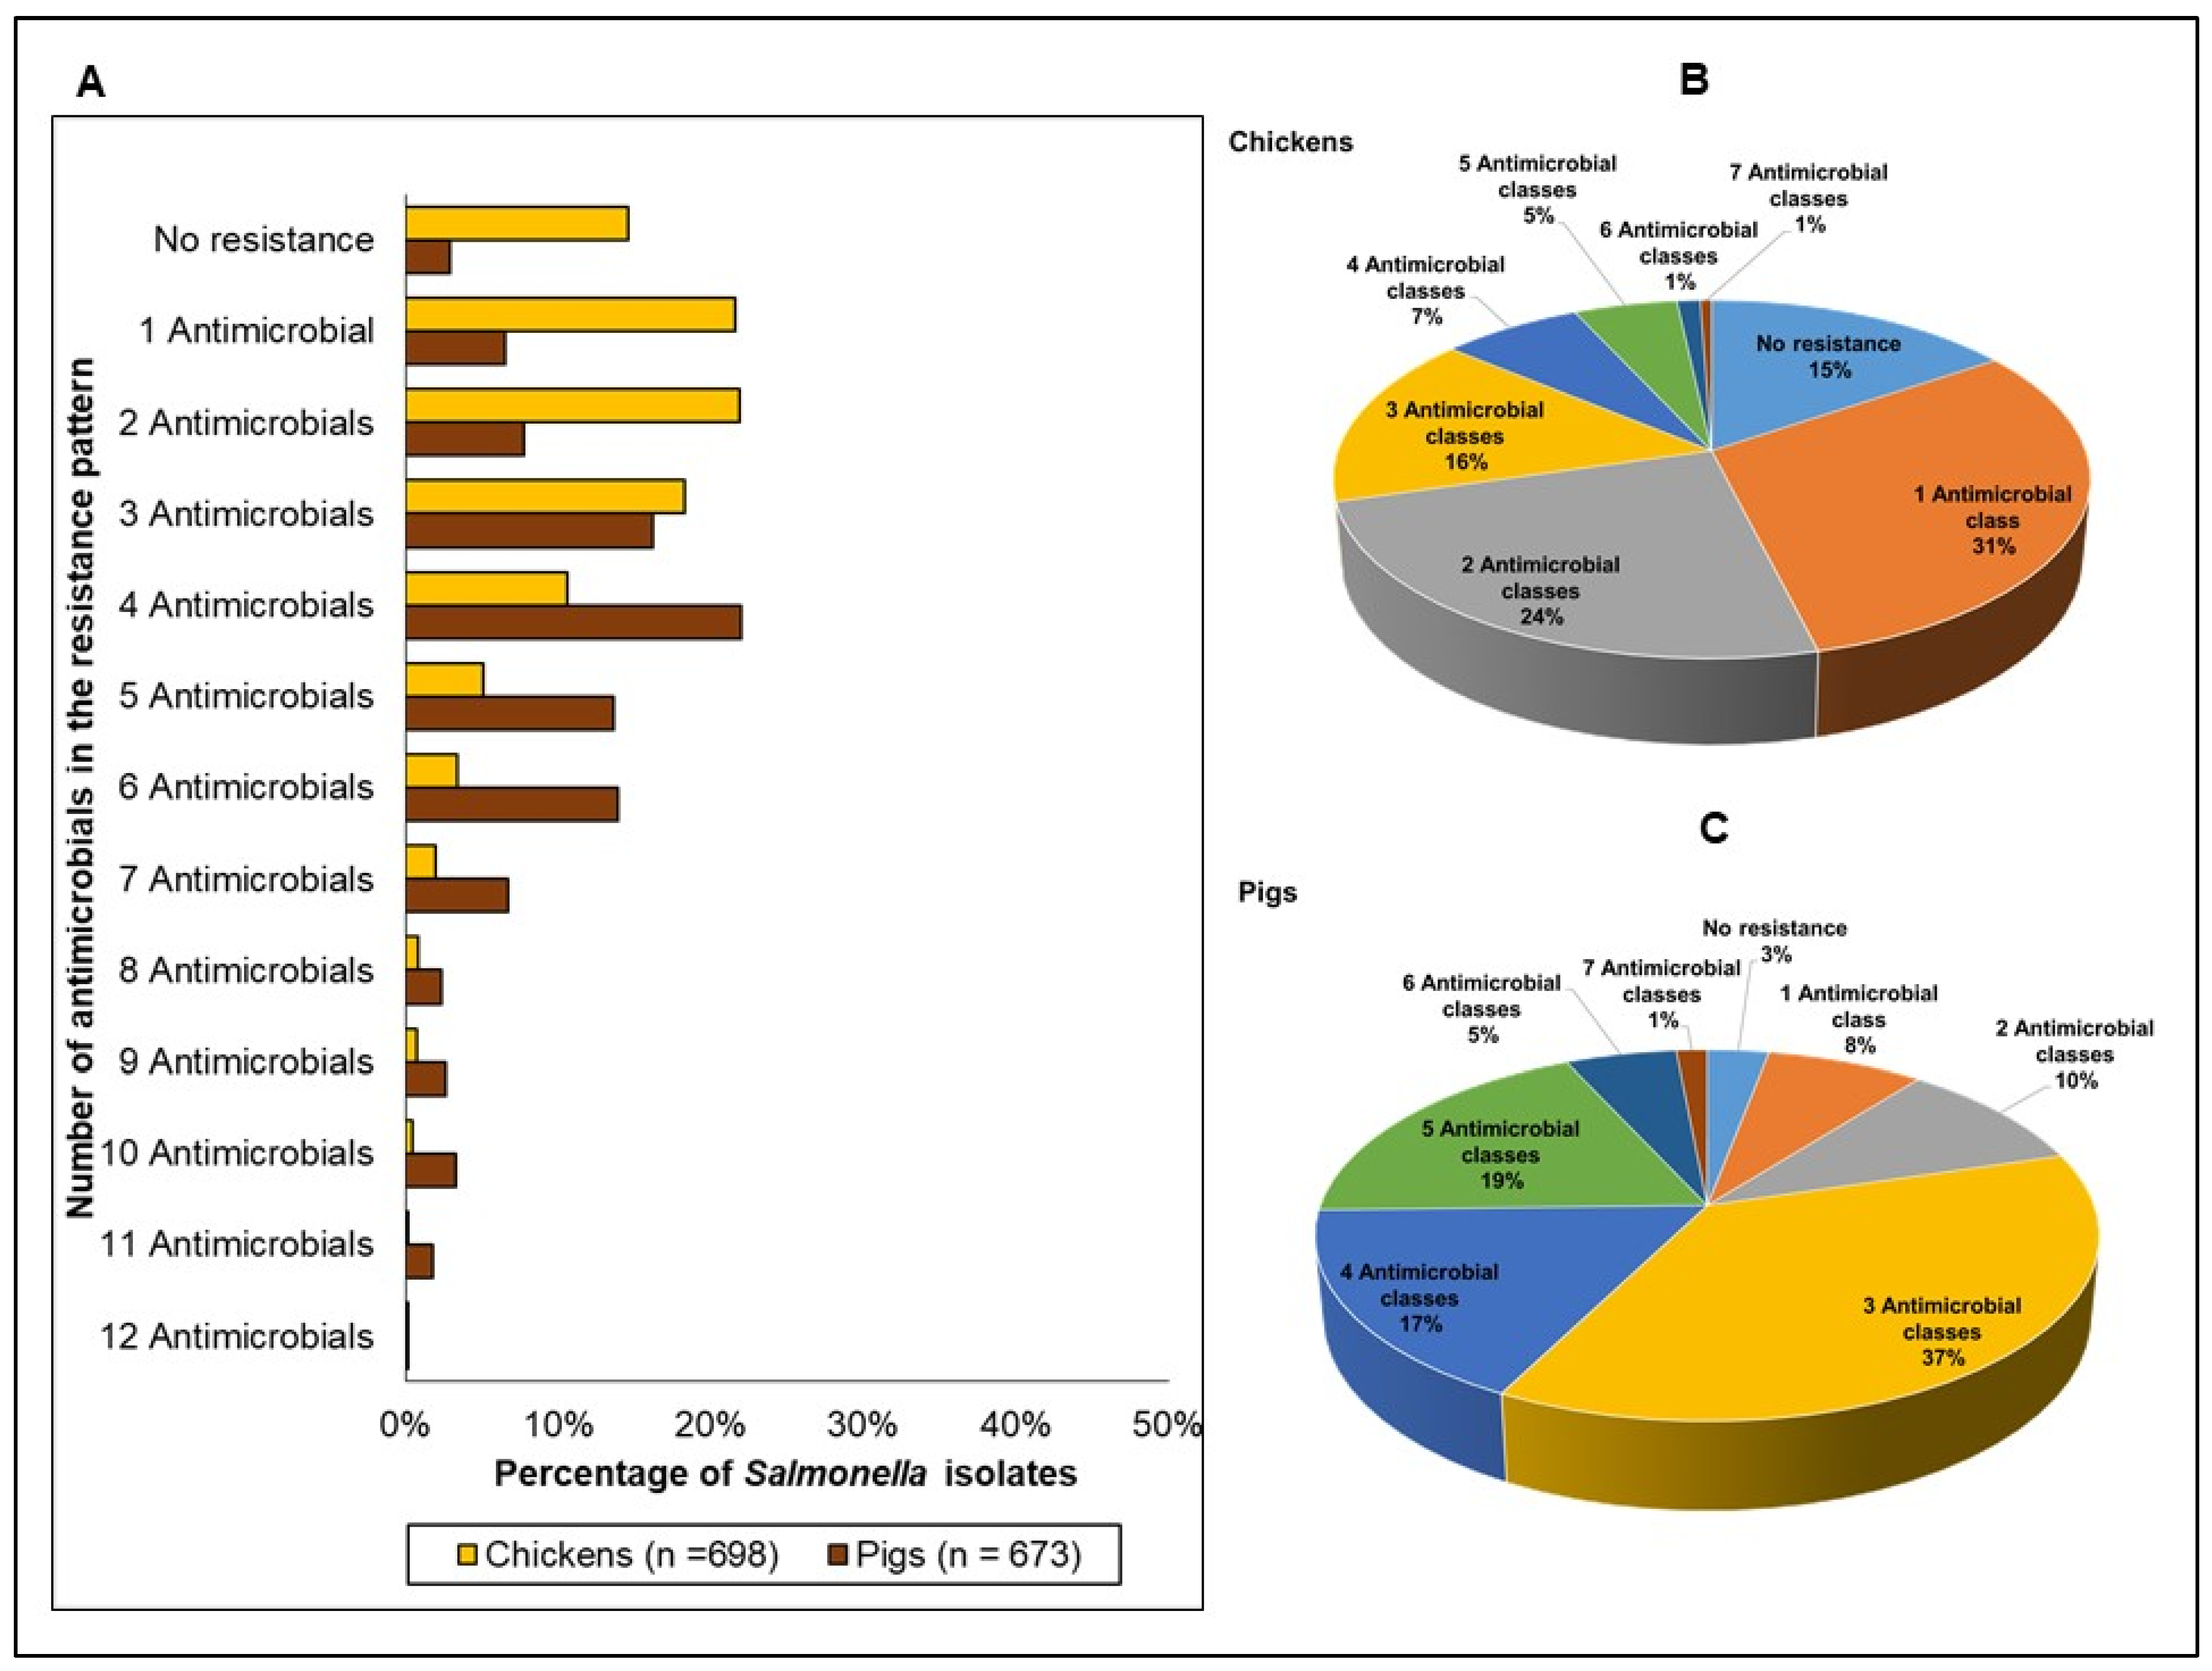
3.3.3. Multidrug and Multiclass Resistance

The distribution of Salmonella resistance phenotypes is shown in Figure 7A. As with E. coli, the percentage of isolates that exhibited no resistance to any of the 14 antimicrobials in the EUVSEC panel was lower in pigs (referent) (<3%) compared to chickens (15%) (OR 0.18, p < 0.0001). The maximum number of antimicrobials to which an isolate was resistant to was 12 antimicrobials (1 isolate) in both chickens and pigs.
When individual antimicrobial resistances were aggregated by antimicrobial class (Figure 7B,C), the relative distribution of the isolates substantially varied between chickens and pigs in most multiclass resistance categories (Table 3). Total isolates that exhibited resistance to antimicrobials belonging to ≥3 classes significantly differed between the two species (pigs: 81% vs. chickens: 33%, OR 8.53, p < 0.0001). There were 64 unique multiclass resistance phenotypes identified in chickens (Supplementary Materials, Table S3A), and the most frequently occurring phenotypes were resistance patterns comprising quinolones (120 isolates, 20%), followed by the pattern comprising folate pathway inhibitors, quinolones, and tetracyclines (52 isolates, 9%). In pigs, there were 65 different multiclass resistance phenotypes (Supplementary Materials, Table S3B), and the top 2 most frequently occurring phenotypes were the resistance pattern comprising beta-lactams, folate synthesis inhibitors, and tetracyclines (174 isolates, 27%), followed by the resistance pattern comprising beta lactams, folate synthesis inhibitors, quinolones, phenicols, and tetracyclines (78 isolates, 12%).

4. Discussion

This study explored a national sampling frame from a network of government-monitored slaughterhouses and wet markets in prioritized districts/provinces of the Lao PDR, where the highest concentrations of pig and poultry production in the country and provincial laboratories are conveniently located. Sampling in these provinces ensured that the average chicken or pig farms in the Lao PDR were captured. This study also assessed the laboratory capacity for AMR surveillance in food animals. To the best of our knowledge, this is the first evidence that food animals slaughtered and sold for human consumption in the Lao PDR are frequently contaminated with antimicrobial-resistant bacteria. Of important public health concern is the detection of Salmonella spp. resistant to the WHO’s HPCIAs (third-generation cephalosporins, quinolones, and polymyxins). Additionally, detection of E. coli isolates resistant to the same classes of antimicrobials is concerning, because these could serve as a reservoir of resistant genes in the environment and in animal populations, posing a food safety and public health threat. In particular, E. coli and Salmonella isolates from both animal species exhibited resistance to colistin, known as a last resort drug and the medicine of choice for the treatment of serious multidrug-resistant Enterobacteriaceae and Pseudomonas aeruginosa infections in humans. Colistin resistance was also contained in numerous resistance phenotypes in E. coli and Salmonella spp. in this study, and warrants closer monitoring in both animal and human populations in the Lao PDR. The detection of isolates with resistance to meropenem—a carbapenem—was very rare. With the exception of ciprofloxacin, percentages of resistance to homologous antimicrobials and ≥multiclass resistance were higher in pigs compared to chickens, necessitating an urgent call for stewardship in the pig sector.
Our data indicated variations in resistance to the WHO’s HPCIAs—such as the 3rd-generation cephalosporins, quinolones, and polymyxins—between pigs and chickens. In most cases, higher levels were observed in pigs compared to chickens, except for the quinolone antimicrobial, ciprofloxacin. The percentages of multiclass-resistant E. coli and Salmonella were higher in pigs. Furthermore, chickens were contaminated with isolates with multiclass-resistant phenotypes distinct from those found in pigs, signifying potential variations in antimicrobial options for treating specific bacterial infections. However, detailed information on AMU (deemed as the main driver of AMR) and potential risk factors (e.g., biosecurity and farm-level practices) in these species are required in order to better understand variations in AMR and the epidemiology of AMR in the Lao PDR’s food animal sector. In a recent study, AMU was identified as a major knowledge gap in understanding the current status of AMR in the Lao PDR [32]. In another study, antimicrobials belonging to beta-lactam penicillins and fluoroquinolones were reportedly used by pig farmers more frequently than chicken farmers who participated in the research [32], which could partially explain our results (higher levels of ampicillin, cefotaxime, and ceftazidime antimicrobials). Moreover, resistance to older antimicrobial classes (e.g., phenicols, sulfonamides, and tetracyclines) was common in both species, but was observed to be higher in pigs. Low-level resistance to azithromycin—a semi-synthetic macrolide—was detected, which was more pronounced in E. coli and Salmonella from pigs than from chickens. Other surveillance systems, such as the US NARMS [33], reported occasional detection of azithromycin-resistant Salmonella isolates from food animal species, whereas the EFSA reported resistance levels that varied from rare to moderate depending on the country [34]. Without detailed AMU information (i.e., the use of natural macrolides such as erythromycin) and characterization of macrolide resistance determinants from the isolates, it is unclear how resistance to azithromycin emerged in the Lao PDR’s animal populations. The detection of resistance to chloramphenicol in E. coli and Salmonella spp. is a phenomenon that has been observed in countries where chloramphenicol has not been used for decades. Although this is a finding commonly reported by several surveillance systems across the world [29,33,34,35,36,37], it is important to investigate whether chloramphenicol has been completely banned from animal production, according to the FAO’s plea to all countries to discontinue the use of chloramphenicol in animal production [38]. The roles of other antimicrobials belonging to the phenicols class of antimicrobials (e.g., thiamphenicol) [32] also need to be investigated. These findings suggest that AMU surveillance is equally important, and could complement AMR surveillance in the pursuit of understanding the emergence and spread of AMR organisms within animal populations in the Lao PDR. Surveillance of AMR in clinical pathogens and syndromic disease investigations could be of value for understanding the main drivers of AMU. As surveillance capacity improves, molecular work for characterizing the genetic determinants in archived (including the isolates from this study) and future isolate collections could improve our understanding on how resistance (including co-selection and cross-resistance mechanisms) and multidrug resistance phenotypes emerged.
Our study found no substantial differences in AMR in E. coli between poultry production types. The finding that native poultry are also frequently contaminated with AMR organisms exhibiting resistance to the same antimicrobials used in commercial layers and broilers is remarkable, as native chickens are raised in a free-range systems (i.e., subsistence-based households) perceived not to be treated with any antimicrobials. A possible explanation is that these birds come in contact with (resistant E. coli- and Salmonella spp.-harboring) pigs, commercial poultry, and/or humans, or that they have been sourced from local breeders, hatcheries, or suppliers with historical or recent AMU exposure (via vertical spread from parents to progeny, or via horizontal spread from hatcheries).
The authors recognize that this pilot AMR surveillance study has several limitations. First, the model for the sample size was patterned from the EFSA, who stated that the optimal sample size should be 170 positive isolates of E. coli and Salmonella spp. in each animal species/breed. However, it was not possible for every breed, species, sampling period, and location (province) to collect 350 samples to harvest 170 Salmonella spp. isolates, which is arguably not a strong enough sample size to evaluate resistance in Salmonella spp. by different groups, locations, or times (Table 1). Secondly, it was assumed that the 10 samples from each slaughterhouse (pigs) and market (poultry) would represent animals from 10 different locations/farms; however, animals could not be traced back to their farm of origin, which could have resulted in biased sample collection (resistance data clustered in multiple samples from the same farm). Thirdly, AMR surveillance in pigs was conducted over two periods, but in different provinces in each period. Thus, no interpretation or explanation could be given to the apparent increasing spatial or temporal AMR trends for ciprofloxacin and nalidixic acid for this species. Fourthly, Salmonella spp. isolates have not been serotyped, hampering the interpretation of the resistance data, as resistance patterns may differ strongly for different serotypes. Finally, the data provided and used in this study were unsuitable for conducting multivariable analysis to identify possible risk factors, as was done by Tuat et al. (2021) [4]. Estimates were adjusted for province in our study to account for similarities in the production practices within the province, and possibly animals from the same farm/establishment (or located in close proximity) within the province, with subanalysis of the differences in breed (in poultry) and rounds of collection (in pigs), but further work is required in order to identify where clustering could have occurred (i.e., within sampling days, districts, slaughterhouses, or wet markets). With regard to the laboratory methods, the lack of interpretative criteria for the full panel of antimicrobials used in this study (i.e., based on EUCAST) using the MIC technique prompted the researchers to utilize available criteria (e.g., azithromycin, sulfamethoxazole, tetracycline, nalidixic acid), such as those of the CLSI, and harmonize them with other existing AMR surveillance programs [27,28]. For these antimicrobials, the MIC distributions (and median MIC values) obtained from the chicken and pig data were within the CLSI’s recommended concentration ranges, which the authors acknowledged to be appropriate for describing the data. However, further data collection could be added to these initial results to determine which CBPs to use that may be more suitable for the country/region.
These initial data could be used to refine regulations pertaining to veterinary medicines and stewardship interventions in the food animal sector. In developing countries, including the Lao PDR—and especially in the livestock sector—weak or non-existent regulatory frameworks on veterinary AMU, suboptimal enforcement and compliance with existing AMU guidelines, low levels of AMR awareness, poor farmer and poor veterinary education, and inadequate commitment to antimicrobial stewardship are some of the drivers of AMR. These issues were identified in a more recent study in the Lao PDR that mapped the veterinary antimicrobial distribution chain and analyzed the roles and interactions of key players [32]; the study cites the lack of veterinarian–farmer interaction and the evolving nature of the veterinary antimicrobial supply chain as factors that could impact changes in behavior with regard to AMU/AMR, through regulations amending veterinary AMU. In the same study, it was found that most of the antimicrobials found on farms are those categorized by the WHO as HPCIAs and CIAs [31]. From a public health perspective, it is especially important to monitor the dispensation and quantity of antimicrobials in both animals and humans. Furthermore, understanding the role of human drug pharmacies as potential sources of antimicrobials for use in food animals could identify gaps in AMU regulations. To mitigate the risks of AMR, we recommend that, initially, a longitudinal national AMR surveillance program for livestock be established in the Lao PDR, complemented by AMU surveillance. Regular, annual surveillance makes it possible to assess the impact of interventions, observe trends, and provide advice on additional regulations or implementations that will contribute to reducing the public health threat and AMR-associated burden of illness in the country. In the near future, a One Health, integrated surveillance system involving a multisector collaborative nature (human health, animal health, and the private sector) should be formed to generate data from different sources. Ideally, an updated NSP-AMR in the Lao PDR [15] should identify long-term funding to support these One Health surveillance activities and ensure sustainability of such an integrated longitudinal surveillance program. Our study serves as a reference point to detect the impact of the NSP-AMR, and the surveillance methods (sampling and laboratory) could inform the refinements and implementation of AMR surveillance activities; more importantly, quantitative MIC data were generated that could contribute to the national/regional AMR databases.

Supplementary Materials

The following are available online at https://www.mdpi.com/article/10.3390/antibiotics11020177/s1: Figure S1: Percentage of resistance in Escherichia coli, comparison between chicken breeds/production types (broilers, n = 373; layers, n = 346; and native chickens, n = 393) in the Lao PDR, 2018–2021. For each antimicrobial, the percentage of resistance was adjusted for clustering at the province level. Asterisks represent significant differences (p ≤ 0.05) for the given antimicrobial between chicken breeds/production types (layers—referent breed); Figure S2: Percentage of resistance in Escherichia coli, comparison between sampling rounds/provinces in pigs (round 1/2018–2019, n = 583 vs. round 2/2018–2019, n = 171) in the Lao PDR, 2018–2021. For each antimicrobial, the percentage of resistance was adjusted for clustering at the province level. Asterisks represent significant differences (p ≤ 0.05) for the given antimicrobial between rounds; Figure S3: Percentage of resistance in Salmonella, comparison between chicken breeds/production types (broilers, n = 268; layers, n = 257; and native chickens, n = 167) in the Lao PDR, 2018–2021. For each antimicrobial, the percentage of resistance was adjusted for clustering at the province level. Asterisks represent significant differences (p ≤ 0.05) for the given antimicrobial between chicken breeds/production types (layers—referent breed); Figure S4: Percentage of resistance in Salmonella, comparison between sampling rounds/provinces in pigs (round 1/2018–2019, n = 411 vs. round 2/2018–2019, n = 262) in the Lao PDR, 2018–2021. For each antimicrobial, the percentage of resistance was adjusted for clustering at the province level. Asterisks represent significant differences (p ≤ 0.05) for the given antimicrobial between rounds; Table S1: Minimum inhibitory concentration (MIC) interpretative criteria used in this study; Table S2: Antimicrobial resistance patterns in multiclass-resistant Escherichia coli isolates; Table S3: Antimicrobial resistance patterns in multiclass-resistant Salmonella spp. isolates.

Author Contributions

Conceptualization, P.I., B.D. and P.P.; methodology, S.C. and P.N.; validation, P.P., W.T. and B.D.; formal analysis, S.C., P.N. and A.A.; investigation, P.I.; resources, B.D.; data curation, L.L. and B.D.; writing—original draft preparation, L.L.; writing—review and editing, J.A.W., B.D., W.T., P.I., P.P. and A.A.; supervision, J.A.W. All authors have read and agreed to the published version of the manuscript.

Funding

This work was conducted with financial support from the Fleming Fund Country Grant, grant number FF13-154, through the Food and Agriculture Organization of the United Nations.

Institutional Review Board Statement

Ethical review and approval were waived for this study, due to no research having been conducted on humans and no live animals having been used.

Informed Consent Statement

Not applicable.

Data Availability Statement

Not applicable.

Acknowledgments

We would like to acknowledge the support from the staff of the five Provincial Agriculture and Forestry Offices, for collecting and transporting all specimens. We would also like to thank the owners of the pig slaughterhouses and the chicken vendors at the markets who assisted in sample collection.

Conflicts of Interest

The authors declare no conflict of interest.

References

  1. Nhung, N.T.; Cuong, N.V.; Thwaites, G.; Carrique-Mas, J. Antimicrobial Usage and Antimicrobial Resistance in Animal Production in Southeast Asia: A Review. Antibiotics 2016, 5, 37. [Google Scholar] [CrossRef] [PubMed] [Green Version]
  2. Coyne, L.; Arief, R.; Benigno, C.; Giang, V.N.; Huong, L.Q.; Jeamsripong, S.; Kalpravidh, W.; McGrane, J.; Padungtod, P.; Patrick, I.; et al. Characterizing Antimicrobial Use in the Livestock Sector in Three South East Asian Countries (Indonesia, Thailand, and Vietnam). Antibiotics 2019, 8, 33. [Google Scholar] [CrossRef] [PubMed] [Green Version]
  3. Strom, G.; Boqvist, S.; Albihn, A.; Fernstrom, L.L.; Andersson Djurfeldt, A.; Sokerya, S.; Sothyra, T.; Magnusson, U. Antimicrobials in small-scale urban pig farming in a lower middle-income country—Arbitrary use and high resistance levels. Antimicrob. Resist. Infect. Control 2018, 7, 35. [Google Scholar] [CrossRef] [PubMed] [Green Version]
  4. Tuat, C.V.; Hue, P.T.; Loan, N.T.P.; Thuy, N.T.; Hue, L.T.; Giang, V.N.; Erickson, V.I.; Padungtod, P. Antimicrobial Resistance Pilot Surveillance of Pigs and Chickens in Vietnam, 2017–2019. Front. Vet. Sci. 2021, 8, 618497. [Google Scholar] [CrossRef]
  5. Holmes, A.H.; Moore, L.S.; Sundsfjord, A.; Steinbakk, M.; Regmi, S.; Karkey, A.; Guerin, P.J.; Piddock, L.J. Understanding the mechanisms and drivers of antimicrobial resistance. Lancet 2016, 387, 176–187. [Google Scholar] [CrossRef]
  6. Graham, D.W.; Bergeron, G.; Bourassa, M.W.; Dickson, J.; Gomes, F.; Howe, A.; Kahn, L.H.; Morley, P.S.; Scott, H.M.; Simjee, S.; et al. Complexities in understanding antimicrobial resistance across domesticated animal, human, and environmental systems. Ann. N. Y. Acad. Sci. 2019, 1441, 17–30. [Google Scholar] [CrossRef]
  7. Pungpian, C.; Sinwat, N.; Angkititrakul, S.; Prathan, R.; Chuanchuen, R. Presence and Transfer of Antimicrobial Resistance Determinants in Escherichia coli in Pigs, Pork, and Humans in Thailand and Lao PDR Border Provinces. Microb. Drug Resist. 2021, 27, 571–584. [Google Scholar] [CrossRef]
  8. Morel, C.M.; Alm, R.A.; Ardal, C.; Bandera, A.; Bruno, G.M.; Carrara, E.; Colombo, G.L.; de Kraker, M.E.A.; Essack, S.; Frost, I.; et al. A one health framework to estimate the cost of antimicrobial resistance. Antimicrob. Resist. Infect. Control 2020, 9, 187. [Google Scholar] [CrossRef]
  9. Nguyen, N.T.; Nguyen, H.M.; Nguyen, C.V.; Nguyen, T.V.; Nguyen, M.T.; Thai, H.Q.; Ho, M.H.; Thwaites, G.; Ngo, H.T.; Baker, S.; et al. Use of Colistin and Other Critical Antimicrobials on Pig and Chicken Farms in Southern Vietnam and Its Association with Resistance in Commensal Escherichia coli Bacteria. Appl. Environ. Microbiol. 2016, 82, 3727–3735. [Google Scholar] [CrossRef] [Green Version]
  10. Trongjit, S.; Angkititrakul, S.; Tuttle, R.E.; Poungseree, J.; Padungtod, P.; Chuanchuen, R. Prevalence and antimicrobial resistance in Salmonella enterica isolated from broiler chickens, pigs and meat products in Thailand-Cambodia border provinces. Microbiol. Immunol. 2017, 61, 23–33. [Google Scholar] [CrossRef] [Green Version]
  11. Moe, A.Z.; Paulsen, P.; Pichpol, D.; Fries, R.; Irsigler, H.; Baumann, M.P.O.; Oo, K.N. Prevalence and Antimicrobial Resistance of Salmonella Isolates from Chicken Carcasses in Retail Markets in Yangon, Myanmar. J. Food Prot. 2017, 80, 947–951. [Google Scholar] [CrossRef] [PubMed]
  12. Gibson, J.S.; Wai, H.; Oo, S.; Hmwe, E.M.M.; Wai, S.S.; Htun, L.L.; Lim, H.P.; Latt, Z.M.; Henning, J. Antimicrobials use and resistance on integrated poultry-fish farming systems in the Ayeyarwady Delta of Myanmar. Sci. Rep. 2020, 10, 16149. [Google Scholar] [CrossRef]
  13. Lay, K.K.; Jeamsripong, S.; Sunn, K.P.; Angkititrakul, S.; Prathan, R.; Srisanga, S.; Chuanchuen, R. Colistin Resistance and ESBL Production in Salmonella and Escherichia coli from Pigs and Pork in the Thailand, Cambodia, Lao PDR, and Myanmar Border Area. Antibiotics 2021, 10, 657. [Google Scholar] [CrossRef] [PubMed]
  14. Munkholm, L.; Rubin, O.; Baekkeskov, E.; Humboldt-Dachroeden, S. Attention to the Tripartite’s one health measures in national action plans on antimicrobial resistance. J. Public Health Policy 2021, 42, 236–248. [Google Scholar] [CrossRef]
  15. Ministry of Health and Ministry of Agriculture and Forestry. National Strategic Plan on Antimicrobial Resistance in Lao PDR 2019–2023. Government of Lao People’s Democratic Republic. Available online: https://www.who.int/publications/m/item/lao-pdr-national-strategic-plan-on-antimicrobial-resistance-in-lao-pdr-2019-2023 (accessed on 31 October 2021).
  16. Munkholm, L.; Rubin, O. The global governance of antimicrobial resistance: A cross-country study of alignment between the global action plan and national action plans. Glob. Health 2020, 16, 109. [Google Scholar] [CrossRef] [PubMed]
  17. FAO. The FAO Action Plan on Antimicrobial Resistance 2021–2025. Available online: https://www.fao.org/documents/card/en/c/cb5545en/ (accessed on 26 December 2021).
  18. FAO. The FAO Action Plan on Antimicrobial Resistance 2016–2020. Available online: http://www.fao.org/3/a-i5996e.pdf (accessed on 12 October 2021).
  19. OIE. The OIE Strategy on Antimicrobial Resistance and the Prudent Use of Antimicrobials. Available online: https://www.oie.int/fileadmin/Home/eng/Media_Center/docs/pdf/PortailAMR/EN_OIE-AMRstrategy.pdf (accessed on 15 December 2021).
  20. Houattongkham, S.; Yamamoto, E.; Sithivong, N.; Inthaphatha, S.; Kariya, T.; Saw, Y.M.; Vongduangchanh, A.; Keosavanh, O.; Hamajima, N. Etiologic agents of acute diarrhea in sentinel surveillance sites in Vientiane Capital, Lao People’s Democratic Republic, 2012–2015. Eur. J. Clin. Microbiol. Infect. Dis. 2020, 39, 1115–1122. [Google Scholar] [CrossRef]
  21. EFSA. Technical specifications on harmonised monitoring of antimicrobial resistance in zoonotic and indicator bacteria from food-producing animals and food. EFSA J. 2019, 17, e05709. [Google Scholar] [CrossRef] [Green Version]
  22. Tu, L.T.; Hoang, N.V.; Cuong, N.V.; Campbell, J.; Bryant, J.E.; Hoa, N.T.; Kiet, B.T.; Thompson, C.; Duy, D.T.; Phat, V.V.; et al. High levels of contamination and antimicrobial-resistant non-typhoidal Salmonella serovars on pig and poultry farms in the Mekong Delta of Vietnam. Epidemiol. Infect. 2015, 143, 3074–3086. [Google Scholar] [CrossRef] [Green Version]
  23. FAO. FAO Assessment Tool for Laboratories and AMR Surveillance Systems (FAO-ATLASS). Available online: https://www.fao.org/antimicrobial-resistance/resources/tools/fao-atlass/en/ (accessed on 31 October 2021).
  24. FAO. Monitoring and Surveillance of Antimicrobial Resistance in Bacteria from Healthy Food Animals Intended for Consumption. Available online: http://www.fao.org/3/ca6897en/CA6897EN.pdf (accessed on 18 June 2018).
  25. Thermo Fisher Scientific. Sensititre Antimicrobial Susceptibility Testing System. Available online: https://www.thermofisher.com/la/en/home/clinical/clinical-microbiology/antimicrobial-susceptibility-testing/sensititre-antimicrobial-susceptibility-testing-system.html (accessed on 31 October 2021).
  26. CLSI (Ed.) Performance Standards for Antimicrobial Susceptibility Testing, CLSI supplement M100, 31st ed.; Clinical Laboratory Standard Institute: Wayne, PA, USA, 2021. [Google Scholar]
  27. Government of Canada. Canadian Integrated Program for Antimicrobial Resistance Surveillance 2018: Design And Methods. Available online: https://www.canada.ca/en/public-health/services/surveillance/canadian-integrated-program-antimicrobial-resistance-surveillance-cipars/cipars-reports/2018-annual-report-design-methods.html (accessed on 24 December 2021).
  28. United States Center for Disease Control and Prevention; National Antimicrobial Resistance Monitoring System for Enteric Bacteria (NARMS). Antibiotics Tested by NARMS. Available online: https://www.cdc.gov/narms/antibiotics-tested.html (accessed on 24 December 2021).
  29. European Centre for Disease Prevention and Control. The European Union Summary Report on Antimicrobial Resistance in zoonotic and indicator bacteria from humans, animals and food in 2018/2019. EFSA J. 2021, 19, e06490. [Google Scholar] [CrossRef]
  30. Magiorakos, A.P.; Srinivasan, A.; Carey, R.B.; Carmeli, Y.; Falagas, M.E.; Giske, C.G.; Harbarth, S.; Hindler, J.F.; Kahlmeter, G.; Olsson-Liljequist, B.; et al. Multidrug-resistant, extensively drug-resistant and pandrug-resistant bacteria: An international expert proposal for interim standard definitions for acquired resistance. Clin. Microbiol. Infect. 2012, 18, 268–281. [Google Scholar] [CrossRef] [Green Version]
  31. WHO. Critically Important Antimicrobials for Human Medicine 6th Revision. Available online: https://www.who.int/publications/i/item/9789241515528 (accessed on 31 October 2021).
  32. Chansamouth, V.; Mayxay, M.; Dance, D.A.; Roberts, T.; Phetsouvanh, R.; Vannachone, B.; Vongsouvath, M.; Davong, V.; Inthavong, P.; Khounsy, S.; et al. Antimicrobial use and resistance data in human and animal sectors in the Lao PDR: Evidence to inform policy. BMJ Glob. Health 2021, 6, e007009. [Google Scholar] [CrossRef] [PubMed]
  33. Poupaud, M.; Putthana, V.; Patriarchi, A.; Caro, D.; Agunos, A.; Tansakul, N.; Goutard, F.L. Understanding the veterinary antibiotics supply chain to address antimicrobial resistance in Lao PDR: Roles and interactions of involved stakeholders. Acta Trop. 2021, 220, 105943. [Google Scholar] [CrossRef] [PubMed]
  34. EFSA. Antimicrobial Resistance in Europe (Interactive Data Platform). Available online: https://multimedia.efsa.europa.eu/dataviz-2018/index.htm (accessed on 24 December 2021).
  35. United States Food and Drugs Administration. NARMS Interactive Data Displays. Available online: https://www.fda.gov/animal-veterinary/national-antimicrobial-resistance-monitoring-system/narms-now-integrated-data (accessed on 26 December 2021).
  36. National Steering Committee on Antimicrobial Resistance of Thailand. Thailand’s First One Health Report on Antimicrobial Consumption and Antimicrobial Resistance in 2017. Available online: http://ihppthaigov.net/DB/publication/attachresearch/433/chapter1.pdf (accessed on 24 December 2021).
  37. National Steering Committee on Antimicrobial Resistance of Thailand. Thailand’s One Health Report on Antimicrobial Consumption and Antimicrobial Resistance in 2018. Available online: http://ihppthaigov.net/DB/publication/attachresearch/432/chapter1.pdf (accessed on 24 December 2021).
  38. FAO. FAO Urges Countries to Discontinue the Use of Chloramphenicol in Animal Production. Available online: https://www.fao.org/asiapacific/news/detail-events/en/c/47419/ (accessed on 2 November 2021).
Figure 1. The Lao People’s Democratic Republic (grey) and its neighboring countries; also shown: the location of the 8 districts (red dots) in 5 provinces where the sampling was conducted.
Antibiotics 11 00177 g001
Figure 2. Distribution of minimum inhibitory concentration (MIC) in a panel of 14 antimicrobials, showing the relative locations of the clinical breakpoints and the median MIC values in Escherichia coli isolated from chickens (n = 1110 isolates) and pigs (n = 754).
Antibiotics 11 00177 g002
Figure 3. Percentages of antimicrobial resistance in Escherichia coli from chickens (n = 1110; depicted by the green bars) and pigs (n = 754; depicted by the blue bars), collected from five provinces in the Lao PDR, 2018–2021. High 95% confidence limits are shown. For each antimicrobial and animal species combination, the percentage of resistance was adjusted for clustering at the province level. Asterisks represent significant differences (p ≤ 0.05) for a given antimicrobial between chickens and pigs.
Antibiotics 11 00177 g003
Figure 4. Distribution of the resistance phenotypes (number of individual antimicrobials in the pattern) in Escherichia coli from chickens (depicted by the green bars; n = 1110) and in pigs (depicted by the blue bars; n = 754) (A), and the distribution of resistant phenotypes (number of classes in the pattern) in chickens (B) and pigs (C). Please refer to the Supplementary Materials, Table S2A,B, for the specific antimicrobial resistance phenotypes.
Antibiotics 11 00177 g004
Figure 5. Distribution of minimum inhibitory concentrations (MICs) in a panel of 14 antimicrobials, showing the relative locations of the clinical breakpoints and the median MIC values in Salmonella spp. isolated from chickens (n = 698 isolates) and pigs (n = 673).
Antibiotics 11 00177 g005
Figure 6. Percentages of antimicrobial resistance in Salmonella spp. from chickens (n = 698 isolates; depicted by the yellow bars) and pigs (n = 673; depicted by the brown bars), collected from five provinces in the Lao PDR, 2018–2021. High 95% confidence limits are shown. For each antimicrobial and species combination, the percentage of resistance was adjusted for clustering at the province level. Asterisks represent significant differences (p ≤ 0.05), between chickens and pigs.
Antibiotics 11 00177 g006
Figure 7. Distribution of the resistance phenotypes (number of individual antimicrobials in the pattern) in Salmonella spp. from chickens (depicted by the yellow bars; n = 698) and in pigs (depicted by the brown bars; n = 675) (A), and the distribution of resistant phenotypes (number of classes in the pattern) in chickens (B) and pigs (C). Please refer to the Supplementary Materials, Table S3A,B, for the specific antimicrobial resistance phenotypes.
Antibiotics 11 00177 g007
Table 1. Collection of pig and chicken caecal specimens during two rounds of antimicrobial resistance surveillance in five provinces in the Lao PDR, 2018–2021.
ProvincePig (Round 1, 2018–2019)Pig (Round 2, 2020–2021)Poultry (Round 2, 2020–2021)Total (by Province)
NativeBroilerLayer
Louangprabang0262164091517
Xiengkhouang01257500200
Vientiane Capital16000255510925
Savannakhet350022400574
Champasak26203625742241422
Total (by species and breed):7723878258298253638
Table 2. Antimicrobial resistance phenotypes in Escherichia coli from chickens (n = 1110) and pigs (n = 754) in the Lao PDR, 2018–2021, and comparison of the differences in percentages between pigs (referent species) and chickens.
Resistance PhenotypesChickens
% Isolates
Pigs
% Isolates
Pigs Compared to Chickens
(Odds Ratios, 95% CIs, and p-Values)
No resistance 16%<1%OR 0.06 (0.01–0.38), p = 0.003
1 Antimicrobial class13%3%OR: 0.220 (0.09–0.52), p = 0.001
2 Multiclass resistance19%9%OR: 0.43 (0.22–0.83), p = 0.011
3 Multiclass resistance24%20%OR: 0.79(065–0.98), p = 0.036
4 Multiclass resistance21%31%OR: 1.68 (1.49–1.90), p < 0.0001
5 Multiclass resistance12%18%OR 1.68 (1.18–2.42), p = 0.004
6 Multiclass resistance4%10%OR 2.4 2 (1.62–3.63), p < 0.0001
7 Multiclass resistance2%7%OR 4.56 (2.54–8.29), p < 0.0001
8 Multiclass resistance0.1%2%OR 22.51 (2.70–187.45), p = 0.004
≥3 Multiclass resistance 262%88%OR 4.29 (1.82–10.12), p = 0.001
1 Isolates that were not resistant to any of the antimicrobials included in the EUVSEC panel. 2 Isolates that exhibited resistance to antimicrobials belonging to 3 or more classes (aggregate of 3–7 multiclass categories). Percentages in bold represent the most frequently occurring multiclass resistance phenotype for the animal species. CI: confidence interval.
Table 3. Antimicrobial resistance phenotypes in Salmonella spp. from chickens (n = 698) and pigs (n = 675) in the Lao PDR, 2018–2021, and comparison of the differences in percentages between pigs (referent species) and chickens.
Resistance PhenotypesChickensPigsPigs Compared to Chickens
(Odds Ratios, 95% CIs, and p-Values)
No resistance 115%3%OR 0.18 (0.07–0.46), p < 0.0001
1 Antimicrobial class25%7%OR: 0.20 (0.10–0.46), p < 0.0001
2 Multiclass resistance27%10%OR: 0.29 (0.16–0.51), p < 0.0001
3 Multiclass resistance17%36%OR: 2.70 (1.86–3.93), p < 0.0001
4 Multiclass resistance7%16%OR: 2.38 (1.72–3.29), p < 0.0001
5 Multiclass resistance5%18%OR 3.78 (1.52–12.35), p = 0.028
6 Multiclass resistance1%6%OR 1.58 (2.73–9.34), p < 0.0001
7 Multiclass resistance1%4%OR 5.3 (1.10–25.44), p = 0.037
8 Multiclass resistance<1%<1%OR 1.03 (0.12–8.26), p = 0.979
≥3 Multiclass resistance 233%81%OR 8.53 (4.1–17.5), p < 0.0001
1 Isolates that were not resistant to any of the antimicrobials included in the EUVSEC panel. 2 Isolates that exhibited resistance to antimicrobials belonging to 3 or more different classes (aggregate of 3–7 multiclass categories). Percentages in bold depict the most frequently occurring multiclass resistance phenotype for the animal species. CI: confidence interval.
Publisher’s Note: MDPI stays neutral with regard to jurisdictional claims in published maps and institutional affiliations.

