1. Introduction
The global market for natural products has been growing due to increasing consumer concern about personal health and the widespread use of synthetic chemicals with potentially harmful side effects and environmental impacts. The rising need for safe, effective and natural alternatives has given attention to propolis, widely recognized as a traditional and potentially medicinal product with several health benefits [
1,
2]. Propolis or “bee glue” is a sticky product composed of resinous and balsamic materials collected by bees from several plant sources and also of other substances resulting from bees’ metabolism [
3]. Interest in propolis has mostly arisen due to its broad range of valuable bioactivities, such as its antioxidant and antimicrobial properties, which have been mainly ascribed to phenolic compounds [
4,
5,
6].
Worldwide demand for propolis has been rising, with China and India being the fastest-growing markets back in 2015 [
7]. Leading the propolis market since 2018, North America is expected to be at the top by 2024 [
8]. According to the most recent projections, the global propolis market size is expected to reach around USD 700 million, with a CAGR (Compound Annual Growth Rate) of 6% between 2019 and 2024 [
8].
Despite the difficulty in accurately estimating the total sales of propolis and its byproducts, as beekeeping is essentially a home-made industry, US propolis sales were estimated at 46,000 € in 1996 [
9]. Japan’s interest in propolis has triggered a price increase from 4.4 to 176.4 €/ Kg in recent years, revealing the economic potential of bee glue [
10]. However, in other countries, such as Portugal, propolis has still been an undervalued and cheaper beehive product [
11], not because of a lower quality but rather due to its low level of exploitation [
12,
13]. This low level of commercial exploitation by most Portuguese beekeepers is mainly due to their lack of awareness and lack of technical knowledge, along with the rooted tradition of honey production, making propolis production practically neglected in the context of national apiculture [
14]. Additionally, propolis productivity is very low: a European hive can produce between 50–150 g propolis per year [
15] and, almost similarly, the estimated annual production of Portuguese propolis is around 100 g/ hive [
15]. Lower productivities, such as 15.7 g propolis/ hive [
16] or 24.2 ± 22.5 g/ hive [
17] have been reported worldwide too, contributing to a reduced interest in propolis production as a considerable volume is often required by its main target, the pharmaceutical industry. In addition, until adequate quality parameters are developed, propolis will remain an alternative treatment without acceptance in medicine. The complex and variable propolis chemistry makes propolis quality standardization very challenging. More than 800 different chemical compounds were identified but the link between marker compound(s) for propolis and their respective therapeutic potential is still missing [
18].
Some factors have been identified as determinants in propolis production and quality —the resin botanical origin, the genetics of the honey bee, the hive structure and material, food availability, environmental factors, and disease (see [
19] for a review)—but the lack of quality standards and proper legislation still hinders the introduction of propolis to the world market. Therefore, a compilation of the parameters that need to be ensured to commercialize propolis for specific applications is critical and regulatory agencies should establish the quality parameters for propolis in a certain country.
The low productivity of propolis and its great chemical variability allied to the lack of standardization are the main obstacles to propolis applications, for example, in the food industry as a food preservative but especially in the pharmaceutical industry for therapeutic purposes [
10,
20,
21,
22]. In this framework, and given the great potential of this natural product [
6,
23,
24], the aim of this work is the evaluation of the antimicrobial and antioxidant activities of mixtures of propolis, as well as the characterization of its chemical composition through in vitro methodologies. We previously showed that mixing ethanol extracts of propolis collected over five years from an apiary (Gerês; G) results in the maintenance or improvement of bioactivities [
13]. However, propolis from Gerês seems rather unique, as it shows chemical and biological constancy along harvests in different years [
25], which is different to what is largely known for bee glue. As a result, we intended to go further in evaluating (i) the outcome of mixing a very different but more typical propolis sample collected in different years from another apiary (Pereiro; P) and showing different bioactive and chemical profiles over the years [
26]; and (ii) the effect of blending the two completely different propolis samples collected from the two apiaries (G and P) in different years.
Thus, in this study we prepared blends of (i) the ethanol extracts of propolis collected in Pereiro over a 5-year period (2011–2015); and of (ii) the ethanol extracts of propolis collected from two distinct apiaries/ regions—Pereiro and Gerês—in selected years. By mixing propolis from different apiaries and harvesting years, we expect to be able to overcome the limitations of the low yield per hive diluting the differences found between individual samples and increasing the available propolis for the market, in this way contributing towards a standardization of propolis biochemical profiles and propolis value.
3. Materials and Methods
3.1. Propolis Origin and Ethanol Extraction
Propolis samples were collected over a period of five years (between 2011 and 2015), in apiaries from two different regions of Portugal. One of the apiaries is located in Guarda district, in Pereiro (40°44′57.135″ N; 7°0′59.403″ O) and the other is in Gerês (41°45′41.62″ N; 7°58′03.34″ W). Samples were collected annually between August and September and were identified by the letters P or G, according to their origin (Pereiro and Gerês, respectively) followed by two digits corresponding to the harvest year (for example, P12 corresponds to propolis of Pereiro collected in 2012). Sample P was obtained by scraping whereas G was collected from grids.
All propolis samples were extracted with ethanol in the same year of collection, following the methodology reported [
25]. Briefly, 15 g of propolis was incubated for 24 h with 80 mL of absolute ethanol, in the dark at room temperature (RT) at 110 revolutions per minute (rpm). The suspension was filtered and the resulting residue was further extracted as described above but with 50 mL of absolute ethanol. Filtrates resulting from the two-step extraction process were pooled and the solvent was evaporated on a rotavapor (Buchi, Flawil, Switzerland) connected to a bath at 38–40 °C and at 47 rpm. The ethanol extracts (EE) prepared with propolis from Pereiro (P.EEs)—P11.EE, P12.EE, P13.EE, P14.EE and P15.EE—and from Gerês (G.EEs)—G11.EE, G12.EE, G13.EE, G14.EE and G15.EE—were stored in the dark at 4 °C, until needed.
3.2. Preparation of Blends of Propolis Ethanol Extracts
3.2.1. Mixtures of Ethanol Extracts of Propolis from Pereiro
Mixtures of EEs of propolis from the apiary Pereiro (mP.EE) were prepared considering the antioxidant, antibacterial and antifungal activities of each individual extract. Firstly, each EE was classified into three categories labeled as: “most active”, “least active” and “intermediate” (the remaining extracts) for each of the bioactivities, similar to that which was previously conducted for propolis from Gerês [
13]. Based on this categorization, mP.EEs were prepared according to the following criteria: (i) the most and the least active extracts, (ii) an intermediate and the least active, (iii) an intermediate and the most active, (iv) all the intermediate P.EEs and (v) a mixture of all of the P.EEs. Thirteen mixtures were planned according to these five criteria but only nine different mixtures were prepared, as some of the blends shared the same composition (
Table 9).
3.2.2. Mixtures of Ethanol Extracts of Propolis from Pereiro and from Gerês
Two blends were prepared with propolis from the two apiaries. For this purpose, P.EEs and G.EEs were used, taking into account the most and least active extracts in terms of antioxidant capacity (
Table 10).
All blends were prepared from P.EEs (
Table 9) or from P.EEs and G.EEs (
Table 10) at the same concentration, 10 mg/ mL, and adding equal volumes of each individual extract of the blend. The mixtures were then used for chemical characterization and biological activity assays.
3.3. Determination of Total Poliphenols Contents
The total polyphenols content (TPC) was determined following an adaptation of the Folin–Ciocalteu colorimetric method [
5,
52]. A volume of 50 µL of propolis ethanol extracts or mixtures—prepared in a concentration range of 10 to 200 µg/mL in absolute ethanol—were added to 50 µL of 10% (
v/
v) Folin–Ciocalteu reagent and 40 µL of 7.5% (
w/
v) Na
2CO
3. After 1 h incubation in the dark at RT, the absorbance was measured at 760 nm. The results are expressed in milligrams of gallic acid equivalents (GAE) per gram of propolis extract (mg GAE/ g extract), upon a calibration curve performed with gallic acid at concentrations between 5 and 50 µg/mL.
3.4. Determination of Total Flavonoids Contents
The total flavonoids content (TFC) was determined following the Woisky and Salatino method [
53]. Propolis EEs or mixtures were prepared in the concentrations of 100 and 1400 µg/mL in absolute ethanol and mixed (50 µL) with 50 µL of 2% (
w/
v) AlCl
3. The absorbance was measured at 420 nm after 1 h incubation in the dark at RT. Quercetin varying from 5 to 200 μg/ ml was used as a standard. The results are presented as milligrams of quercetin equivalents (QE) per gram of propolis extract (mg QE/ g extract).
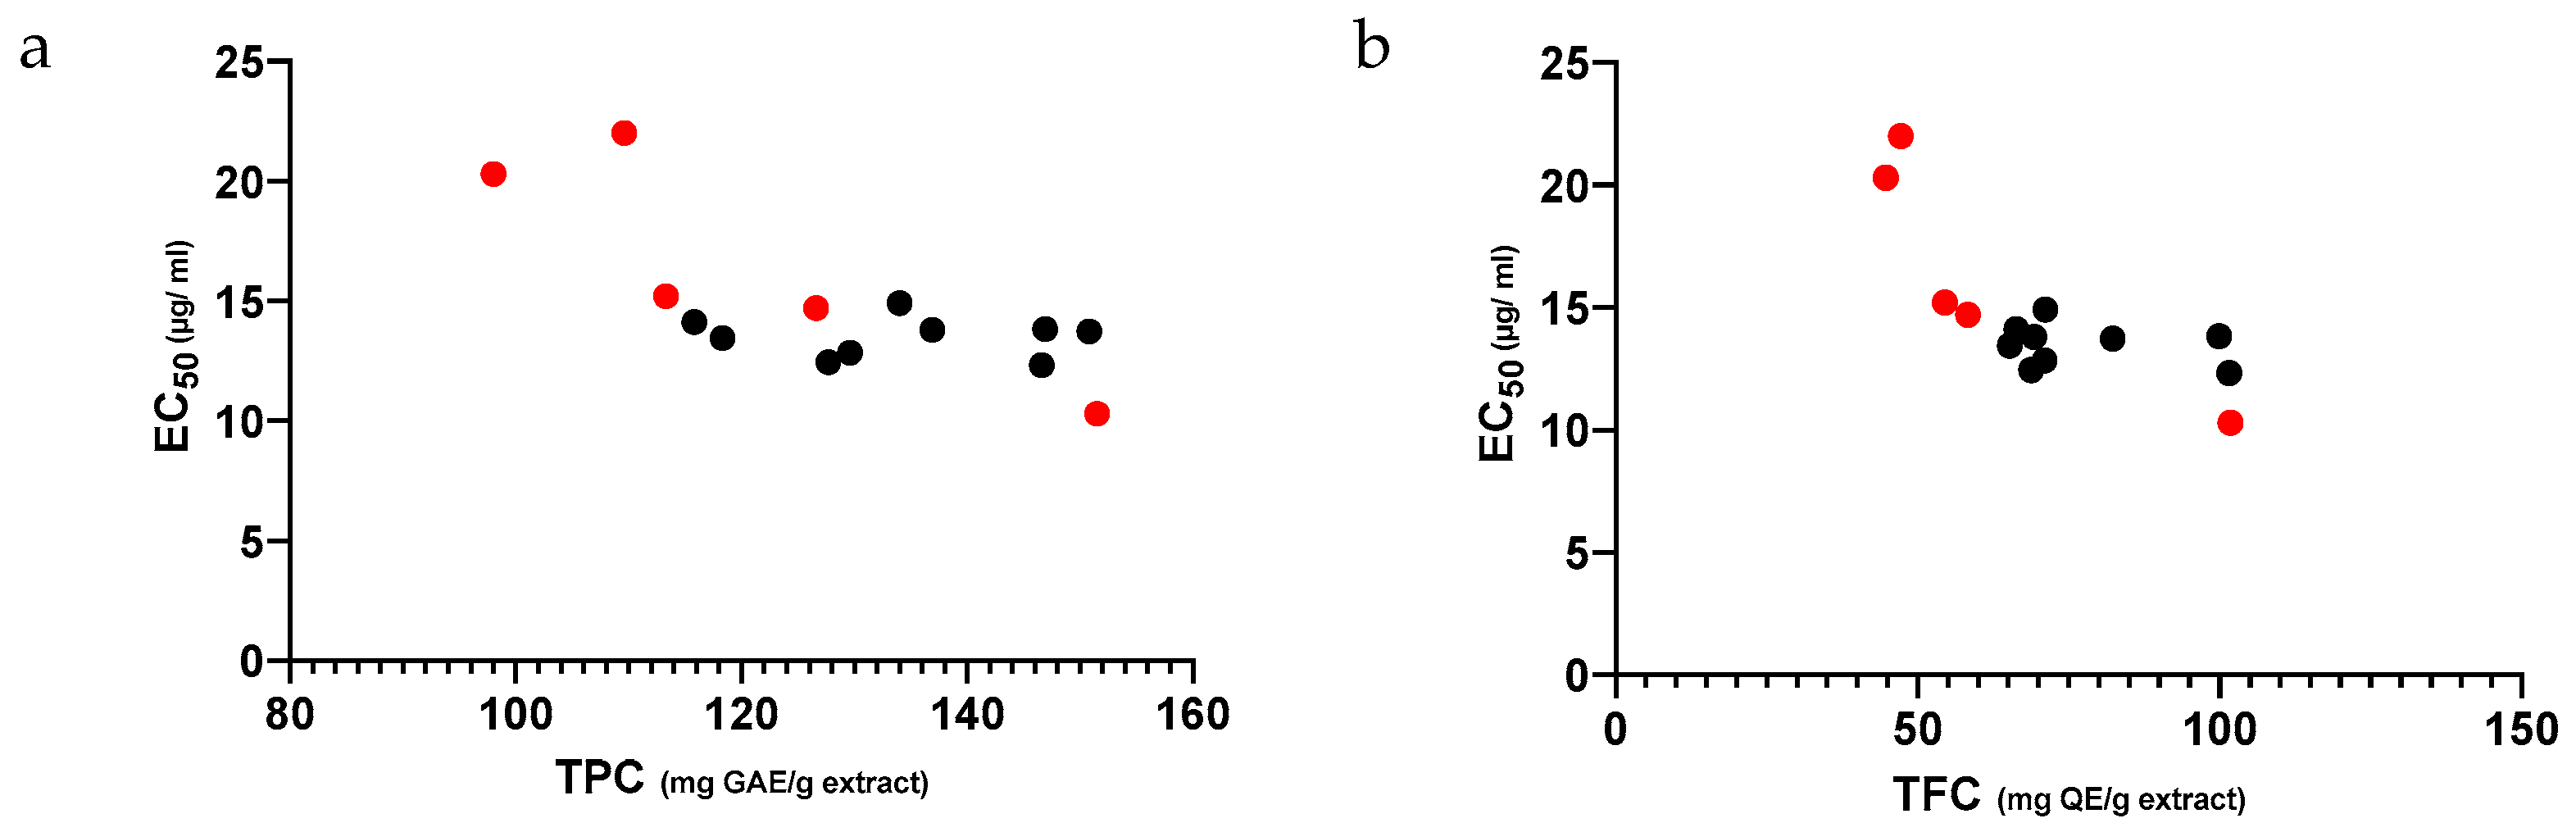
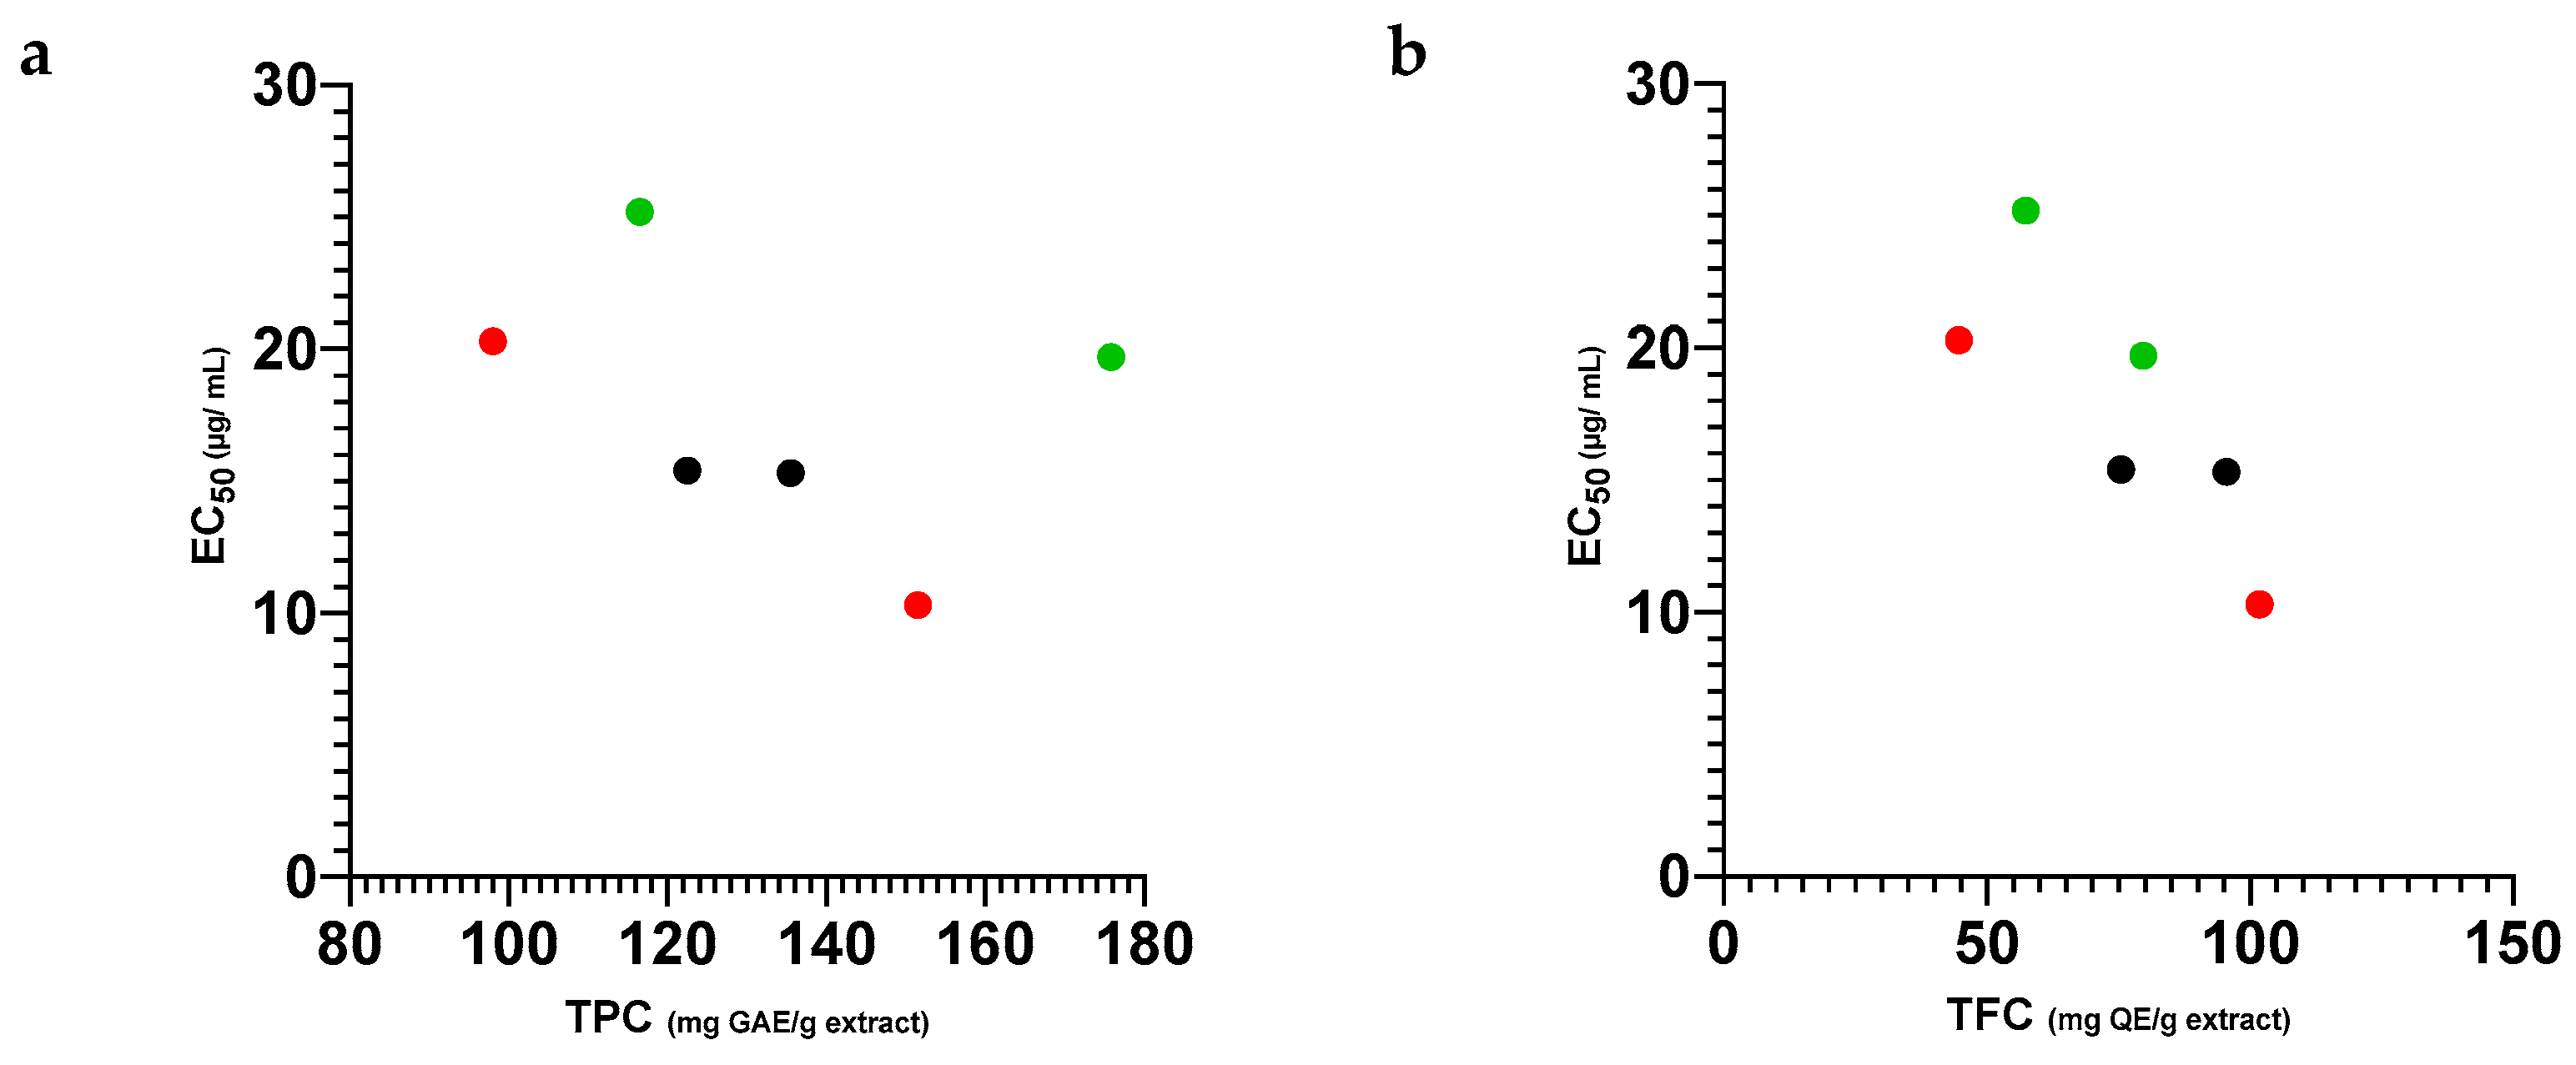
3.5. Determination of of DPPH• Scavenging Potential
The radical
2,2-diphenyl-1-picrylhydrazyl (DPPH•) is a stable free radical which is reduced in the presence of hydrogen-donating antioxidants, promoting a color change that can be measured by spectrophotometry [
54]. The DPPH• scavenging activity of propolis was determined by mixing 50 μL of samples at concentrations of 1 to 50 μg/mL (in absolute ethanol) and 100 μL of 0.004% (
w/
v) DPPH•, followed by 20 min incubation at RT, in the dark, and an absorbance measurement at 517 nm. The percentage reduction for each tested concentration was calculated using the following equation:
where A
Sample is the absorbance of the extract with DPPH• and A
Control the absorbance of the control (DPPH• and ethanol). EC
50 (µg/mL), which defines the propolis concentration needed to scavenge 50% of the free radical, was calculated by interpolation from those values. Gallic acid was used as a standard.
3.6. Evaluation of Antimicrobial Activity
To evaluate propolis antimicrobial activity, a panel of microorganisms was selected, taking into consideration their susceptibility and their clinical and pharmaceutical importance. Gram-negative (Escherichia coli CECT 423) and Gram-positive bacteria (Bacillus subtilis 48886, Bacillus cereus ATCC 7064, Bacillus megaterium, Propionibacterium acnes H60803, Staphylococcus aureus ATCC 6538 and Methicillin-resistant Staphylococcus aureus M746665 (MRSA)), as well as the yeast Candida albicans 53B and Saccharomyces cerevisiae BY4741, were all provided by the culture collection of the Department of Biology of the University of Minho. Bacteria were cultured in LB medium (Difco) for 24 h at 37 °C and 200 rpm and yeast in YPD medium (Difco) for 48 h at 30 °C and 200 rpm. Agar 2% (w/v) was added to each recipe to prepare solid media (LBA and YPDA).
An adaptation of the agar dilution method was used to determine the antibacterial and antifungal activities of all of the propolis mixtures. Each mixture was incorporated in LBA and YPDA media at various concentrations (25, 50, 100, 200, 500, 750, 1000, 1500 or 2000 μg/ ml) depending on the strain under study. Subsequently, 5 µL drops of exponential phase microbial cultures (OD600 = 0.4–0.6) were transferred to the Petri dishes, in triplicate, with incubation for 24 h at 37 ºC in the case of bacteria, or 48 h at 30 ºC in the case of yeast. Minimum inhibitory concentration (MIC) values were obtained upon observation of the presence/absence of microbial growth. Experiments were repeated three times.
3.7. Statistical Analysis
All of the assays for chemical characterization and antioxidant potential were analyzed and the results were presented as mean ± standard deviation from a variable number of assays, always equal to or greater than three (
n ≥ 3). GraphPad Prism for Windows (version 8.0.1, GraphPad Software, San Diego, California USA,
www.graphpad.com, accessed on 2 December 2021 was used in the statistical analysis of the results. The results were analyzed using analysis of variance (ANOVA) followed by the Tukey test. Differences considered statistically significant (
p ≤ 0.05) were expressed with the alphabetical notation system, using different letters (lowercase when comparing mixtures and individual extracts, uppercase when comparing mixtures).
4. Conclusions
This study is a first approach to mixing propolis samples from different years and regions, and consequently with different bio and chemical profiles. We found that when mixing propolis from the same apiary but collected over different years, or when combining propolis samples collected from different regions and years, the antimicrobial and antioxidant activities of the most active of the individual extracts were either preserved or enhanced. Considering the results regarding the chemical characterization (TPC and TFC) and bioactivities (antioxidant and antimicrobial activities) of the mixtures, we can also conclude that the differences between individual propolis samples can be attenuated and a reduction in heterogeneity was obtained, thereby contributing to propolis standardization. These findings support the great potential of propolis and add even more value to this hive resource. Such valorization is also related to a greater use of the product, since samples from different years can be used without any loss of bioactivity. This efficiency in combining different propolis extracts/ samples can contribute to increasing beekeepers’ interest in this product and enable them to face larger demands for this natural product [
55]. Together, these main outcomes are two important starting points for the valorization and standardization of propolis.
Characterization and quantification of propolis bioactive molecules, such as polyphenols, work as a fingerprint of propolis samples, being of interest in medicine and nutraceuticals [
56] and several other applications. With the possible standardization of propolis, its application in combating several health problems, such as obesity and associated metabolic disorders becomes easier [
57], or as an antioxidant and anti-inflammatory agent in the prevention and care of various diseases [
58,
59].

 ,
, 

