Abstract
Silver nanoparticles (AgNPs) possess strong antibacterial effect. The current trend is to incorporate AgNPs into functional materials that benefit from their bactericidal capabilities. Hydroxypropyl methylcellulose (HPMC) is routinely used for the controlled release of medicine thanks to its slow dissolution in water and could be used as a matrix for the controlled release of AgNPs, if a method to produce such a material without the need of other reactants was developed. We proposed such a method in a photochemical reduction of AgNO3 in hydroxypropyl methylcellulose (HPMC) solutions by the illumination of the mixture with the light emitting diode bulb for about 2 h. These AgNPs were characterized by transmission electron microscopy and their diameter was found to be mostly under 100 nm. The colloids were then easily transformed into solid samples by drying, lyophilization and spin-coating. The slowly soluble HPMC was found to be able to release the AgNPs gradually over the duration of several hours. Antibacterial activity of the prepared colloids and the solid samples was tested against Escherichia coli and Staphylococcus epidermidis and was found to be very high, reaching the total elimination of the bacteria in the studied systems.
1. Introduction
Silver nanoparticles (AgNPs) are an intensively studied material due to their unique antibacterial properties combined with relatively low production costs. These particular properties predetermine the AgNPs for applications in areas such as functional textiles, active food packaging, medicine, cosmetics, ecology and many others [1,2,3,4]. In cosmetics, AgNPs have recently been used as additives for their antiseptic and preservative function in, e.g., acne treatment products [5]. Active food packaging is an innovative concept where the container interacts with the enclosed product and the surrounding environment to preserve the quality of the product during prolonged storage [6,7]. AgNPs supported on graphene oxide were infused into polyviscose pads to form antibacterial functional textile [8]. In medicine, AgNPs can be used in diagnosis (e.g., as plasmonic nano-antennas, for tunable wavelength imaging or surface-enhanced fluorescence [9]) or directly for treatment (e.g., as topical antimicrobial agents, wound dressing, implants or for cancer treatment) [10,11]. On the other hand, high concentrations of silver induce cytotoxicity and lead to argyria due to inappropriate silver accumulation in blood, lungs, liver and kidneys. The size of the AgNPs plays a great role in that smaller nanoparticles show both stronger antibacterial effects and are more toxic [10,12]. It is therefore necessary to control the size of the AgNPs during the preparation process (small enough particles to be effective in antimicrobial action, but big enough to be non-toxic) and to ensure the controlled release of the silver from the functional material to maintain safe but effective concentrations of the silver in the area of the medicament action [13].
The antibacterial activity of AgNPs is based on several interactions of the particles with the bacterial body. Very small AgNPs can penetrate the bacterial membrane and enter the cytoplasm where they induce strong oxidative stress. Larger nanoparticles accumulate on the bacterial membrane and form aggregates. This process deteriorates the integrity of the membrane which leads to cellular death. Both small and larger AgNPs release Ag+ ions that bind to amine and thiol groups and thus disrupt the enzymatic respiratory system of the bacterial cell, destroy the DNA of the bacteria and break the proteins in the bacterial membrane [14,15,16,17,18].
AgNPs can be prepared by a variety of methods, but for colloids of monodisperse nanoparticles, the chemical reduction of Ag salts is the most common approach. The reaction mixture to prepare the AgNPs has to comprise of the Ag salt (most commonly AgNO3 or AgCl), reducing agent to produce the Ag0 and a stabilization agent to control the size of the nanoparticles as well as prevent their aggregation to larger structures [19,20]. The reducing and stabilization agents are often present in a great excess to assure the quick reaction, where a high number of metallic nuclei is created, which are immediately surface-stabilized and prevented from further growth [21]. Standard approaches utilize strong reducing agents such as NaBH4, which are great for the highly controlled production of small monodisperse particles [22], however, a lot of attention was recently directed towards the use of less toxic alternatives, which are more desirable for medicinal purposes, due to the residues of the reducing and stabilizing agents being non-toxic [23,24]. Commonly used reactants include proteins such as collagen, gelatin or keratin [11] and polysaccharides such as chitosan [25,26,27] and cellulose [28,29,30]. Polysaccharides can also serve as stabilization agents, which enables the simple preparation of solid form nanoparticle composites by evaporating the solvent. Another way to eliminate the need for additional reaction agents is employing physicochemical methods of silver nitrate reduction. Because silver nitrate is very sensitive to visible light, it is possible to induce its reduction by the illumination of its solution in a photochemical reduction process [31,32]. It is still necessary for the reaction mixture to contain stabilizing agents to prevent the AgNPs from aggregating when the nitrate becomes reduced.
Cellulose by itself is insoluble and therefore cannot be easily used for nanoparticle production, but there are many soluble cellulose derivatives that are available for this purpose. Hydroxypropyl methylcellulose (HPMC) is a soluble cellulose derivative widely used in medicine for dosage forms, especially for controlled drug release tablets. It has been tested as a reducing and stabilizing agent for AgNPs as well [6,33,34]. The preparation of AgNPs directly in HPMC solution without additional reactants would represent an environmentally friendly and simple method to produce solid state composites of AgNPs for their controlled release which could be easily formed in desired shape.
In this work, the possibility to prepare AgNPs in HPMC solutions without additional chemicals was studied. Traditional wet chemistry ways to produce nanoparticles use excess reducing agents. The remaining substance would then crystallize after evaporation of the solvent, which hinders the preparation of solid materials (foils, coatings) with antibacterial activity from the colloids by drying, lyophilization or spin-coating. The reducing power of HPMC turned out to be insufficient to produce AgNPs from AgNO3 by itself, hence photochemical reduction was chosen to produce the AgNPs in HPMC, because AgNO3 is very sensitive to visible light. HPMC was chosen as a stabilizing agent due to its slow solubility in water and its capability to form a matrix for the AgNPs to be supported in. Thanks to those properties, HPMC is often used for the controlled release of drugs. The solid samples prepared as a combination of the AgNPs and HPMC could therefore be used for better control of AgNPs release from the functional materials, so the concentration of silver does not reach toxic levels.
2. Materials and Methods
2.1. Preparation of Ag Colloids
Silver colloids were prepared by photochemical method with hydroxypropyl methylcellulose (HPMC) serving as a capping agent. First, solutions of HPMC were prepared by the mixing of 12.5, 25 or 50 mg of HPMC powder (supplied by Merck (Darmstadt, Germany), viscosity 0.8–0.12 Pa·s in 2% water at 20 °C) and 45 mL of distilled water and the mixture was stirred in refrigerator overnight. Then, 5 mL of 35 mM solution of AgNO3 (crystalline, supplied by Penta s.r.o., Prague, Czech Republic) was added dropwise to the HPMC solution at constant stirring in a shaded Erlenmeyer flask. The resulting mixture was therefore 3.5 mmol·L−1 AgNO3 in 0.25%, 0.5% or 1% HPMC solution. Temperature was brought up to 60 °C and the solution was stirred further for 30 min. During this process, Ag seeds were created that catalyzed the photochemical reduction of the AgNO3 in the next preparation step. The shade was then removed from the flask, the flask was moved to a closed box with a LED lamp light source (20 W power supply, 2452 lm luminous flux, emission spectrum measured by Red Tide USB650 spectrometer Ocean optics, Orlando, FL, USA) in Figure 1) in a 20 cm distance. The solution was irradiated for 2–6 h while its appearance changed from transparent colorless to dark yellow to reddish brown with apparent turbidity. The chemical reaction taking place can be written as: 2AgNO3 2Ag + O2 + 2NO2. The addition of 50 mg of glucose (D-glucose, supplied by Penta s.r.o.) as a reducing agent to the 50 mL of HPMC–AgNO3 solution was tested as well.
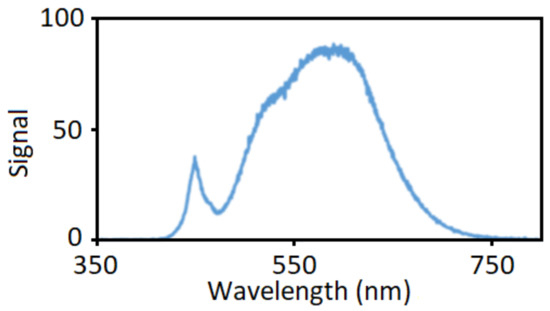
Figure 1.
Normalized emission spectrum of an LED lamp employed as a light source for the photochemical reduction of AgNO3 in hydroxypropyl methylcellulose (HPMC) solutions.
2.2. Preparation of Solid Samples
Solid samples of HPMC–AgNP composites were prepared from the colloids by three different methods. (i) Spin-coating method was used to prepare thin films on borosilicate glass slides (18 mm × 18 mm, 0.13–0.16 mm thick, supplied by Menzel-Gläser (Brunswick, Germany), thoroughly cleaned beforehand in methanol and dried in a stream of nitrogen gas) on Laurell WS-400B-6NPP spin-coater (North Wales, UK). The glass slides were spun at 1000, 1500 or 2000 rpm for 8 min after the injection of 1.5 mL of the colloid sample. (ii) Foils of the HPMC–AgNP composites were prepared by drying 4 mL of the colloid in round silicone forms, 5 cm in diameter, for several hours (until complete drying) at 70 °C in Binder FED 23 oven. (iii) Lastly, the sponges of the HPMC–AgNP composites were prepared by the lyophilization of 4 mL of the colloids in polystyrene test tubes. The samples were kept for 24 h in the freezer and then dried for 48 h in CentriVap lyophilizer (Labconco, Kansas City, MO, USA).
2.3. Methods of Analysis
Absorption spectra of the colloids and solid samples were measured by ultraviolet-visible-near-infrared (UV–Vis–NIR) spectrophotometer Lambda 25 (Perkin-Elmer, Waltham, MA, USA). The captured spectral range was in the range of 300–700 nm with a 1 nm data collection interval and a scanning rate of 240 nm·min−1. Halogen and deuterium lamps were used as the light source for 300–350 and 350–700 nm, respectively.
Transmission electron microscopy (TEM) was employed to determine the shape and size of the prepared nanoparticles. The measurements took place in the JEOL JEM-1010 microscope (Tokyo, Japan) at the acceleration voltage of 80 kV. The AgNP colloids were applied to a copper mesh covered with carbon. The images were taken with SIS MegaView III (Olympus Soft Imaging Systems, Shinjuku, Japan) digital camera. The particle size distribution was evaluated with NIS-Elements AR software with 200–300 particles from each sample. The average size of the particles was obtained as a Feret diameter [35].
Visual characterization of the samples was performed by optical microscopy on confocal laser scanning microscope (CLSM) LEXT OLS 3100 (Olympus). Images of the samples were captured in TV mode using 5× and 10× objective lenses, which resulted in a total magnification of 120× and 240×, respectively.
A dual-beam scanning electron microscopy (SEM) with an field emission electron gun (Tescan LYRA3GMU, Brno, Czech Republic) was used to study the surface morphology of the solid samples. The applied acceleration voltage was 7 keV with 5 keV deceleration voltage. Prior to the measurement, the samples were attached to the sample holder with a carbon tape and coated with a thin layer of Au prepared by sputtering for 300 s at 40 mA in a Q300T ES (Quorum, Laughton, UK) sputter-coater to avoid charging.
UV–Vis spectroscopy (Lambda 25) was also employed to study the dissolution of the foils and sponges and the resulting release of the AgNPs from these solid samples. The samples were placed in a beaker with 20 mL of distilled water at 37 °C with constant stirring. The beaker was covered during the experiment to prevent the evaporation of the water. Then, 2 mL samples of the liquid part in the beaker were measured in cuvettes in predetermined intervals. After the measurement, the contents of the cuvette were returned into the beaker to ensure the constant volume of the solvent was maintained during the whole measurement. The experiment continued until the complete dissolution of the solid sample.
Gravimetry was employed to determine the thickness of the spin-coated thin films of the HPMC–AgNP composite. The cleaned glass slides were weighed before and after the thin film deposition at least 5 times each on the UMX2 (Mettler Toledo, Greifensee, Switzerland) ultra-microbalance system. The weight of the thin film (Δm) was calculated in film thickness (h) using the equation: h = Δm/(a2 ρ), where a is the length of the glass slide side and ρ is the density of HPMC.
Fourier transform infrared (FTIR) spectroscopy was used to evaluate the changes of chemical composition in HPMC foils and in the thin films of HPMC with AgNPs prepared by the spin-coating method. Nicolet iS5 spectrometer (Thermo Fisher Scientific, Waltham, MA, USA) was used for this purpose with iD7 attenuated total reflection accessory with the diamond crystal. The spectral range was 600–4000 cm−1 with 1 cm−1 data interval and the spectra were obtained as an average from 128 measurement cycles. Automatic atmospheric suppression utility was used to filter out the absorption of ambient CO2 and H2O.
Atomic force microscopy (AFM) was performed on the spin-coated thin films of HPMC to investigate the surface morphology of the prepared samples. Dimension ICON (Bruker, Billerica, MA, USA) microscope was used in tapping mode with Si ScanAsyst probe with 70 kHz resonance frequency and 0.4 N·m−1 spring constant. Images of 10 μm × 10 μm were obtained at a 0.3 Hz scanning rate.
2.4. Antibacterial Activity Tests
Antibacterial activity of the prepared samples was tested against the Gram-negative Escherichia coli (E. coli; DBM 3138) bacteria and Gram-positive Staphylococcus epidermidis (S. epidermidis; DBM 3179) bacteria. The bacteria were cultivated overnight on sterile Luria–Bertani growth medium (LB, Merck, prepared by dissolving 10 g of tryptone, 5 g of yeast extract and 5 g of NaCl in 1 L of distilled water) with constant shaking at 37 °C. The suspension with bacteria was then diluted with fresh sterile phosphate-buffered saline (PBS, Merck, prepared by dissolving 1 tablet in 200 mL of distilled water) to a concentration of 103–104 bacteria per 1 mL. HPMC–AgNP colloids were tested by adding 100 µL of the colloid to 2 mL of the bacterial suspension. The mix was incubated for 2–3 h at room temperature and then 5 µL × 25 µL of each triplicate sampling was placed on a Petri dish. The spin-coated HPMC–AgNP composite thin films were tested by placing 150 µL of the bacterial suspension on the solid sample in 5 repetitions. After 2–3 h of incubation, 3 × 25 µL of the bacterial suspension was placed on a Petri dish. All the bacterial suspensions on Petri dishes were then incubated for 24 h with LB at room temperature for E. coli and with plate-count agar at 37 °C for S. epidermidis. The bacterial concentration was determined by directly counting the colony forming units on the Petri dishes.
3. Results
The colloids were prepared by a method similar to the one published in [33] with glucose as a supportive reducing agent. However, the glucose excess impedes the preparation of solid samples as it crystallizes in the foils as the solvent dries (Figure 2). The glucose was omitted from the reaction mixture and the procedure described in [34] was adopted. With the reaction taking place in a shaded flask, no color change indicating the formation of AgNPs occurred. When the samples were then left in the daylight in the laboratory the reduction of AgNO3 occurred. AgNO3 is very sensitive to illumination and therefore the preparation sequence was modified to include the controlled light irradiation of the colloid samples, as described in the experimental section. During the irradiation, a gradual color change took place from clear solutions to reddish brown colloids after 2 h of irradiation.
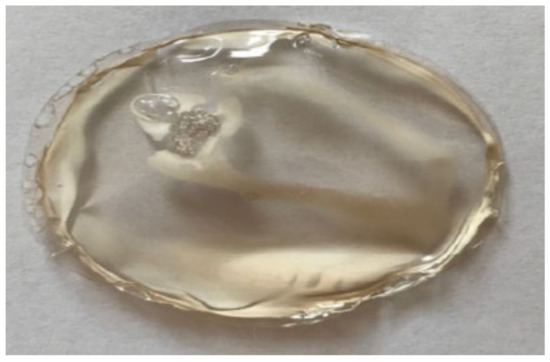
Figure 2.
Photograph of a dried foil prepared from the HPMC mixed with glucose as a reducing agent. White opaque streaks of crystallized glucose are clearly visible in the otherwise transparent HPMC foil.
The UV–Vis spectra of Ag colloids prepared in 0.25%, 0.5% and 1% solutions of HPMC are shown in Figure 3. The gradual increase in the absorption of the surface plasmon resonance (SPR) band in the spectra with increasing irradiation time is visible. The concentration of HPMC in the solutions influences the overall absorption of the samples as well. The absorption maximum of the SPR band is at 470 to 490 nm with a shoulder occurring in the case of longer irradiation times at wavelengths around 600 nm, which can be attributed to quadrupole and dipole SPR oscillations (preferential shape growth or the presence of two distinct populations of nanoparticles of different sizes were disproven by TEM measurements) [36]. This suggests the formation of somewhat larger AgNPs of about 150 nm. The interband transition absorption band can be seen at all HPMC concentrations at 380 nm and is more prominent in samples with higher HPMC concentration.
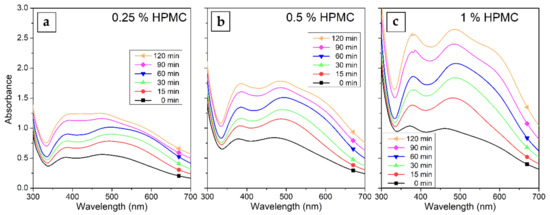
Figure 3.
UV–Vis absorption spectra of Silver nanoparticles (AgNPs) colloids prepared by the irradiation of AgNO3 solutions in (a) 0.25%, (b) 0.5% and (c) 1% HPMC for 15–120 min.
The TEM images of the AgNPs prepared in 0.25%, 0.5% and 1% HPMC solutions are shown in Figure 4a–c. Well defined metal particles are clearly visible documenting the successful reduction of AgNO3. With higher magnification, crystalline facets can be distinguished as well. The size distribution of the particles is obviously quite wide as there is a small number of significantly larger particles in the images. The particles mainly possess a round shape with no significant elongation in any axis. The size distribution seems to be in a spectrum of diameters rather than several distinct populations of different particle sizes. The image analysis of the TEM micrographs was used to quantify the size distribution of the particles as well (Figure 4d). The narrowest size distribution was found to be in the case of the 0.25% HPMC solution, where the majority of the particles was found to be 60–120 nm in diameter. That is still a rather wide size distribution, but the conditions of the proposed preparation method could be adjusted to achieve better results in future experiments. The highest population of the smallest AgNPs was found to be in the case of the 1% HPMC solution where most of the particles were found to be under 50 nm in diameter, but there were still many particles significantly bigger. The sample with 0.5% HPMC solution showed the widest size distribution of the AgNPs and showed the characters of size distributions from the other two studied HPMC concentrations with the highest number of particles being 10–40 and 80–110 nm in diameter. The wide size distribution is undesirable for the controlled antibacterial effect of the colloid.
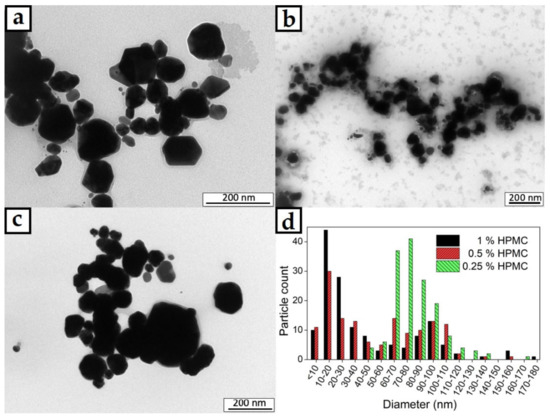
Figure 4.
TEM micrographs of AgNPs in colloids prepared in (a) 0.25%, (b) 0.5% and (c) 1% HPMC solutions; (d) graph of particle size distributions of the prepared colloid samples.
The colloids were then dried in an oven in silicon molds, where the HPMC–AgNP composite foils formed. A photograph of the prepared foil can be seen in Figure 5a. The foil showed good mechanical properties, it was flexible and did not break when bent. The color of the foils was dark yellow-brown with no significant AgNPs aggregates that could be spotted by the naked eye. The micrographs of the foil surface obtained from CLSM (Figure 5b) and SEM (Figure 5c,d) show the homogeneous flat surface of the foils. No significant surface irregularities can be spotted even under the 2000× magnification of the SEM image. The higher magnification SEM image also show the homogeneous distribution of AgNPs in the HPMC foil. The HPMC solutions produced homogeneous foils with smooth surface. The HPMC–AgNP colloids were also lyophilized to produce dry sponges of the composite material. A photograph and micrographs of the sponge are in Figure 6. The color of the sponge was similar to that of the dry foil with no apparent AgNP aggregates. The colloids are therefore stable enough to endure the lyophilization process. The micrographs show a structure of very fine leaflets of the cellulose with an apparently much higher surface area than that of the dry foils. The prepared sponges were flexible and able to regain their initial shape after being mechanically deformed.
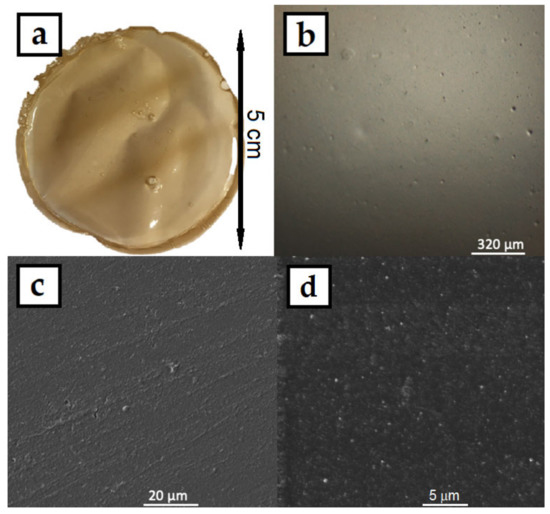
Figure 5.
(a) Photograph, (b) CLSM and (c,d) SEM micrographs of AgNPs in HPMC composite foil prepared by drying the 1% HPMC colloids.
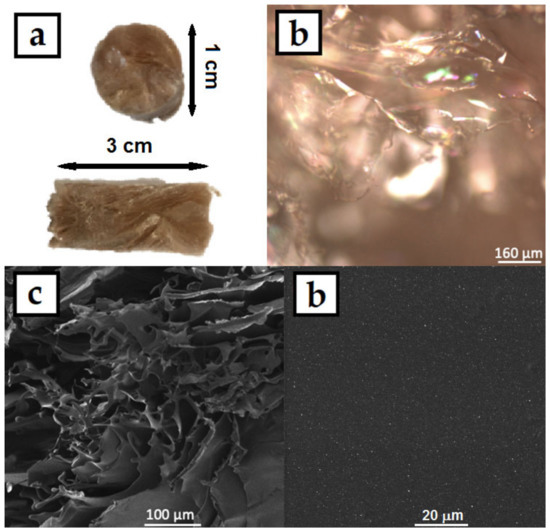
Figure 6.
(a) Photograph (side and front), (b) CLSM and (c,d) SEM micrographs of AgNPs in HPMC composite sponge prepared by lyophilizing the 1% HPMC colloids.
FTIR absorption spectra in Figure 7a show no significant difference of the dry foil with or without the AgNPs. This could be expected, because there is no covalent bond between the HPMC and Ag and the nanoparticles are stabilized only sterically. The spectra show strong absorption at 1050 cm−1 which can be attributed to C–O–C stretching vibration, and 1380 and 3460 cm−1 absorption can be attributed to –OH bending and stretching vibrations, the 1460 cm−1 band represents the –CH2-scissor bend vibration and lastly the absorption at 2930 cm−1 is connected to the C–H stretching vibrations. The foil sample containing the AgNPs only shows the comparatively weaker absorption of the 1050 cm−1 band. This could be caused by the interaction of this chemical group with the surface of the AgNPs. FTIR spectra of the thin film samples in Figure 7b show similar absorptions as the dry foils at 3460 and 2930 cm−1. The absorption bands of the cellulose at lower wavenumbers are however overlapped by the much stronger absorption of the glass substrate, particularly the BO3 triangles stretching vibration at 1390 cm−1 and the SiO4 tetrahedral units stretching vibration at 1100 cm−1.
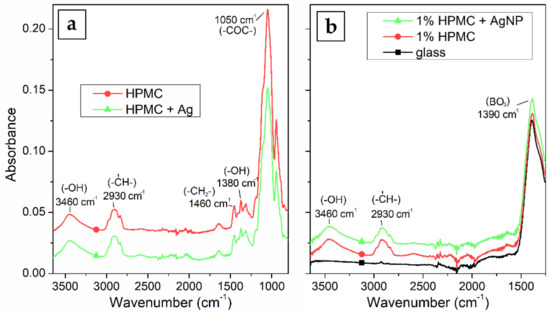
Figure 7.
FTIR absorption spectra of (a) HPMC foil and HPMC–AgNP composite foil prepared from 1% HPMC solutions and (b) borosilicate glass substrate and thin films of HPMC and AgNPs prepared by spin-coating.
The HPMC is characteristically better soluble in water at lower temperatures (best at 4 °C) [37]. Therefore, the controlled dissolution of the solid samples prepared from the 1% HPMC colloids and slow release of AgNPs was tested at the physiological temperature of 37 °C. The UV–Vis absorption of the solutes taken at different times are in Figure 8. The foil dissolved overall much more quickly than the sponge. The foil got completely dissolved after 2 h. The dissolution was quite fast at first, after about 1 h most of the sample got dissolved. The rest of the sample took another hour to become completely dissolved. After up to 1 h of the process, a significantly sharper SPR band than that of the original colloid at around 420 nm can be seen in the spectrum of the solute. This could suggest that smaller AgNPs are released preferentially from the foil. On the other hand, the composite sponge dissolved much slower, the complete dissolution was observed at about 20 h after the start of the process. The SPR band in this case remains wide during the whole dissolution process, because the sponge dissolves in whole segments, where no preferential release of smaller AgNPs could take place.
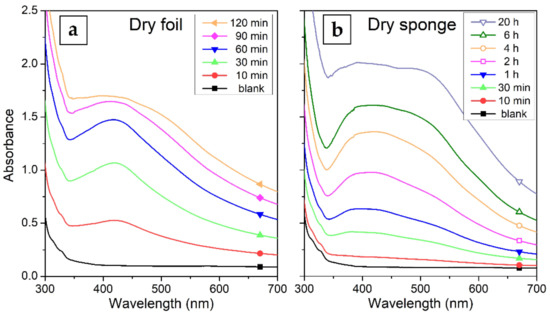
Figure 8.
UV–Vis absorption spectra of the solutes taken during the dissolution of the HPMC–AgNP composite: (a) dry foil (solutes sampled after 10–120 min dissolution) and (b) lyophilized sponge (solutes sampled after 10 min to 20 h of dissolution).
The prepared AgNP colloids in HPMC solution were also used to form thin films on glass slide substrates by spin-coating. The dependence of the prepared film thickness on HPMC concentration and rotation speed of the spin-coater calculated from the weight difference of the samples is in Figure 9. The film is obviously thicker at higher HPMC concentrations and lower rotation speeds ranging from about 180 nm at 1% HPMC and 1000 rpm to about 20 nm at 0.25% HPMC and 2000 rpm. The UV–Vis absorption spectra of the prepared composite thin films in Figure 10 shows rather than low values of absorption due to the low thickness of the prepared films. The overall absorption is not in all cases higher for the thicker prepared films, which is probably caused by inhomogeneities in the prepared thin films (e.g., in the case of the 0.5% HPMC solution, we expect the film prepared at 1000 rpm to have the highest absorbance). However, the absorption of the thin films was so low that these results could also be influenced by the uneven thickness of the glass substrates. In the case of the thin films prepared from the 0.25% and 0.5% solutions, a single SPR band is present in the spectra at about 450 and 480 nm, respectively. The spectra of the samples prepared from the 1% solutions are, on the other hand, similar to those of the colloids with the quadrupole absorption peak present. In the case of the 1% 1000 rpm sample, a strong inter-band absorption at 380 nm is present as well, which could be related to the presence of Ag agglomerates in the thin film.
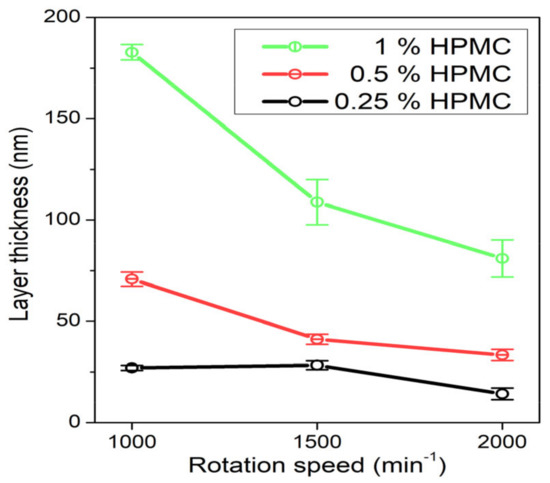
Figure 9.
Dependence of spin-coated film thickness on the rotation speed of the spin-coater table for the samples prepared from 0.25%, 0.5% and 1% HPMC colloids.
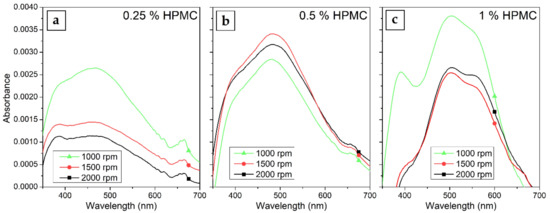
Figure 10.
UV–Vis absorption spectra of the composite HPMC–AgNP spin-coated thin films prepared from (a) 0.25%, (b) 0.5% and (c) 1% HPMC colloids at 1000–2000 rpm at spin-coater table rotation speed.
The surface morphology of the spin-coated thin films on glass slides was studied by AFM (Figure 11). The films prepared from HPMC solutions without the AgNPs show a very homogeneous and smooth surface. This shows the capability of the HPMC to form delicate thin films from solutions at the chosen preparation conditions. In the case of the films with AgNPs, the top parts of the particles can be seen sticking from the film’s smooth surface in the micrographs. The thicker films prepared from higher HPMC (particularly the 1% HPMC–AgNP sample) concentrations are able to support larger particles that rise up to about 150 nm above the film surface. Many smaller particles can be seen on the images as well, scattered on the film’s surface. With the lower thickness of the films the larger particles could not be captured in the volume of the film, therefore a higher number of smaller particles are sticking from the surface, while the larger particles were washed away from the surface during the spin-coating.
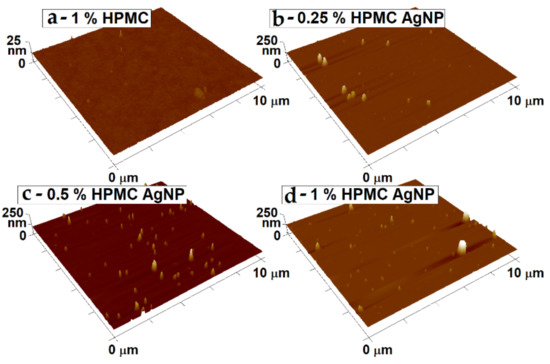
Figure 11.
Surface morphology of the blank HPMC and HPMC with AgNP thin films measured by atomic force microscopy (AFM). Notice the different z axis scale in the case of the blank HPMC sample. The thin films were prepared from: (a) 1% solution of pure HPMC; samples of AgNPs prepared in (b) 0.25%; (c) 0.5% and (d) 1% HPMC solutions.
The thin film solid samples prepared at 1000 rpm were also used to test their antibacterial activity against Gram-negative E. coli and Gram-positive S. epidermidis bacterial cells. The dispersed bacteria were kept in contact with the solid samples or colloids and cultivated afterwards. A 1% HPMC solution without the AgNPs was used to prepare the thin film for the blank test. In the case of the blank sample of clean HPMC, no significant decrease in the number of bacteria was observed in most cases, except S. epidermidis against the thin HPMC film, where the number of bacterial colonies was reduced to about one third compared with the control. All the samples with AgNPs were then able to eliminate all the bacteria from their dispersions and no bacterial colonies could then be cultivated from both the dispersions that were in contact with the solid samples or HPMC–AgNP colloids (Figure 12).
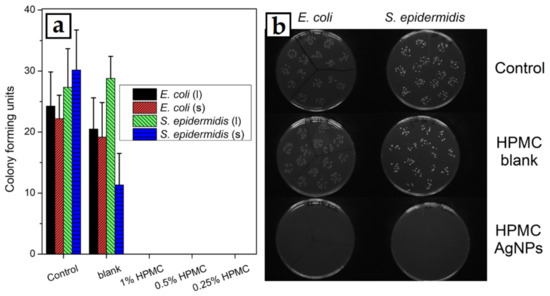
Figure 12.
(a) Results of the antibacterial activity tests of the HPMC–AgNP colloids (columns marked l) and spin-coated thin films of HPMC–AgNP composites (columns marked s) against E. coli and S. epidermidis bacterial cells. (b) Images of Petri dishes after bacterial cultivation in contact with thin-film samples prepared from pure 1% HPMC solution (HPMC blank) and from 1% HPMC solution with AgNPs (HPMC–AgNPs).
4. Discussion
AgNP colloids were prepared in HPMC solutions by photochemical reduction method without the presence of additional reducing or stabilizing agents. The reducing power of HPMC by itself was found to be insufficient (contrary to what was reported in [34]) to produce AgNPs from AgNO3. The prepared colloid dispersions were used for the simple preparation of solid composite samples by drying, lyophilization and spin-coating methods. That would not be possible if additional reducing agent was added, because the excess agent would crystallize during the drying of the colloid. Therefore, the photochemical reduction method was found to be most suitable to produce colloids that can be easily formed into solid material.
The structure, size and polydispersity of the prepared AgNPs was studied by TEM, which showed the rather wide size distribution of the prepared AgNPs. Most of the particles were found to be smaller than 100 nm in diameter. This has an effect on other parameters of the colloids, and the UV–Vis spectra showed broad SPR absorbances with dipole and quadrupole oscillations. The proposed preparation procedure and conditions should be therefore further explored to improve on the size distribution and control of the AgNP size, since in comparison to photochemically reduced AgNPs in polyvinyl pyrrolidone [31,32], the size distribution of the AgNPs was rather wide.
On the other hand, HPMC showed to be advantageous in terms of solid sample preparation. The composite foils prepared by drying at 70 °C showed good mechanical cohesion and elasticity with no tendency to break apart during manipulation with the samples. Sponges prepared by lyophilization showed a leaflet-like structure and were mechanically resilient as well. Dissolution of the foils in water showed the preferential release of smaller AgNPs with the UV–Vis spectra of the solutes showing much narrower SPR absorption than that of the original colloid. The dissolution of HPMC was gradual over the course of several hours to about 1 day, depending on the preparation method of the solid sample. This result is very promising in the sense of the controlled release of AgNPs from the functional material. The colloids were also very suitable for the preparation of thin films on glass substrates by the spin-coating method. The samples prepared in this way showed a very strong antibacterial effect against E. coli and S. epidermidis.
The prepared materials show promise for a new branch of antibacterial materials based on AgNPs. The controlled release of AgNPs from the material would take course over several hours to days and the concentration of the silver in the vicinity of the material could be controlled by the dissolution rate of the HPMC composite. Further development of the proposed material is, however, needed. The employed concentrations of AgNPs were able to eliminate bacteria in the tests easily, and the concentration could therefore be tuned to lower levels of silver content. The size dispersion of the prepared nanoparticles turned out to be rather wide and further improvements to the preparation method could be explored (e.g., better control of the seeding process, modification of the reactant concentrations or tuning the wavelength, heating and stirring during the photoreduction process). Lastly, cytotoxicity tests would need to be performed to determine the high end of the desired concentration of these particular AgNPs in the antibacterial materials.
Author Contributions
Conceptualization, O.K. and A.R.; methodology, O.K. and E.M.; validation, O.K.; formal analysis, O.K. and E.M.; investigation, E.M., B.V., P.U. and D.F.; resources, O.K. and A.R.; data curation, E.M.; writing—original draft preparation, O.K.; writing—review and editing, A.R. and V.S.; visualization, O.K.; supervision, O.K. and V.S.; project administration, O.K.; funding acquisition, V.S. All authors have read and agreed to the published version of the manuscript.
Funding
This research was funded by Czech Science Foundation (GA CR) under the project No. 20-01641S.
Conflicts of Interest
The authors declare no conflict of interest. The funders had no role in the design of the study; in the collection, analyses, or interpretation of data; in the writing of the manuscript, or in the decision to publish the results.
References
- Keat, C.L.; Aziz, A.; Eid, A.M.; Elmarzugi, N.A. Biosynthesis of nanoparticles and silver nanoparticles. Bioresour. Bioprocess. 2015, 2, 1–11. [Google Scholar] [CrossRef]
- Hebeish, A.; El-Naggar, M.E.; Fouda, M.M.G.; Ramadan, M.A.; Al-Deyab, S.S.; El-Rafie, M.H. Highly effective antibacterial textiles containing green synthesized silver nanoparticles. Carbohydr. Polym. 2011, 86, 936–940. [Google Scholar] [CrossRef]
- Tran, Q.H.; Nguyen, V.Q.; Le, A.T. Silver nanoparticles: Synthesis, properties, toxicology, applications and perspectives. Adv. Nat. Sci. Nanosci. 2013, 4, 033001. [Google Scholar] [CrossRef]
- Morley, K.S.; Webb, P.B.; Tokareva, N.V.; Krasnov, A.P.; Popov, V.K.; Zhang, J.; Roberts, C.J.; Howdle, S.M. Synthesis and characterisation of advanced UHMWPE/silver nanocomposites for biomedical applications. Eur. Polym. J. 2007, 43, 307–314. [Google Scholar] [CrossRef]
- Kokura, S.; Handa, O.; Takagi, T.; Ishikawa, T.; Naito, Y.; Yoshikawa, T. Silver nanoparticles as a safe preservative for use in cosmetics. Nanomedicine 2010, 6, 570–574. [Google Scholar] [CrossRef] [PubMed]
- De Moura, M.R.; Mattoso, L.H.; Zucolotto, V. Development of cellulose based bactericidal nanocomposites containing silver nanoparticles and their use as active food packaging. J. Food Eng. 2012, 109, 520–524. [Google Scholar] [CrossRef]
- Echegoyen, Y.; Nerín, C. Nanoparticle release from nano-silver antimicrobial food containers. Food Chem. Toxicol. 2013, 62, 16–22. [Google Scholar] [CrossRef]
- Noor, N.; Mutalik, S.; Younas, M.W.; Chan, C.Y.; Thakur, S.; Wang, F.; Yao, M.Z.; Mou, Q.; Leung, P.H. Durable antimicrobial behaviour from silver-graphene coated medical textile composites. Polymers 2019, 11, 2000. [Google Scholar] [CrossRef]
- Lee, S.H.; Jun, B.-H. Silver nanoparticles: Synthesis and application for nanomedicine. Int. J. Mol. Sci. 2019, 20, 865. [Google Scholar] [CrossRef]
- Murphy, M.; Ting, K.; Zhang, X.; Soo, C.; Zheng, Z. Current Development of silver nanoparticle preparation, investigation, and application in the field of medicine. J. Nanomater. 2015, 2015, 696918. [Google Scholar] [CrossRef]
- Kumar, S.S.D.; Rajendran, N.K.; Houreld, N.N.; Abrahamse, H. Recent advances on silver nanoparticle and biopolymer-based biomaterials for wound healing applications. Int. J. Biol. Macromol. 2018, 115, 165–175. [Google Scholar] [CrossRef] [PubMed]
- Braakhuis, H.M.; Gosens, I.; Krystek, P.; Boere, J.A.F.; Cassee, F.R.; Fokkens, P.H.B.; Post, J.A.; van Loveren, H.; Park, M.V.D.Z. Particle size dependent deposition and pulmonary inflammation after short-term inhalation of silver nanoparticles. Part. Fibre Toxicol. 2014, 11, 49. [Google Scholar] [CrossRef]
- Chernousova, S.; Epple, M. Silver as antibacterial agent: Ion, nanoparticle, and metal. Angew. Chem. Int. Ed. 2013, 52, 1636–1653. [Google Scholar] [CrossRef]
- Le Ouay, B.; Stellacci, F. Antibacterial activity of silver nanoparticles: A surface science insight. Nano Today 2015, 10, 339–354. [Google Scholar] [CrossRef]
- Slavin, Y.N.; Asnis, J.; Häfeli, U.O.; Bach, H. Metal nanoparticles: Understanding the mechanisms behind antibacterial activity. J. Nanobiotechnol. 2017, 15, 65. [Google Scholar] [CrossRef] [PubMed]
- Pareek, V.; Gupta, R.; Panwar, J. Do physico-chemical properties of silver nanoparticles decide their interaction with biological media and bactericidal action? A review. Mater. Sci. Eng. C 2018, 90, 739–749. [Google Scholar] [CrossRef]
- Jung, W.K.; Koo, H.C.; Kim, K.W.; Shin, S.; Kim, S.H.; Park, Y.H. Antibacterial activity and mechanism of action of the silver ion in Staphylococcus aureus and Escherichia coli. Appl. Environ. Microbiol. 2008, 74, 2171–2178. [Google Scholar] [CrossRef]
- Polivkova, M.; Strublova, V.; Hubacek, T.; Rimpelova, S.; Svorcik, V.; Siegel, J. Surface characterization and antibacterial response of silver nanowire arrays supported on laser-treated polyethylene naphthalate. Mater. Sci. Eng. C 2017, 72, 512–518. [Google Scholar] [CrossRef]
- Yaqoob, A.A.; Umar, K.; Ibrahim, M.N.M. Silver nanoparticles: Various methods of synthesis, size affecting factors and their potential applications–A review. Appl. Nanosci. 2020, 10, 1369–1378. [Google Scholar] [CrossRef]
- Iravani, S.; Korbekandi, H.; Mirmohammadi, S.V.; Zolfaghari, B. Synthesis of silver nanoparticles: Chemical, physical and biological methods. Res. Pharm. Sci. 2014, 9, 385–406. [Google Scholar]
- Polivkova, M.; Hubacek, T.; Staszek, M.; Svorcik, V.; Siegel, J. Antimicrobial treatment of polymeric medical devices by silver nanomaterials and related technology. Int. J. Mol. Sci. 2017, 18, 419. [Google Scholar] [CrossRef]
- Banne, S.V.; Patil, M.S.; Kulkarni, R.M.; Patil, S.J. Synthesis and characterization of silver nano particles for EDM applications. Mater. Today 2017, 4, 12054–12060. [Google Scholar] [CrossRef]
- Roy, A.; Bulut, O.; Some, S.; Mandal, A.K.; Yilmaz, M.D. Green synthesis of silver nanoparticles: Biomolecule-nanoparticle organizations targeting antimicrobial activity. RSC Adv. 2019, 9, 2673–2702. [Google Scholar] [CrossRef]
- Chintamani, R.B.; Salunkhe, K.S.; Chavan, M.J. Emerging use of green synthesis silver nanoparticle: An updated review. Int. J. Pharm. Sci. Res. 2018, 9, 4029–4055. [Google Scholar] [CrossRef]
- Irshad, A.; Sarwar, N.; Sadia, H.; Malik, K.; Javed, I.; Irshad, A.; Afzal, M.; Abbas, M.; Rizvi, H. Comprehensive facts on dynamic antimicrobial properties of polysaccharides and biomolecules-silver nanoparticle conjugate. Int. J. Biol. Macromol. 2020, 145, 189–196. [Google Scholar] [CrossRef] [PubMed]
- Lu, B.; Lu, F.; Zou, Y.; Liu, J.; Rong, B.; Li, Z.; Dai, F.; Wu, D.; Lan, G. In situ reduction of silver nanoparticles by chitosan-l-glutamic acid/hyaluronic acid: Enhancing antimicrobial and wound-healing activity. Carbohydr. Polym. 2017, 173, 556–565. [Google Scholar] [CrossRef]
- Vosmanska, V.; Kolarova, K.; Rimpelova, S.; Kolska, Z.; Svorcik, V. Antibacterial wound dressing: Plasma treatment effect on chitosan impregnation and in situ synthesis of silver chloride on cellulose surface. RSC Adv. 2015, 23, 17690–17699. [Google Scholar] [CrossRef]
- Hassabo, A.G.; Nada, A.A.; Ibrahim, H.M.; Abou-Zeid, N.Y. Impregnation of silver nanoparticles into polysaccharide substrates and their properties. Carbohydr. Polym. 2015, 122, 343–350. [Google Scholar] [CrossRef]
- Ashraf, S.; Saif-ur-Rehman; Sher, F.; Khalid, Z.M.; Mehmood, M.; Hussain, I. Synthesis of cellulose–metal nanoparticle composites: Development and comparison of different protocols. Cellulose 2014, 21, 395–405. [Google Scholar] [CrossRef]
- Vosmanska, V.; Kolarova, K.; Pislova, M.; Svorcik, V. Reaction parameters of in situ silver chloride precipitation on cellulose fibres. Mater. Sci. Eng. C 2019, 95, 134–142. [Google Scholar] [CrossRef]
- Huang, H.H.; Ni, X.P.; Loy, G.L.; Chew, C.H.; Tan, K.L.; Loh, F.C.; Deng, J.F.; Xu, G.Q. Photochemical formation of silver nanoparticles in Poly(N-vinylpyrrolidone). Langmuir 1996, 12, 909–912. [Google Scholar] [CrossRef]
- Lin, S.K.; Cheng, W.T. Fabrication and characterization of colloidal silver nanoparticle via photochemical synthesis. Mater. Lett. 2020, 261, 127077. [Google Scholar] [CrossRef]
- Dong, C.; Zhang, X.; Cai, H. Green synthesis of monodisperse silver nanoparticles using hydroxy propyl methyl cellulose. J. Alloys Compd. 2014, 583, 267–271. [Google Scholar] [CrossRef]
- Suwan, T.; Khongkhunthian, S.; Okonogi, S. Silver nanoparticles fabricated by reducing property of cellulose derivatives. Drug Discov. Ther. 2019, 13, 70–79. [Google Scholar] [CrossRef]
- Walton, W.H. Feret’s statistical diameter as a measure of particle size. Nature 1948, 162, 329–330. [Google Scholar] [CrossRef]
- Kumbhar, A.S.; Kinnan, M.K.; Chumanov, G. Multipole plasmon resonances of submicron silver particles. J. Am. Chem. Soc. 2005, 127, 12444–12445. [Google Scholar] [CrossRef] [PubMed]
- Joshi, S.C. Sol-Gel Behavior of Hydroxypropyl Methylcellulose (HPMC) in ionic media including drug release. Materials 2011, 4, 1861–1905. [Google Scholar] [CrossRef]


Publisher’s Note: MDPI stays neutral with regard to jurisdictional claims in published maps and institutional affiliations. |
© 2020 by the authors. Licensee MDPI, Basel, Switzerland. This article is an open access article distributed under the terms and conditions of the Creative Commons Attribution (CC BY) license (http://creativecommons.org/licenses/by/4.0/).