Article

Raman Study of Nanocrystalline-Doped Ceria Oxide Thin Films

by
Nursultan Kainbayev
1,2,
Mantas Sriubas
1,
Darius Virbukas
1,
Zivile Rutkuniene
1,
Kristina Bockute
1,*,
Saltanat Bolegenova
2 and
Giedrius Laukaitis
1
1
Physics Department, Kaunas University of Technology, Studentu str. 50, LT-51368 Kaunas, Lithuania
2
Department of Thermal Physics and Technical Physics, Al-Farabi Kazakh National University, 71 al-Farabi Ave., Almaty 050040, Kazakhstan
*
Author to whom correspondence should be addressed.
Coatings 2020, 10(5), 432; https://doi.org/10.3390/coatings10050432
Submission received: 20 March 2020 / Revised: 20 April 2020 / Accepted: 24 April 2020 / Published: 28 April 2020
(This article belongs to the Special Issue Electron-Beam Deposition and Modification of Functional Coatings)

Abstract

:
Samarium-doped ceria (SDC) and gadolinium-doped ceria (GDC) thin films were formed by e-beam vapor deposition on SiO2 substrate, changing the deposition rate and substrate temperature during the deposition. X-ray diffraction (XRD), scanning electron microscopy (SEM), and energy dispersive X-Ray spectrometry (EDS) were employed in order to investigate the structure ad morphology of the films. A single Raman peak describing the structure of undoped CeO2 was observed at a frequency of 466 cm−1. Doping of cerium oxide with rare-earth elements shifted the peak to lower frequencies (for Sm—462 cm−1). This shift occurs due to the increased number of oxygen vacancies in doped cerium oxide and it depends on the size and concentration factor of the dopant. It was found that wavenumbers and their intensity differed for the investigated samples, even though the peaks resembled each other in shape. The indicated bands for doped ceria originated as a result of the Raman regime (F2g) of fluorite dioxide associated with the space group (Fm3m). The observed peak‘s position shifting to a lower frequency range demonstrates the symmetric vibrations of oxygen ions around Ce4+ ions in octahedra CeO8. Raman shift to the lower frequencies for the doped samples has two reasons: an increase in oxygen vacancies caused by doping cerium oxide with rare-earth materials and the size factor, i.e., the change in frequency Δω associated with the change in the lattice constant Δa.

1. Introduction

Cerium-based materials doped with various ions (Sr2+, Ca2+, Y3+, La3+, Gd3+, and Sm3+) at different concentrations were broadly studied during the last decades due to their applications in hydrogen fuel cells, gas membranes, gas sensors, catalysts, etc. [1,2,3,4,5,6]. The composite materials CeO2–Gd2O3 and CeO2–Sm2O3 were widely used in industry because of the ease of conversion between the oxidized and reduced forms of Ce3+ ⇆ Ce4+ [7,8]. Creation of oxygen vacancies is also required in samarium-doped ceria (SDC) or gadolinium-doped ceria (GDC) because the ionic conductivity is directly proportional to the number of O2− ions. It is well known that cerium oxide demonstrates the highest oxygen-ion conductivity when the dopant concentration is 0.1–0.2 mol.%. Moreover, Sm3+- and Gd3+-doped CeO2 (SDC and GDC) exhibit the highest oxygen-ion conductivity at particular doping concentrations due to the smallest association enthalpy among the dopant cations and oxygen vacancies in the fluorite structure [9,10]. Their conductivities are higher than that of YSZ at intermediate temperatures [9].
The increased ionic conductivity of these materials arises from the higher oxygen vacancy concentration. In order to investigate the structure of cerium-based electrolytes, the use of analytical techniques is necessary. Raman spectrometry is a unique and universal method that can provide information about oxygen vacancies in the fluorite structure, phase of the material, quality, and purity. Also, it enables us to gain supplementary information on oxygen vacancies of the studied materials. The main peak of pure ceria is present at 466 cm−1 in F2g vibrational mode [11]. In this mode, only oxygen atoms can turn around the cerium ions Ce4+, and the frequency of the main peak of undoped ceria should be independent of the cation mass [12,13,14]. The Raman mode at 466 cm−1, corresponding to symmetric Ce-O8 vibrations, must be extremely sensitive to any disturbance in the symmetry of the oxygen sublattice, including changes in the oxygen stoichiometry of cerium dioxide caused by thermal treatment and/or dimensional effects. This conclusion is confirmed by analyzing the Raman spectra of cerium oxide samples doped with rare earth elements. The observed shifts in the position of lines mainly depend on the concentration of oxygen vacancies, which is determined by the content of a dopant [14]. The shift of the Raman peak to the region of lower energies appears due to the enlarged crystal lattice of cerium oxide [7,14]. The peak broadening can be explained by phonon scattering at defects (oxygen vacancies, grain boundaries). If the broadening is larger than the one that could be explained by defects, it is determined by the presence of inhomogeneous lattice tensions. CeO2 nanoparticles at high temperatures lead to irreversible changes in the position of the Raman peak, which is caused by stress relaxation and/or oxidation of nonstoichiometric cerium oxide [7,14].
Many techniques can be used for the formation of electrolytic layers, such as physical vapor deposition (PVD), chemical vapor deposition (CVD), sputtering, plasma spray, etc. CVD processes require complex chemistry and are not suitable for all substrates and devices. Thermal evaporation cannot be used for such ceramic materials because of the high melting temperature of ceramic materials; thus, it is mostly used for metallic thin film formation. Magnetron sputtering could be another option, but the deposition rate would be very low and could not be easily varied. Compared with the other vapor deposition techniques, electron beam deposition has the advantages of a high and controllable deposition rate and large deposition area. In addition, a small amount of initial material is required by using the e-beam deposition method, and the material can be evaporated from a small area. E-beam deposition is a unique and universal method allowing us to form dense thin film ceramics, to manually control the thickness of thin films, and the structural properties of the formed films [15,16,17,18,19,20].
It is possible to achieve high-power densities and high local temperatures using an electron beam. Therefore, this method is ideal for the evaporation of high-temperature oxide materials, e.g., ZrO2, CeO2, HfO2, La2O3, Nb2O5, etc. The modern systems allow controlling the e-beam power which lets us adjust it precisely and achieve any deposition rate of thin films. In comparison, only low deposition rates are possible for oxide materials using the magnetron sputtering technique. On the other hand, physical vapor deposition methods require precise technological condition adjustment in order to obtain thin films of the desired elemental composition. Impurities originating from residual gas in a vacuum chamber during physical vapor deposition can affect the film growth and its properties. During the deposition process, the evaporated particles from the vapor phase arrive at the surface of the substrate. The thin film growing process is complex and consists of several steps: nucleation, island growth, coalescence of islands, formation of polycrystalline islands and channels, development of continuous structure, and thickness growth [21,22,23]. The kinetics of these processes is strongly related to the energy and migration time on the surface of arriving atoms or atom clusters. Consequently, the substrate temperature, the deposition rate, the composition of vapor, and the pressure play a vital role in the deposition process. Due to a large number of variables, the deposition process becomes complex [22,24,25,26].
In this work, the main objective was to perform a detailed and comprehensive investigation of deposited Sm- and Gd-doped ceria thin films formed by electron beam evaporation. Moreover, the detailed analysis in terms of Raman spectrometry of structural changes in thin films due to the dopants and change of the technological parameters is presented. No data are available on the Raman spectra for SDC and GDC material deposited by this method. The present study extends the knowledge and gives a novel insight into this deposition method and the influence of the thin film structure for the possible use of these films for electrochemical applications such as solid oxide fuel cells (SOFC) and sensors.

2. Materials and Methods

Thin films (thickness ~2 μm) were formed using one of the physical vapor deposition methods, i.e., electron beam deposition. The used e-beam deposition system “Kurt J. Lesker EB-PVD 75, Hastings, UK” (Figure 1) was equipped with the electron beam evaporator located in a chamber with a vacuum level of 1.0 × 10⁻⁴ Pa, which is required to minimize the influence of the residual gas on the passage of the electron beam and to exclude the contamination from other materials of the resulting film. Such construction leads to the possibility of obtaining thin films practically free from impurities. Free diffusion of atoms of the material of the evaporator in the chamber, their rectilinear movement without colliding with residual molecules of the air components, and dispersion of the material in the chamber volume result in no chemical interaction of the evaporated material with air residues. In the present work, an initial pressure of ~2.0 × 10⁻⁴ Pa and operating pressure of ~2.0 × 10⁻² Pa were used in the evacuable chamber at the time of the experiments, minimizing the contamination with other materials of the resulting films. Five different deposition rates of 0.2 nm/s; 0.4 nm/s; 0.8 nm/s; 1.2 nm/s; and 1.6 nm/s were used, and substrate temperature was varied from 50 °C to 600 °C (in steps of 50 °C, 150 °C, 300 °C, 450 °C, and 600 °C) in order to investigate the influence of these technological parameters. Sm0.2Ce0.8O2-δ (SDC20), Sm0.15Ce0.85O2-δ (SDC15), Gd0.1Ce0.9O2-δ (GDC10), and Gd0.2Ce0.8O2-δ (GDC20) powders (Fuelcellmaterials.com) were used as evaporating materials. Ceramic powders were compressed into pellets (303.5 MPa) before evaporation. Sm- and Gd-doped ceria thin films were formed on SiO2 substrates. The substrates were ultrasonically cleaned in an ultrasonic bath filled with pure acetone for 10 min and treated in Ar+ ion plasma for 10 min before deposition. Thickness and deposition rate were controlled with an INFICON (Inficon, Bad Ragaz, Switzerland) crystal sensor.
X-ray diffraction (XRD) was employed to study the structure of thin films, i.e., the size of the crystallites and lattice constant. An X-ray diffractometer D8 Discover (Bruker AXS GmbH, Karlsruhe, Germany) at 2θ angle in a 20°–70° range using Cu Kα (λ = 0.154059 nm) radiation, 0.01° step, and Lynx eye PSD detector was used. EVA Search–Match software and PDF-2 database were applied to examine the diffraction peaks. TOPAS software was used to calculate the crystallite size and lattice constant. The crystallite size <d> of thin films was calculated using Scherrer’s equation [12]. The crystallite size d of the deposited films was estimated using the Scherrer equation:
d = 0.9 λ β cos θ
where λ is the wavelength of the X-rays (1.540562 Å), θ is the scattering angle of the main reflection, and β is the corrected peak full-width at half-maximum (FWHM) intensity.
Scanning Electron Microscopy (SEM) (Hitachi, S-3400N, Hitachi High-Technologies Corporation, Tokyo, Japan) was employed to evaluate the surface morphology. Energy-dispersive X-ray spectrometry (EDS, Bruker AXS Microanalysis GmbH, Karlsruhe, Germany) was used to determine the elemental composition of thin films; 532 nm wavelength laser and diffraction grating 1800 gr/mm offering a spectral resolution of 1 cm−1 and a scan time of 30 s were used in a Raman spectrometer (Confocal Raman spectrometer Solver Spectrum (NT-MDT). The laser input power was 20 mW, the diameter of the laser spot was 2 µm, and a 14 mW laser power was the output. Measurements were performed at room temperature. Positions of Raman peaks were studied by fitting the data to the Lorentz line shape using a peak fit option in OriginPro (OriginLab Corporation, Northampton, MA, USA) software.

3. Results

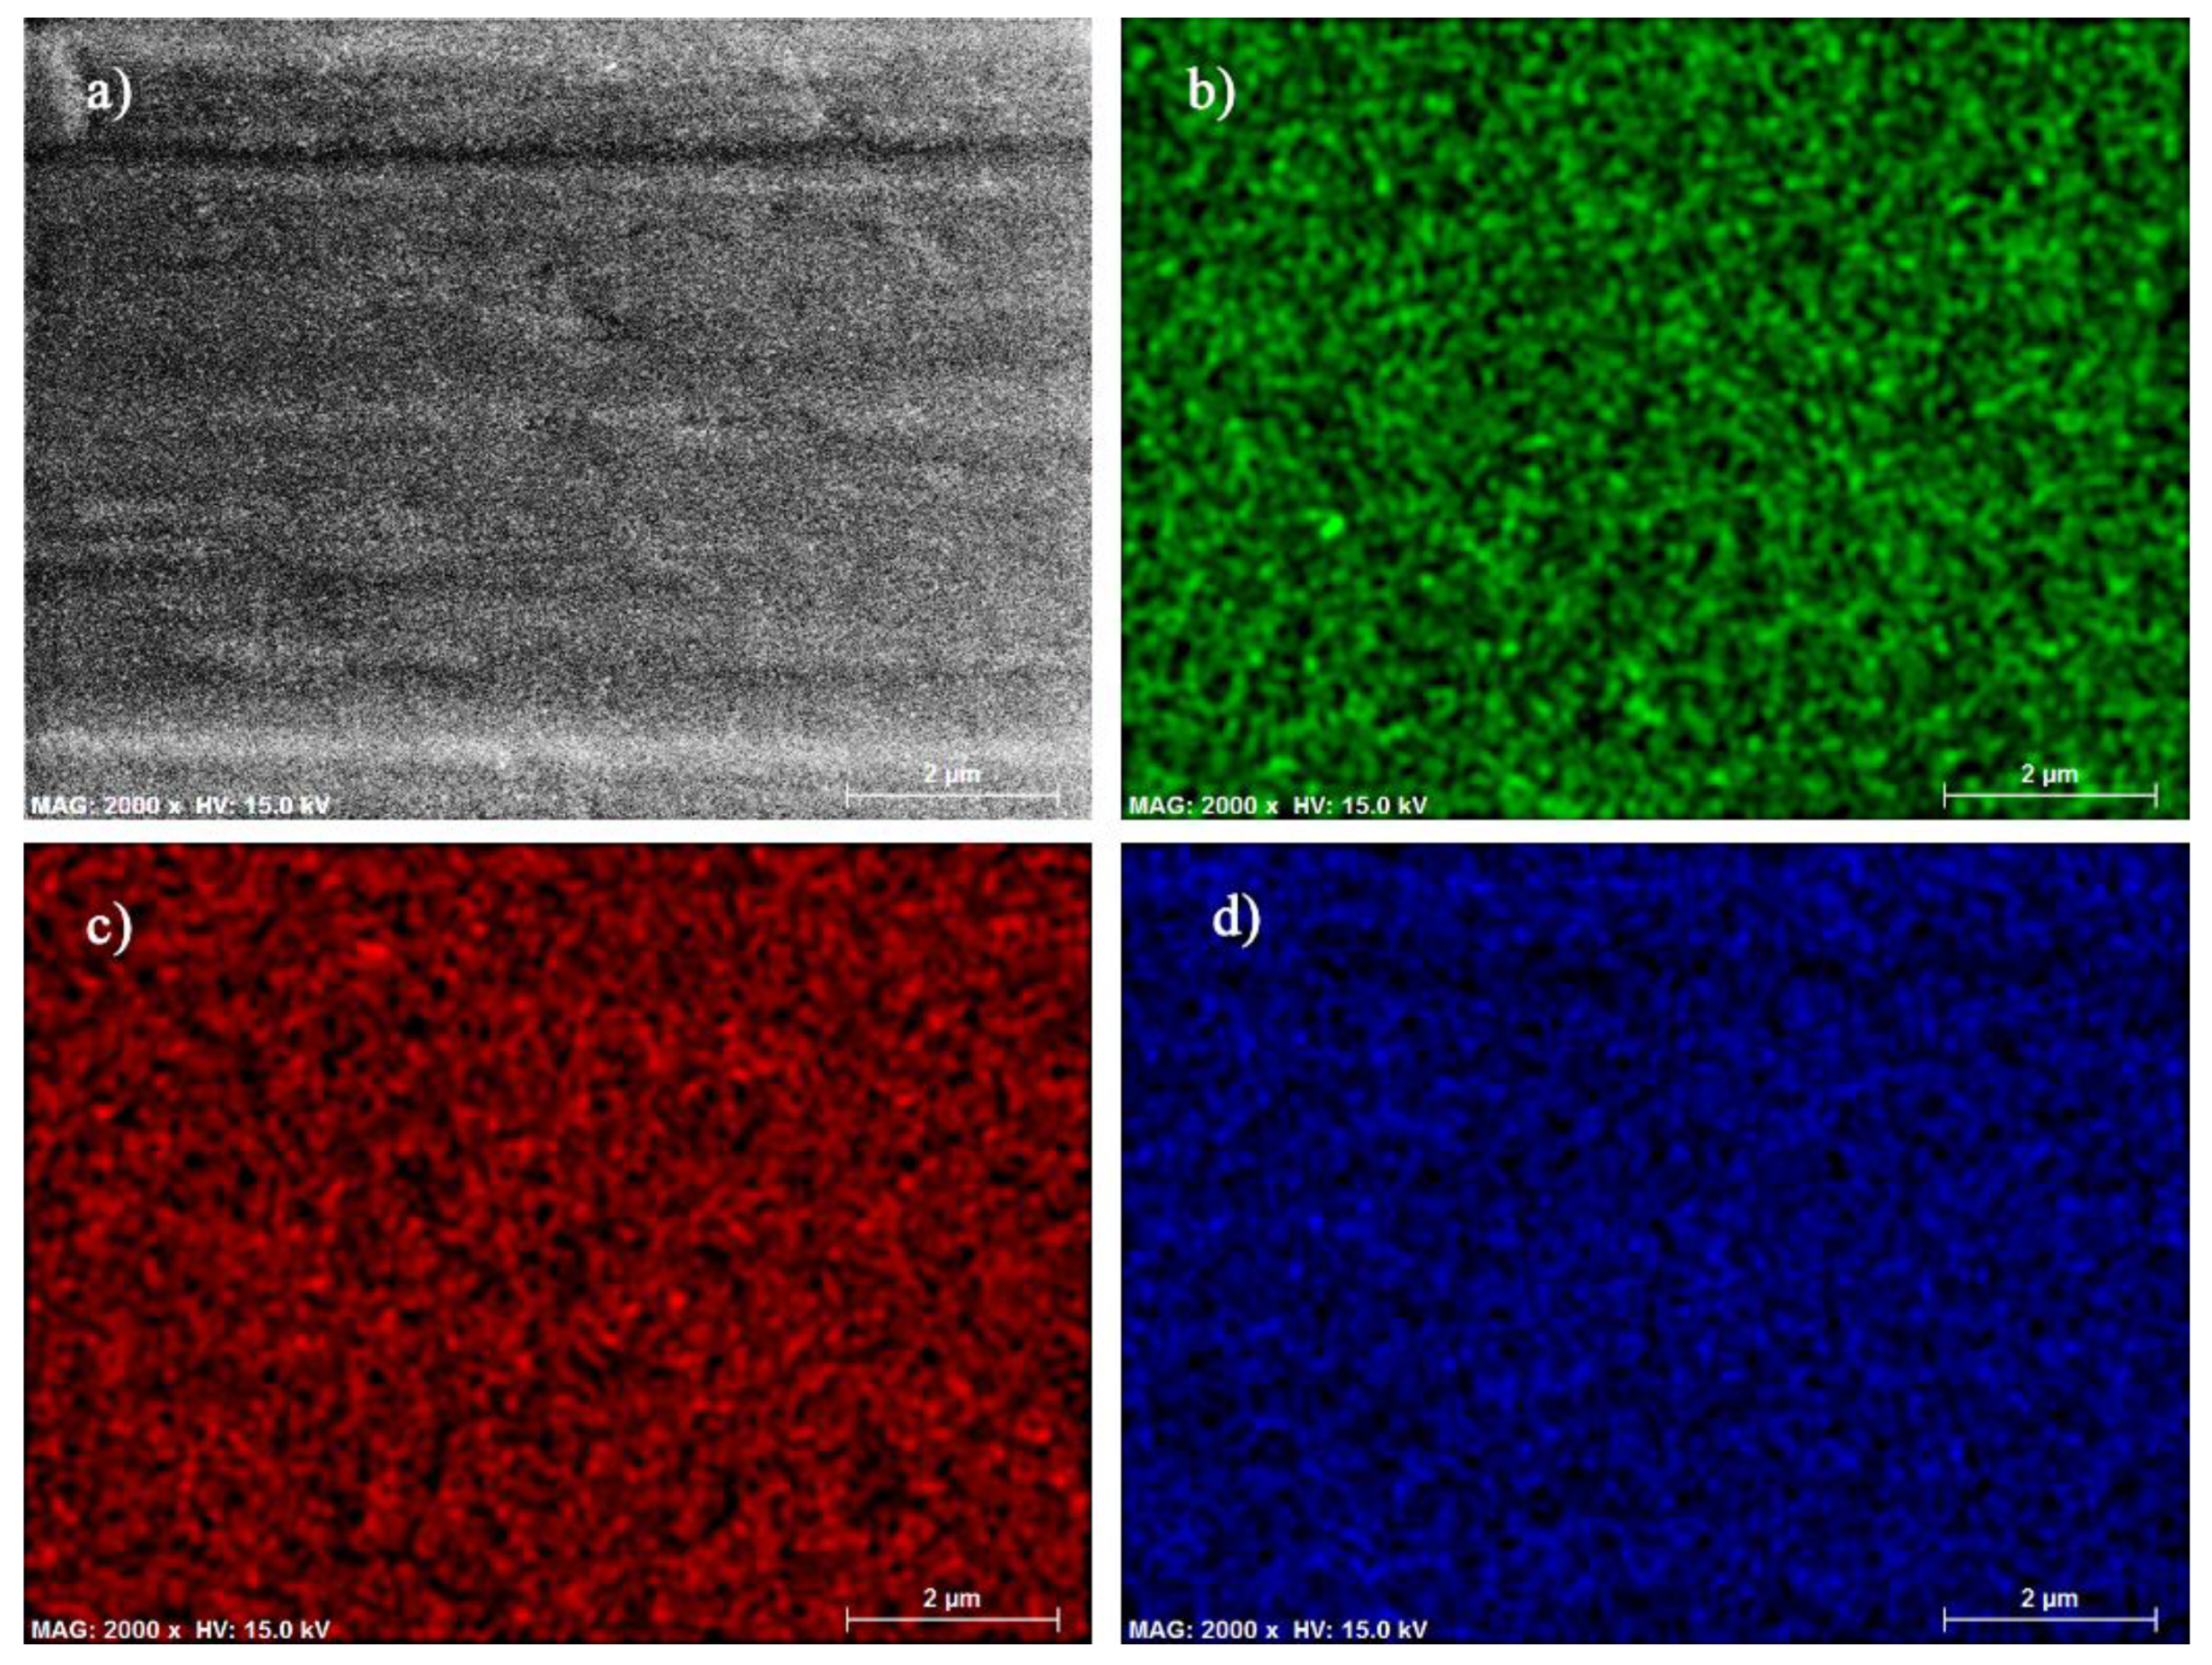
According to the EDS measurements, the composition of the produced thin films was distinct from the nominal composition of the powders mainly due to the atomistic process of the evaporation. However, thin films consisted purely of the initial powder elements (Table 1). It was also observed that the deposition rate had a minor influence on the elemental composition. The EDS mapping images (Figure 2) proved that the distribution of elements in thin films was uniform. There were no cluster elements visible.
All deposited thin films were homogeneous. The dopant concentration did not influence the morphology of thin films because the dopant concentration was far from a solubility limit of ceria (~45 mol%). Thin films formed a columnar and dense structure (Figure 3). However, the morphology of thin films depends on the deposition rate; more precisely, the orientation and the size of the grains. The morphology decreases when the deposition rate increases due to the growing number density of nucleation center on the surface of the substrates at higher deposition rates.
X-ray diffraction (XRD) analysis showed that the studied thin films (GDC10, GDC20, SDC15, SDC20) had a single-phase and fluorite structure with space group Fm3m. The positions of characteristic peaks proved that X-ray diffraction patterns of SDC20 thin films had typical peaks, associated with crystallographic orientations (111), (200), (220), (311), (222), and (400) (Figure 4). Thin films had dominant (111) crystallographic orientation and minor (200), (220), (311), and (222) orientations because islands tend to grow on lower energy surfaces (γ111 < γ200 < γ220) [27]. The peak intensity of preferred crystallographic orientation (111) decreased with increasing deposition rate and increased with increasing substrate temperature. The peak intensity is associated with the deposition energy of the particles and the number of nucleation centers. Adatoms migrated into larger clusters with increasing temperature and formed larger crystallites. Moreover, a higher number of nucleation centers formed at a higher deposition rate, which constrained the growth of crystallites. For these reasons, the intensities of the peaks changed [25].
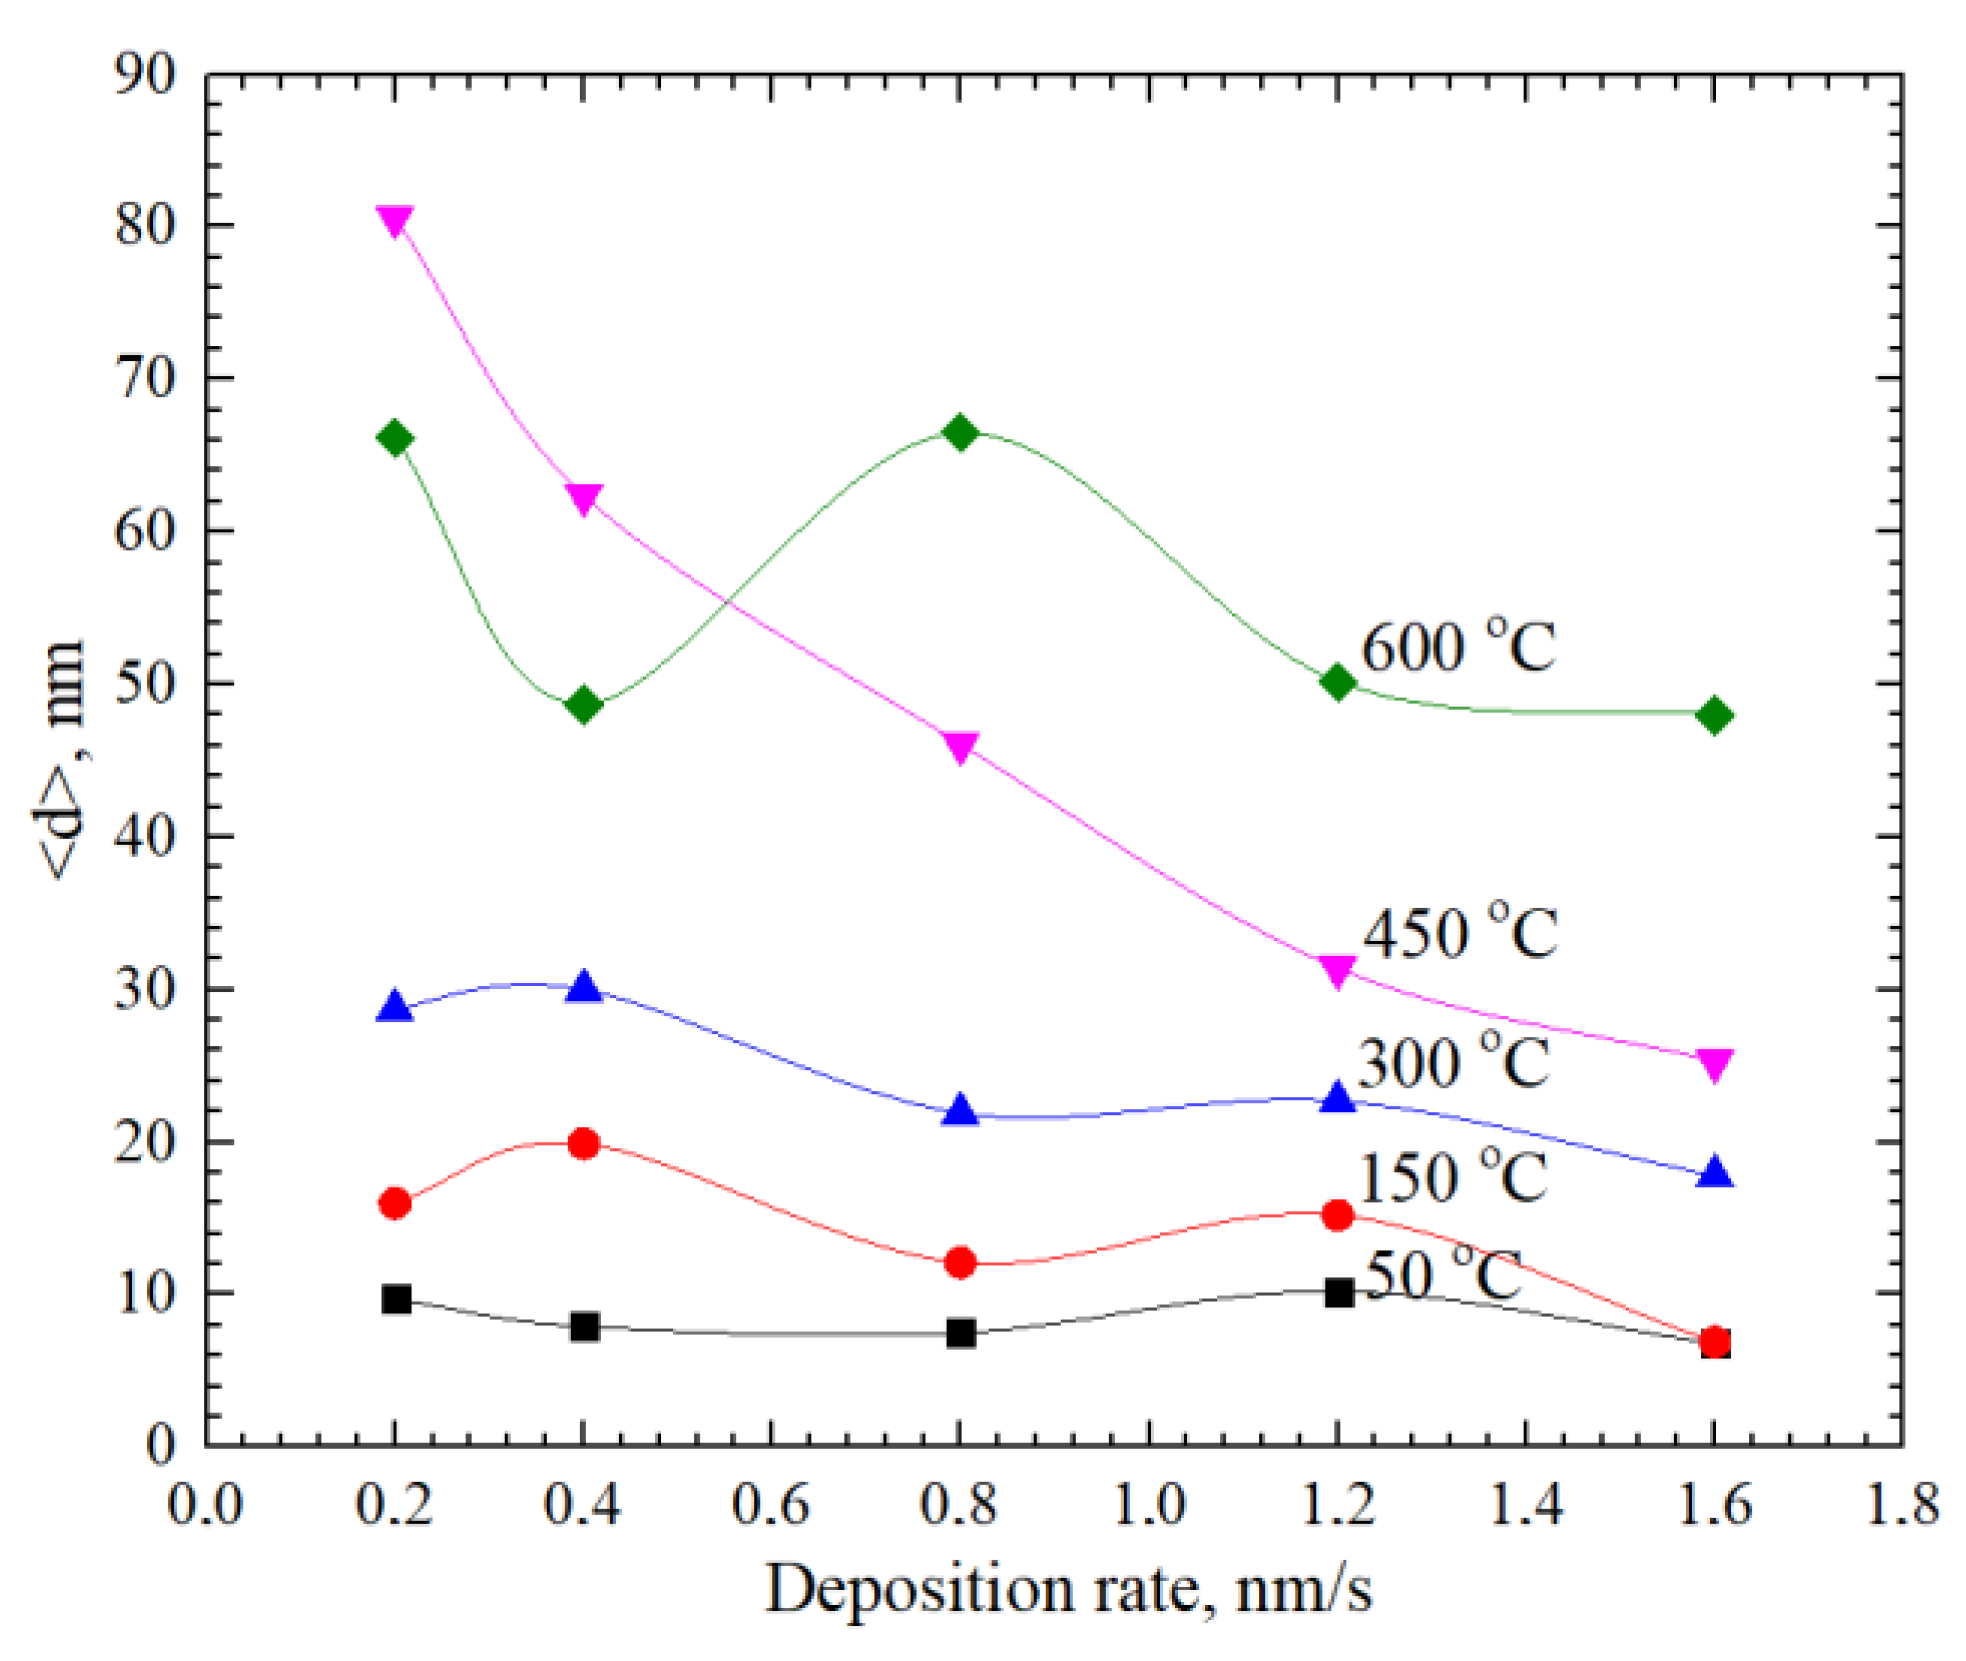
The crystallite size depended on the temperature of the substrate and the deposition rate (Figure 5) and it was higher using substrates of higher temperature during the deposition (9.7–80.6 nm). The deposition rate had little effect on the crystallite size at low deposition temperatures (lower than 300 °C). However, at high temperatures (450 °C and 600 °C) and low deposition rates (lower than 0.8 nm/s), fluctuations of crystallite size appeared.
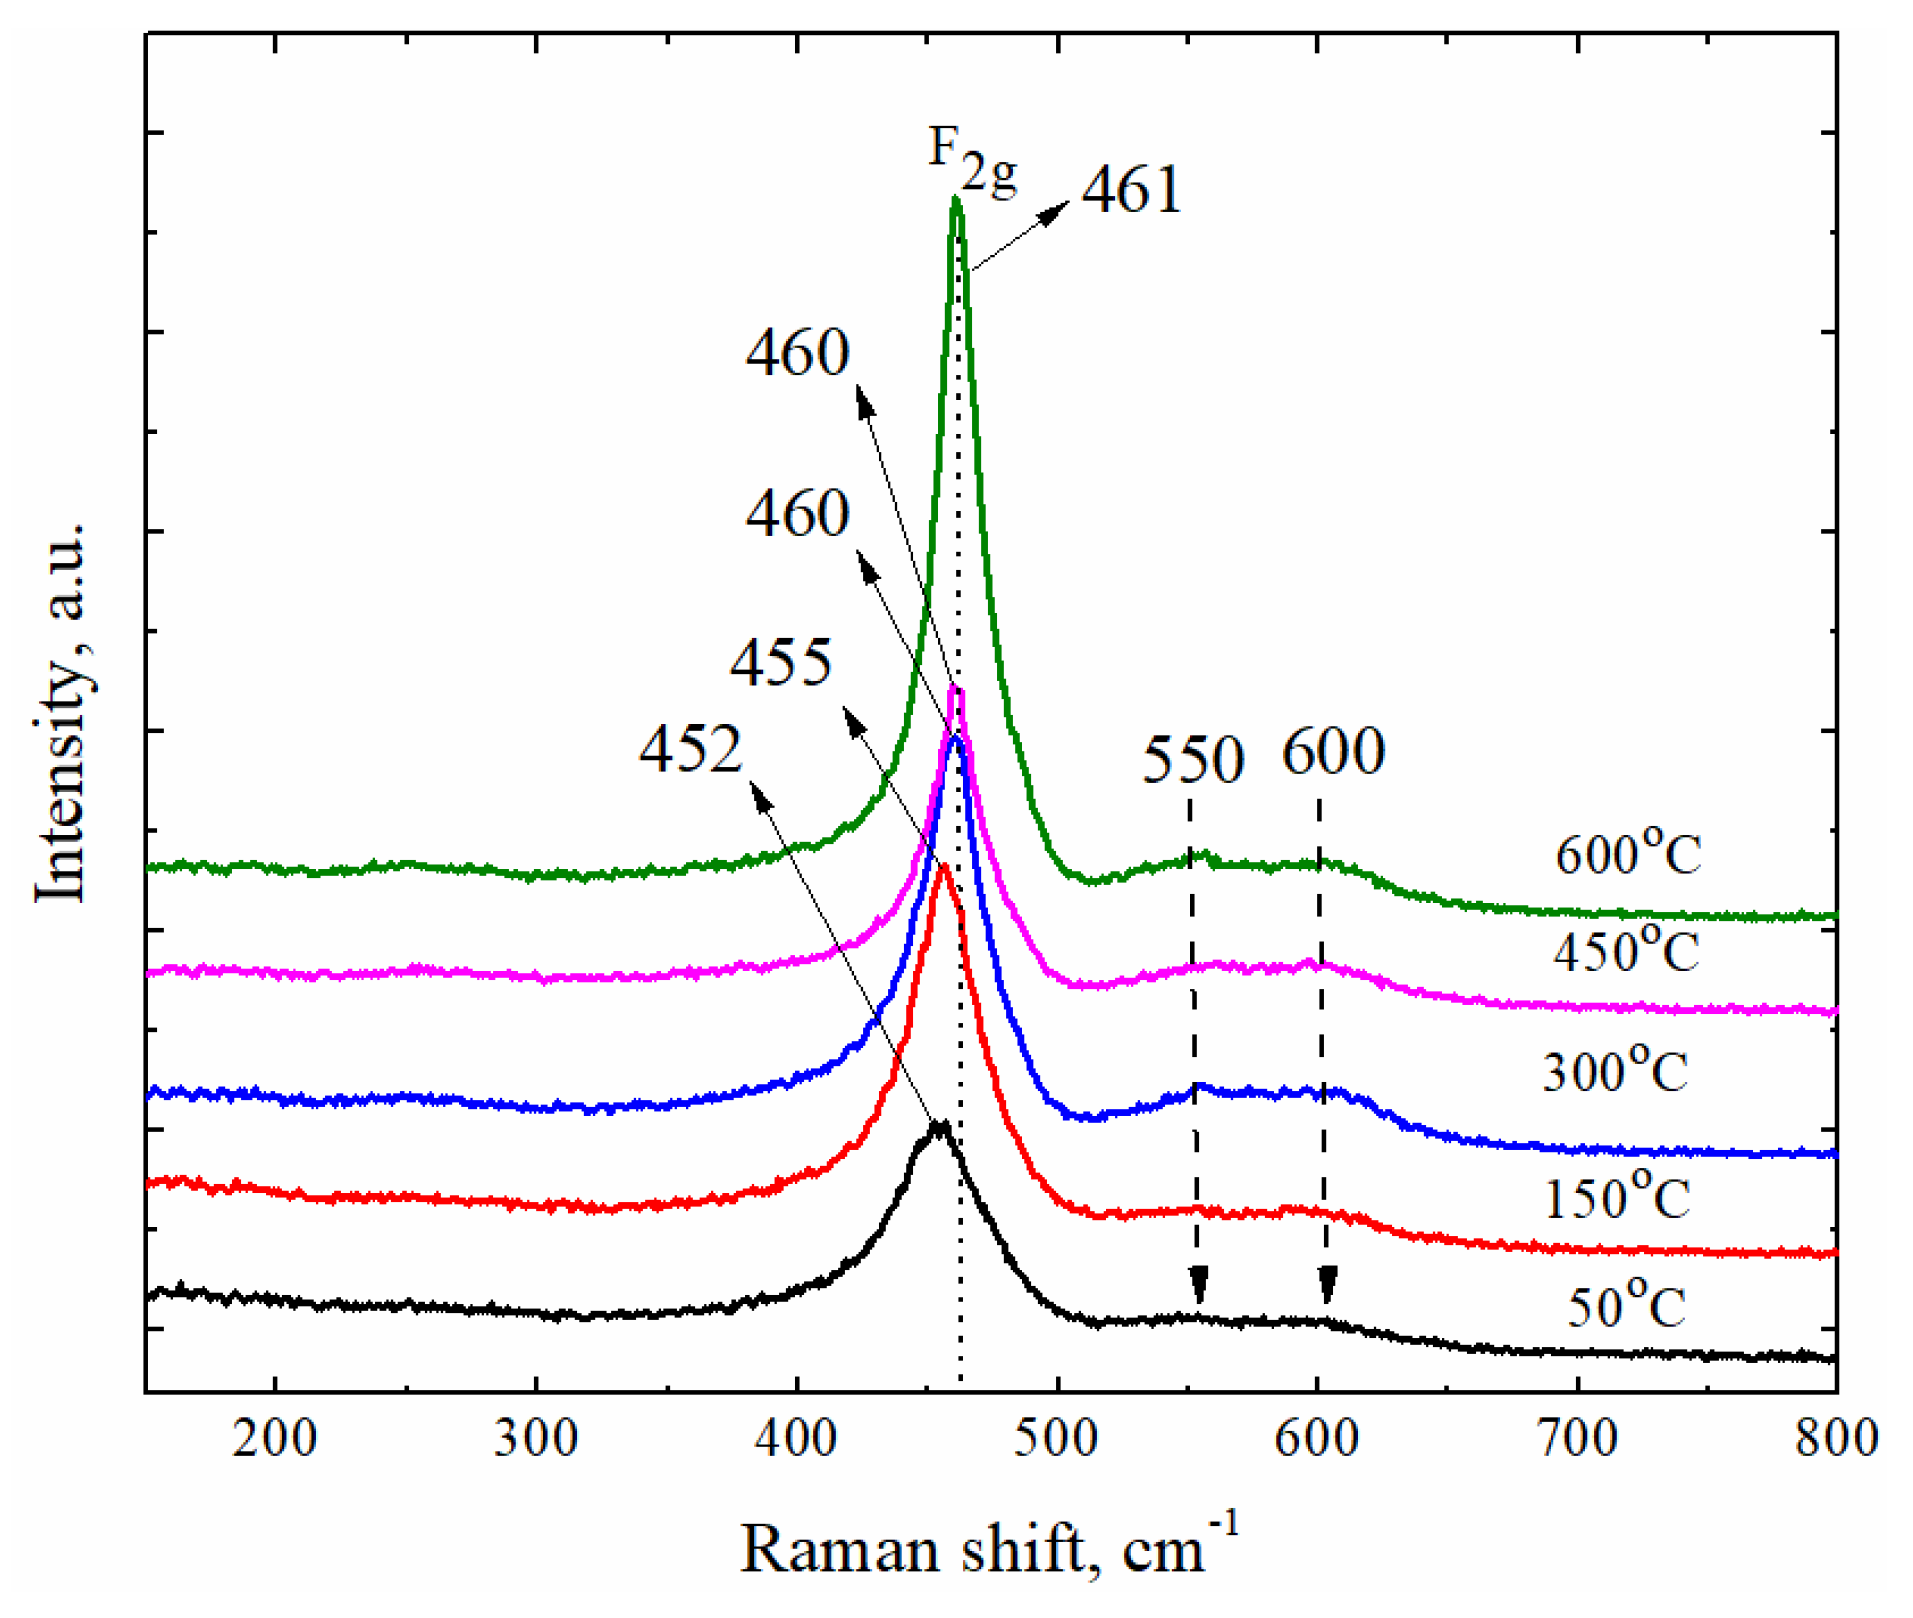
In the investigated fluorite structure, only oxygen atoms can move, and the frequency of this mode should be independent of the cation mass. [14]. Characteristics of the peaks are very sensitive to the disorder induced in the oxygen ion sublattice of the cerium oxide, in particular, the position and the width of the peaks [12,13,28]. The introduction of Sm and Gd induced changes in the crystal lattice and affected the surroundings of oxygen around the metal ions. As a consequence, the shift of the peak position and narrowing of the width in the Raman spectra were observed (Figure 6).
The F2g modes, particularly, first-order peaks inherent to cerium oxide, shifted (by 2 cm−1 to 14 cm−1) to the lower region. It was found that wavenumbers and their intensity differed for the investigated samples, even though the peaks resembled each other in shape. The peak positions were examined by fitting the data to the Lorentz line shape. The basic mode for GDC10 was in the range from 459 to 462 cm−1, for GDC20 in the range from 458 to 461 cm−1, for SDC15 in the range from 460 to 463 cm−1, and for SDC20 in the range from 452 to 464 cm−1 (Table 2). The indicated bands for doped ceria originated as a result of the Raman regime (F2g) of fluorite dioxide associated with the space group Fm3m [29]. The peak position which is in accordance with the F2g mode corresponded to the symmetric vibrations of oxygen ions around Ce4+ ions in octahedra CeO8 [14,28,29,30]. The Raman shift in the mode corresponded to the particle size effect, lattice constant, and crystallite size.
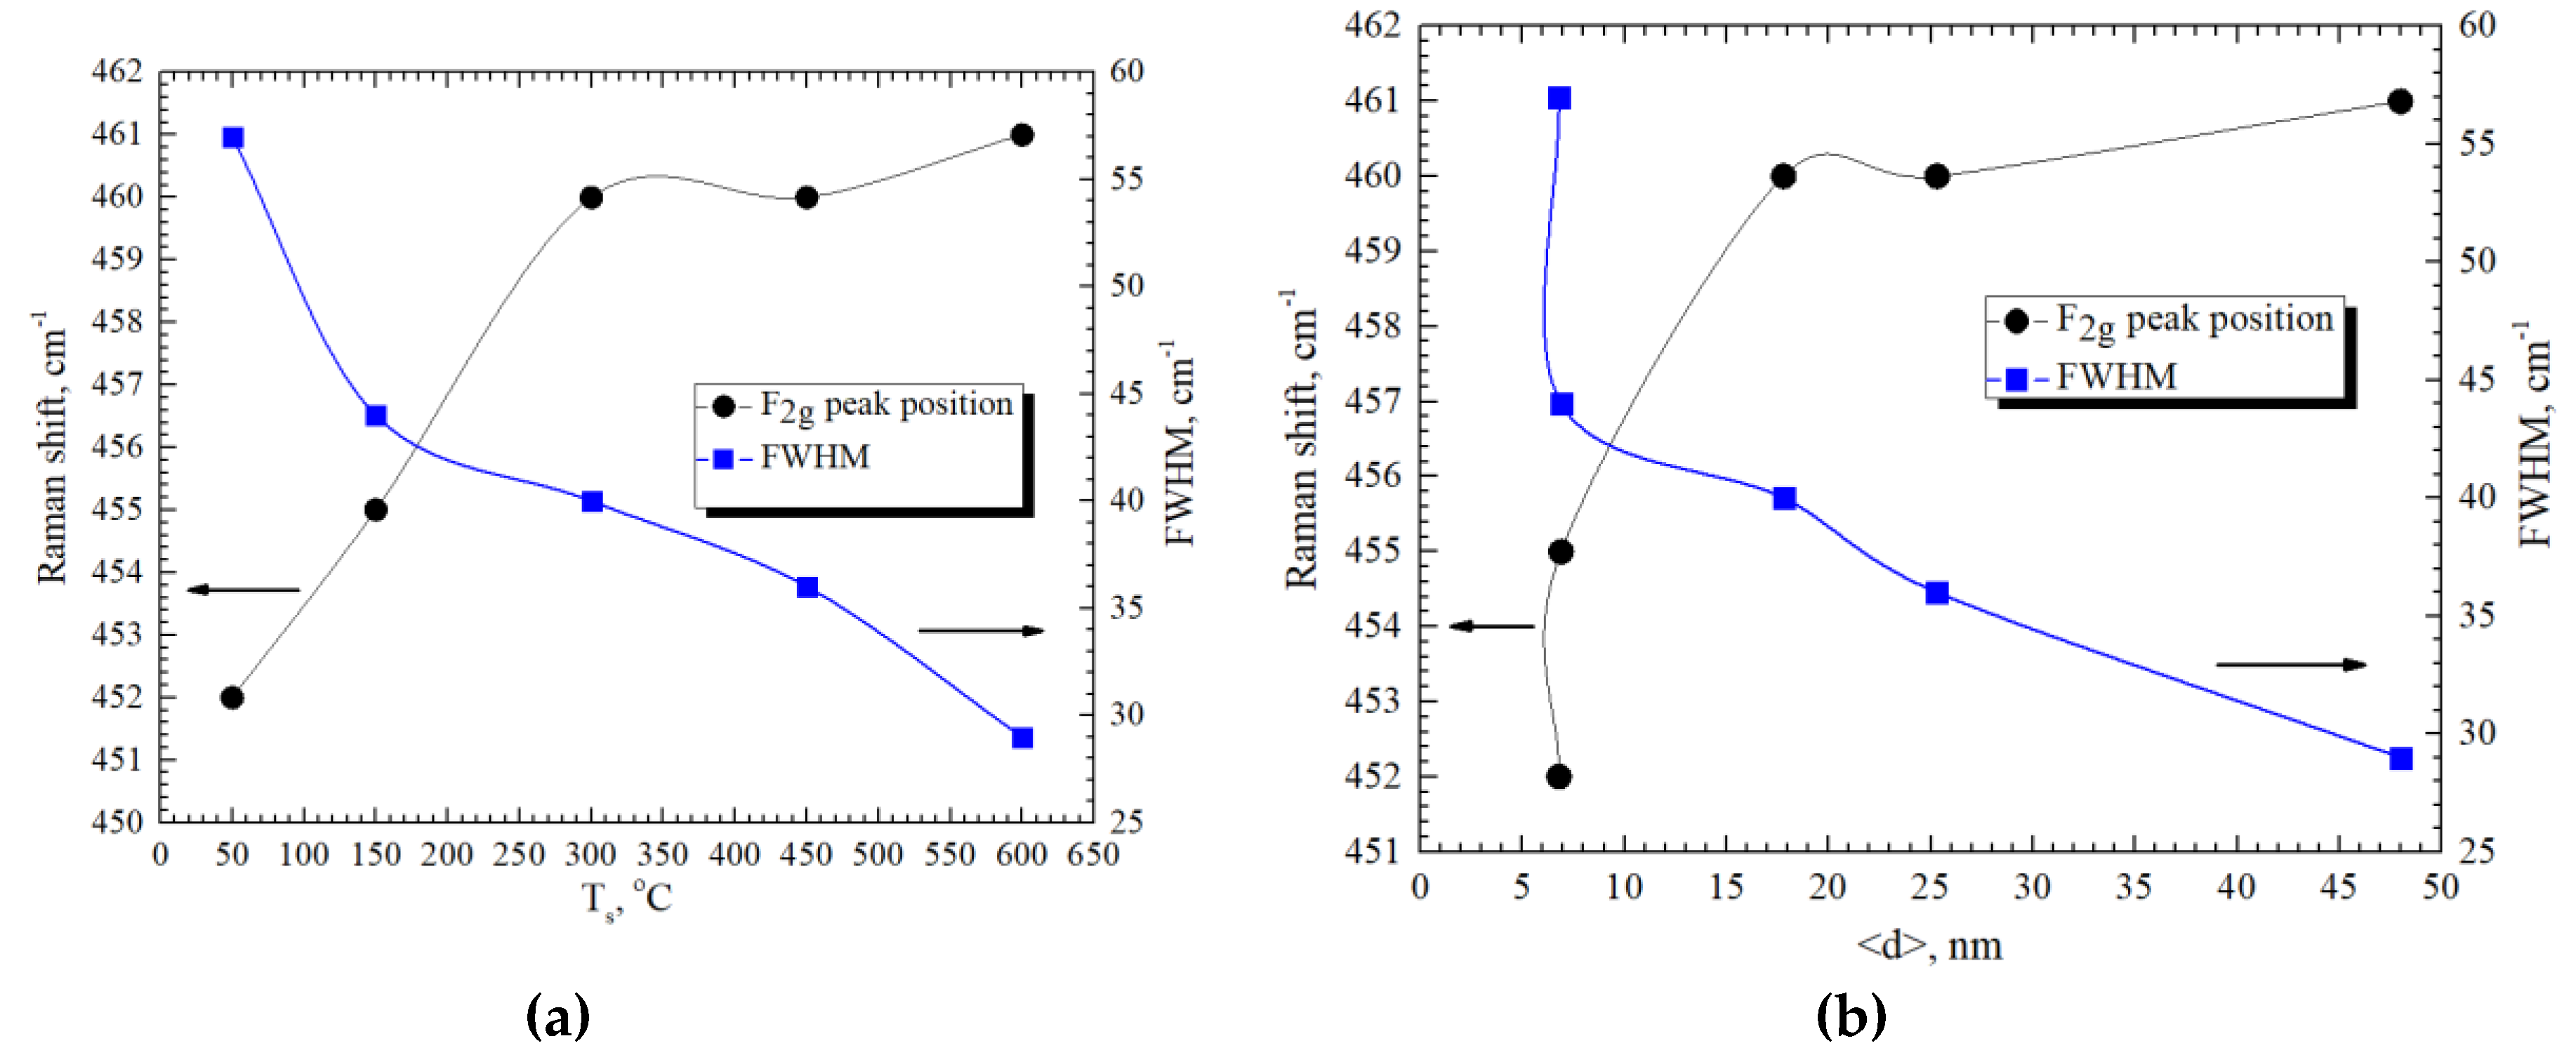
The shifting of F2g peaks increased with increasing substrate temperature (Figure 7a) whereas the full-width at half-maximum (FWHM) of the main peak narrowed, showing that structural reorganization occurred, and higher crystallinity of the thin films was reached. It is known that the temperature of the substrate has an impact on the crystallinity of thin films. Therefore, the same tendency was observed when analyzing the position of F2g peak dependence on the crystallite size (Figure 7b). The authors of [11,31,32,33] noted that the Raman mode at 464 cm−1 is sensitive to a change in the oxygen stoichiometry of CeO2−x due to the size effects. The decrease in the size of CeO2−x nanoparticles leads to systematic changes in the Raman spectra, the shift of the Raman peak to lower energies caused by an increase in the crystal cell parameter of CeO2-x and broadening of the peak determined by inhomogeneous lattice tensions.
The Raman shift depended on the dopant concentration (Table 3). Raman spectra shifted to the lower frequency wave side by increasing the dopant concentration. The dependence of the F2g mode peak position on dopant concentration is in good agreement with other authors [11,29]. The Raman shift and broadening of the line can also be described by the dependence of its FWHM upon the dopant concentration. The FWHM of GDC10, GDC20, SDC15, and SDC20 thin films increased by increasing the Sm and Gd dopant concentration. The Raman shift to lower frequencies and increase of FWHM for the doped samples are due to an increase in oxygen vacancies caused by doping cerium oxide with rare-earth materials and the size factor, i.e., the change in frequency Δω is associated with a change in the lattice constant Δa [14,34]:
Δ ω = 3 γ ω 0 Δ a / a 0  
where ω0, and a0 are the Raman frequency and the lattice constant of CeO2, respectively, γ = 1.24 is the Gruneisen parameter, the value of which was calculated in [12,13,14,34,35].
It is proved that the Raman shift displacement is attributed to the different crystallinity as well as to the different size of crystallites. The Gd and Sm dopants introduced in ceria lattice created defects that result in a Raman peak shift. The higher concentration of dopants creates more vacancies in the material and that influences the Raman peak displacement. The larger displacement occurs when thin films have a smaller crystallite size and that depends on the dopant concentration. The change of the F2g mode peak position with respect to crystallite size (GDC10, GDC20, SDC15, and SDC20) is presented in Figure 8. The main peak displacement of GDC20 occurred for the 12 nm crystallites whereas the large displacement of the main peak of GDC10 occurred for the 14 nm crystallites (Figure 8a). The same tendency was observed for samarium-doped ceria thin films (Figure 8b). FWHM was inversely proportional to the crystallite size.
Raman peaks become wider and more asymmetric and that could be influenced by the presence of oxygen vacancies [34]. Peak asymmetry and shift in the F2g mode (Figure 9) can be interpreted by the alteration in M-O vibration frequency after Gd and Sm introduction to the ceria structure. Two supplementary wide peaks appeared at 540–550 cm−1 and 600 cm−1 (Figure 9) because of the oxygen vacancies and were seen in all samples. The peak position at 540–550 cm−1 corresponds to oxygen vacancies, generated as charge compensation defects induced by the introduction of other metal cations into the crystal lattice of CeO2 to maintain the charge neutrality when Ce4+ ions are replaced by Gd3+ ions, which create extrinsic vacancies [29]. The peak position at 600 cm−1 originated due to the non- stoichiometry oxygen vacancy in CeO2 by reducing Ce4+ to Ce3+ [28,29,30,36,37,38,39].
The observed pattern of changes in the cell size was caused by a gradual decrease in the effective degree of cerium oxidation because of the partial elimination of the oxygen ions from the surface by creating oxygen vacancies. According to [33], the critical particle size at which the total Ce3+–Ce4+ transition is observed is 1.9 nm. In comparison, Raman peaks have positions that were expressed only on Sm-doped ceria thin films formed on Si (100) substrates. The observed intense band at 459 cm−1 for doped cerium oxide was due to the Raman regime F2g of fluorite. The peaks at 303 cm−1 and 415 cm−1 were also attributed to the respective Fg + Eg and Ag modes for samarium [14,29,36,40]. In addition, there was a peak position at 520 cm−1 belonging to silicon, coming from the substrate. Additional peaks at 552 cm−1 and 605 cm−1 were due to oxygen vacancies [29]. The vibrational modes corresponding to any free sesquioxides of rare-earth elements (Sm2O3, Gd2O3) did not appear in the Raman peaks at 360 cm−1 [41].

4. Conclusions

Gd- and Sm-doped ceria thin films retain the crystalline structure of the initial evaporated powder, irrespective of the concentration of dopants in the powder composition. It was found that the concentration of samarium and gadolinium in the formed films varied depending on the deposition rate. The thin films exhibited a single-phase structure with a fluorite-type face-centered cubic arrangement. The characteristic crystallographic orientations (111), (200), (220), (311), (222), and (400) were observed. The deposition temperature influenced the crystallite size, resulting in larger crystallites at higher deposition temperatures. The major Raman peak of undoped ceria was at 466 cm−1 and conformed to the F2g vibrational mode. The most significant shift from 466 cm−1 to 452 cm−1 was indicated for SDC 20 thin films (crystallite size—6.8 nm), and the smallest shift from 466 cm−1 to 464 cm−1 occurred for the peak related to the pure cerium when Sm-doped ceria (SDC 20) thin films were deposited on SiO2 (crystallite size—48.7 nm). The peaks of doped cerium oxide were similar to each other in shape, but the dopant amount had an influence on their positions and the intensities of peaks. The Raman peak (466 cm−1 corresponding to undoped ceria) shifted to the lower frequency range from 2 cm−1 to 14 cm−1 for the doped ceria thin films, which was likely affected by a larger number of oxygen vacancies and the size factor, i.e., a change in frequency of Δω associated with a change in the lattice constant Δa.

Author Contributions

Conceptualization, M.S., G.L., and N.K.; methodology, K.B. and Z.R.; formal analysis, D.V., M.S., and K.B.; investigation, D.V., N.K., M.S., and Z.R.; writing—original draft preparation, M.S., N.K., K.B., Z.R., D.V., S.B and G.L.; writing—review and editing, M.S., N.K., K.B., Z.R., D.V., S.B. and G.L.; visualization, N.K. and S.B.; supervision, G.L. All authors have read and agreed to the published version of the manuscript.

Funding

This research received no external funding.

Acknowledgments

We would like to thank Center for Hydrogen Energy Technologies of Lithuanian Energy Institute (LEI) for the technical support to make the experiments and analysis of the formed thin films.

Conflicts of Interest

The authors declare no conflict of interest.

References

  1. Xia, Y.; Liu, X.; Bai, Y.; Li, H.; Deng, X.; Niu, X.; Wu, X.; Zhou, D.; Wang, Z.; Meng, J. Electrical properties optimization of calcium Co-doping system: CeO2–Sm2O3. Int. J. Hydrog. Energy 2012, 37, 11934–11940. [Google Scholar] [CrossRef]
  2. Sun, C.; Li, H.; Chen, L. Nanostructured ceria-based materials: Synthesis, properties, and applications. Energy Environ. Sci. 2012, 5, 8475. [Google Scholar] [CrossRef]
  3. Wachsman, E.D.; Lee, K.T. Lowering the temperature of solid oxide fuel cells. Science 2011, 334, 935–939. [Google Scholar] [CrossRef]
  4. Aboud, A.A.; Al-Kelesh, H.; El Rouby, W.M.; Farghali, A.A.; Hamdedein, A.; Khedr, M.H. CO2 responses based on pure and doped CeO2 nano-pellets. J. Mater. Res. Technol. 2018, 7, 14–20. [Google Scholar] [CrossRef]
  5. Florea, M.; Postole, G.; Urdă, A.; Neaţu, F.; Massin, L.; Gelin, P.; Matei-Rutkovska, F. Influence of Gd and Pr doping on the properties of ceria: Texture, structure, redox behaviour and reactivity in CH4/H2O reactions in the presence of H2S. Catal. Sci. Technol. 2018, 8, 1333–1348. [Google Scholar] [CrossRef]
  6. He, D.; Hao, H.; Chen, D.; Liu, J.; Yu, J.; Lu, J.; Liu, F.; Wan, G.; He, S.; Luo, Y. Synthesis and application of rare-earth elements (Gd, Sm, and Nd) doped ceria-based solid solutions for methyl mercaptan catalytic decomposition. Catal. Today 2017, 281, 559–565. [Google Scholar] [CrossRef]
  7. Anjaneya, K.; Manjanna, J.; Nayaka, G.; Kumar, V.A.; Govindaraj, G.; Ganesha, K. Citrate-complexation synthesized Ce0.85Gd0.15O2−δ (GDC15) as solid electrolyte for intermediate temperature SOFC. Phys. B Condens. Matter 2014, 447, 51–55. [Google Scholar] [CrossRef]
  8. Arai, H.; Kunisaki, T.; Shimizu, Y.; Seiyama, T. Electrical properties of calcia-doped ceria with oxygen ion conduction. Solid State Ion. 1986, 20, 241–248. [Google Scholar] [CrossRef]
  9. Pergolesi, D.; Gilardi, E.; Fabbri, E.; Roddatis, V.; Harrington, G.F.; Lippert, T.K.; Kilner, J.A.; Traversa, E. Interface effects on the ionic conductivity of doped ceria–yttria-stabilized zirconia heterostructures. ACS Appl. Mater. Interfaces 2018, 10, 14160–14169. [Google Scholar] [CrossRef]
  10. Tuller, H. Ionic conduction in nanocrystalline materials. Solid State Ion. 2000, 131, 143–157. [Google Scholar] [CrossRef] [Green Version]
  11. Anwar, M.; Kumar, S.; Arshi, N.; Ahmed, F.; Seo, Y.; Lee, C.; Koo, B.H. Structural and optical study of samarium doped cerium oxide thin films prepared by electron beam evaporation. J. Alloys Compd. 2011, 509, 4525–4529. [Google Scholar] [CrossRef]
  12. Vinodkumar, T.; Rao, B.G.; Reddy, B.M. Influence of isovalent and aliovalent dopants on the reactivity of cerium oxide for catalytic applications. Catal. Today 2015, 253, 57–64. [Google Scholar] [CrossRef]
  13. Kosacki, I.; Suzuki, T.; Anderson, H.U.; Colomban, P. Raman scattering and lattice defects in nanocrystalline CeO2 thin films. Solid State Ion. 2002, 149, 99–105. [Google Scholar] [CrossRef]
  14. Sal’Nikov, V.V.; Pikalova, E. Raman and impedance spectroscopic studies of the specific features of the transport properties of electrolytes based on CeO2. Phys. Solid State 2015, 57, 1944–1952. [Google Scholar] [CrossRef]
  15. Pederson, L.; Singh, P.; Zhou, X.-D. Application of vacuum deposition methods to solid oxide fuel cells. Vacuum 2006, 80, 1066–1083. [Google Scholar] [CrossRef]
  16. Arunkumar, P.; Ramaseshan, R.; Dash, S.; Basu, J.; Ravindran, T.R.; Balakumar, S.; Babu, K.S.; Pandiyan, A. Texturing of pure and doped CeO2 thin films by EBPVD through target engineering. RSC Adv. 2014, 4, 33338. [Google Scholar] [CrossRef]
  17. Scagliotti, M. Plasma-sprayed zirconia electrolytes. Solid State Ion. 1988, 28, 1766–1769. [Google Scholar] [CrossRef]
  18. Song, H.; Xia, C.; Meng, G.; Peng, D. Preparation of Gd2O3 doped CeO2 thin films by oxy-acetylene combustion assisted aerosol-chemical vapor deposition technique on various substrates and zone model for microstructure. Thin Solid Film. 2003, 434, 244–249. [Google Scholar] [CrossRef]
  19. Zarkov, A.; Stanulis, A.; Mikoliunaite, L.; Katelnikovas, A.; Ramanauskas, R.; Tautkus, S.; Jasulaitiene, V.; Kareiva, A. Chemical solution deposition of pure and Gd-doped ceria thin films: Structural, morphological and optical properties. Ceram. Int. 2017, 43, 4280–4287. [Google Scholar] [CrossRef]
  20. Hong, Y.; Kim, S.; Kim, W.; Yoon, H.H. Fabrication and characterization GDC electrolyte thin films by e-beam technique for IT-SOFC. Curr. Appl. Phys. 2011, 11, S163–S168. [Google Scholar] [CrossRef]
  21. Petrov, I.; Barna, P.B.; Hultman, L.; Greene, J. Microstructural evolution during film growth. J. Vac. Sci. Technol. A 2003, 21, S117–S128. [Google Scholar] [CrossRef]
  22. Barna, P.; Adamik, M. Fundamental structure forming phenomena of polycrystalline films and the structure zone models. Thin Solid Film. 1998, 317, 27–33. [Google Scholar] [CrossRef]
  23. Panomsuwan, G.; Takai, O.; Saito, N. Effect of growth temperature on structural and morphological evolution of epitaxial SrTiO3 thin films grown on LaAlO3 (001) substrates by ion beam sputter deposition. Vacuum 2014, 109, 175–179. [Google Scholar] [CrossRef]
  24. Kaiser, N. Review of the fundamentals of thin-film growth. Appl. Opt. 2002, 41, 3053–3060. [Google Scholar] [CrossRef]
  25. Guenther, K.H. Revisiting structure-zone models for thin-film growth. In Proceedings of the 34th Annual International Technical Symposium on Optical and Optoelectronic Applied Science and Engineering, San Diego, CA, USA, 8–13 July 1990. [Google Scholar]
  26. Watanabe, K.; Sunahara, K.; Fujima, T. Method for Vapor Depositing A Cerium Oxide Film. U.S. Patent 4,242,373, 30 December 1980. [Google Scholar]
  27. Wang, S.; Tian, E.; Lung, C. Surface energy of arbitrary crystal plane of bcc and fcc metals. J. Phys. Chem. Solids 2000, 61, 1295–1300. [Google Scholar] [CrossRef]
  28. Souza, E.C.C.; Brito, H.; Muccillo, E. Optical and electrical characterization of samaria-doped ceria. J. Alloys Compd. 2010, 491, 460–464. [Google Scholar] [CrossRef]
  29. Acharya, S.A.; Gaikwad, V.; D’Souza, S.; Barman, S.R. Gd/Sm dopant-modified oxidation state and defect generation in nano-ceria. Solid State Ion. 2014, 260, 21–29. [Google Scholar] [CrossRef]
  30. Kuo, Y.-L.; Su, Y.-M.; Chang, J.-Y. A facile method for the deposition of Gd2O3-doped ceria films by atmospheric pressure plasma jet. Thin Solid Film. 2014, 570, 215–220. [Google Scholar] [CrossRef]
  31. Wiktorczyk, T.; Bieganski, P.; Zielony, E. Preparation and optical characterization of e-beam deposited cerium oxide films. Opt. Mater. 2012, 34, 2101–2107. [Google Scholar] [CrossRef]
  32. Graham, G. Empirical method for determining CeO2-particle size in catalysts by raman spectroscopy. J. Catal. 1991, 130, 310–313. [Google Scholar] [CrossRef]
  33. Weber, W.H.; Hass, K.C.; McBride, J.R. Raman study of CeO2: Second-order scattering, lattice dynamics, and particle-size effects. Phys. Rev. B 1993, 48, 178–185. [Google Scholar] [CrossRef]
  34. Sato, T.; Tateyama, S. Temperature dependence of the linewidth of the first-order Raman spectrum for crystalline CeO2. Phys. Rev. B 1982, 26, 2257–2260. [Google Scholar] [CrossRef]
  35. Spanier, J.E.; Robinson, R.D.; Zhang, F.; Chan, S.-W.; Herman, I.P. Size-dependent properties of CeO2−y nanoparticles as studied by Raman scattering. Phys. Rev. B 2001, 64, 245407. [Google Scholar] [CrossRef] [Green Version]
  36. Anjaneya, K.; Nayaka, G.; Manjanna, J.; Govindaraj, G.; Ganesha, K. Studies on structural, morphological and electrical properties of Ce0.8Ln0.2O2−δ (Ln = Y3+, Gd3+, Sm3+, Nd3+ and La3+) solid solutions prepared by citrate complexation method. J. Alloys Compd. 2014, 585, 594–601. [Google Scholar] [CrossRef]
  37. Anjaneya, K.; Nayaka, G.; Manjannaa, J.; Govindaraj, G.; Ganesha, K. Preparation and characterization of Ce1−xGdxO2−δ (x = 0.1–0.3) as solid electrolyte for intermediate temperature SOFC. J. Alloys Compd. 2013, 578, 53–59. [Google Scholar] [CrossRef]
  38. Mishra, M.; Kuppusami, P.; Reddy, V.R.; Ghosh, C.; Divakar, R.; Ramaseshan, R.; Singh, A.; Thirumurugesan, R.; Mohandas, E. Influence of CeO2 layer thickness on the properties of CeO2/Gd2O3 multilayers prepared by pulsed laser deposition. Vacuum 2015, 113, 64–74. [Google Scholar] [CrossRef]
  39. Tsunekawa, S.; Sivamohan, R.; Ito, S.; Kasuya, A.; Fukuda, T. Structural study on monosize CeO2-x nano-particles. Nanostruct. Mater. 1999, 11, 141–147. [Google Scholar] [CrossRef]
  40. Lair, V.; Živković, L.; Lupan, O.; Ringuedé, A. Synthesis and characterization of electrodeposited samaria and samaria-doped ceria thin films. Electrochim. Acta 2011, 56, 4638–4644. [Google Scholar] [CrossRef]
  41. Chaubey, N.; Wani, B.N.; Bharadwaj, S.; Chattopadhyaya, M. Physicochemical properties of rare earth doped ceria Ce0.9Ln0.1O1.95 (Ln = Nd, Sm, Gd) as an electrolyte material for IT-SOFC/SOEC. Solid State Sci. 2013, 20, 135–141. [Google Scholar] [CrossRef]
Figure 1. PVD system illustration.
Coatings 10 00432 g001
Figure 2. EDS mapping images of SDC 20 thin films deposited on 50 °C temperature substrates using a 1.6 nm/s deposition rate: (a) topographic image, (b) Samarium (Sm Lα), (c) Cerium (Ce Lα), (d) Oxygen (O Kα).
Coatings 10 00432 g002
Figure 3. SEM pictures of SDC20 thin ceramic films deposited on 450 °C temperature substrates using deposition rates of (a) 0.2 nm/s, (b) cross-section 0.2 nm/s, (c) 0.8 nm/s, (d) 1.6 nm/s.
Coatings 10 00432 g003
Figure 4. XRD patterns of SDC20 thin films deposited on SiO2 substrates at (a) a 0.4 nm/s deposition rate and different substrate temperatures;( b) temperature of the substrate, 50 °C, at different deposition rates.
Coatings 10 00432 g004
Figure 5. Change of SDC20 crystallite size with the respect to deposition rate from 0.2 nm/s to 1.6 nm/s.
Coatings 10 00432 g005
Figure 6. Raman spectra of Sm-doped ceria (SDC20) thin films deposited on SiO2 substrates at different substrate temperatures from 50 °C to 600 °C and deposition rate 1.6 nm/s.
Coatings 10 00432 g006
Figure 7. Change of the F2g mode peak position and FWHM with respect to (a) substrate temperature and (b) crystallite size of SDC20 on SiO2 substrates and using the deposition rate of 1.6 nm/s.
Coatings 10 00432 g007
Figure 8. Change of the F2g mode peak position with respect to crystallite size for (a) GDC10, GDC20 samples; (b) SDC15, SDC20 samples.
Coatings 10 00432 g008
Figure 9. Raman spectra of different compositions of Gd- and Sm-doped ceria thin films deposited on SiO2 substrates at different deposition rates, i.e., GDC10 and GDC20 at 1.2 nm/s, SDC15 and SDC20 at 0.8 nm/s.
Coatings 10 00432 g009
Table 1. Elemental concentration of deposited thin films (600 °C deposition temperature).
GDC10-TC (BET 6.44 m2/g), mol %
Element\deposition rate0.2 nm/s0.4 nm/s0.8 nm/s1.2 nm/s1.6 nm/sInitial powder
O258.457.559.458.860.248.7
Ce34.335.435.136.735.743.3
Gd7.37.15.54.54.18.0
SDC15-TC (BET 8.0 m2/g), mol %
Element\deposition rate0.2 nm/s0.4 nm/s0.8 nm/s1.2 nm/s1.6 nm/sInitial powder
O259.456.659.459.761.457.8
Ce34.136.033.732.333.035.1
Sm6.57.36.98.05.67.1
GDC20-TC (BET 5.8 m2/g), mol %
Element\deposition rate0.2 nm/s0.4 nm/s0.8 nm/s1.2 nm/s1.6 nm/sInitial powder
O258.357.057.259.258.053.7
Ce35.135.533.235.034.535.6
Gd6.67.59.65.87.510.7
SDC20-TC (BET 6.2 m2/g), mol %
Element\deposition rate0.2 nm/s0.4 nm/s0.8 nm/s1.2 nm/s1.6 nm/sInitial powder
O271.072.271.971.872.766.8
Ce25.623.724.021.523.526.5
Sm3.44.14.15.93.86.7
Table 2. Raman spectra of the F2g mode peak position on the thin films deposited on SiO2 substrate at different substrate temperatures from 50 °C to 600 °C.
Temperature, °CGDC10GDC20SDC15SDC20
50 °C459 cm−1458 cm−1460 cm−1452 cm−1
150 °C461 cm−1460 cm−1462 cm−1455 cm−1
300 °C460 cm−1461 cm−1461 cm−1460 cm−1
450 °C462 cm−1461 cm−1462 cm−1460 cm−1
600 °C462 cm−1461 cm−1463 cm−1464 cm−1
Table 3. Change of the F2g mode peak position and FWHM with respect to dopant concentration and lattice constant GDC10, GDC20, SDC15, and SDC20 thin films.
ParametersGDCSDC
c, mol%10201520
a, Å5.425.445.435.44
Raman shift, cm−1462459460457
FWHM, cm−131364346