Article

Influence of Molybdenum and Tungsten on the Formation of Zirconium Oxide Coatings on a Steel Base

1
D.V. Sokolsky Institute of Fuel, Catalysis and Electrochemistry, JSC, 142, Kunaev Str., Almaty 050010, Kazakhstan
2
Faculty of Chemistry and Chemical Technology, Al-Farabi Kazakh National University, 71, Al-Farabi Ave., Almaty 050040, Kazakhstan
3
Department of Innovative Materials and Corrosion Protection, D.I. Mendeleev University of Chemical Technology of Russia, 9, Miusskaya Sq., 125047 Moscow, Russia
*
Author to whom correspondence should be addressed.
Coatings 2021, 11(1), 42; https://doi.org/10.3390/coatings11010042
Submission received: 11 December 2020 / Revised: 24 December 2020 / Accepted: 28 December 2020 / Published: 2 January 2021

Abstract

:
In this paper, we have developed conditions for the deposition of zirconium oxide coatings from solutions containing hexafluorozirconic acid as well as tungsten and molybdenum salts on a steel base. Based on electrochemical studies, it was shown that the addition of tungsten and molybdenum salts to the solution to deposit zirconium oxide coatings led to the inhibition of the anodic process of iron ionization. It was shown that the optimal conditions for the deposition of oxide-zirconium coatings on the surface of steel samples from a solution of 0.2 g/L Zr (IV) + 0.15 g/L W (VI) + 0.1 g/L Mo (VI) were a deposition temperature of 30 °C and time of 10 min. The thickness of the oxide-zirconium coatings formed under these conditions was 64.72 nm, the adhesion value was 3.17 MPa/s, and the corrosion resistance was 26 s according to Akimov’s drop method. The depth of corrosive penetration, determined in the salt fog chamber, did not exceed 2 mm after 240 h of testing, meeting the requirements for adhesive layers under the paintwork.

1. Introduction

One of the most common methods for protecting metal structures from corrosion is the deposition of anti-corrosion protective coatings. The priorities for improving anti-corrosion coating deposition processes include increasing the protective and other functional properties. In the process of deposition of anti-corrosion coatings, it is necessary to further reduce the environmental hazard that these processes involve, as well as the concentration of the solutions used and the temperature and time for deposition of protective coatings. Recently, ceramic coatings have been gaining in popularity since they have high thermal and electrical resistance and are also more resistant to oxidation, corrosion [1,2,3,4,5,6,7,8], erosion, and wear in high-temperature environments. Diamond nanoparticles, as well as those of other chemical compounds used for the deposition of hard coatings (SiC, ZrO2, and Al2O3), are commercially available, with a particle size in the range of 4–300 nm. Some of the most promising ceramic coatings are nanostructured zirconium oxide layers containing zirconium dioxide (ZrO2) [9,10]. Zirconium dioxide deposited from a solution provides the formation of chemical bonds of the produced film with both the metal base and with the subsequent paint and varnish coating. According to the literature [11,12], solutions for the formation of such coatings, in addition to hexafluorozirconic acid, should contain heavy metal ions such as nickel, copper, chromium, cobalt, and molybdenum, etc. Heavy metal ions form active centers that contribute to the deposition of zirconium oxide produced as a result of hydrolysis of hexafluorozirconic acid at pH 4.5 and 5.5 and room temperature [13,14,15]. In this work, we consider the combined effect of Mo (VI) and W (VI) ions on the formation of a zirconium oxide coating on the surface of steel samples. Since corrosion processes can be represented through a course of cathodic and anodic processes on a metal surface, the cyclic voltammetry method was used to study the corrosion resistance of the formed anticorrosive coatings. The method of cyclic voltammetry makes it possible to obtain independent information on the processes occurring on steel samples during the deposition of oxide-zirconium coatings, and at the same time to assess the degree of their corrosion resistance [7,16]. The corrosion resistance of the formed oxide-zirconium coatings was determined by the ionization current of the iron electrode at a certain potential. The proposed electrochemical method for assessing the anticorrosion resistance of coatings on steel samples can be used to establish the qualitative and quantitative composition of phosphating solutions and control the anticorrosive activity of the formed oxide-zirconium coatings.

2. Materials and Methods

2.1. Material

The reagents sodium sulfate (Na2SO4), hexafluorozirconic acid (H2ZrF6) solution 50 wt.% in water, (NH4)6Mo7O24, and C(NH4)10W12O41·nH2O of “Pure” and “Chemically Pure” grades and distilled water were used.

2.2. Sample Preparation

Plates of cold-rolled steel (grade Art. 08ps) were used as samples. The steel composition is shown in Table 1.
Pretreatment of metal plates was carried out by degreasing in an aqueous alkaline detergent composition with a concentration of 15–20 g/L at a temperature of 60–65 °C for 2–10 min. Then, the surface of metal plates was cleaned with abrasive material, followed by washing with distilled water.
The deposition of the oxide-zirconium coating was carried out at room temperature with stirring on a rotating unit RDE710 with a rotation speed of 500 rpm. Using a pH meter I-130, (Tokyo, Japan) the allowable pH range of coating formation was established. After coating, the plates were dried at a temperature of 130 °C.

2.3. Methods

Electrochemical studies included cyclic voltammetry. Cyclic volt–ampere curves were recorded using the potentiostat–galvanostat Gamry Reference 3000 (Warminster, PA, USA), in a sealed three-electrode cell at 25 °C. The working electrode was a steel (grade Art. 08ps) electrode with a visible surface of 0.03 cm2. The counter electrode was a platinum electrode with a surface of 2 cm2. An Ag/AgCl electrode, for which the potential was 196 mV relative to the hydrogen electrode, was used as a reference electrode. Cyclic volt–ampere curves were recorded in the potential range from −0.3 to −1.2 V. Before fixing the cyclic current–voltage curves, the working electrode surface was updated using MIRKA 2000 (JEPPO, Finland). Emery paper was washed with distilled water, then polished on a paper filter (blue tape), and finally washed with distilled water. The used electrolyte was a solution of 0.3 M Na2SO4 [16].
Corrosion tests of adhesive oxide-zirconium coatings with paint were carried out in an Alcott S450iP salt fog chamber (Staffordshire, UK) in accordance with the international standard ASTM B117 [17].
The thickness of the coatings was determined using a SER 800 spectroscopic ellipsometer (SENTECH Instruments GmbH, Krailling, Germany), which makes it possible to accurately measure the thickness and optical characteristics of both monolayer films and multi-layer film structures during deposition. Measurements were performed in the spectral range of light wavelengths of 240–1000 nm [18].
For an accelerated assessment of the coating’s protective ability a rapid method using Akimov’s reagent (a solution containing CuSO4·5H2O, NaCl, and HCl) was used [19]. According to this method, the protective ability of the coating (ASA) is estimated in seconds as the time necessary for a color change from gray to red-brown to take place with a drop of solution in in the control area. In accordance with this method, the corrosion resistance of the oxide-zirconium coating was evaluated using the time (s) taken for a color change from gray to red-brown to take place using a drop of the control solution on the surface of the coating.
The adhesion strength of the coatings was determined by the method of normal separation (the method of fungi) using the digital adhesiometer Posi Test AT (New York, NY, USA). The method is based on measuring the minimum breaking stress required to separate or tear the coating in the direction perpendicular to the substrate surface.
The morphology of the surfaces of the coated specimens was studied using an MPLAPONLEXT 100 lens with the LEXT-OSL 4100 confocal laser microscope (OLYMPUS Corporation, Tokyo, Japan) [20].

3. Results

To obtain independent information on the processes occurring on steel samples, during the deposition of ceramic coatings, cyclic voltammetric curves were obtained on an iron electrode in the presence of hexafluorozirconic acid and Mo (VI) and W (VI) metal ions, which affect the protective ability of the formed oxide-zirconium coatings. Cyclic volt–ampere curves were recorded in the potential range from −0.3 to −1.2 V.
Figure 1 shows the cyclic volt–ampere curves obtained on iron electrode at a constant concentration of Zr (IV). Electrolyte: 0.3 M Na2SO4 + 0.2 g/L Zr (IV).
In Figure 1, the cathode maximum (A) is observed on the cyclic volt-ampere curves at a potential of −1.0 V.
In Figure 1, a cathode maximum (A) is observed on the cyclic volt-ampere curves at a potential of −1.0 V due to the electric reduction of hydroxide compounds formed on the surface of the steel electrode during anodic polarization. In the anodic part of the cyclic volt–ampere curves, with an increase in the number of cycles, a shift of the ionization potential of the iron electrode to the positive region was also observed, indicating an increase in its corrosion resistance.
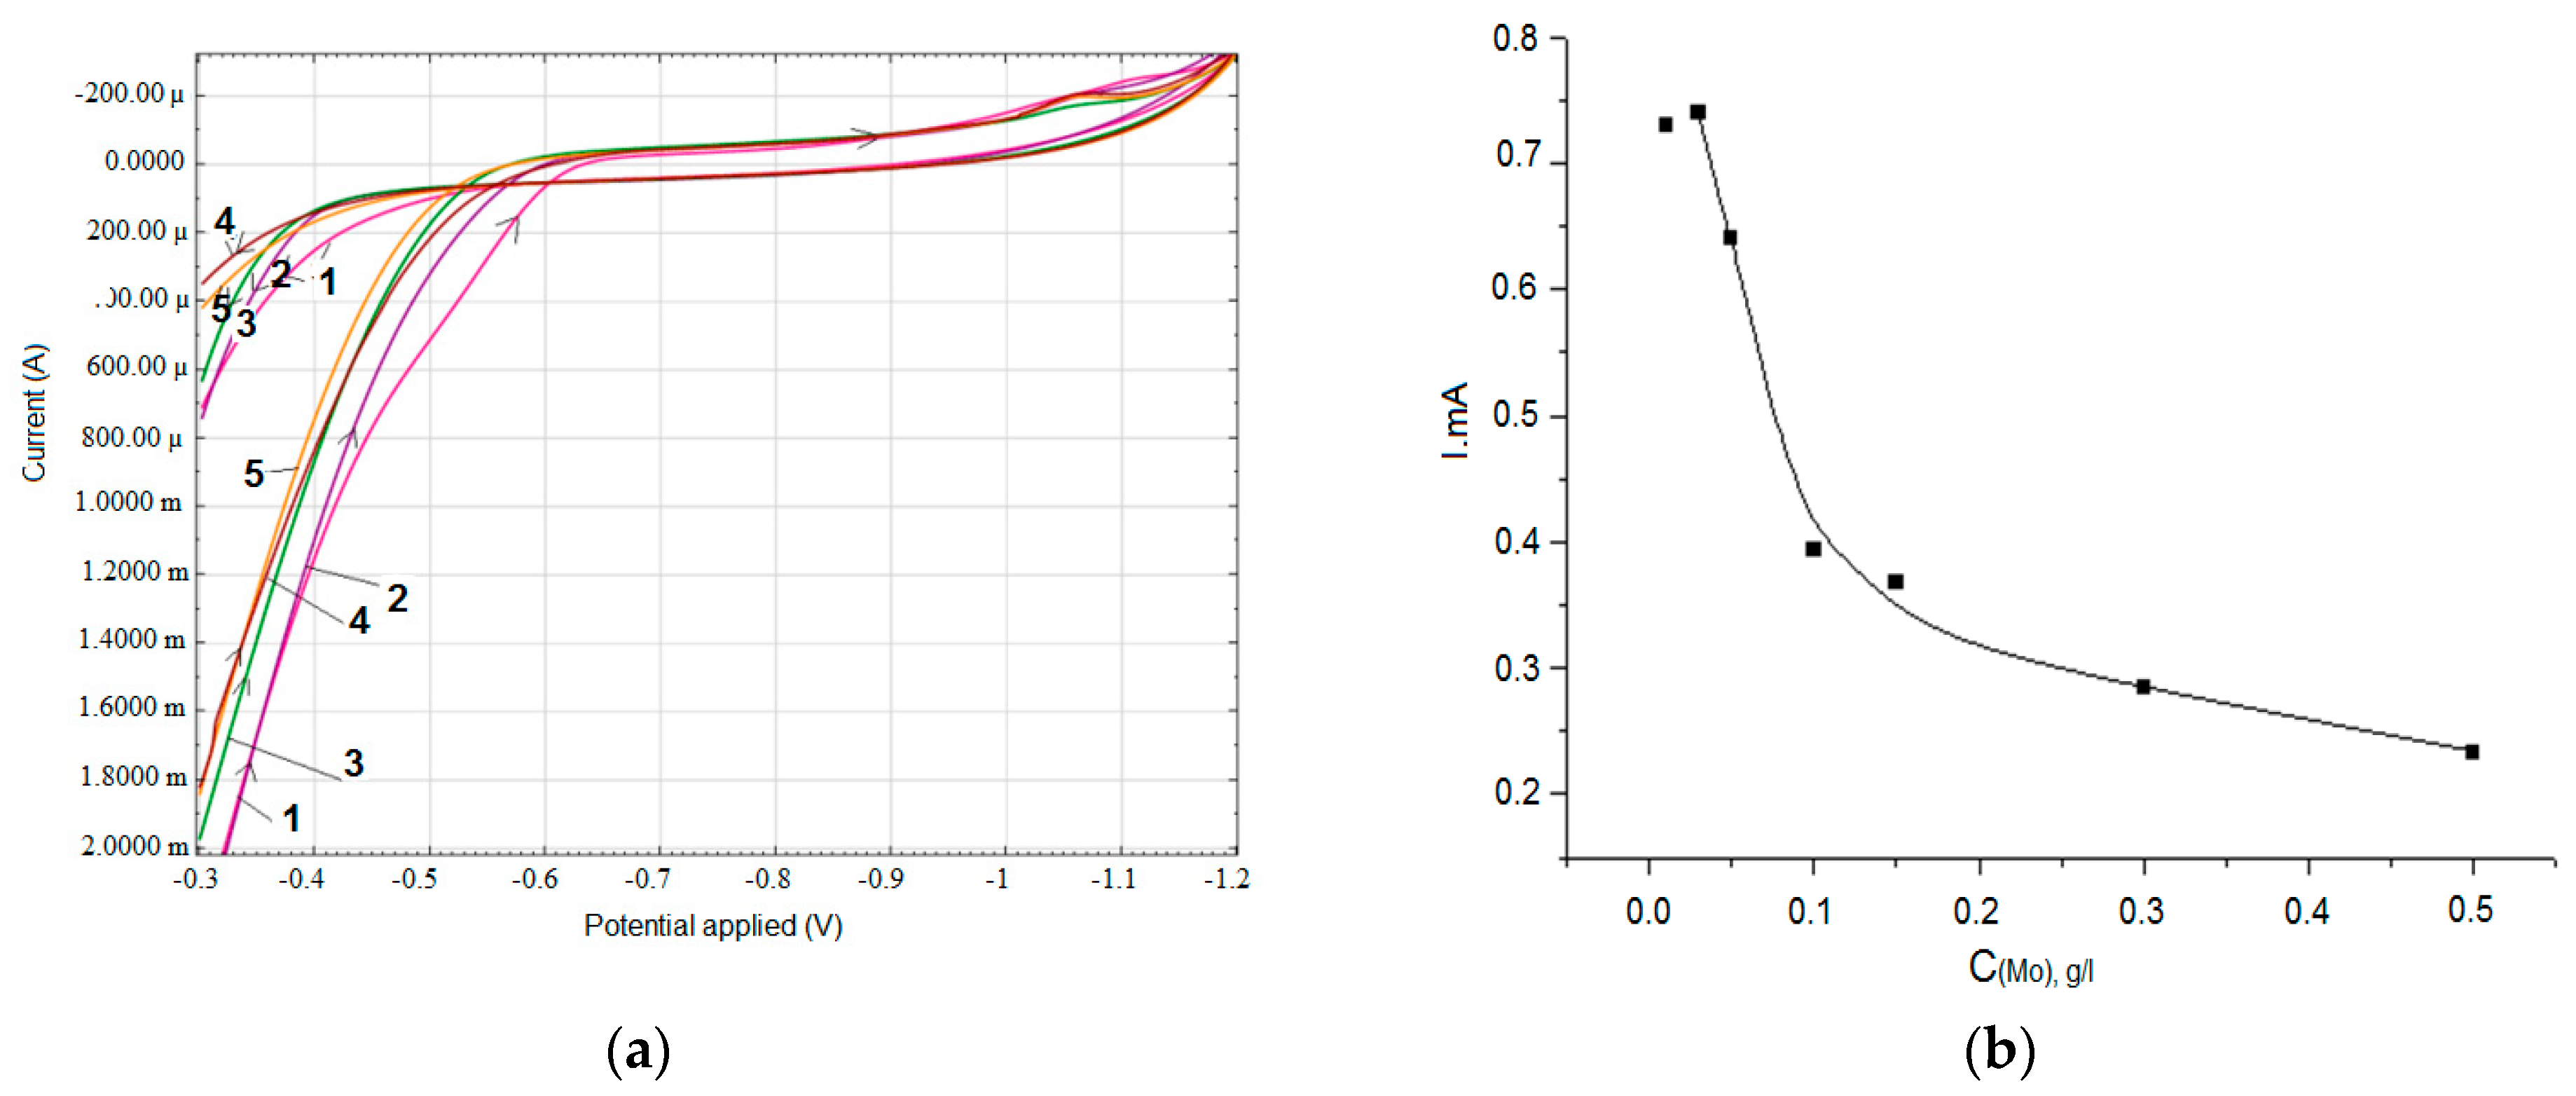
A study of the effect of Mo (VI) additions on the electrochemical behavior of an iron electrode in a solution of 0.3 M Na2SO4 + 0.2 g/L Zr (IV) with various concentrations of Mo (VI) (Figure 2) was carried out.
The concentration of Mo (VI) was changed from 0.1 to 0.15 g/L.
According to Figure 2a, the addition of small amounts of Mo (VI) from 0.01 to 0.2 g/L to the electrolyte composition led to a sharp decrease in the ionization current of the iron electrode (i.e., it contributed to the growth of its corrosion resistance). A further increase in the Mo (VI) content >0.3 g/L led to a smoother decrease in the ionization current of the iron electrode. More clearly, the change in the corrosion resistance of the iron electrode was seen from the dependence of the iron electrode ionization current, determined at a potential of −0.3 V, on the concentration of Mo (VI) ions in the electrolyte (Figure 2b). Thus, the optimal concentration of Mo (VI) in solution of 0.3 M Na2SO4 + 0.2 g/L Zr (IV) for the deposition of an oxide-zirconium coating was chosen to be 0.2 g/L, at which the ionization current was 0.28 mA.
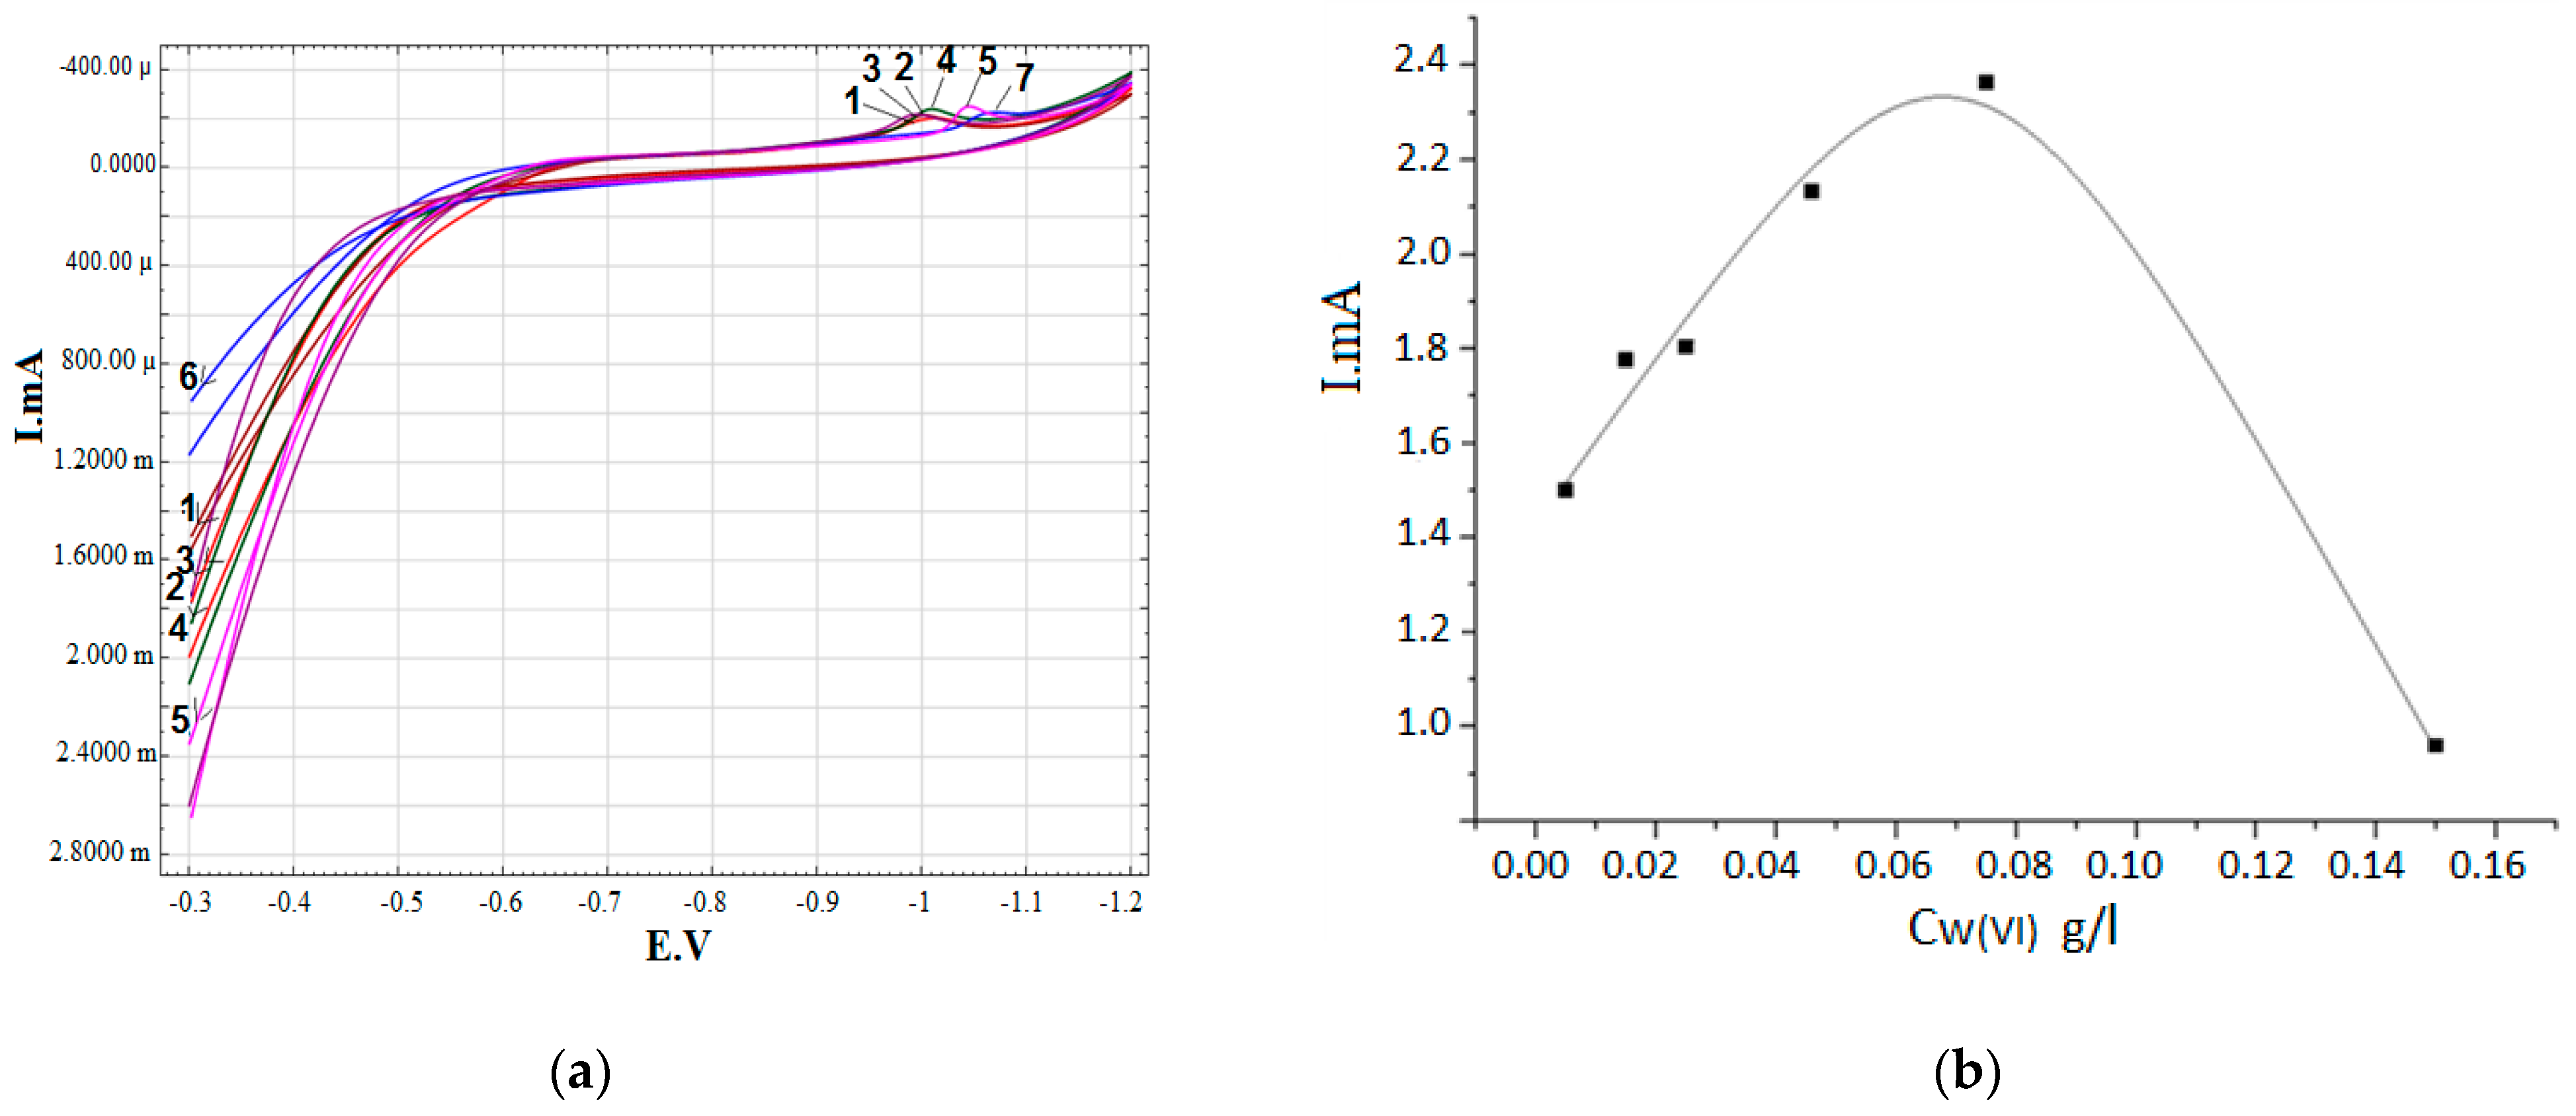
The effect of the tungsten salt C(NH4)10W12O41·nH2O on the electrochemical behavior of the iron electrode was studied (Figure 3).
According to Figure 3a at low concentrations of W (VI) from 0.005 to 0.05 g/L, the value of the maximum current (A) in the cathode part of the volt-ampere curves practically did not change. At a concentration of W (VI) > 0.05 g/L, a shift of the cathode maximum towards the negative region and a decrease in its current were observed. In the anodic region, with an increase in the W (VI) concentration from 0.005 to 0.075 g/L, a shift of the ionization potential to the cathode region was observed. However, at a higher concentration of 0.15 g/L, a sharp shift in the ionization potential to the anode region was seen. According to Figure 3b, an increase in the W (VI) concentration from 0.005 to 0.075 g/L in the electrolyte of 0.3 M Na2SO4 + 0.2 g/L Zr (IV) led to an increase in the ionization current of the iron electrode from 1.5 to 2.3 mA. A further increase in the W (VI) concentration promoted a sharp decrease in the ionization current and an increase in the corrosion resistance of the iron electrode. Thus, at a W (VI) concentration of 0.15 g/L, the ionization current of the iron electrode was 0.9 mA.
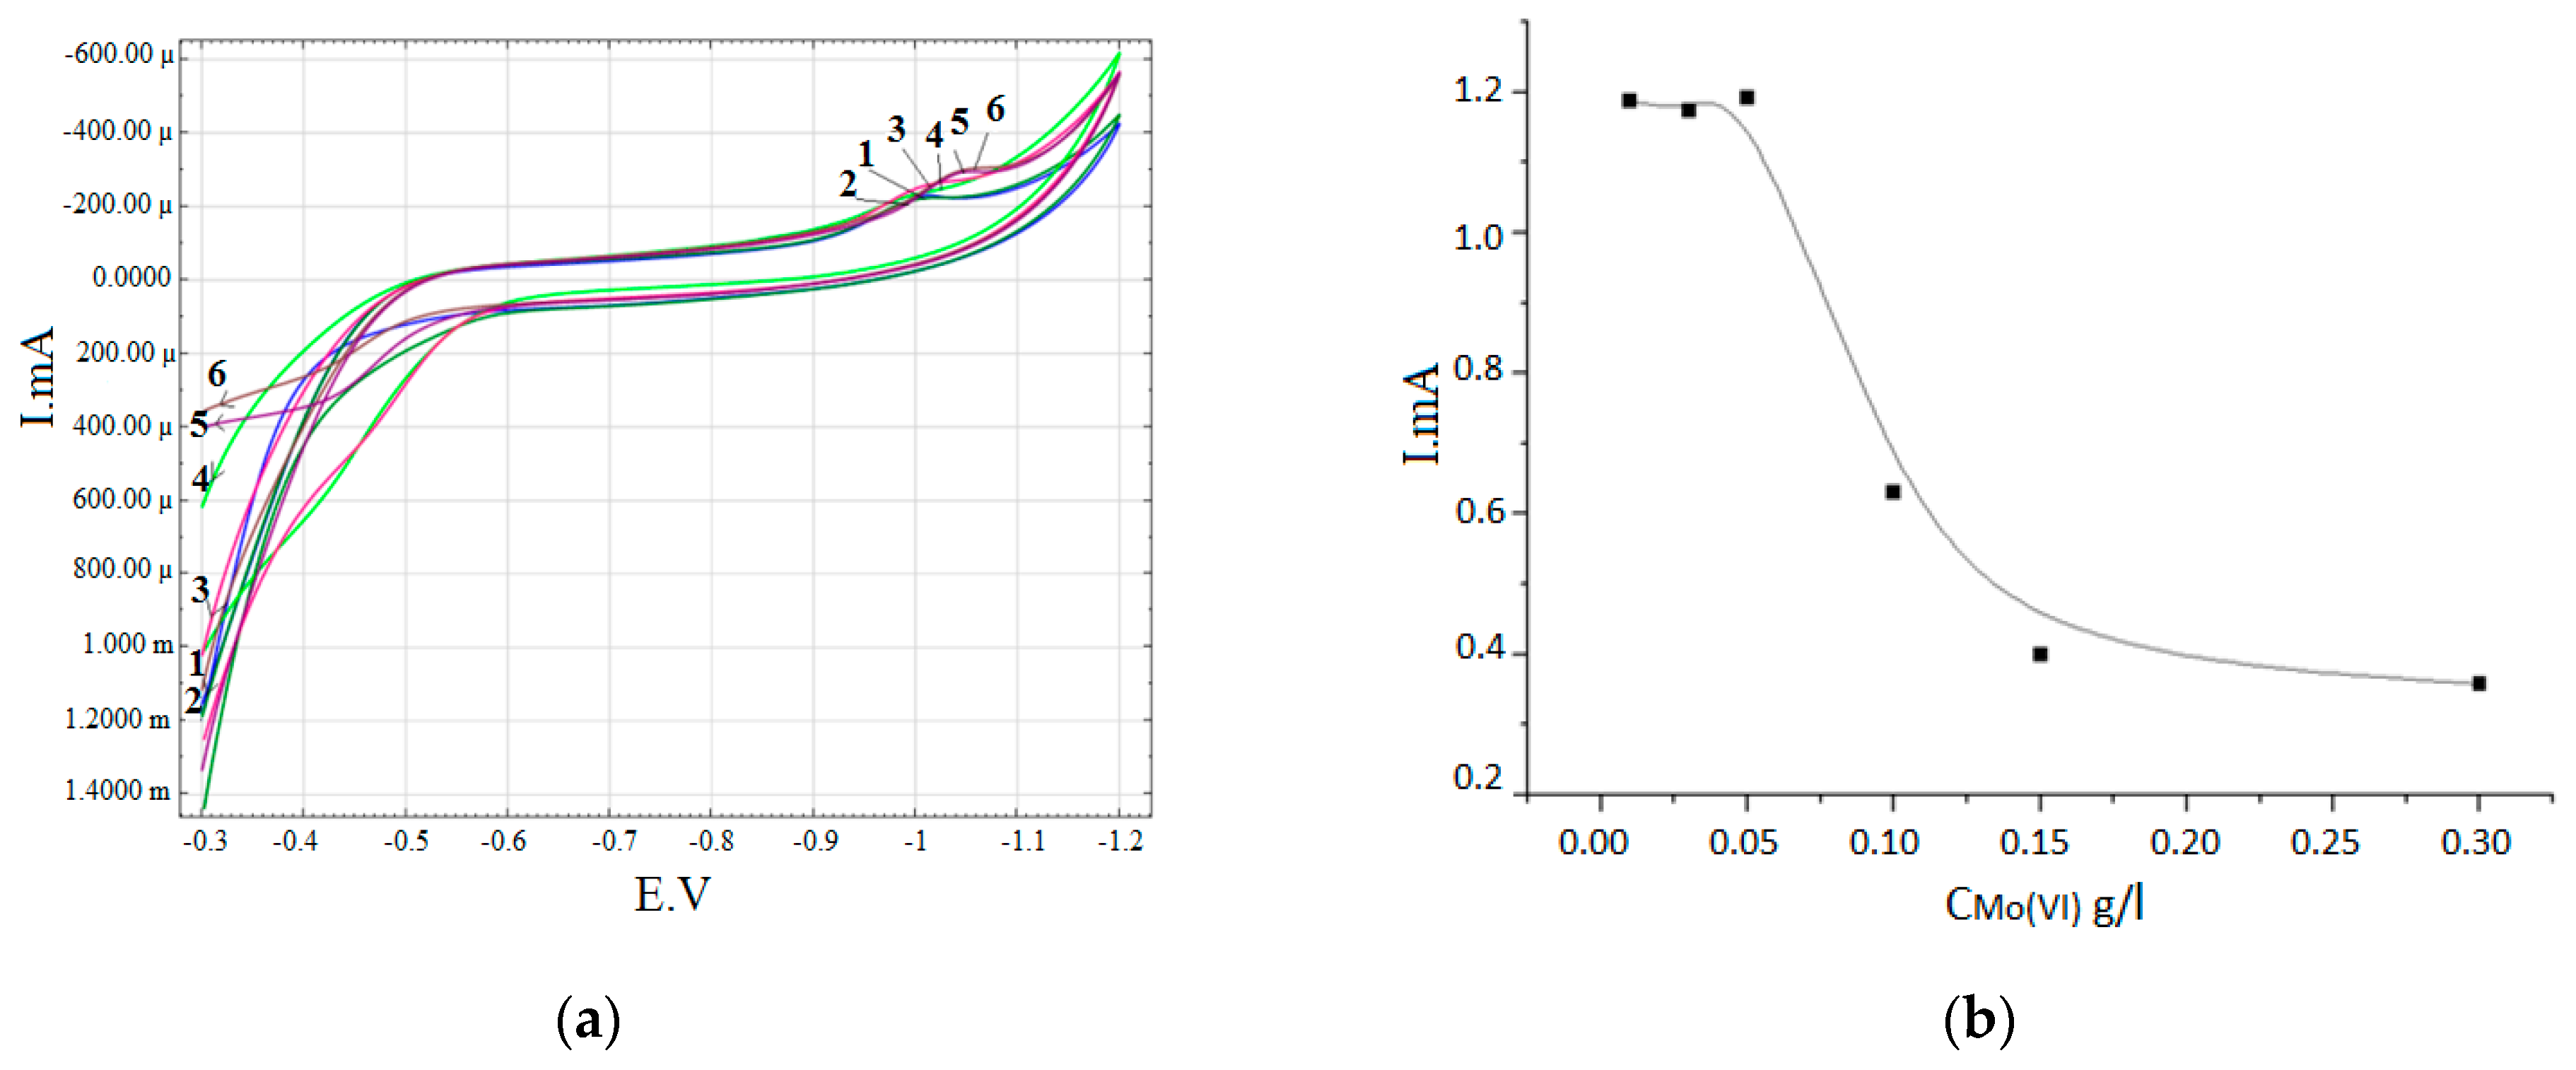
The combined effect of W (VI) + Mo (VI) ions on the corrosion resistance of an iron electrode was considered. Figure 4 shows the electrochemical behavior of an iron electrode in an electrolyte containing, in addition to zirconium ions, tungsten and various concentrations of Mo (VI) molybdenum ions.
The concentration of molybdenum in a solution was changed from 0.01 to 0.3 g/L. According to Figure 4a, the addition of Mo (VI) ions led to the appearance of a small cathode wave at E = −1.08 V and the displacement of iron electrode ionization potential to the anode region, indicating greater difficulty in the ionization process. According to Figure 4b, an increase in the concentration of molybdenum (VI) from 0.01 to 0.15 g/L in solution promoted a sharp reduction of the ionization current from 1.2 to 0.35 mA. A further increase in the tungsten (VI) concentration did not lead to a noticeable change in the ionization current of the iron electrode. Thus, the optimal electrolyte, in which the minimum ionization current of the iron electrode was observed, was the composition: 0.2 g/L Zr (IV) + 0.15 g/L W (VI) + 0.15 g/L Mo (VI) shown in Table 2.
According to Table 2, the smallest ionization current, and therefore the greatest corrosion resistance of the iron electrode, was observed in the electrolytes:
  • 0.3 M Na2SO4 + 0.2 g/L Zr (IV) + (0.01–0.2 g/L) Mo (VI)
  • 0.3 M Na2SO4 + 0.2 g/L Zr (IV) + 0.15 g/L W (VI)+ (0.01–0.3 g/L) Mo (VI)
The results of the electrochemical study, given in Table 1, were used to select solutions for the deposition of oxide-zirconium coatings on the surface of steel samples with the highest corrosion resistance. Since coatings deposited from solutions containing Zr (IV) and W (VI) showed the highest corrosion resistance on steel samples with Mo (VI) ions, additional studies were carried out to determine the optimal conditions for the deposition of oxide-zirconium coatings from these solutions.
Figure 5 shows the change in the surface structure of steel samples with deposited oxide-zirconium coatings from a solution of 0.2 g/L Zr (IV) + 0.15 g/L W (VI) with different concentrations of Mo (VI). The deposition time was 10 min, the deposition temperature was 45 °C, the subsequent drying time was 10 min., and the drying temperature was −130 °C.
According to Figure 5a, in the absence of Mo (VI) ions in the deposition solution: 0.2 g/L Zr (IV) + 0.15 g/L W (VI), a coating was observed on the surface of the iron sample in certain areas only. When a small concentration of molybdenum 0.05 g/L was added to the deposition solution (Figure 5b), an increase in the surface area with the deposited coating was obtained. However, the coating was also formed only in certain areas. At a molybdenum concentration of 0.1 g/L, a uniform fine-grained coating was formed (Figure 5c) over the entire surface of the iron sample. With an increase in the concentration of Mo (VI) to 1.5 g/L, a reduction in the surface with a deposited oxide-zirconium coating and the appearance of microcracks were observed. Microcracks can negatively affect corrosion resistance by creating conductive paths of electrolyte and its penetration through the coating to the base.
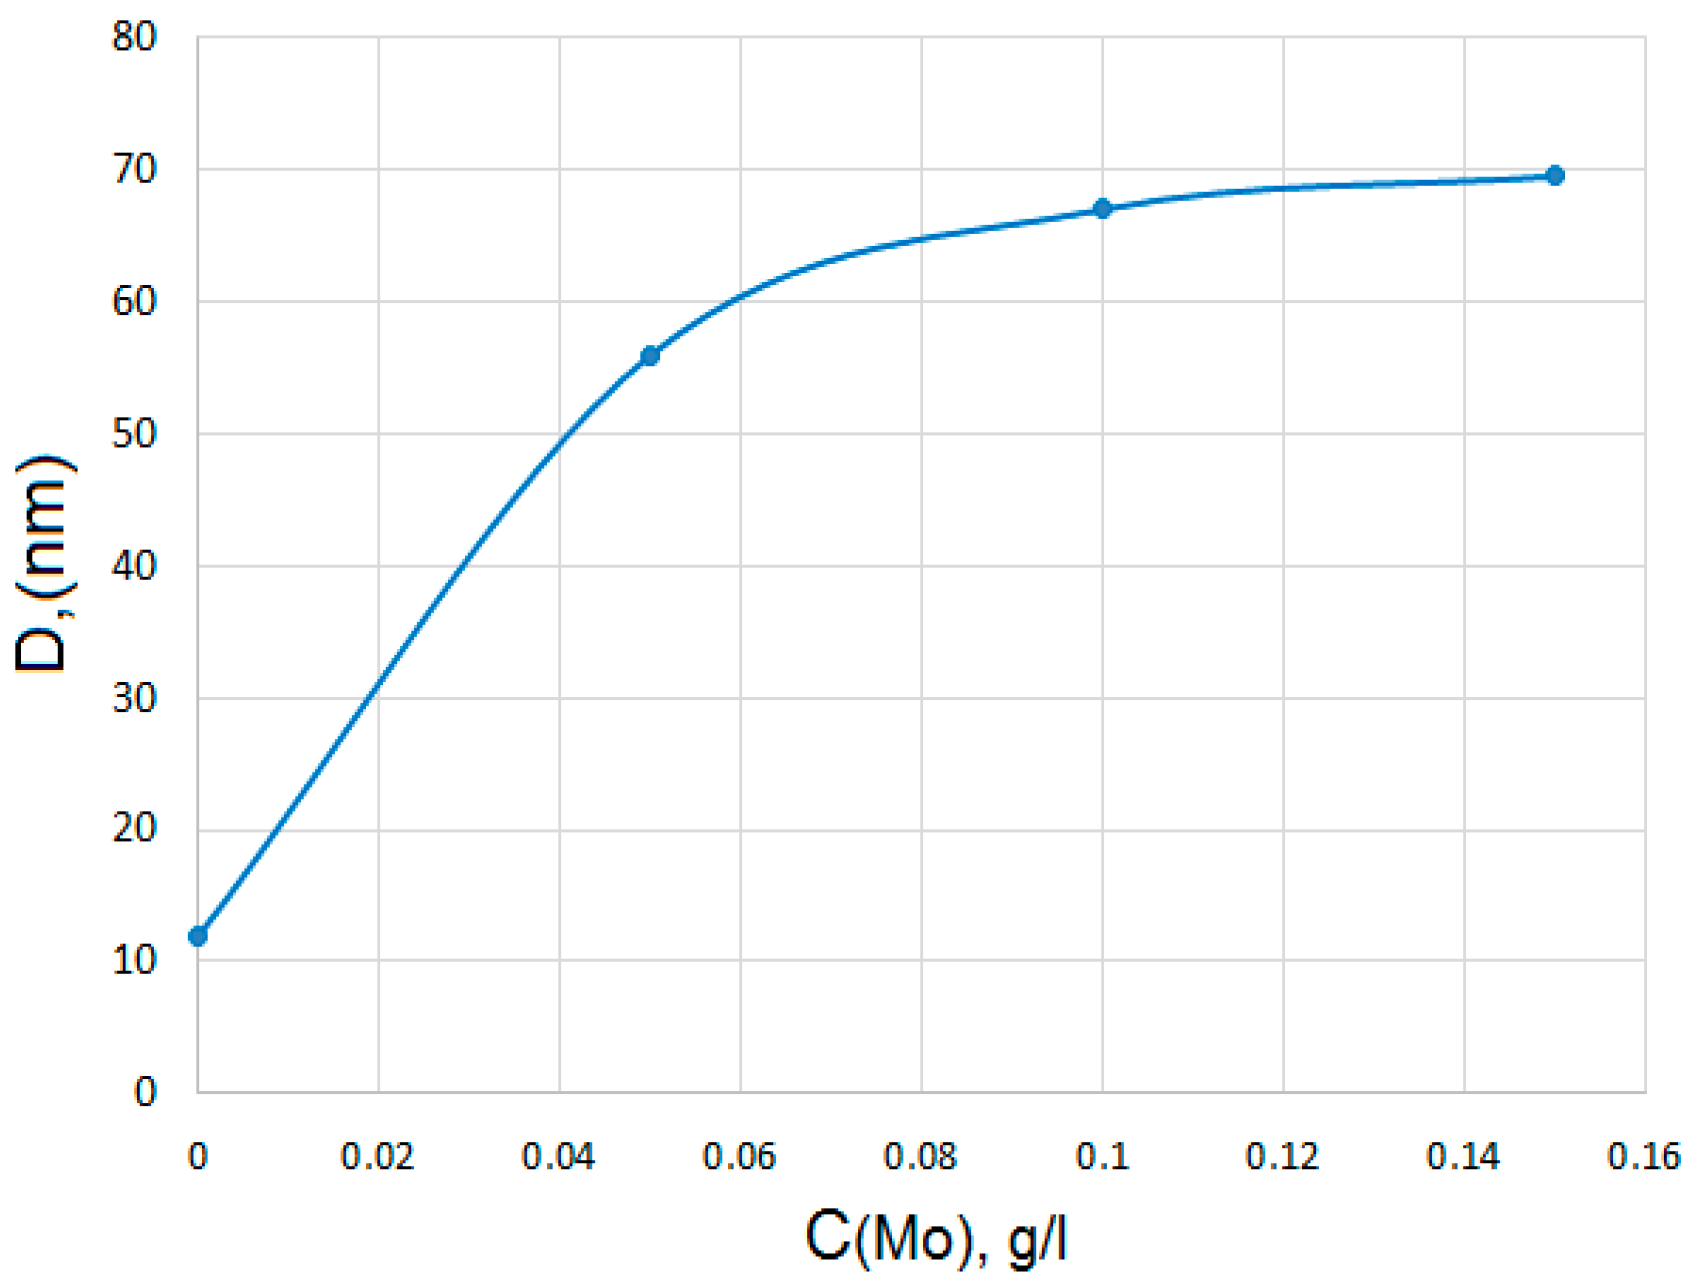
The thickness of oxide-zirconium coatings deposited from a solution of 0.2 g/L Zr (IV) + 0.15 g/L (VI) with different concentrations of Mo (VI) was investigated (Figure 6).
As seen in Figure 6, with an increase in the concentration of Mo (VI) to 0.05 g/L in the deposition solution for oxide-zirconium coatings, a significant increase in the thickness of the formed coatings was observed. Thus, at a Mo (VI) concentration of 0.05 g/L, the thickness of the coating was 58.01 nm. With a further increase in the concentration of Mo (VI), the thickness of the coatings increased slightly: at 0.1 g/L, the thickness was 64.72 nm, and at 0.15 g/L it was 68.33 nm.
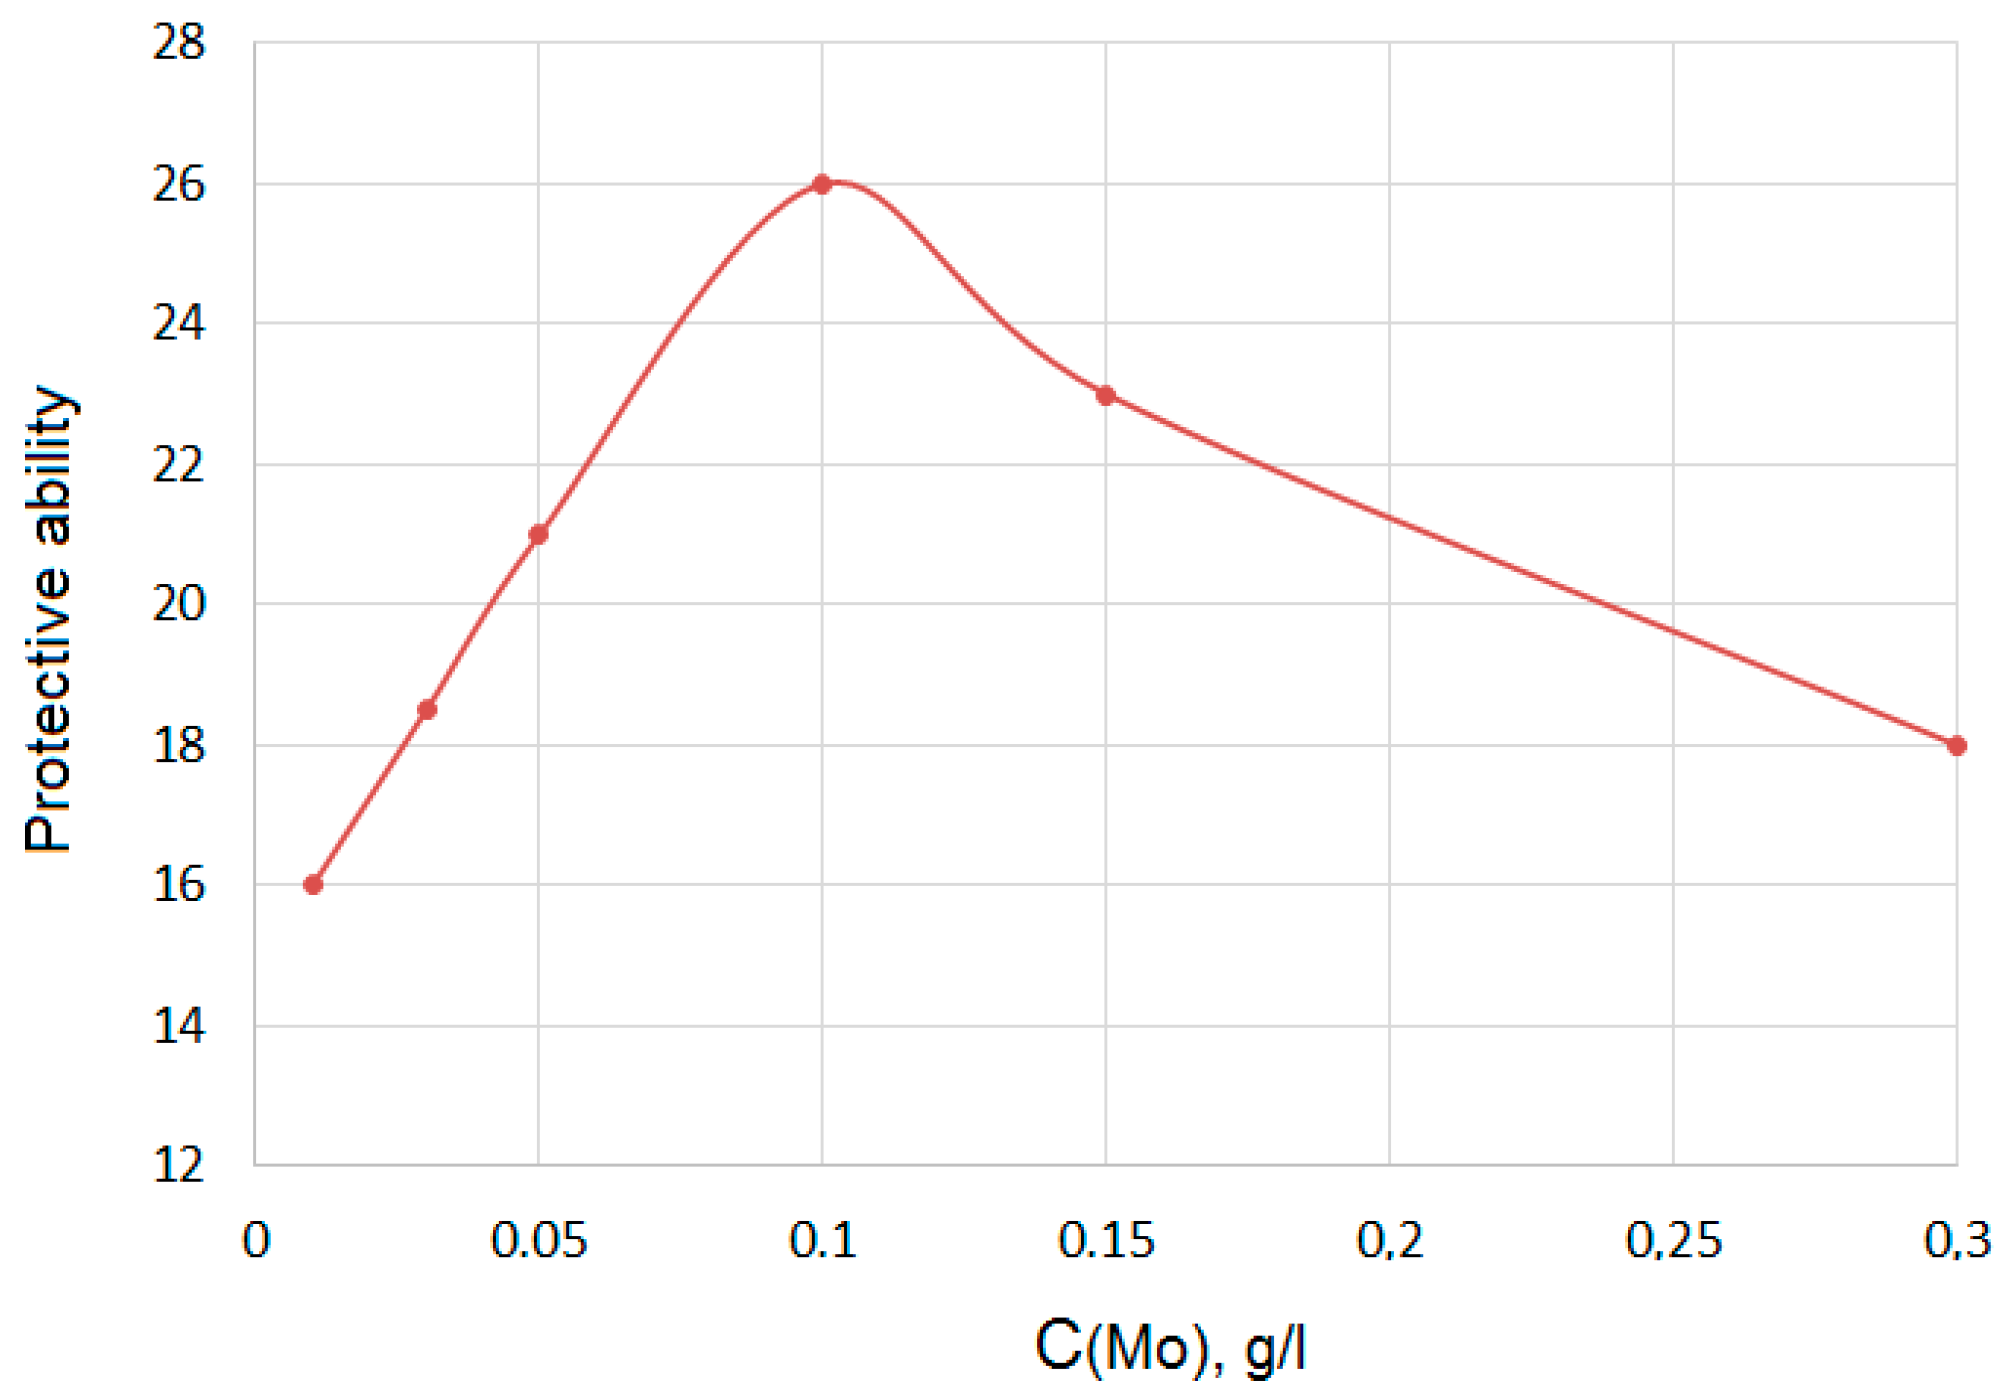
A study of the protective ability of the formed coating using Akimov’s method with deposition time was carried out (Figure 7).
According to Figure 7, the protective ability of the oxide-zirconium coating increased significantly with an increase in the concentration of Mo (VI) to 0.1 g/L. With a further increase in the Mo (VI) concentration in the deposition solution, the protective ability of the coating was reduced. Therefore, the optimal composition of the solution for the deposition of the oxide-zirconium coating was: 0.2 g/L Zr (IV) + 0.15 g/L W (VI) + 0.1 g/L Mo (VI).
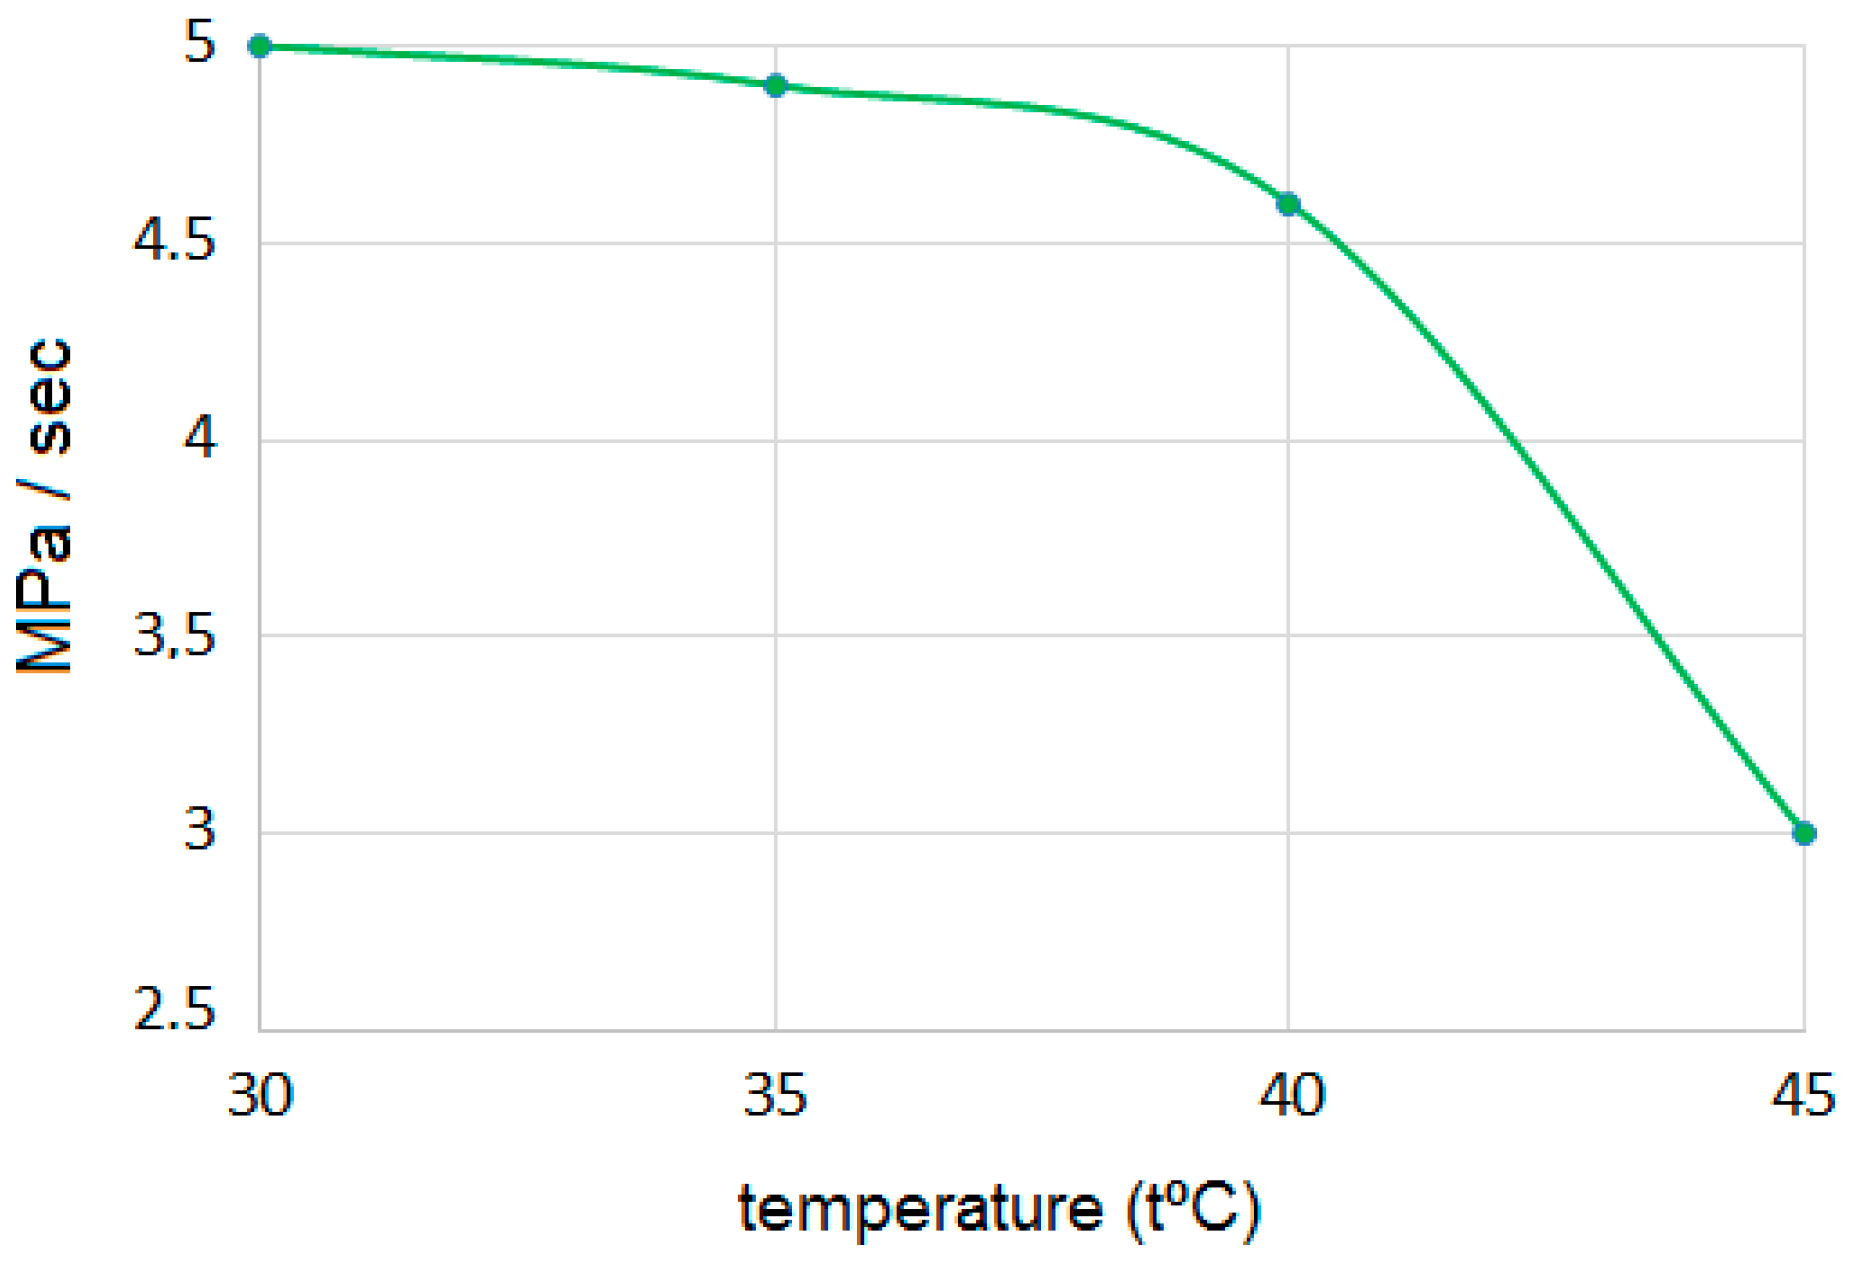
An important factor characterizing the possibility of using the obtained coatings is their adhesion strength, which is determined by the strength of the coating adhesion to the steel base. To quantify the bond strength, the normal peel method (fungal method) was used. The dependence of the adhesive strength of the oxide-zirconium coating on the deposition temperature from a solution of 0.2 g/L Zr (IV) + 0.15 g/L W (VI) + 0.1 g/L Mo (VI) is shown in Figure 8.
As seen in Figure 8, at a deposition temperature of 30 °C, the rate of detachment of the coating from the sample surface was 3.17 MPa/s. With a further increase in the deposition temperature, the adhesive strength of the coating was reduced. Consequently, the optimum deposition temperature at which the most durable coatings were formed was 30 °C.
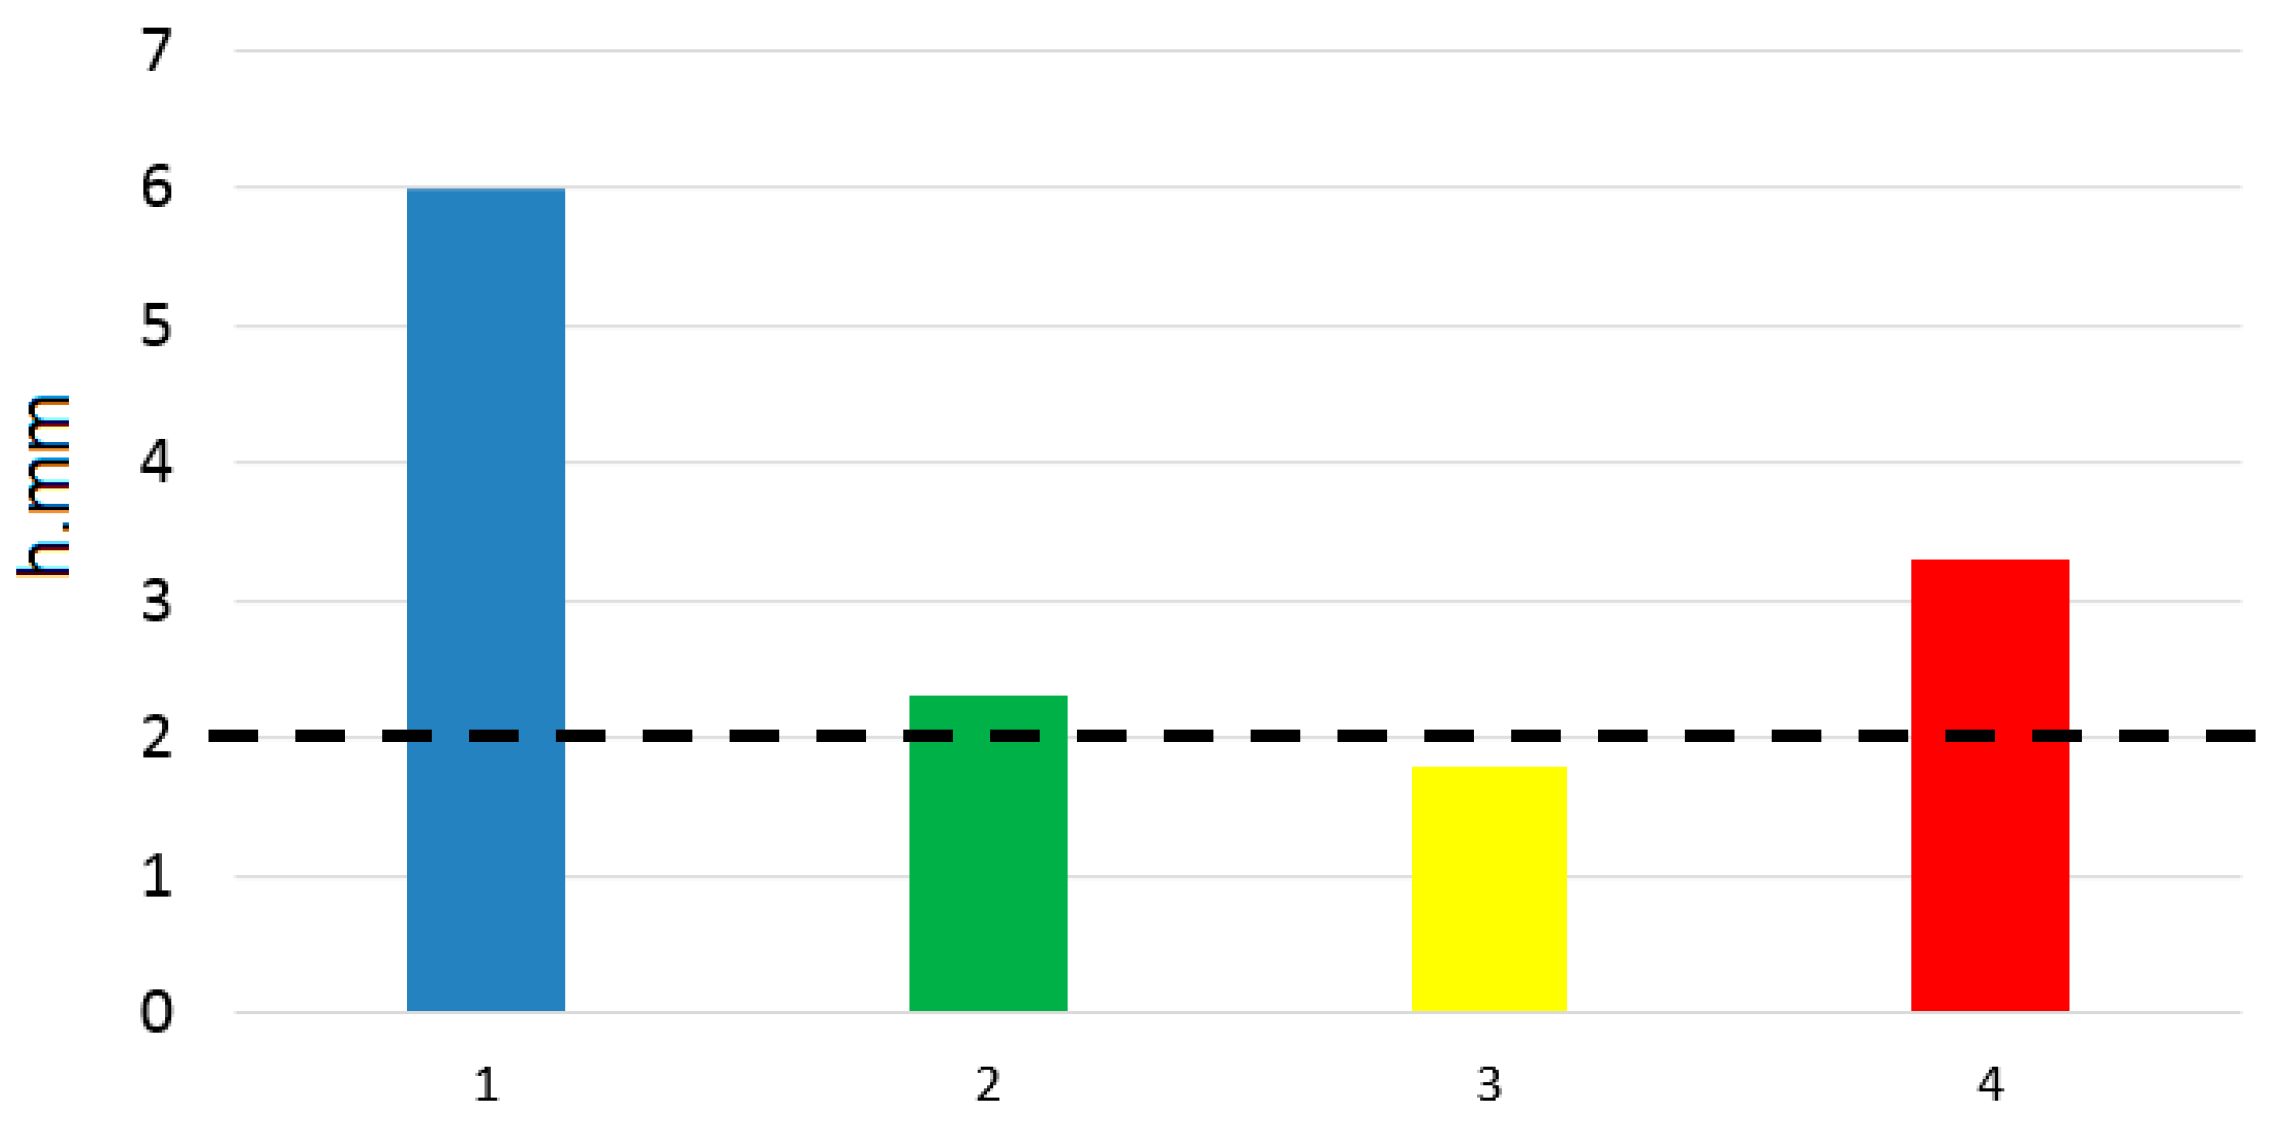
Corrosion tests (ASTM B117 [17].) of steel samples painted with polyester powder paint with an adhesive zirconium-containing coating deposited from a solution of 0.2 g/L Zr (IV) + 0.15 g/L W (VI) + various concentrations of Mo (VI) are shown in Table 3 and Figure 9. The salt spray test was carried out for 240 h.
As seen in Figure 9, the depth of corrosion penetration after 240 h of testing on steel samples with oxide-zirconium coatings deposited from a solution of 0.2 g/L Zr (IV) + 0.15 g/L W (VI) with a concentration of Mo (VI) 0.05 g/L was less than 2 mm, exceeding the corrosion resistance of crystalline amorphous phosphate coatings.

4. Conclusions

Thus, by studying the electrochemical behavior of individual components and their compositions it was possible to select the optimal composition of the deposition solution in which the formed coatings had the highest corrosion resistance. Based on the studies carried out, it was found that the optimal conditions for the deposition of oxide-zirconium coatings on the surface of steel samples from a solution of 0.2 g/L Zr (IV) + 0.15 g/L (VI) + 0.1 g/L Mo (Vi) are temperature 30 °C and time 10 min.
The thickness of the oxide-zirconium coatings formed under these conditions was 64.72 nm, and the adhesion strength was 3.17 MPa/s. Tests showed that the developed nanocoatings met the requirements for adhesion layers for paint and varnish coatings (LCP) in terms of their protective ability, since the width of corrosion penetration from the notch in these cases did not exceed 2.0 mm after 240 h of testing. These coatings are not inferior to phosphate coatings in terms of protective characteristics. It should be noted that zirconium-containing coatings have the smallest thickness and specific gravity in comparison with other coatings. It was revealed that paintwork varnish with a zirconium-containing adhesive sublayer had a higher adhesion strength to the base compared to crystalline and amorphous phosphate and chromate coatings [7,10].

Author Contributions

Conceptualization, L.F.; methodology, A.A., L.F., and A.B.; validation, T.V. and L.F.; investigation, A.B. resources, A.B. and L.S.; writing—original draft preparation), L.F. and L.S.; writing—review and editing), L.F., L.S., and A.B. All authors have read and agreed to the published version of the manuscript.

Funding

The reported study was supported by the personal grant of L. R. Sassykova “The best teacher of the university” of Republic of Kazakhstan (2019).

Data Availability Statement

The data presented in this study are available in this article.

Acknowledgments

Our special thanks to the D.I. Mendeleev University of Chemical Technology of Russia (Department of Innovative Materials and Corrosion Protection).

Conflicts of Interest

The authors declare no conflict of interest.

References

  1. Kerstnera, E.K.; Kunsta, S.R.; Beltramia, L.V.R.; Vega, M.R.O. Anticorrosive performance of commercial nanoceramic coatings on AISI 1010 steel. Mater. Res. 2014, 17, 1497–1506. [Google Scholar] [CrossRef] [Green Version]
  2. Yi, A.; Li, W.; Du, J.; Mu, S. Preparation and properties of chrome-free colored Ti/Zr based conversion coating on aluminum alloy. Appl. Surf. Sci. 2012, 258, 5960–5964. [Google Scholar] [CrossRef]
  3. Cui, C.; Wang, D.; Li, X.; Qu, F.; Xu, T. A room temperature pre-treatment process: Ce3+ doted ZrO2. Nanofilm coated on the cold-rolled plate surface. Adv. Mater. Res. 2012, 347, 147–152. [Google Scholar]
  4. Zhai, Y.; Zhao, Z.; Frankel, G.S.; Zimmerman, J.; Bryden, T.; Fristad, W. Surface Pretreatment Based on Dilute Hexafluorozirconic Acid. In Proceedings of the 2007 Three-Service Corrosion Conference, Denver, CO, USA, 3–6 December 2007; pp. 1–16. [Google Scholar]
  5. Adhikaria, S.; Unocica, K.A.; Zhaia, Y.; Frankela, G.S.; Zimmermanb, J.; Fristad, W. Hexafluorozirconic acid based surface pretreatments: Characterization and performance assessment. Electrochim. Acta. 2011, 56, 1912–1924. [Google Scholar] [CrossRef]
  6. Nela, J.T.; Plessisa, W.D.; Nhlabathia, T.N.; Pretoriusa, C.J.; Jansena, A.A.; Crouse, P.L. Reaction kinetics of the microwave enhanced digestion of zircon with ammonium acid fluoride. J. Fluor. Chem. 2011, 132, 258–262. [Google Scholar] [CrossRef]
  7. Zhurinov, M.Z.; Statsyuk, V.N.; Fogel, L.A.; Bold, A.; Abrashov, A.A.; Kostiuk, A. Determination of the optimal deposition conditions oxide-zirconium coating on steel base. Rasayan J. Chem. 2019, 12, 1287–1293. [Google Scholar] [CrossRef]
  8. Fedrizzi, L.; Rodriguez, F.J.; Rossi, S.; Deflorian, F.; Maggio, R.D. The use of electrochemical techniques to study the corrosion behaviour of organic coatings on steel pretreated with sol-gel zirconia films. Electrochim. Acta 2001, 46, 3715–3724. [Google Scholar] [CrossRef]
  9. Dunham, B.; Chalk, D.D. Non-phosphate transition metal coatings. Clean. Pretreat. Surf. Prep. 2001, 1, 112–118. [Google Scholar]
  10. Abrashov, A.A.; Grigoryan, N.S.; Vagramyan, T.A.; Meshalkin, V.P.; Kotel’nikova, A.V.; Gribanova, A.A. Protective adhesive zirconium oxide coatings. Prot. Met. Phys. Chem. Surf. 2016, 52, 1170–1174. [Google Scholar] [CrossRef]
  11. Mohammadloo, H.E.; Sarabi, A.A. Titanium composite conversion coating formation on CRS in the presence of Mo and Ni ions: Electrochemical and microstructure characterizations. Appl. Surf. Sci. 2016, 387, 252–259. [Google Scholar] [CrossRef]
  12. Shcram, T.; Goeminne, G.; Terryn, H.; Vanhools, W. Anticorrosive coating based on zirconium. Inst. Met. Finish. 1995, 73, 91–97. [Google Scholar]
  13. Mohammadloo, H.E.; Sarabi, A.A.; Alvani, A.A.S.; Sameie, H.; Salimi, R. Nano-ceramic hexafluorozirconic acid based conversion thin film: Surface characterization and electrochemical study. Surf. Coat. Technol. 2012, 206, 4132–4139. [Google Scholar] [CrossRef]
  14. Milosev, I.; Frankel, G.S. Review—Conversion coatings based on zirconium and/or titanium. J. Electrochem. Soc. 2018, 165, 127–144. [Google Scholar] [CrossRef]
  15. Guan, Y.; Liu, J.; Yan, C. Novel Ti/Zr based non-chromium chemical conversion coating for the corrosion protection of electrogalvanized steel. Int. J. Electrochem. Sci. 2011, 6, 4853–4867. [Google Scholar]
  16. Statsyuk, V.N.; Bold, A.; Zhurinov, M.Z.; Fogel, L.A.; Sassykova, L.R.; Vagramyan, T.A.; Abrashov, A.A. Using cyclic voltammetry to determine the protective ability of phosphate coatings. Funct. Mater. 2020, 27, 605–610. [Google Scholar]
  17. ASTM B117-11. Standard Practice for Operating Salt Spray (Fog) Apparatus. ASTM International: West Conshohocken, PA, USA, 2011.
  18. Laha, P.; Schram, T.; Terry, H. Use of spectroscopic ellipsometry to study Zr/Ti film son Al. Surf. Interface Anal. 2002, 34, 677–680. [Google Scholar] [CrossRef]
  19. State Standard (SS) 9.302-88. ESZKS. Metallic and Nonmetallic Coatings. Methods of Accelerated Corrosion Tests.
  20. Abrashov, A.; Grigoryan, N.; Vagramyan, T.; Asnis, N. On the mechanism of formation of conversion titanium-containing coatings. Coatings 2020, 10, 328. [Google Scholar] [CrossRef] [Green Version]
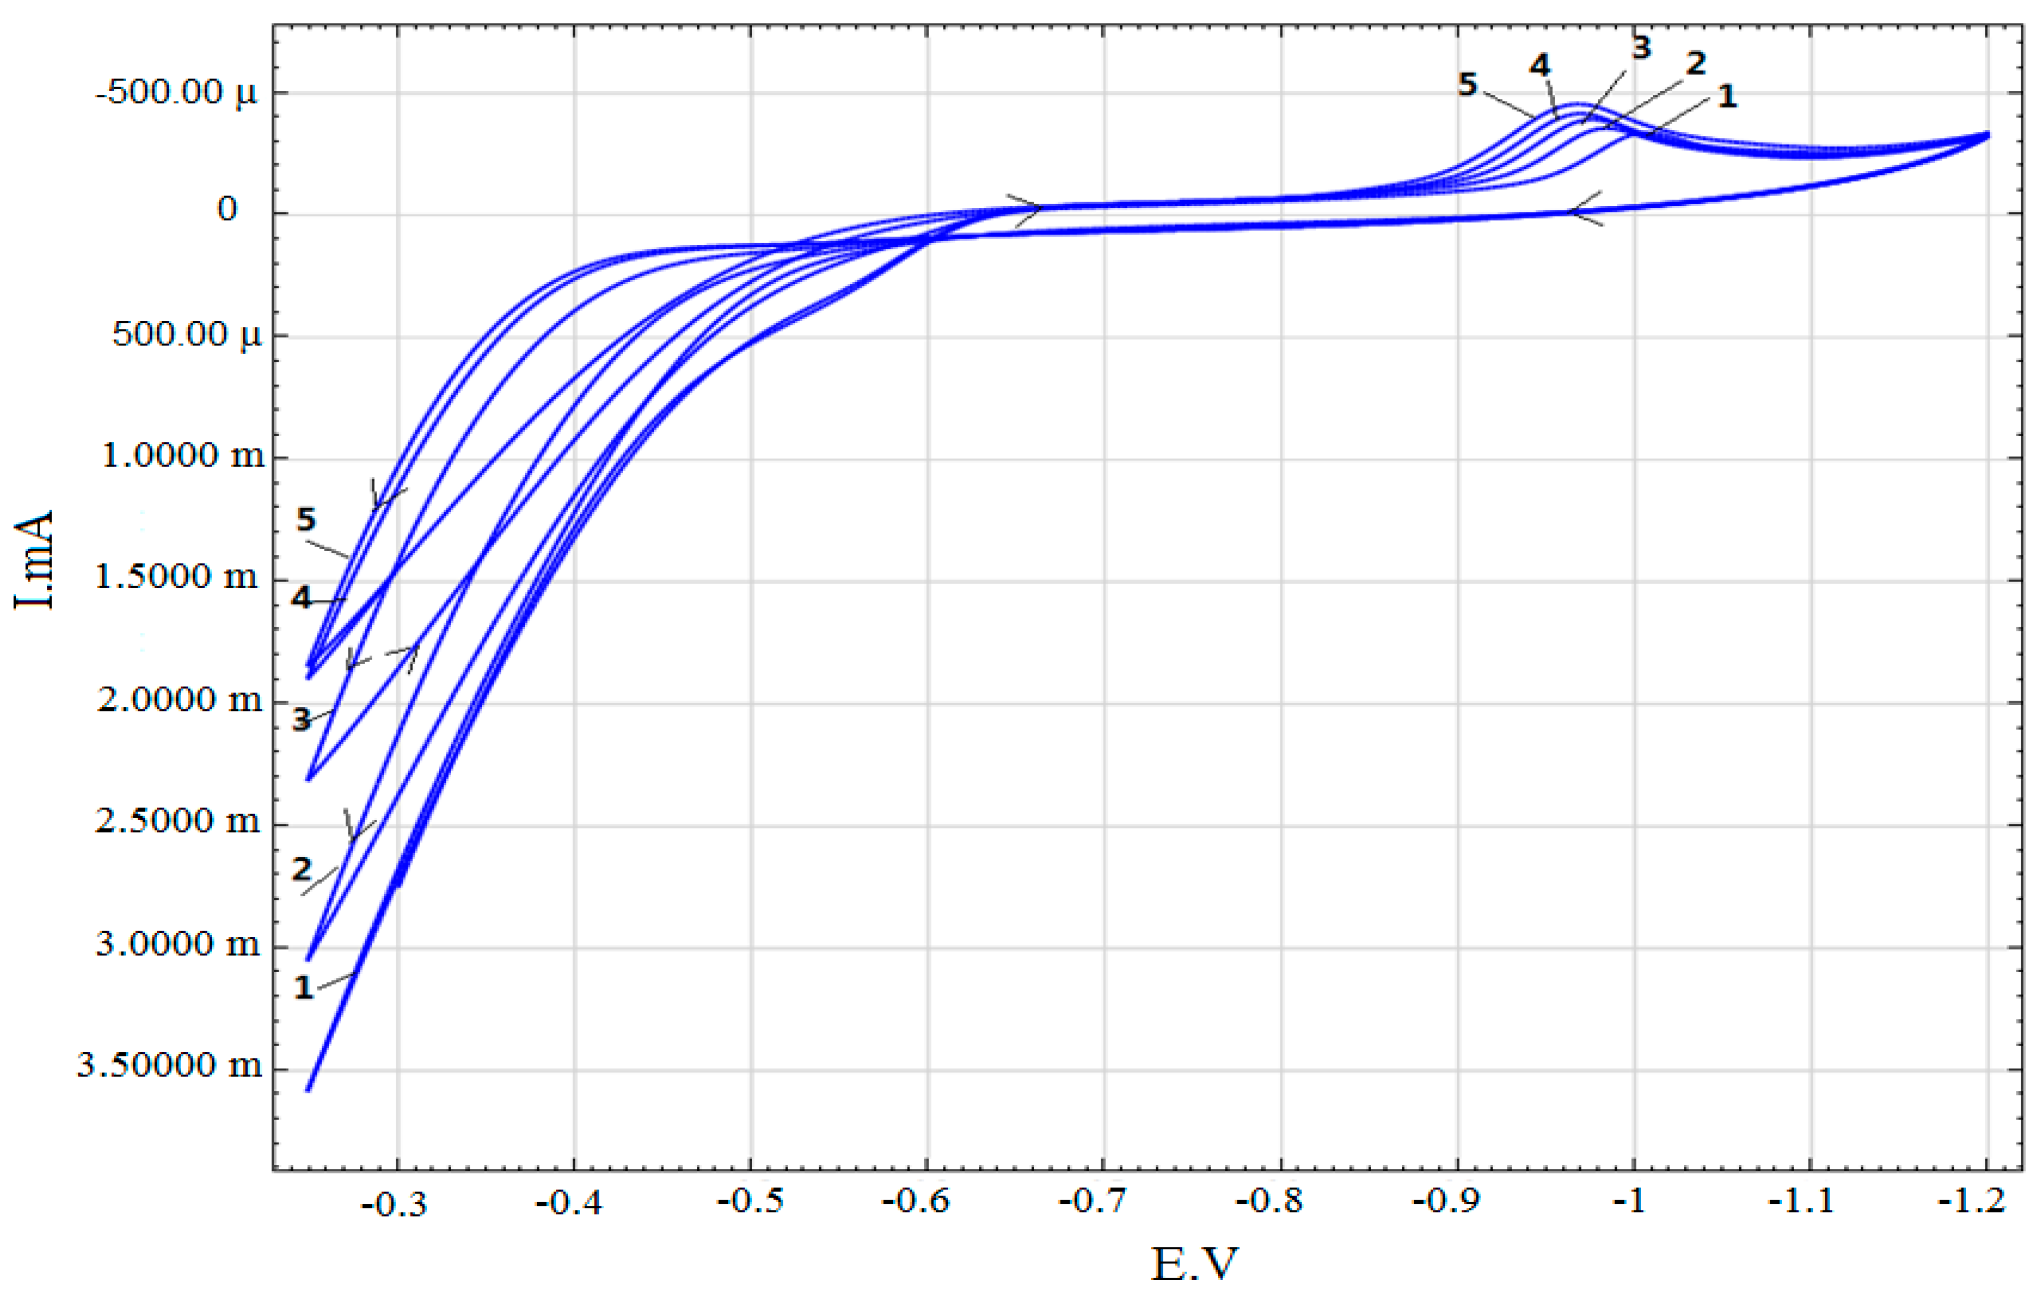
Figure 1. Cyclic volt–ampere curves of an iron electrode (cycles 1–5).
Coatings 11 00042 g001
Figure 2. Volt–ampere curves of an iron electrode (a) and a change in the ionization current of the iron electrode (b) at different concentrations of Mo (VI). Electrolyte 0.3 M Na2SO4 + 0.2 g/L Zr (IV) + Mo (VI) (g/L): 1—0.1; 2—0.3; 3—0.5; 4—1; 5—1.5.
Coatings 11 00042 g002
Figure 3. Volt–ampere curves of an iron electrode (a) and a change in the ionization current of the iron electrode (b) at different concentrations of W(VI). Electrolyte 0.3M Na2SO4 + 0.2 g/L Zr (VI) + W (VI) (g/L): 1—0.005; 2—0.015; 3—0.025; 4—0.05; 5—1.5.
Coatings 11 00042 g003
Figure 4. Volt–ampere curves of an iron electrode in 0.3 M Na2SO4 + 0.2 g/L Zr (IV) + 0.15 g/L W (VI) (a) and a change in the ionization current of the iron electrode (b) at different concentrations of Mo (VI)) (g/L): 1—0.1; 2-0.3; 3—0.5; 4—1; 5—1.5.
Coatings 11 00042 g004
Figure 5. Micrographs of steel samples with zirconium oxide coatings deposited from the solution: 0.2 g /L Zr (IV) + 0.15 g/L W (VI) (a) and with additions of Mo (VI) of 0.05 g/L (b), 0.1 g/L (c), and 0.15 g/L (d). Size pixels 1024 × 1024; size µm 129 × 129.
Coatings 11 00042 g005
Figure 6. Dependence of the thickness of oxide-zirconium coatings on the concentration of Mo (VI) in the deposition solution.
Coatings 11 00042 g006
Figure 7. Dependence of the protective ability of oxide-zirconium coatings on the concentration of Mo (VI) in the deposition solution.
Coatings 11 00042 g007
Figure 8. The rate of detachment of the oxide-zirconium coating with deposition temperature.
Coatings 11 00042 g008
Figure 9. Dependence of the width of the separation of the paintwork from the cuts on concentrations of Mo (VI) g/L: (1) 0; (2) 0.05; (3) 0.1; (4) 0.15 in deposition solution 0.2 g/L Zr (IV) + 0.15 g/L W (VI).
Coatings 11 00042 g009
Table 1. Chemical composition of Art. 08ps.
Chemical Element Content, %
Iron (Fe)60.8
Chromium (Cr)17–19
Nickel (Ni)9–11
Manganese (Mn) ≤2
Silicon (Si)≤0.8
Copper (Cu)≤0.3
Carbon (C)≤0.08
Phosphorus (P)≤0.035
Sulfur (S)≤0.02
Table 2. Influence of the electrolyte composition on the ionization current of the iron electrode at a potential of −0.3 V.
Electrolyte CompositionIonization Current, mA
0.3 M Na2SO4 + (0.02–1.0 g/L) Zr (IV)3.3–1.5
0.3 M Na2SO4 + 0.2 g/L Zr (IV) + (0.01–0.2 g/L) Mo (VI)0.75–0.25
0.3 M Na2SO4 + 0.2 g/L Zr (IV) + 0.15 g/L W(VI)0.9
0.3 M Na2SO4 + 0.2 g/L Zr (IV) + 0.075 g/L W (VI) + (0.01–0.3 g/L) Mo (VI) 1.3–0.4
0.3 M Na2SO4 + 0.2 g/L Zr (IV) + 0.15 g/L W (VI) + (0.01–0.3 g/L) Mo (VI)1.2–0.35
Table 3. Influence of the concentration of Mo (VI) in the precipitation solution 0.2 g/L Zr (IV) + 0.15 g/L W (VI) on the depth of corrosion penetration determined in the salt fog chamber.
Concentration Mo (VI), g/L00.05 0.10.15
Depth of corrosive penetration, mm62.31.83.3
Publisher’s Note: MDPI stays neutral with regard to jurisdictional claims in published maps and institutional affiliations.