Article

Moisture Vapor Resistance of Coated and Laminated Breathable Fabrics Using Evaporative Wet Heat Transfer Method

Korea Research Institute for Fashion Industry, 45-26, Palgong-ro, Dong-gu, Deagu 41028, Korea
Coatings 2021, 11(10), 1157; https://doi.org/10.3390/coatings11101157
Submission received: 5 September 2021 / Revised: 17 September 2021 / Accepted: 20 September 2021 / Published: 26 September 2021
(This article belongs to the Special Issue Anti-wear Coatings for High Temperature Applications)

Abstract

:
This study examined the effects of the fiber materials, fabric structural parameters, and surface modification method on the moisture vapor resistance of coated and laminated fabrics according to the measuring method in comparison with evaporative wet heat transfer method. The moisture vapor resistance (Ref) of the coated and laminated fabrics measured using evaporative wet heat transfer method was much more precise than water vapor transmission rate (WVTR) and water vapor permeability (WVP) measured using American Society for Testing and Materials (ASTM) and Japanese Industrial Standard (JIS) methods. The correlation coefficient between Ref and WVTR in the laminated and coated polyethylene terephthalate (PET) fabric specimens was the highest, i.e., −0.833, and −0.715, in coated fabric specimens. Hence, selecting an appropriate measuring method according to the fabric materials and surface modification method is very critical. According to curvilinear regression analysis, the influential factor affecting breathability of the PET fabric specimens measured using evaporative wet heat transfer method was fabric weight (R2 = 0.847) and fabric thickness (R2 = 0.872) in the laminated fabric specimens. Meanwhile, as per multiple linear regression, the most influential fabric structural parameters affecting the breathability of laminated fabric specimens measured using evaporative wet heat transfer method were the fabric density, weight/thickness, and weight followed by the fabric thickness (R2 = 0.943). These results would be valid for laminated breathable fabrics with characteristics within the range of this study and are of practical use for engineering laminated fabrics with high breathability.

1. Introduction

Clothing plays a very important role in maintaining the equilibrium of heat and moisture transfer for the wearer [1]. The water vapor permeability (WVP) while wearing clothing is a critical property for wear comfort. A high WVP allows the human body to cool down due to perspiration and evaporation. In addition, minimizing sweat build-up in clothing is important in cold environments [2]. On the other hand, many workers exposed to different atmospheric environments due to the nature of their work are critically influenced by the wear comfort of their work wear. Therefore, work wear with a satisfactory WVP level and appropriate protective characteristics is required. In particular, waterproof breathable fabrics need to maintain high breathability with stretch ability. In addition, perspiration absorption and fast-drying properties are needed in sportswear, such as climbing and jogging clothes. Therefore, early studies [1,2,3,4,5,6,7,8,9,10,11] examined the WVP of various fabrics focusing on the breathable characteristics according to the textile materials, fabric structural parameters, and surface modification, such as coating and laminating. Some studies [1,2,3,4,5] examined the moisture vapor resistance of knitted and woven fabrics using staple yarns made from cotton, polyester, wool, and their blended materials. Yoo et al. [6] examined the characteristics of simulated heat and moisture transport in fabrics and garments determined using a vertical plated sweating skin model. Yoo et al. [7,8] explored the effects of a layer array system and its wear trial assessment in a multilayer clothing system on the vapor permeability and condensation n a cold-weather clothing ensemble. Lee et al. [9] examined the effects of the textile material and fabric structural factors on the WVP using statistical modeling. Kim et al. [10] reported the relationship between the specific clothing properties of fabrics made from artificial and natural fibers and their performance, such as dynamic moisture vapor transfer in a microclimate and its moisture and temperature measurements. Cubric et al. [11] explored the technical parameters affecting the moisture vapor resistance of knitted fabrics and clothing using a sweating guarded hot plate method and a thermal manikin. They reported an intermediate correlation (R = 0.7) between the moisture vapor resistance and moisture regain.
Moreover, the prominent fabric structural parameters affecting the moisture vapor resistance were the mass per unit area, fabric thickness, and tightness factor (R = 0.9). Most studies on the performance of waterproof breathable fabrics concentrated on the WVP characteristics. Many studies mentioned above on the WVP of waterproof breathable fabrics reported that the WVP of fabrics differs according to the fiber materials, and surface modification (finishing method), such as coating and laminating. Moreover, the method for measuring the WVP was a significant factor. In particular, many studies on the method for measuring the WVP have been performed [12,13,14,15,16,17,18,19,20,21,22]. Techniques to measure the WVP can be classified into two types. The first includes those that simulate sweating bodies or skin using the evaporative wet heat transfer method and are used mainly for research work. The second type is those used for routine quality control, development, and marketing purposes. Recently, Salz [12] suggested that the vapor transmission rates are often difficult to compare because of various test methods. He developed a laboratory measuring method for measuring the WVP using a heated cup method combined with an artificial rain condition. Lomax [13] reported a difference in the WVP according to the measuring methods, which was attributed to the difference in test conditions. Several studies [14,15,16,17,18,19,20] compared the performance characteristics of waterproof breathable fabrics using different measuring methods. Gibson et al. [14,15,16] examined the factors influencing the steady-state heat and water vapor transfer measurements for clothing materials using a hydrophobic and hydrophilic membrane laminated with two and three layers of fabrics. They measured the moisture vapor resistance using the most common techniques, such as guarded hot plate and cup-type water vapor transmission rate tests. Dolhan [17] compared the apparatus used to measure the water vapor resistance, where he reported a correlation between the upright cup method and the Canadian control dish method for measuring the moisture vapor resistance. Congalton [18] examined heat and moisture transport through textiles and clothing ensembles using the Hohenstein skin model. He reported a strong correlation between ISO 11092 [18], the Hohenstein measuring method, and the BS7209 [18] method. On the other hand, Lomax [13] reported an inverse correlation between the ISO 11092 [18] and BS 7209 [18] methods. Grettlon et al. [19] examined the correlation between the test methods used to measure water vapor transmission through fabrics. They reported a linear correlation between the moisture vapor resistance measured using the Gore-modified desiccant method and the BS 7209 [19], but this was limited to coated and laminated fabrics treated with the same polymer composition.
MaCullough et al. [20] studied the correlation among five measuring methods of WVP of 26 waterproof breathable fabrics. They reported a high correlation coefficient above 0.9 between the measuring methods of the WVP. Huang [21] examined influencing factors, such as air velocity and airflow direction affecting the moisture vapor resistance obtained in the ISO 11092 [18] method and compared them with the existing water vapor transmittance method. Huang [21] and his coworkers [22] reviewed and compared various test methods for measuring the water vapor transfer properties of fabrics. According to many studies explored previously, there was little study on the effects of the textile material, fabric structural parameters, and surface modification method affecting the moisture vapor resistance of the waterproof breathable fabrics and their difference according to the measuring methods. Therefore, this study examined the WVP and moisture vapor resistance of 73 waterproof breathable fabrics classified according to the fiber materials and surface modification methods. The WVPs by the upright cup and inverted cup methods and the moisture vapor resistance by the sweating guarded hot plate method using evaporative wet heat transfer were compared in terms of the fabric structural parameters and surface modification method. The experimental data were compared using correlation and regression analysis.

2. Materials and Methods

2.1. Preparation of Specimens

Seventy-three waterproof breathable woven fabrics were prepared and classified into fiber materials, such as nylon, polyester, and nylon/cotton or polyester/cotton, and surface modification method in terms of coated, laminated, dot laminated, and hot-melt laminated. The coated and laminated breathable fabric specimens according to fiber materials were mainly divided into two groups: nylon fabrics (38 items) and PET fabrics (35 items); nylon fabrics were composed of nylon 100% (24), nylon/cotton (6), and nylon dense (8), and PET fabrics were PET (13) and PET/cotton (22), which was nearly proportional to the amount sold in market. On the other hand, the numbers of the specimen according to surface modification method were divided in proportion to the production amount manufactured in finishing factories. Table 1 lists the classification of the breathable woven fabric specimens.

2.2. Measurement of the Fabric Structural Parameters

The fabric thickness was measured at a pressure of 2 gf/cm2 using a FAST-1 compression meter (CSIRO, Canberra, Australia). The weight was calculated using the mass of a 10 cm × 10 cm fabric specimen. Twenty tests for the warp and weft densities were conducted for each fabric specimen. Table 2 lists the fabric structural parameters and surface modification method classified in terms of the laminated, coated, dot laminated, and hot-melt of each fabric specimen. As shown in Table 2, fabric density was widely distributed from loose to dense fabric, and fabric thickness was also distributed widely from thin to thick fabric.

2.3. Measurement of the Breathability of the Fabric Specimens

The methods for measuring the WVP are divided into two types. The first is to simulate sweating bodies and skin using the evaporative wet heat transfer method, which is mainly used for research. The second is used for routine quality control, fabric development, and marketing purposes. In this study, three measuring methods were adopted to simulate the correlation between test methods according to fiber materials and various surface modification methods. These are the upright cup, inverted cup, and sweating guarded hot plate method, which were standardized in ASTM E96-80 [23], JIS L 1099 B-1 [24], and ISO 11092 [25] test methods, respectively.

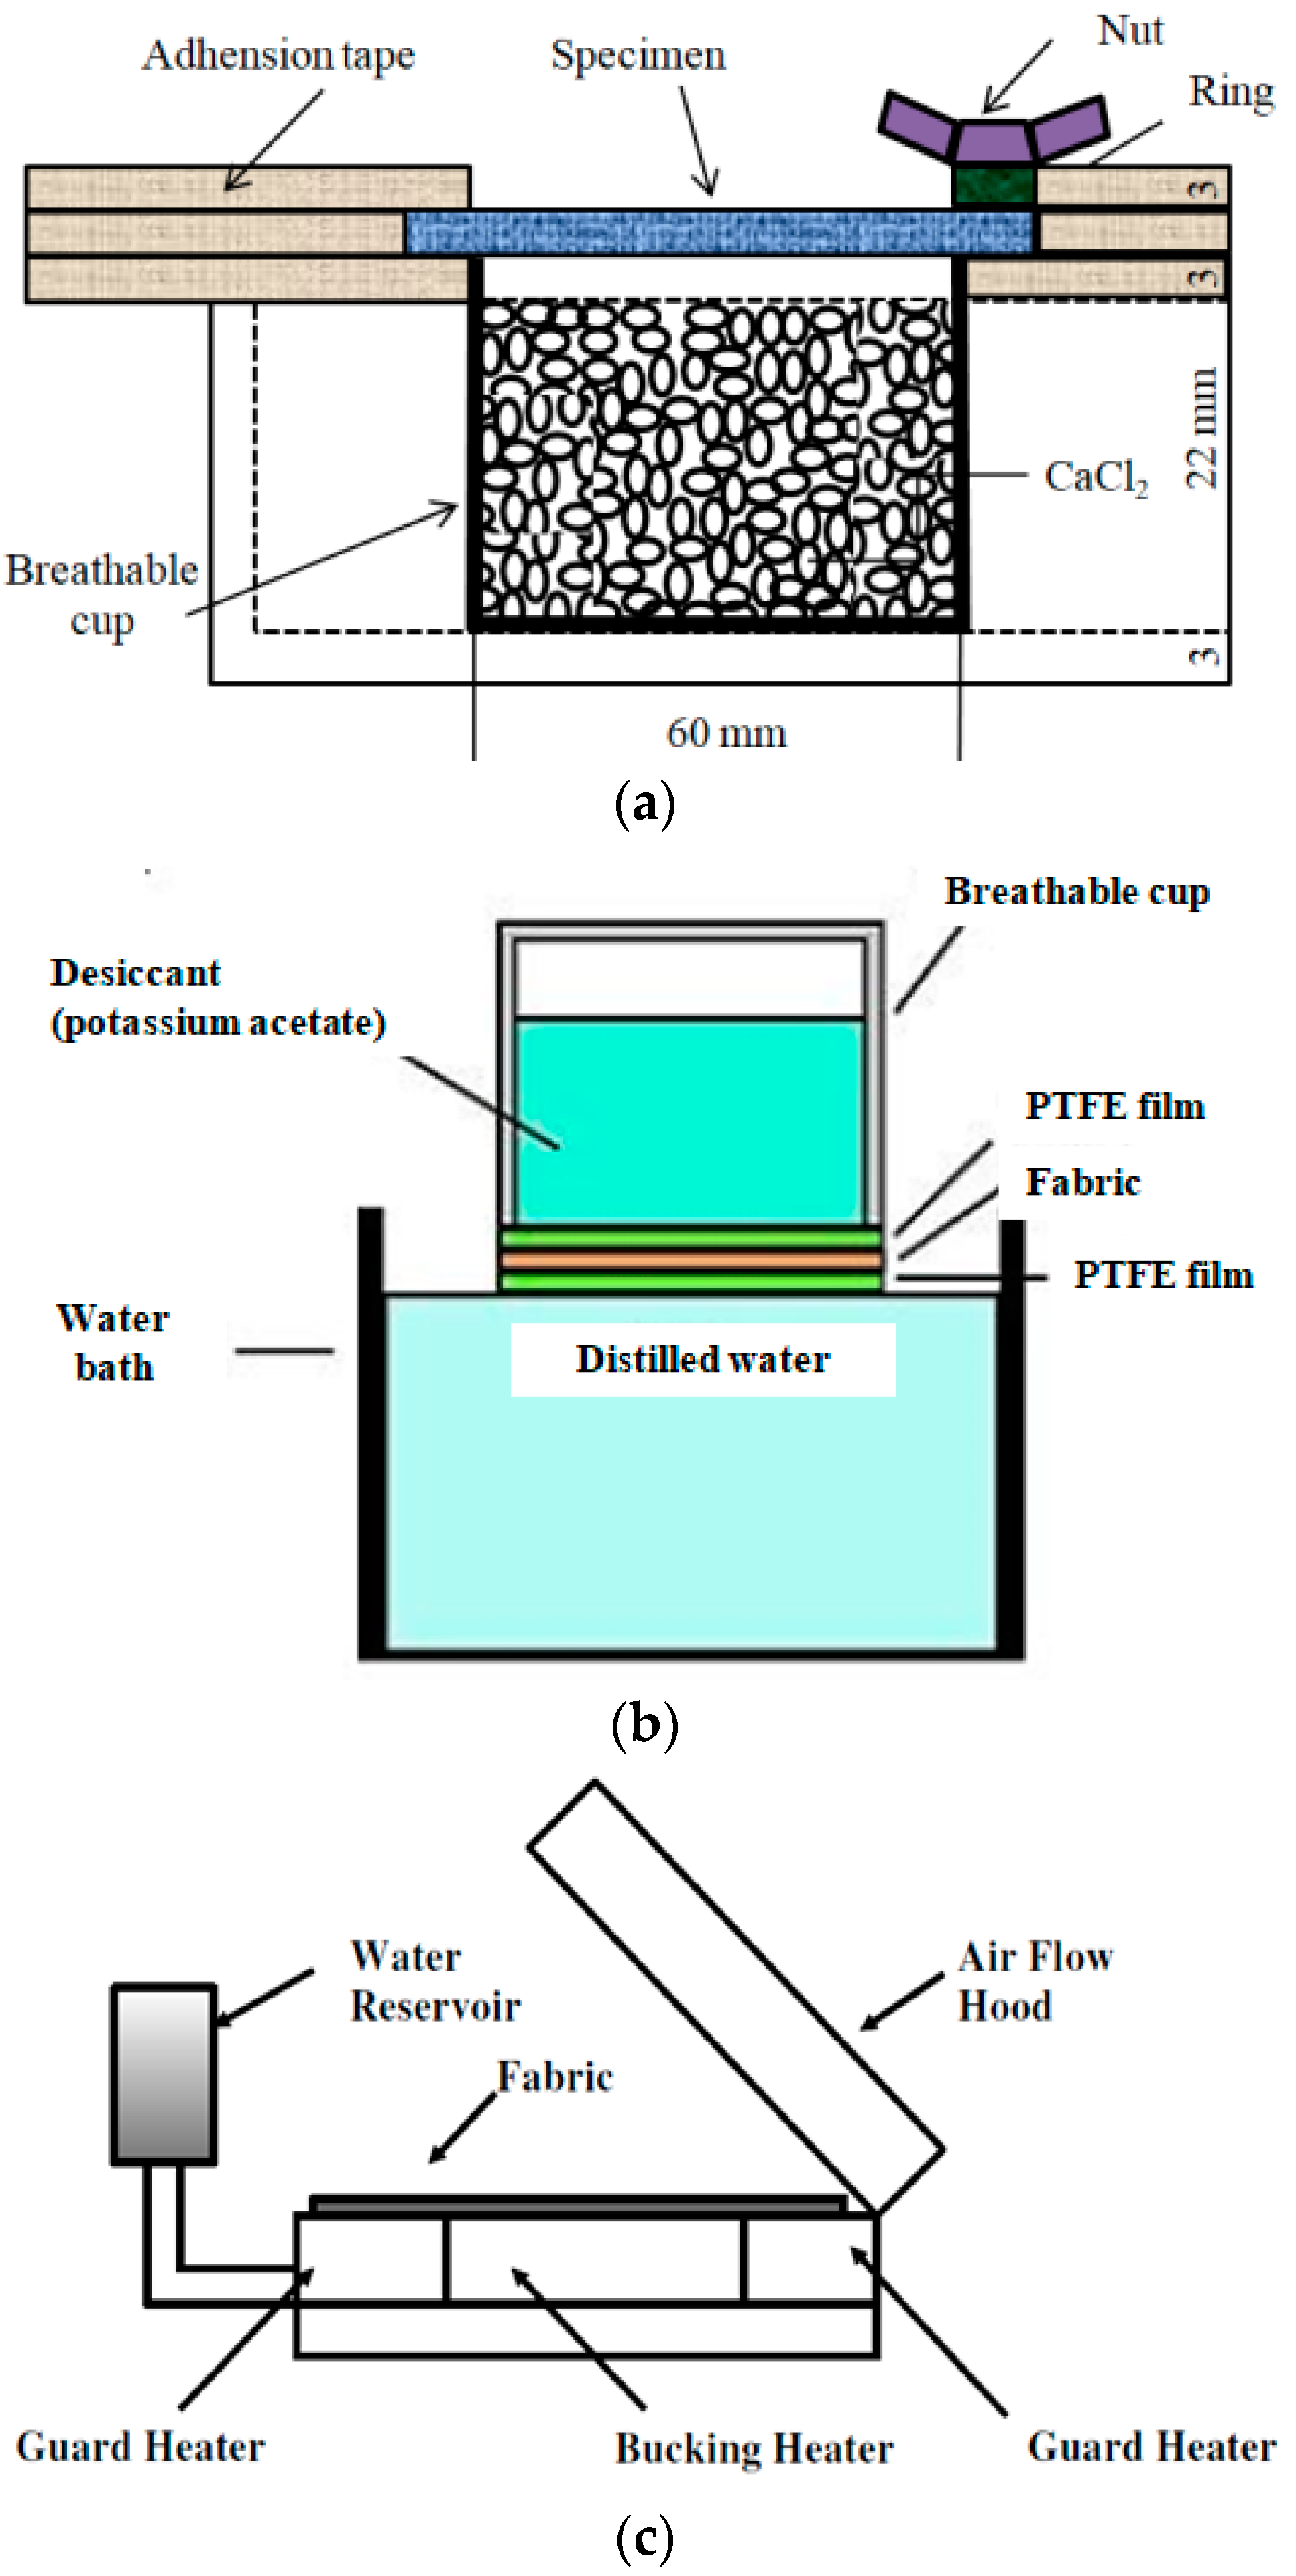
2.3.1. Measurement of the Water Vapor Transmission Rate

The water vapor transmission rate (WVTR) was measured using the ASTM E96-80 [23], which was based on BS 7209 [26] and similar to the upright cup method, as shown in Figure 1a. Three fabric specimens, 7 cm in diameter, were prepared and conditioned at 20 ± 2 °C and RH of 65% ± 2% for 24 h. The fabric specimen was placed 3 mm away from CaCl2 in an aluminum cup (6 cm in diameter and 2.5 cm in height); its surface faced the CaCl2 in the cup. Packing rubber with circular covering was clamped and sealed over the fabric specimen on the mouth of the aluminum cup to prevent water vapor from leaking between the fabric specimens and aluminum cup. Three aluminum cup assemblies with fabric specimens were placed in the conditioning room of 40 ± 2 °C and 90% ± 5% RH for one hour. The water vapor transmission rate (WVTR, g/m2∙24h) was calculated using Equation (1).
WVTR = 24 G/(T·A)
where WVTR is water vapor transmission rate (g/m2·24h), and G/T is the slope of the straight line (weight loss per unit time, g/h). A is the test area (m2).

2.3.2. Measurement of the WVP

The WVP (g/m2∙24 h) was measured using the JIS L 1099 B-1 [24] measuring method, which was similar to the inverted cup method, as shown in Figure 1b. Three specimens, 8 cm in diameter, were prepared and conditioned at 20 ± 1 °C and RH of 65% ± 5% for 24 h. Three shallow impermeable and breathable cups were prepared and filled with a desiccant agent (potassium acetate). An assembly water bath was also prepared to contain distilled water. Distilled water was placed in the assembly bath on which a breathable cup was laid. The temperature was kept at 40 ± 2 °C with an RH of 50% ± 5%. The fabric specimen was placed over a hydrophobic membrane, which was used to seal the mouth of the cup. The Polytetrafluoroethylene (PTFE) membrane was sealed below the desiccant to prevent moisture vapor from wetting the specimen placed below the desiccant. Therefore, the water vapor is transmitted through the fabric specimen from inside the assembly cup to the breathable cup surrounded by the desiccating agent (potassium acetate). The increase in mass of the breathable cup after a specific time has elapsed is equal to the mass of water vapor that passed through the fabric specimen. The WVP was calculated using Equation (2).
P = 10 × 24 (m1 − m2)/(S × T)
where P is WVP (g/m2/day); m1 is the mass of the breathable cup after the test (mg); m2, S, and T are the mass of the breathable cup before the test (mg), specimen area (cm2), and testing time (h), respectively.

2.3.3. Measurement of the Moisture Vapor Resistance

The moisture vapor resistance (Ref, m2·Pa/W) of the fabric was measured using a sweating guarded hot plate (Thermometer DAC, Cambridge, UK) according to the ISO 11092 [25] method, which uses an evaporative wet heat transfer method. Figure 1c presents a schematic diagram of this apparatus. A fabric specimen, 50.8 cm × 50.8 cm in size, was prepared and conditioned in the standard atmosphere with an RH of 65% and a temperature of 20 °C. The specimen was placed over the PTFE membrane on a perforated metal surface on a hot plate, which was used to prevent the water on the perforated metal from wetting the fabric specimen. The temperature of the guarded hot plate and air in the chamber was kept at 35 ± 0.5 °C (i.e., human skin temperature) with an RH of 40% and an airspeed of1 m/s. Moisture vapor resistance (Ref) of the fabric was measured by measuring the evaporative heat loss (H) in the steady-state condition, using Equations (3) and (4).
R e , t = ( p s p a ) A H
where, Re,t is the total resistance to evaporative heat transfer provided by the fabric system and air layer (m2·Pa·W−1); A is the area of the plate test section (m2); ps is the water vapor pressure at the plate surface (Pa); pa is the water vapor pressure in air (Pa); and H is the power input (W).
Re,f = Re,t − Re,
where, Re,f is the resistance to evaporative heat transfer provided by the fabric, and Re,a is the resistance measured for the air layer and liquid barrier. The arithmetic mean of five readings from each fabric specimen was calculated.

3. Results and Discussion

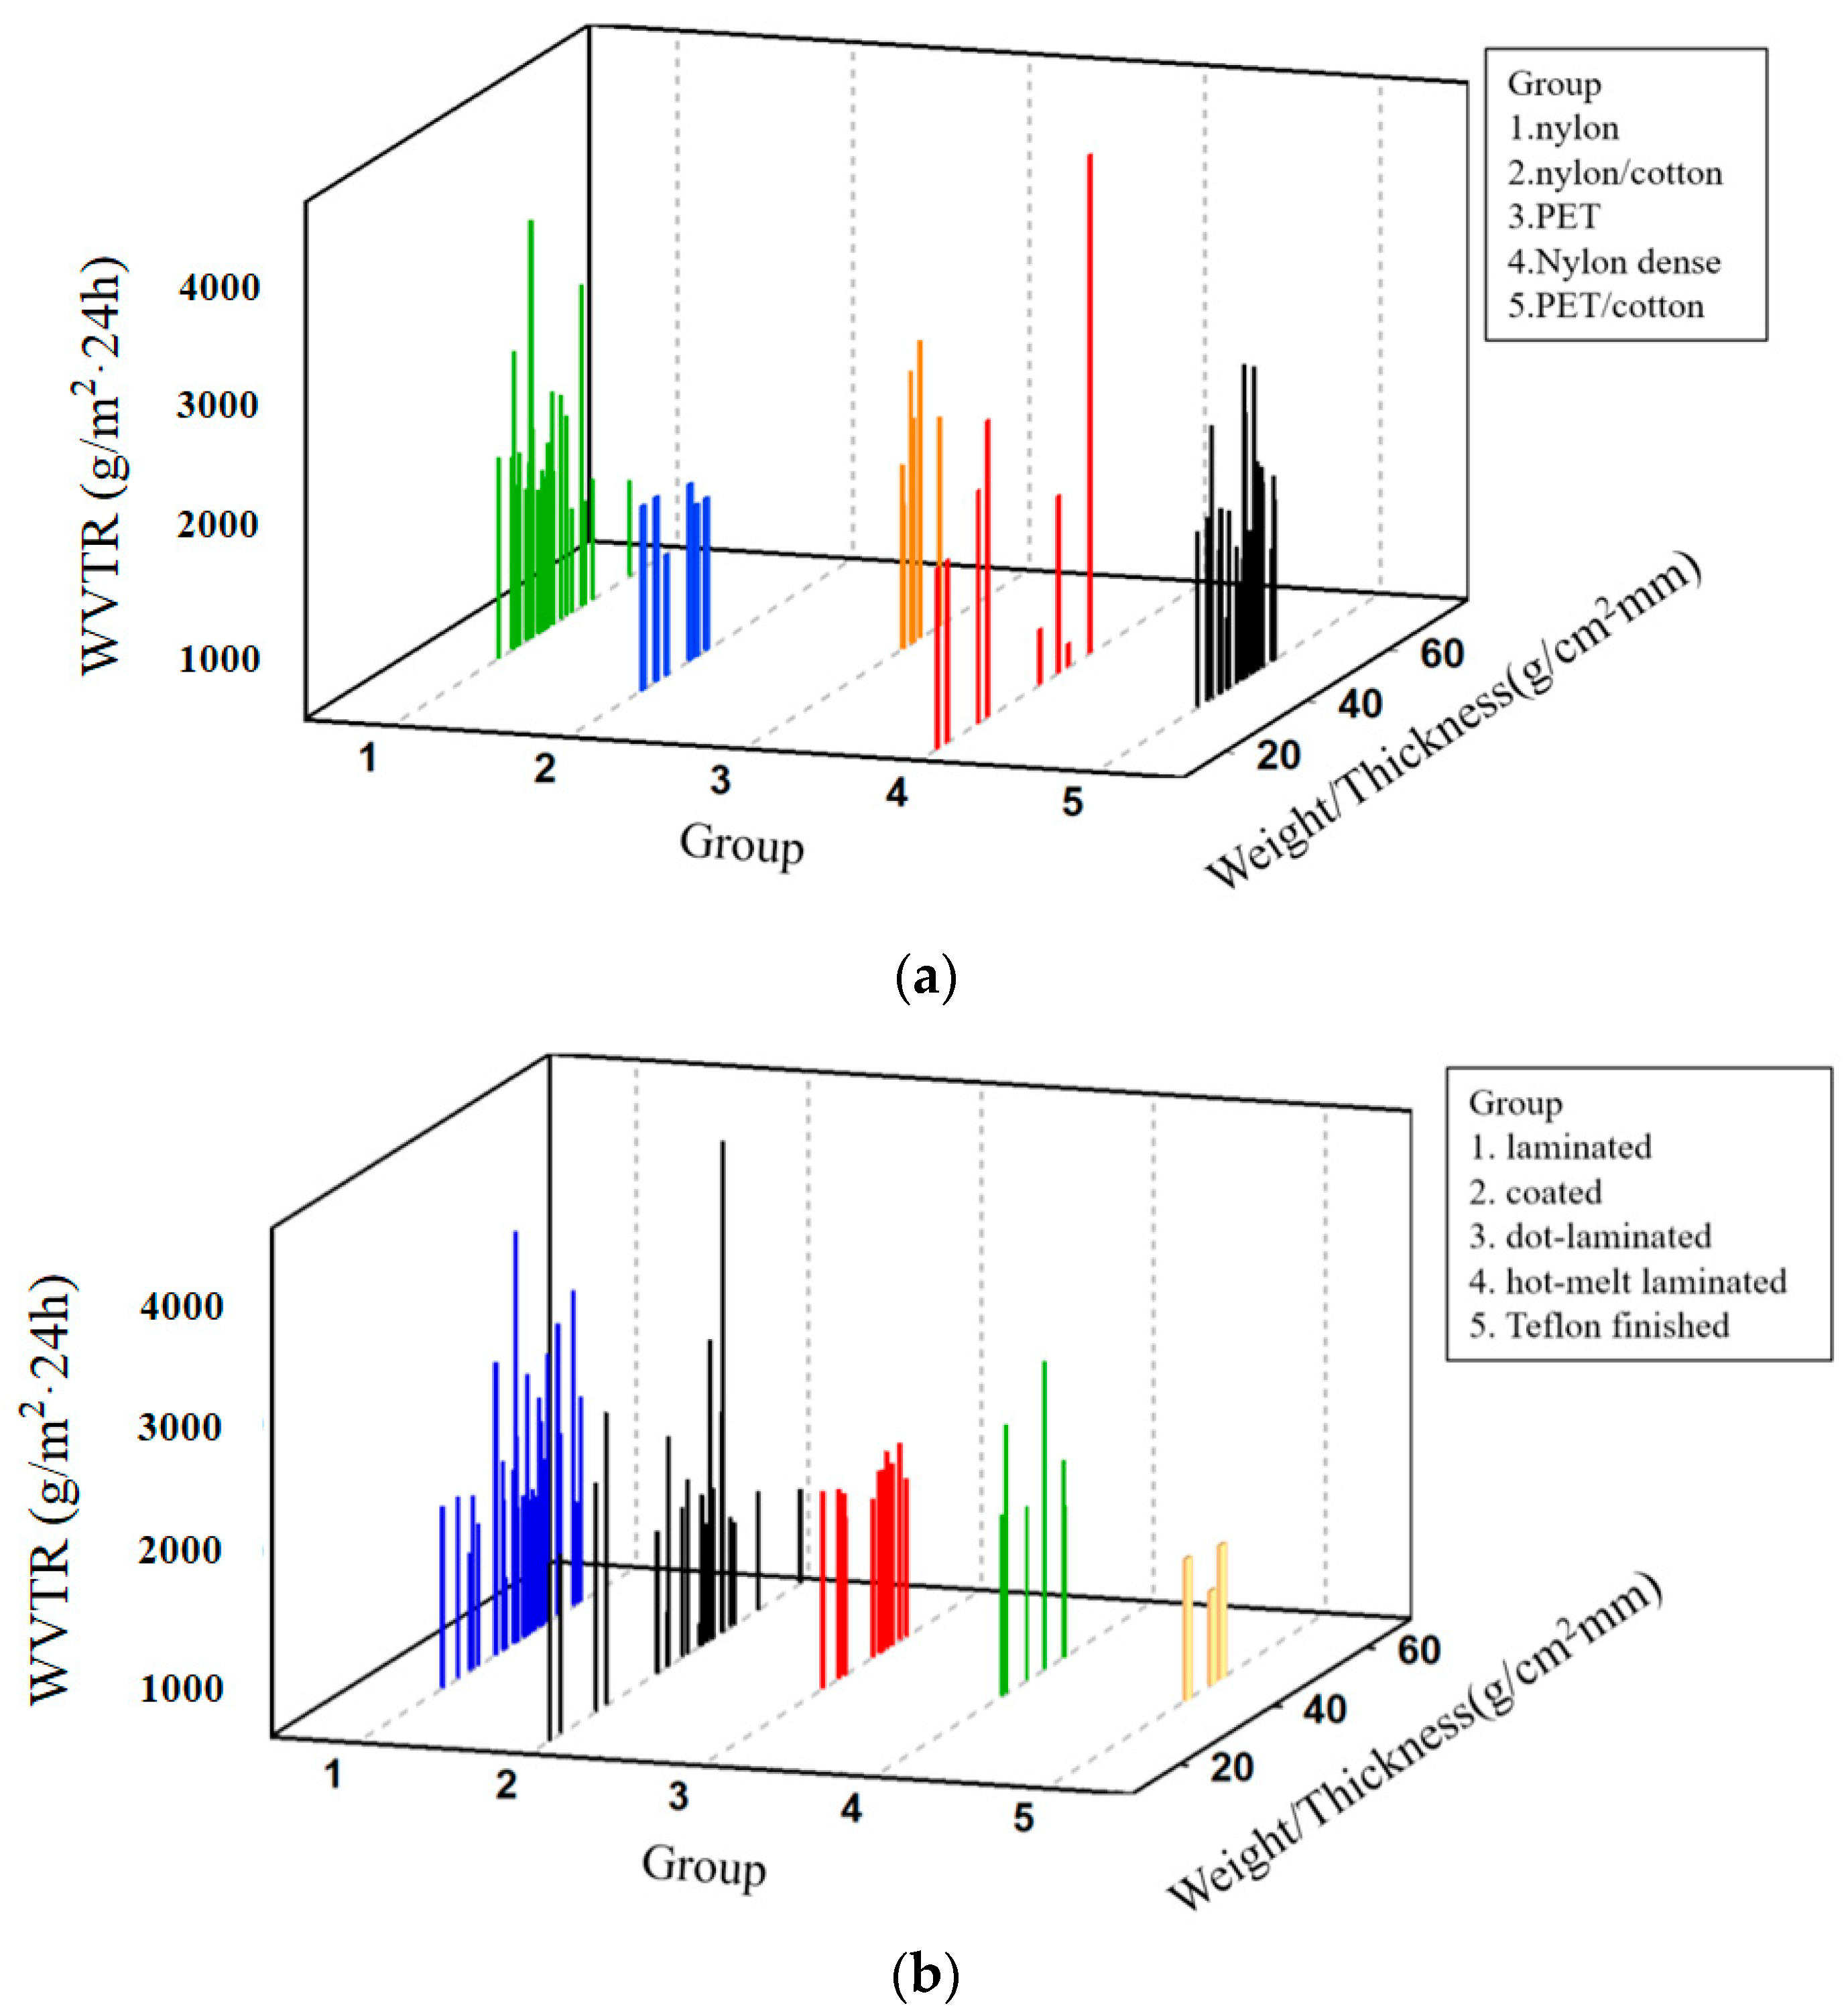
3.1. WVTR Using the Upright Cup Method (ASTM E96-80)

Figure 2 presents the WVTR using the upright cup method (ASTM E96-80) [23] of the fabric specimens according to the constituent fiber materials (Figure 2a) and surface modification method (Figure 2b) with the weight per thickness of the fabrics.
As shown in Figure 2a, the WVTR of the nylon (group 1), nylon dense (group 4), and PET (group 3) fabrics were widely distributed with the relevant weight per thickness of the fabric. In contrast, the blended woven fabrics with nylon and cotton (group 2) and blended woven fabrics with PET/cotton (group 5) exhibited a low WVTR and a similar WVTR according to weight per thickness of fabrics. In addition, as shown in Figure 2b, the WVTR of the fabrics treated with laminating (group 1) and coating (group 2) methods was much higher than that of the fabrics treated with dot laminating (group 3) and hot-melt laminating (group 4) methods. This suggests that the WVTR of the laminated and coated nylon and PET fabrics was superior to that of the cotton blended fabrics treated with dot and hot-melt laminated finishing. On the other hand, the WVTR of the fabrics according to fabric structural parameters was investigated by plotting the WVTR of the 73 fabric specimens as a function of the fabric thickness, weight, and density, as shown in Figure 3. Changes of the WVTR to the fabric density, thickness, and weight in Figure 3 were drawn to easily estimate their dependency on the fabric structural parameters using a red line, which will be compared with regression equation analyzed in Section 3.5.
As shown in Figure 3, the WVTR of the 73 fabric specimens increased and then decreased with increasing fabric density (both warp and weft), fabric thickness, and weight. These results can be explained by the amount of air voids in the fabric, i.e., many air spaces in the fabrics under very low fabric density (high porosity) entrap the neighboring air and prevent moisture vapor flow from the inner layer to the outer one of the fabrics, which enables low WVTR. Successively, increasing fabric density decreases air spaces in the fabric, resulting in an increase of the WVTR up to the critical fabric density. However, the WVTR is decreased, as the fabric density is increased considerably and jammed, because highly jammed and dense fabrics have no voids in the fabric, which imparts a decrease of WVTR, which will be verified in the curvilinear regression analysis in the Section 3.5.

3.2. Water Vapor Permeability Using the Inverted Cup Method (JIS L 1099B-1)

Figure 4 shows the WVP of the 73 fabric specimens measured using the inverted cup method according to the fiber materials and surface modification method.
The distribution of water vapor permeability measured using the inverted cup method (Figure 4) according to the fiber materials and surface modification method differed slightly with that of the WVTR (Figure 2) measured using the upright cup method. As shown in Figure 4a, the distribution of water vapor permeability of the nylon fabrics (groups 1 and 4) was much wider than that of the PET fabrics (group 3). In addition, the distribution of water vapor permeability (Figure 4a) of the blended fabrics with PET/cotton (group 5) was wider than that of the WVTR of groups 2 (nylon/cotton fabrics). These results were attributed to the difference of mechanism between two measuring methods, i.e., WVTR is assessed by transmission of water vapor by forced convection due to CaCl2 in upright cup, whereas in the inverted cup method, WVP is measured with hydrophobic PTFE film, which does not allow absorption of moisture in the fabric, giving WVP a much higher value than that of WVTR. Figure 4b shows the water vapor permeability according to the surface medication method. The water vapor permeability of the laminated and coated fabric specimens (groups 1 and 2) was much higher than that of the dot laminated and hot-melt laminated fabric specimens (groups 3 and 4), which was similar to that of Figure 2b. Figure 5 presents a diagram of water vapor permeability of the 73 fabric specimens plotted as a function of the fabric thickness, weight, and fabric density. Curvilinear red lines in Figure 5a,b were drawn to easily estimate the dependencies of WVP on the fabric structural parameter.
As shown in Figure 5a,b, the water vapor permeability of the 73 fabric specimens increased and then decreased with increasing fabric thickness, weight, and fabric density, which was similar to the case of WVTR measured using the upright cup method, as shown in Figure 3a,b. Comparing the WVTR measured using the upright cup method with the WVP measured using the inverted cup method, the WVTR of the 73 fabric specimens was distributed between 1000 and 4000 (g/m2·24h), and the WVP ranged between 5000 and 15,000 (g/m2·24h). The reason for higher WVP than WVTR is thought to be that the WVP method does not allow the passage of liquid water and leakage of water vapor absorbed during assessment because of the hydrophobic PTFE film placed on the fabric specimen. Superior WVTR and WVP were obtained in the nylon and PET laminated or coated fabrics with appropriate fabric density and thickness. However, to obtain the detailed relation between the two values and the influential factors affecting WVTR and WVP, statistical analysis between WVTR and WVP measured using two methods will be performed in next section.

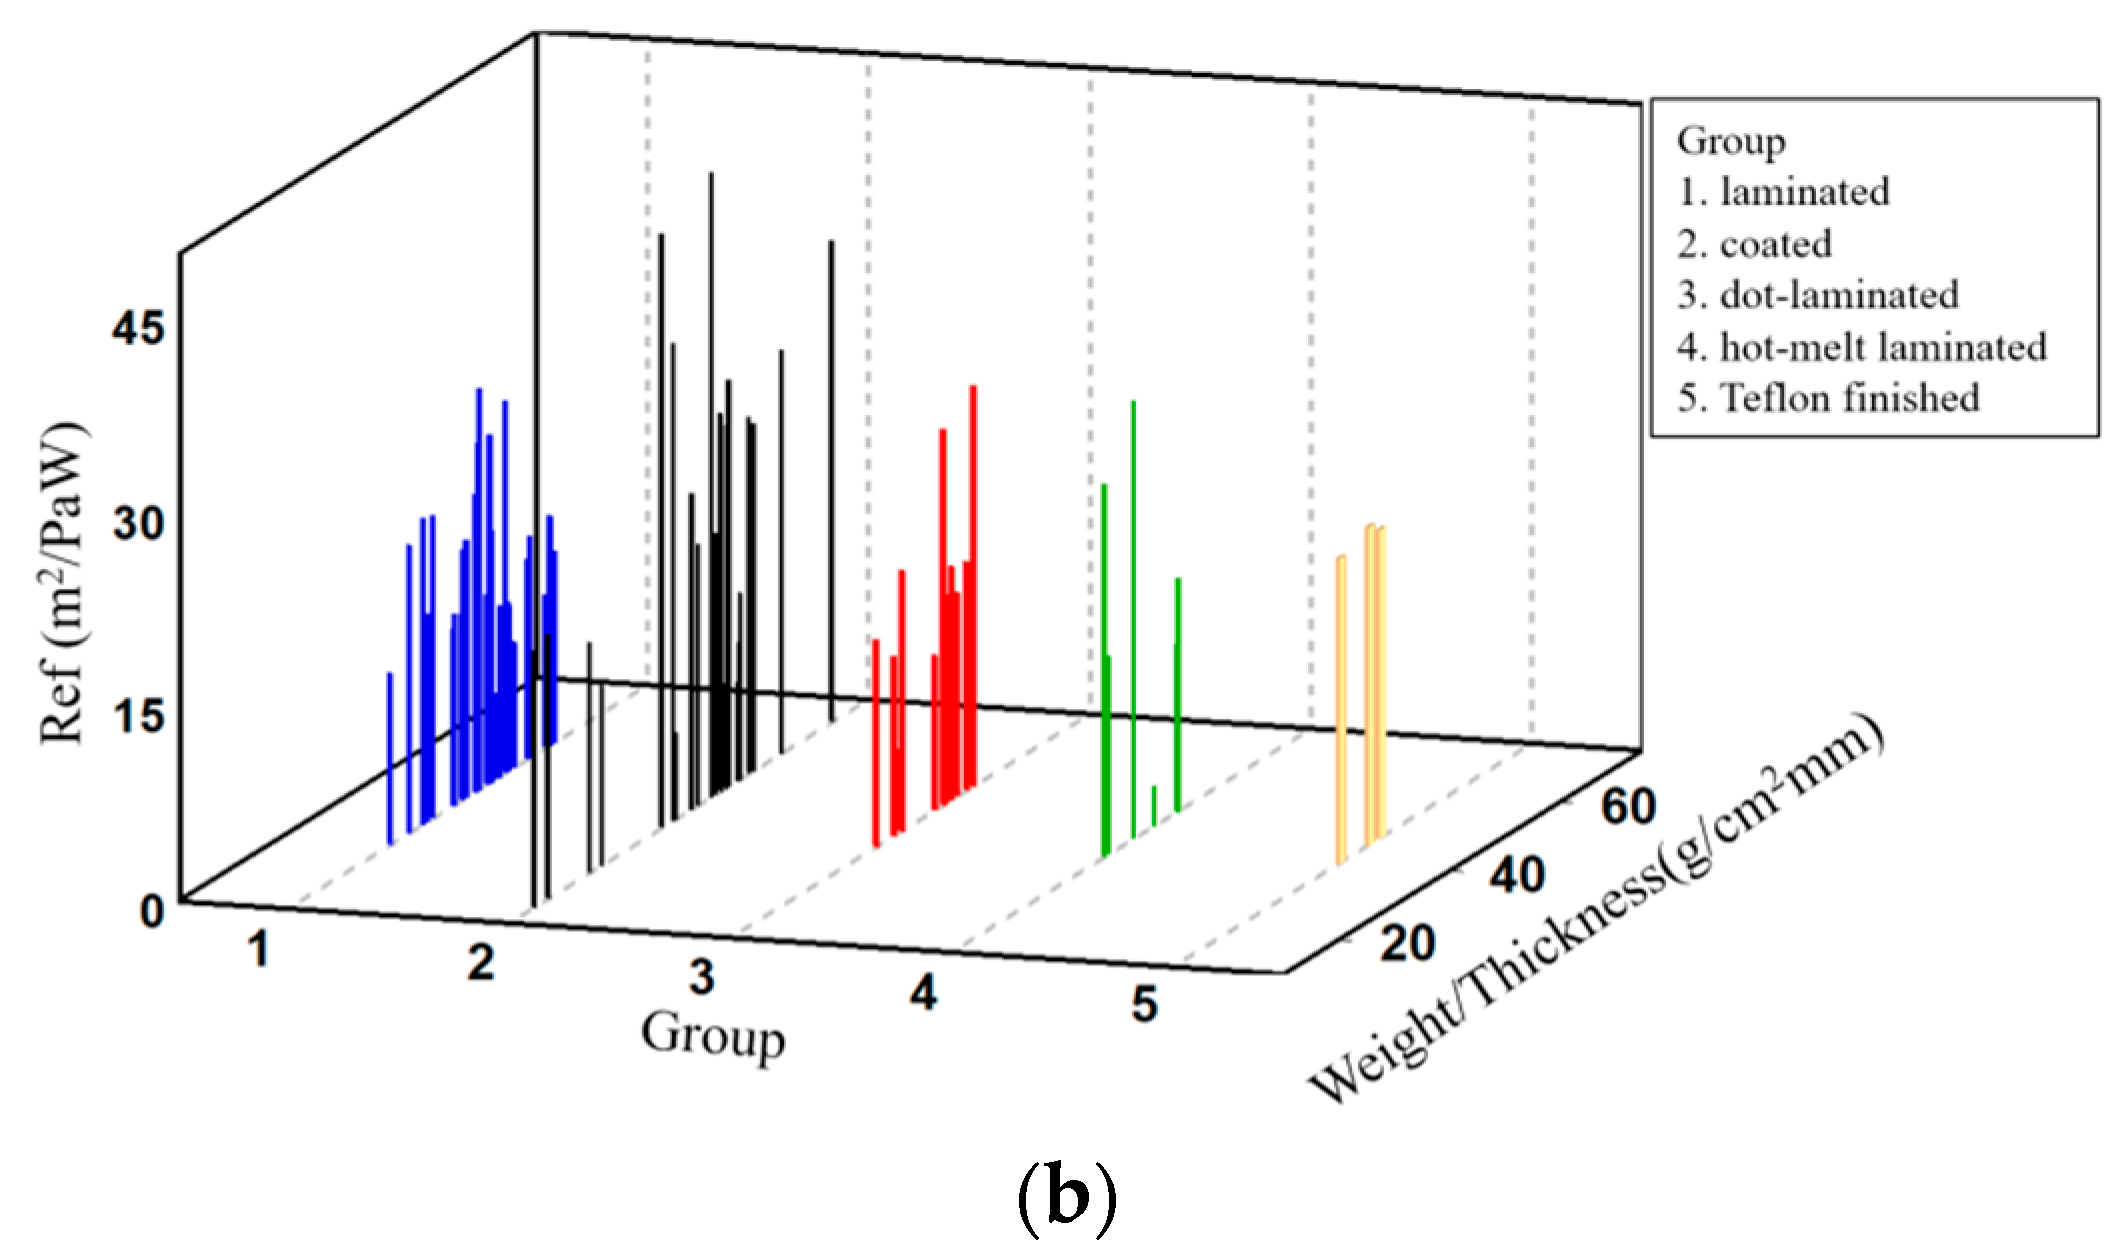
3.3. Moisture Vapor Resistance Using Evaporative Wet Heat Transfer Method

Figure 6 presents the moisture vapor resistance (Ref) of the 73 fabric specimens measured using the evaporative wet heat transfer method. As shown in Figure 6a, the moisture vapor resistance of the nylon/cotton blended fabrics (group 2) and PET fabric (group 3) specimens was lower than that of the nylon fabrics (groups 1 and 4) and fabrics blended with PET/cotton (group 5), i.e., they exhibited a better WVP. These results are in contrast with those measured using the upright cup and inverted cup methods. Figure 6b presents the moisture vapor resistance plotted as a function of the weight/thickness of the 73 fabric specimens according to the surface modification method. The moisture vapor resistance of the fabric specimens modified by the laminating (group 1) and coating (group 2) methods was higher than that of dot laminated (group 3) and hot-melt laminated fabric specimens (group 4). Hence, they exhibited poor breathability, which was also contrary to that measured using the upright cup and inverted cup methods. In addition, the change of Ref according to the weight/thickness was much greater than that of WVTR and WVP shown in Figure 2 and Figure 4. This indicates that Ref measured using the evaporative wet heat transfer method was much more precise than WVTR and WVP measured by the forced convection of CaCl2 and desiccating agent (potassium acetate). Figure 7 presents a diagram of the moisture vapor resistance according to the fabric structural parameters. Curvilinear red lines in Figure 7a,b were drawn to easily foresee the changes of WVP according to the fabric structural parameters. The graph shape of the moisture vapor resistance and fabric thickness and fabric density was concave (Figure 7a). In addition, the graph shape of the moisture vapor resistance against fabric weight and density was also concave (Figure 7b), which contrasted with the results in Figure 3 and Figure 5, which showed convex shapes. This is because of the contrary definition between the moisture vapor resistance and WVTR and WVP. The correlation analysis between WVTR and moisture vapor resistance, and between WVP and moisture vapor resistance according to the fiber materials and surface modification method, is performed in the next section. Furthermore, contribution of fabric structural parameters affecting breathability according to surface modification method and materials is examined by regression analysis with a measuring method in the Section 3.5.

3.4. Correlation Analysis between the Measuring Methods of Breathability

In the previous section, the breathability of the 73 waterproof breathable fabric specimens made from the various fiber materials, surface modification methods, and fabric structural parameters was examined according to the three measuring methods. The effects of the fiber materials and surface modification methods on the measuring method of breathability are very important for understanding the difference between the methods for measuring breathability and the breathability characteristics. Therefore, correlation analysis between the measuring method of breathability was performed according to fiber materials and surface modification methods. Table 3 lists the correlation coefficients between measuring methods according to the fiber materials and surface modification methods. The correlation between ISO 11092 [25] and ASTM E96-80 [23] of the PET and coated fabrics was significant at the 99% confidence level, respectively. In addition, the correlation between ISO 11092 [25] and ASTM E96-80 [23] in 73 fabric specimens was significant at the 95% confidence level.
As shown in Table 3, the correlation coefficient of the 73 fabric specimens between the ISO 11092 (Ret) [25] and ASTM method (WVTR) was −0.54, −0.10 between the upright cup method (ASTM E96-80, WVTR) [23] and inverted cup method (JIS L 1099B-1, WVP) [24] and 0.02 between the ISO 11092 [25] and JIS L 1099B-1 [24]. These results were consistent with McCullough et al. [20] who reported−0.59 between ISO 11092 [25] and ASTM E96-80 [23] and 0.02 between the ISO 11092 [25] and JIS L 1099B-1 [24] methods using 26 waterproof breathable fabrics made from nylon and polyester. On the other hand, these results were in contrast to those obtained by Huang and Qian [22], who reported that the correlation coefficient between ISO 11092 [25] and JIS L 1099B-1 [24] for the regular fabric was −0.867 and −0.661 for laminated fabrics. Gorjanc et al. [5] reported that the correlation coefficient between the water cup method [27] and Permetest method [28] for eight types of cotton fabrics was >0.9, which was in contrast to the present findings and other studies. These results suggest that the measured breathability of the coated and laminated woven fabrics differs according to the measuring method, fabric materials, and surface modification method of fabrics, resulting in different correlation coefficients between the measuring methods according to the fabric materials and surface modification method. Hence, the correlation coefficient between the measuring methods was examined according to the fabric materials, such as polyester and nylon, and surface modification methods such as laminating and coating (Table 3). The correlation coefficient of the polyester fabrics between the ISO 11092 [25] and ASTM methods was −0.833 and −0.616 for nylon fabrics, which concurred with Huang and Qian [22] and McCullough et al. [20]. McCullough et al. [20] reported that the correlation coefficient between the two methods was −0.661 for laminated fabrics and −0.59 for WWB (waterproof, windproof, and breathable) shell fabrics. Regarding the correlation coefficient between the measuring method according to the surface modification method, the correlation coefficient between ISO 11092 [25] and ASTM E96-80 [23] methods was −0.715 for the coated fabrics and −0.710 for the hot-melt laminated fabrics. In contrast, the correlation coefficient between the ASTM E96-80 [23] and JIS L 1099B-1 [24] methods was −0.71 for the hot-melt laminated fabrics, showing a relatively higher correlation coefficient than the other surface modification methods. These results suggest that, when assessing the fabric breathability, the results measured by different measuring methods differ according to the fiber materials and surface modification method of the fabric. Therefore, selecting an appropriate measuring method according to the fabric materials and surface modification method is very important. Overall, of the measurement method of breathability and moisture vapor resistance (Ref) measured using the evaporative wet heat transfer method was much more precise than WVTR and WVP, moreover, the Ref of the PET coated fabrics measured using ISO 11092 [25] was highly correlated with WVTR measured using ASTM E96-80 [23] compared with other fabrics (nylon and laminated).

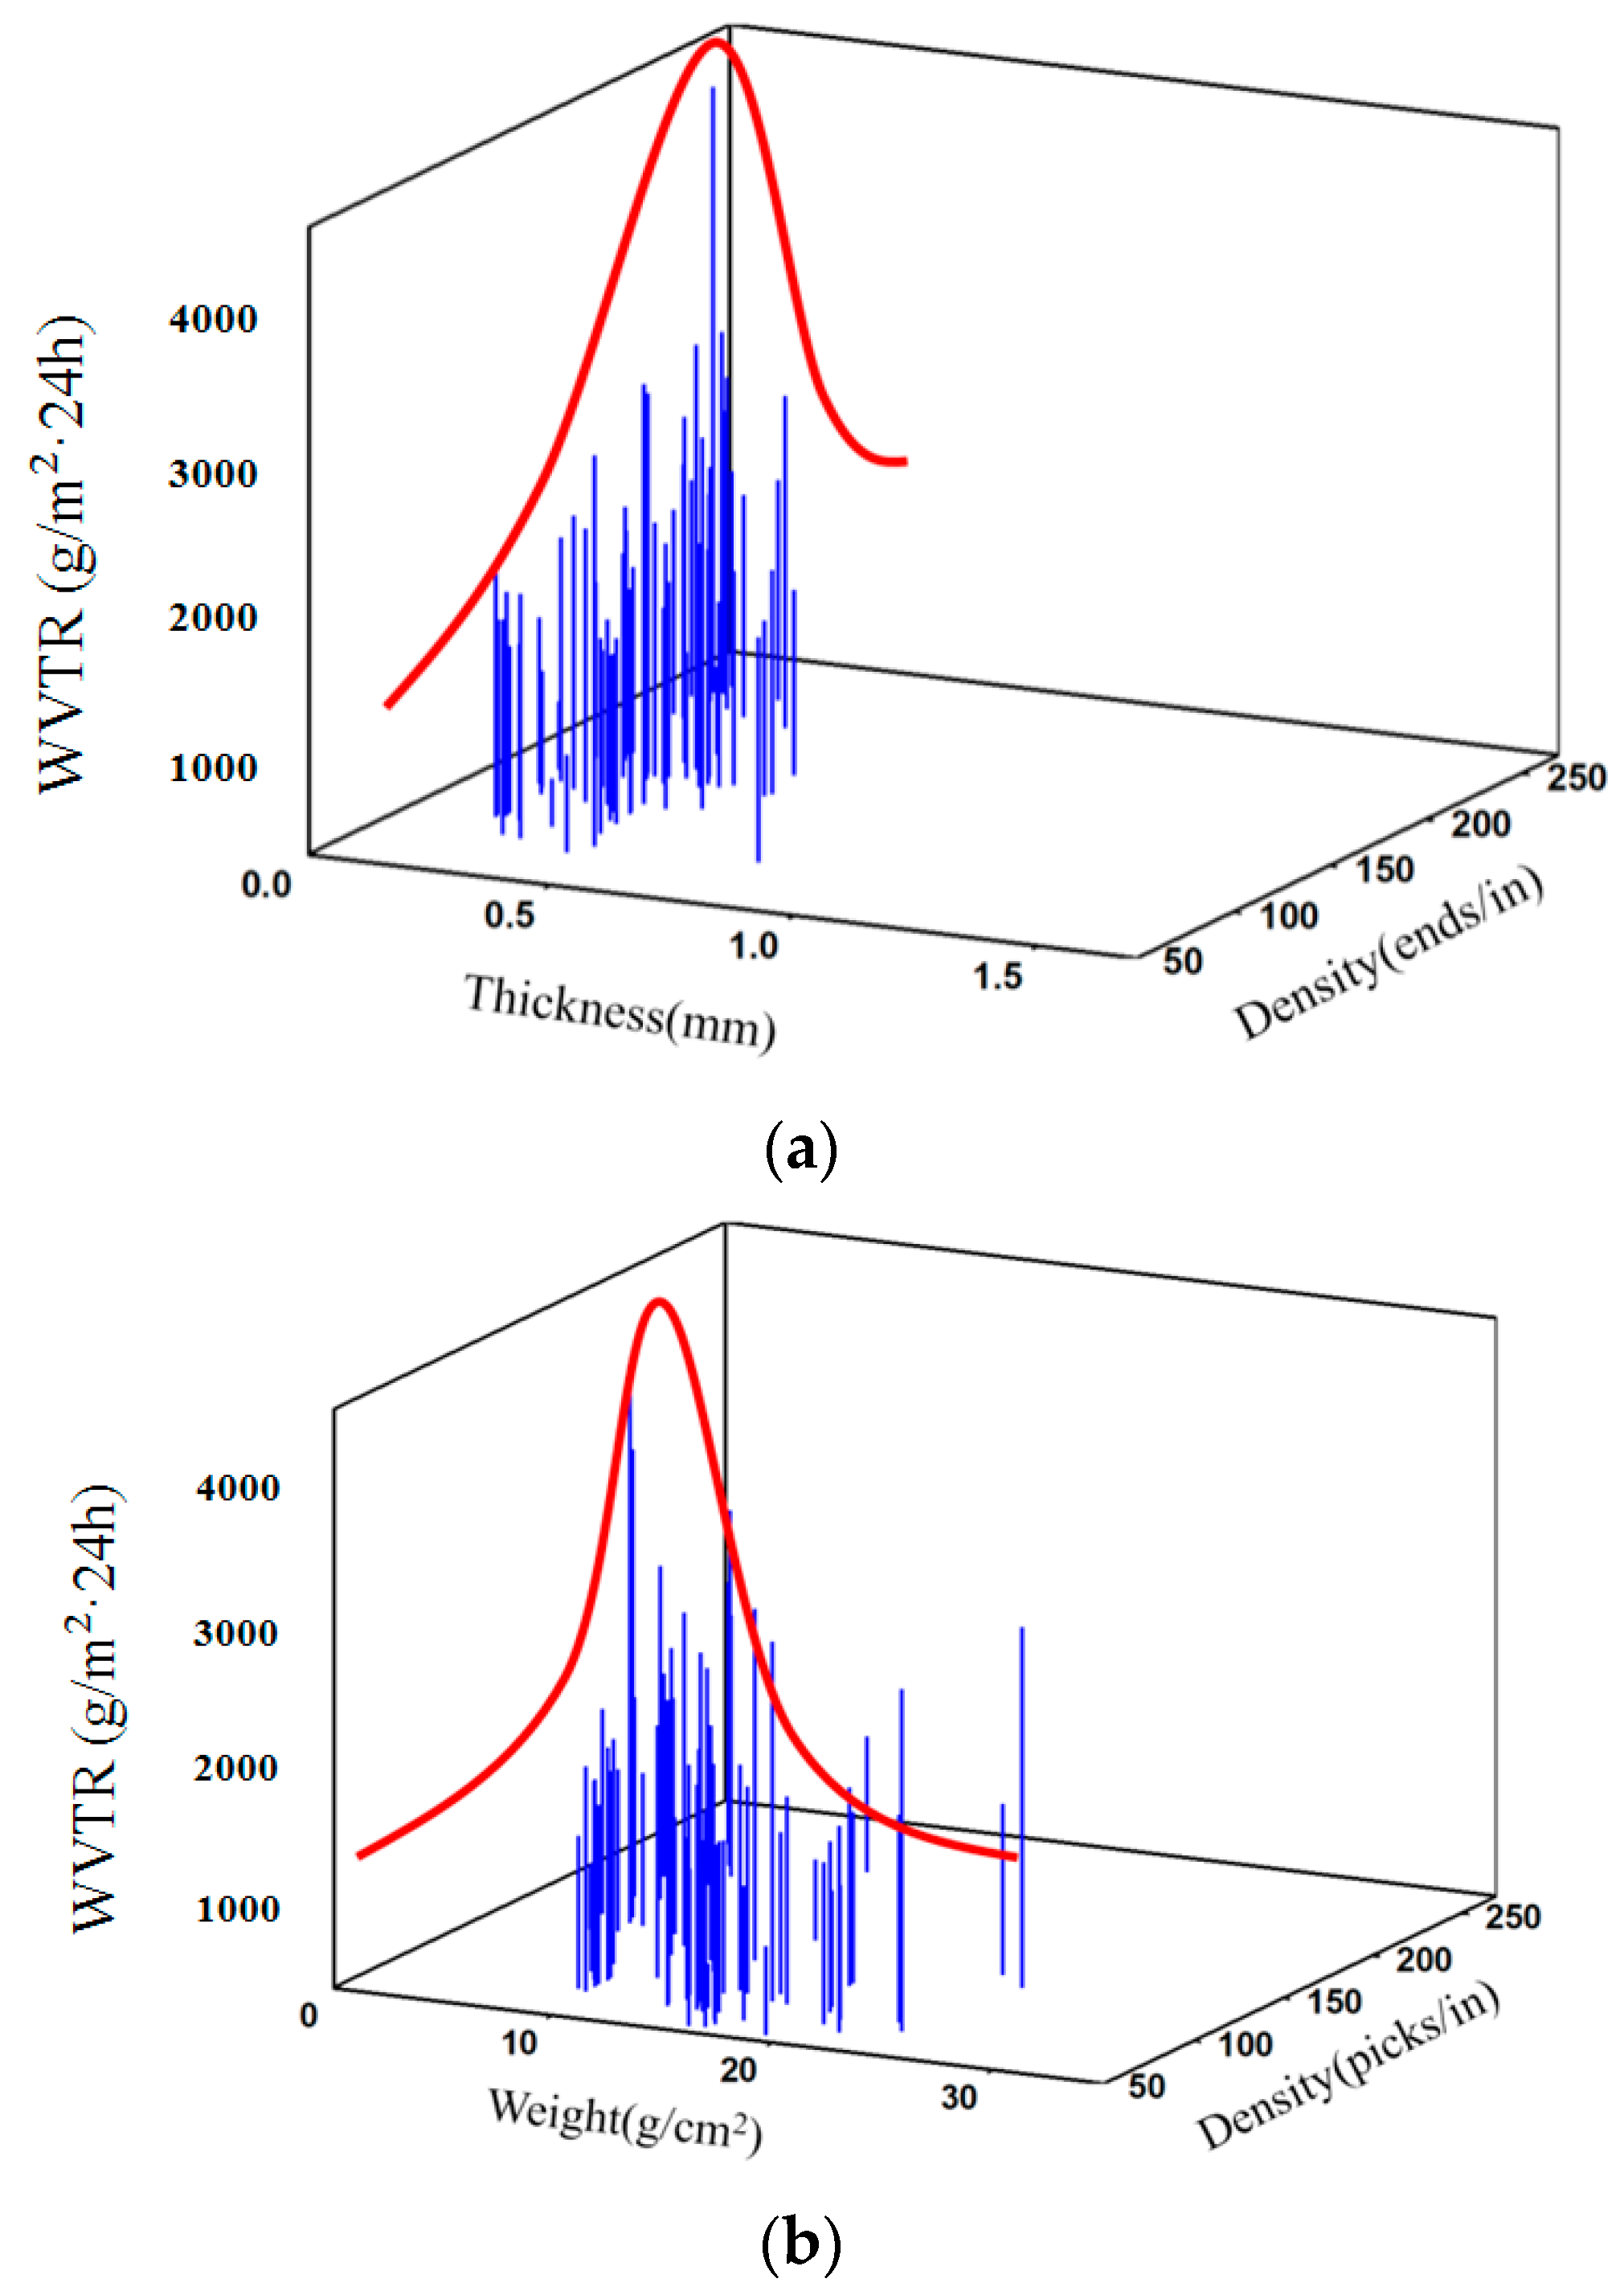
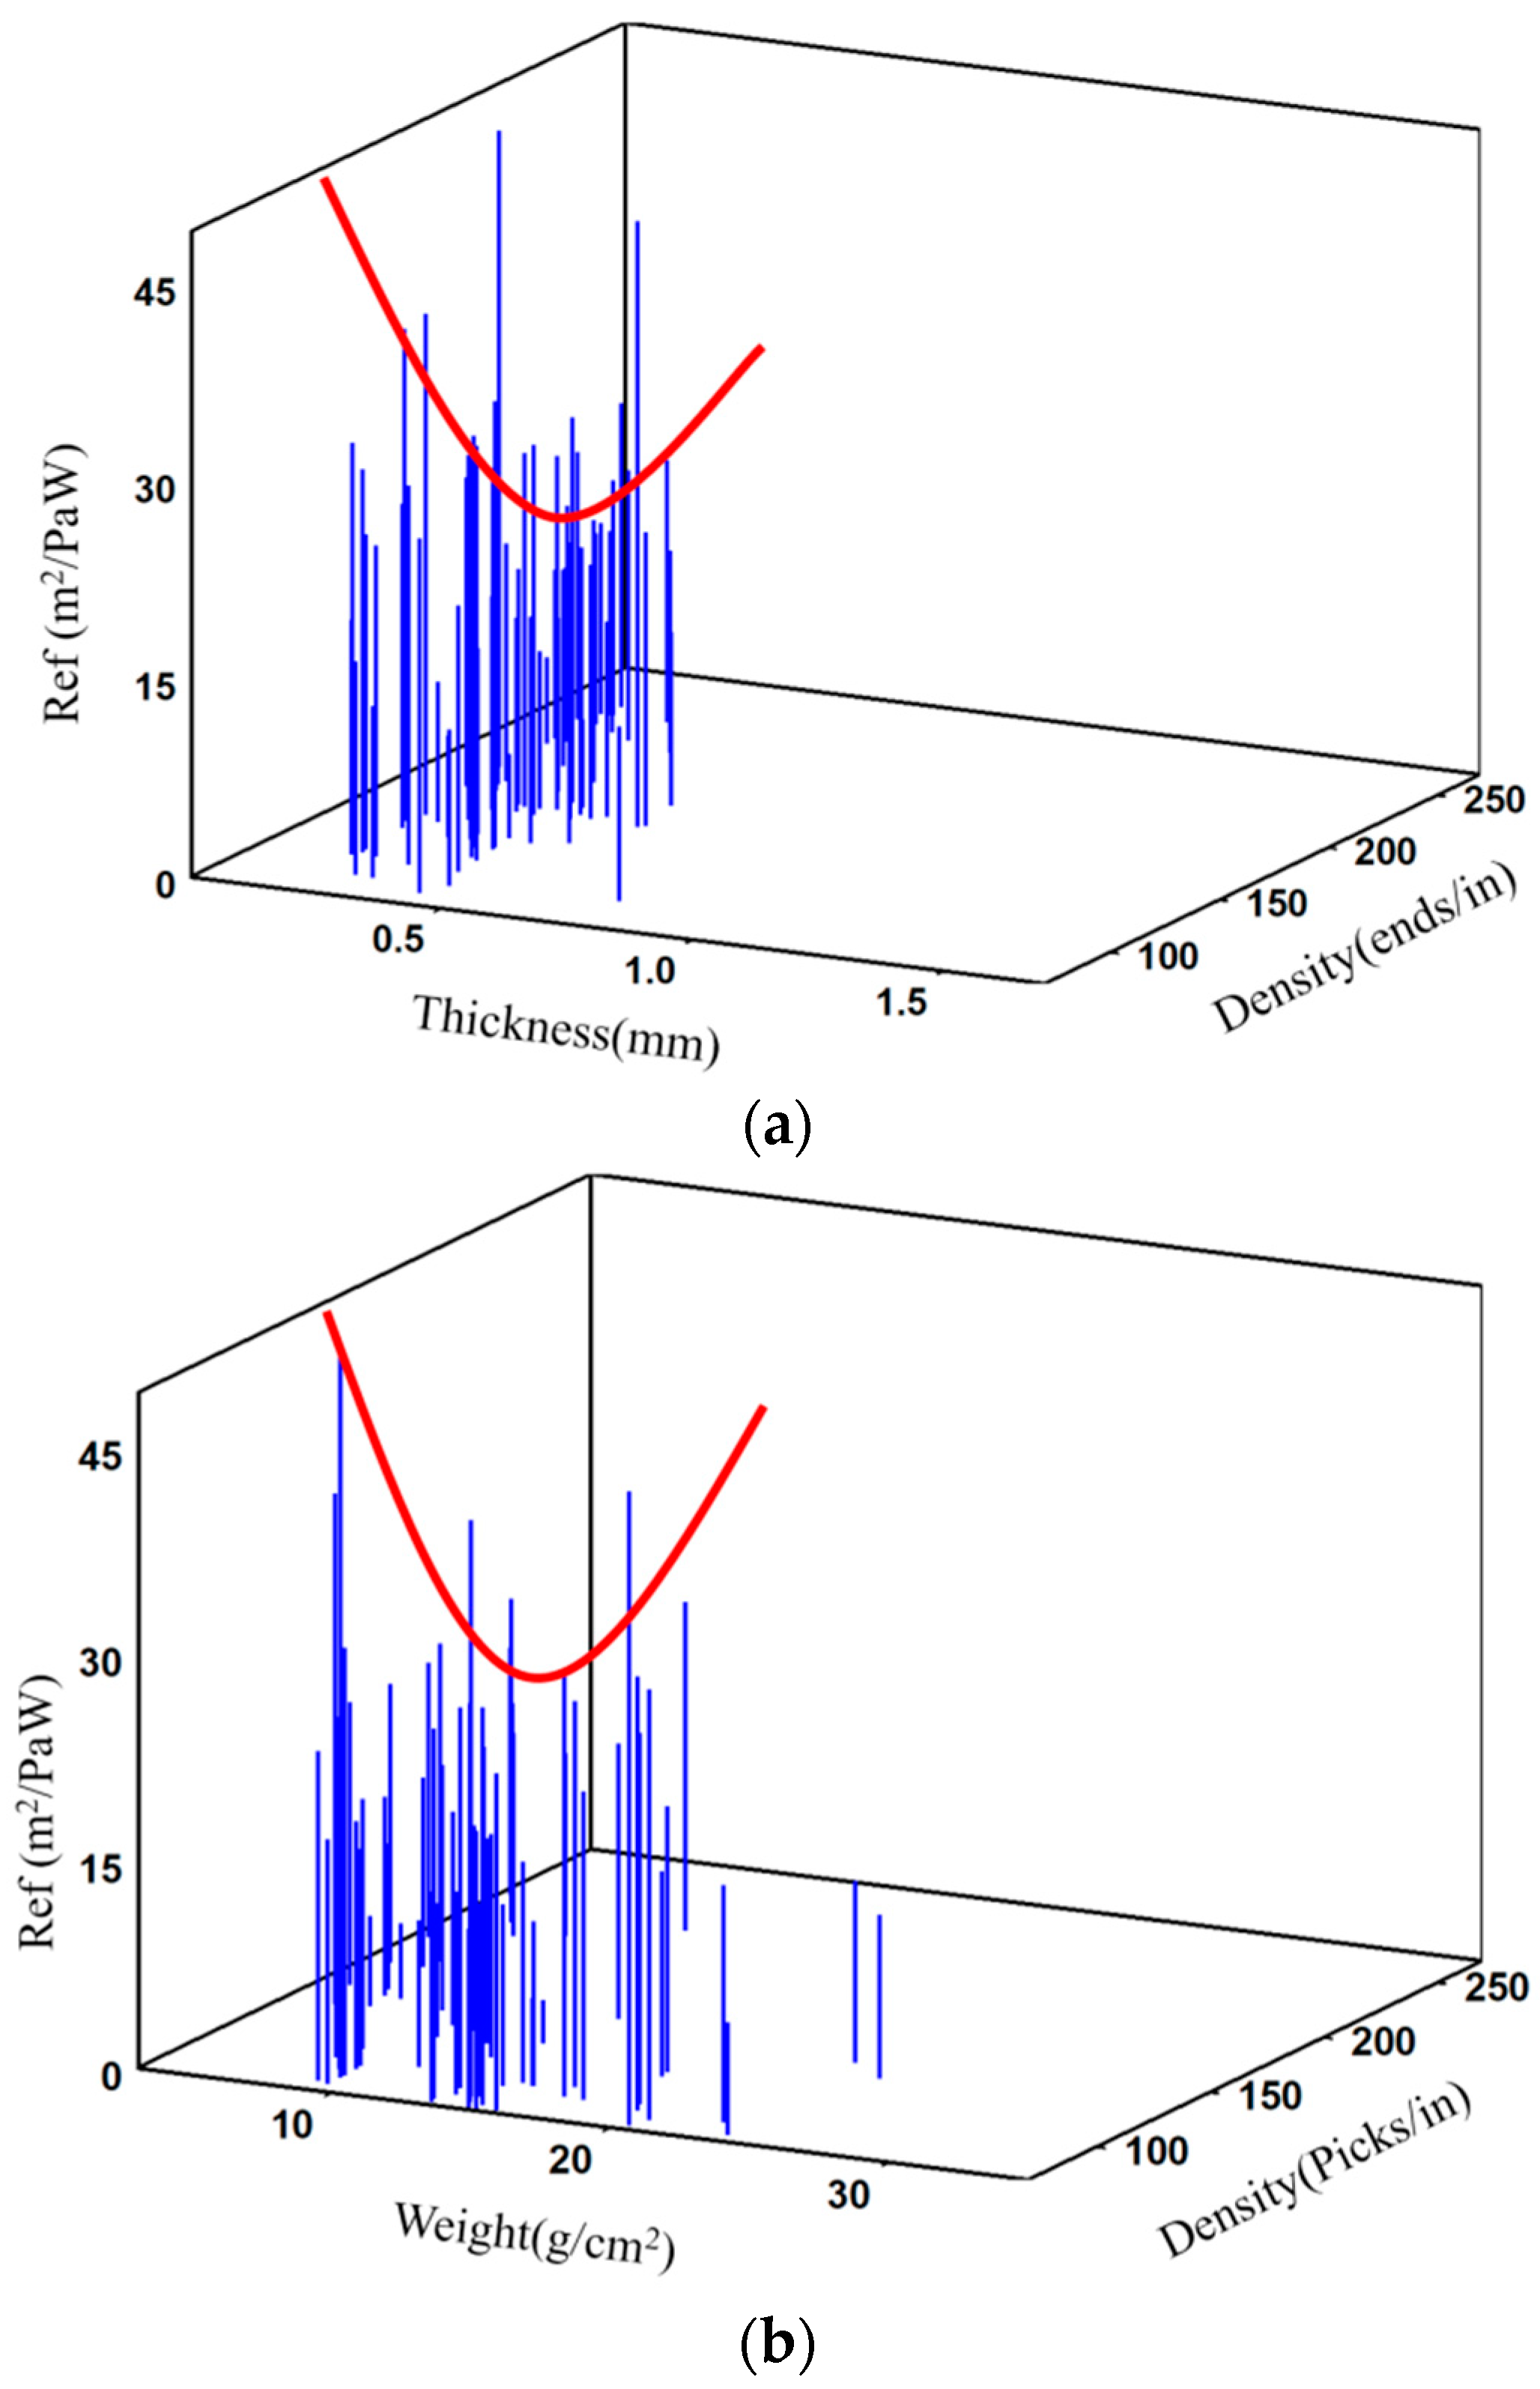
3.5. Regression Analysis between the Breathability and Fabric Structural Parameters

Lee and Obendorf [9] examined the WVTR of 15knitted and woven fabrics using the upright cup method (ASTM E-96-80) [23]. They reported that the main fabric structural parameters affecting the WVTR were the cover factor, fabric thickness, and void size of the fabrics, including the water absorption rate of the fibers and their characteristics. In addition, the determination coefficient (R2) between the WVTR and these parameters through regression analysis was 0.97. However, this study had a limitation for using non-coated and non-laminated specimens, which is very important in breathability, and fewer specimens, which were insufficient for statistical analysis. In the present study, multiple regression analysis for the effect of fabric structural parameters on the breathability was performed with specimens divided according to the materials, surface modification method, and three types of measuring methods. Table 4 lists the curvilinear regression analysis of the breathability of PET and laminated fabric specimens in terms of the fabric structural parameters, which shows the results of PET and laminated fabrics above 0.6 for the determination coefficient (R2) with 5% significance level.
As shown in Table 4, in PET fabrics, the fabric thickness and weight were the influential factors affecting the breathability measured using the upright cup method (ASTM E96-80) [23], with determination coefficients of 0.802 and 0.844, respectively. The determination coefficients were 0.839 and 0.847 for the ISO 11092 [25] method using evaporative wet heat transfer method, which showed slightly higher R2 than ASTM method. The fabric density was the dominant factor with a determination coefficient of 0.829 in the inverted cup method (JIS L 1099B-1) [24]. It is very interesting that the influential factor affecting breathability differs according to the measuring method, i.e., thickness and weight in ASTM and ISO methods but density in JIS method, as shown in Table 4. In addition, these results were in accordance with those of Figure 3, Figure 5, and Figure 7. Figure 3 and Figure 5 indicate the results measured by ASTM and JIS methods, respectively, showing a convex shape (i.e., negative (−) in front of x2 in curvilinear regression equations in ASTM and JIS methods of PET fabric, in Table 4), whereas, Figure 7 is for measurements using the ISO method, showing a concave shape (i.e., positive (+) in front of x2 in equations in the ISO method in Table 4). On the other hand, the determination coefficient obtained by regression analysis according to the measuring method in the laminated fabrics was the highest (0.872) in the ISO method using the evaporative wet heat transfer method, which indicates the exquisite measuring characteristics of this method compared to ASTM (WVTR) and JIS (WVP). In this curvilinear regression analysis, the breathability (y) of fabrics was obtained by a quadratic term of predictor variables (x) such as thickness, weight, and density of fabric. Meanwhile, multiple linear regression analysis was performed to obtain a polynomial model with linear term of fabric density, thickness, and weight. Table 5 lists the results of multiple linear regression analysis using backward regression method between the breathability and fabric structural parameters. As shown in Table 5, the determination coefficients (R2) of multiple regression analysis were much higher than those of the curvilinear regression analysis.
In PET fabric specimens, the breathability (WVTR) using the upright cup method (ASTM) was strongly dependent on the fabric weight, fabric weight per thickness, and fabric density, with a determination coefficient of 0.887. Comparing these results with the previous result [9], the determination coefficient (0.887) of multiple linear regression analysis in this study was similar to that (0.87) of the adjusted R2 of model 1 of the previous findings [9]. In contrast, the determination coefficient was 0.831 for the ISO 11092 [25] method (Ref), which was similar to that of curvilinear regression analysis shown in Table 4. In particular, the determination coefficient between breathability (WVTR) measured using the upright cup method (ASTM E96-80) [23] and fabric structural parameters was 0.947, followed in order by 0.943 and 0.878 for the ISO 11092 (Ref) [25] method and JIS L 1099B-1 method (WVP) [24], respectively. The most influential fabric structural factors affecting the breathability were the fabric density, weight per thickness, and weight followed by the fabric thickness. These results were slightly different from the previous findings [9], in which they revealed that fabric thickness was the first predictor of moisture vapor transmission through woven textiles, followed by cover factor and mean flow pore diameter. This may be due to the difference of textile materials, i.e., coated (laminated) PET (nylon) fabrics in this study and regular woven fabrics with staple yarns in the prior study [9].

4. Conclusions

The water vapor permeability of the coated and laminated breathable fabrics is governed by various factors in terms of fabric structural parameters and surface modification methods such as coating and laminating, furthermore it differs according to the measuring method. This study examined the breathability (Ref) of the coated and laminated breathable fabrics measured using the evaporative wet heat transfer method, which was compared with WVTR and WVP measured by ASTM and JIS methods through correlation and regression analysis. The changes of moisture vapor resistance (Ref) according to the fabric weight/thickness was much greater than that of WVTR and WVP, which indicated that Ref measured using evaporative wet heat transfer method was much more precise than WVTR and WVP measured using conventional methods. The measured breathability of the coated and laminated woven fabrics differed according to the measuring method, resulting in different correlation coefficients between the measuring methods according to the fabric materials and surface modification method. The correlation coefficient between Ref (ISO) and WVTR (ASTM) in the laminated and coated PET fabric specimens was the highest, i.e., −0.833 and −0.715 in coated fabric specimens. Thus, selecting an appropriate measuring method according to the fabric materials and surface modification method is very important.
The influential fabric structural parameters affecting breathability of the coated and laminated PET fabrics measured using the evaporative wet heat transfer method were fabric weight (R2 = 0.847) and fabric thickness (R2 = 0.872) in the laminated fabrics by curvilinear regression analysis, which showed much higher R2 compared to other measuring method. This indicates that the ISO 11092 [25]. method (Ref) measured using the evaporative wet heat transfer method was much more precise than WVTR and WVP measured using ASTM and JIS L 1099B-1 [24]. Furthermore, curvilinear regression equations obtained by a quadratic term of predictor variables were in accordance with the concave and convex graphs plotted with the breathability against fabric structural parameters of the 73 coated and laminated fabrics. Meanwhile, the most influential fabric structural parameters affecting the breathability of laminated fabrics measured using the evaporative wet heat transfer method were the fabric density, weight/thickness, and weight followed by the fabric thickness (R2 = 0.943) in multiple linear regression analysis, which was much higher (0.943) than that (0.872) of the curvilinear regression analysis.
This regression model would be valid for waterproof breathable fabrics with characteristics within the range of the fabrics in our specimens, i.e., for laminated fabrics woven of nylon and PET and cotton blended yarns. While based on the statistics of a specimen population, these findings are of practical use for engineering laminated fabrics with high breathability. For the prospective application of this study, it is proposed that, of the various method for measuring breathability, the moisture vapor resistance (Ref) measured using the evaporative wet heat transfer technology is strongly recommended in the coated and laminated breathable fabrics, in research and development as well as in marketing. More detailed experiments in process with various materials and surface modification methods are needed for obtaining superior coated and laminated breathable fabrics for high-performance clothing.

Funding

This research is supported by Ministry of Culture, Sports and Tourism and Korea Creative Content Agency (Project Number: R 2019020030).

Institutional Review Board Statement

Not applicable.

Informed Consent Statement

Not applicable.

Data Availability Statement

The data presented in this study are available on request from the corresponding author.

Conflicts of Interest

The author declares no conflict of interest.

References

  1. Zhou, L.; Feng, X.; Du, Y.; Li, Y. Characterization of liquid moisture transport performance of wool knitted fabrics. Text. Res. J. 2007, 77, 951–956. [Google Scholar] [CrossRef]
  2. Das, B.; Das, A.; Kothari, V.K.; Fangueiro, R.; Araújo, M.D. Studies on moisture transmission properties of PV-blended fabrics. J. Text. Inst. 2009, 100, 588–597. [Google Scholar] [CrossRef]
  3. Rego, J.M.; Verdu, P.; Nieto, J.; Blanes, M. Comfort analysis of woven cotton/polyester fabrics modified with a new elastic fiber, part 2: Detailed study of mechanical, thermo-physiological and skin sensorial properties. Text. Res. J. 2010, 80, 206–215. [Google Scholar] [CrossRef]
  4. Du, Y.; Li, J. Dynamic moisture absorption behavior of polyester-cotton fabric and mathematical model. Text. Res. J. 2010, 80, 1793–1802. [Google Scholar] [CrossRef]
  5. Gorjanc, D.Š.; Dimitrovski, K.; Bizjak, M. Thermal and water vapor resistance of the elastic and conventional cotton fabrics. Text. Res. J. 2012, 82, 1498–1506. [Google Scholar] [CrossRef]
  6. Yoo, H.S.; Hu, Y.S.; Kim, E.A. Effects of heat and moisture transport in fabrics and garments determined with a vertical plate sweating skin model. Text. Res. J. 2000, 70, 542–549. [Google Scholar] [CrossRef]
  7. Yoo, S.J.; Kim, E.A. Effects of multilayer clothing system array on water vapor transfer and condensation in cold weather clothing ensemble. Text. Res. J. 2008, 78, 189–197. [Google Scholar] [CrossRef]
  8. Yoo, S.J.; Kim, E.A. Wear trial assessment of layer structure effects on vapor permeability and condensation in a cold weather clothing ensemble. Text. Res. J. 2012, 82, 1079–1091. [Google Scholar] [CrossRef]
  9. Lee, S.S.; Obendorf, S.K. Statistical modeling of water vapor transport through woven fabrics. Text. Res. J. 2012, 82, 211–219. [Google Scholar] [CrossRef]
  10. Kim, J.O.; Spivak, S.M. Dynamic moisture vapor transfer through textiles—Part II: Further techniques for microclimate moisture and temperature measurement. Text. Res. J. 1994, 64, 112–121. [Google Scholar] [CrossRef]
  11. Cubric, I.S.; Skenderi, Z.; Havenith, G. Impact of raw material, yarn and fabric parameters, and finishing on water vapor resistance. Text. Res. J. 2013, 83, 1215–1228. [Google Scholar] [CrossRef] [Green Version]
  12. Salz, P. Testing the Quality of Breathable Textiles, Performance of Protective Clothing: Second Symposium, ASTM Special Technical Publication 989; Mandorf, F.Z., Sagar, R., Bielson, A.P., Eds.; American Society for Testing and Materials: Philadelphia, PA, USA, 1988; p. 295. [Google Scholar]
  13. Lomax, G.R. Hydrophilic polyurethane coatings. J. Coat. Fabr. 1990, 20, 88–107. [Google Scholar] [CrossRef]
  14. Gibson, P.W. Factors influencing steady-state heat and water vapor transfer measurement for clothing materials. Text. Res. J. 1993, 63, 749–764. [Google Scholar] [CrossRef]
  15. Gibson, P.W.; Kendrick, C.E.; Rivin, D.; Charmchi, M.; Sicuranza, L. An automated water vapour diffusion test method for fabrics, laminates, and films. J. Coat. Fabr. 1995, 24, 322–345. [Google Scholar] [CrossRef]
  16. Gibson, P.W.; Kendrick, C.E.; Rivin, D.; Charmchi, M. An automated dynamic water vapour permeation test method. Perform. Prot. Cloth. 1997, 6, 93–107. [Google Scholar] [CrossRef]
  17. Dolhan, P.A. A comparison of apparatus used to measure water vapour resistance. J. Coat. Fabr. 1987, 17, 96–109. [Google Scholar] [CrossRef]
  18. Congalton, D. Heat and moisture transport through textiles and clothing ensembles utilizing the Hohenstein skin model. J. Coat. Fabr. 1999, 28, 183–196. [Google Scholar]
  19. Grettlon, J.C.; Brook, D.B.; Dyson, H.M.; Harlock, S.C. A correlation between test methods used to measure moisture vapor transmission through fabrics. J. Coat. Fabr. 1996, 25, 301–311. [Google Scholar] [CrossRef]
  20. McCullough, E.A.; Kwon, M.; Shim, H. A comparison of standard methods for measuring water vapour permeability of fabrics. Meas. Sci. Technol. 2003, 14, 1402–1408. [Google Scholar] [CrossRef]
  21. Huang, J. Review of test methods for measuring water vapor transfer properties of fabrics. Cell. Polym. 2007, 26, 167–191. [Google Scholar] [CrossRef]
  22. Huang, J.; Qian, X. Comparison of test methods for measuring water vapor permeability of fabrics. Text. Res. J. 2008, 78, 342–352. [Google Scholar] [CrossRef]
  23. ASTM E96-80. Standard Test Methods for Water Vapor Transmission of Materials; ASTM International: West Conshohocken, PA, USA, 2016. [Google Scholar] [CrossRef]
  24. JIS L 1099; Testing Methods for Water Vapor Permeability of Textiles: JIS L 1099B-1; Upright Cup Method CH3COOH Test. 2012. Available online: http://www,jisc.go.jp (accessed on 6 May 2021).
  25. ISO 11092. Physiological Effects—Measurement of Thermal and Water-Vapour Resistance under Steady-State Conditions (Sweating Guarded-Hot Plate Test); International Organization for Standardization: Geneva, Switzerland, 2014. [Google Scholar]
  26. BS 7209. Specification for Water Vapour Permeable Apparel Fabrics; British Standards Institution (BSI): London, UK, 2012. [Google Scholar]
  27. Jakšič, D. Analytical method for determinating resistance to water vapor flow through flat fabrics. Tekstilec 1988, 31, 169–178. [Google Scholar]
  28. Hes, L. Permetest Instrument; Sensora Instruments & Consulting: Liberec, Czech Republic, 2005. [Google Scholar]
Figure 1. Measurement of the water vapor transmission rate. (a) Upright cup method, (b) inverted cup method, (c) sweating guarded hot plate method.
Coatings 11 01157 g001
Figure 2. WVTR of the fabric specimens according to the constituent fiber materials and surface modification methods. (a) WVTR vs. fiber materials, (b) WVTR vs. surface modification method.
Coatings 11 01157 g002
Figure 3. WVTR of the fabric specimens according to the fabric structural parameters. (a) WVTR vs. thickness and density, (b) WVTR vs. weight and density.
Coatings 11 01157 g003
Figure 4. Water vapor permeability according to the materials and surface modification method. (a) WVP vs. materials, (b) WVP vs. surface modification method.
Coatings 11 01157 g004
Figure 5. Water vapor permeability according to the fabric structural parameters. (a) WVP vs. fabric density and thickness, (b) WVP vs. fabric density and weight.
Coatings 11 01157 g005
Figure 6. Moisture vapor resistance according to the materials and surface modification method. (a) Ref vs., materials and fabric structural parameters, (b) Ref vs. surface modification method and fabric structural parameters.
Coatings 11 01157 g006aCoatings 11 01157 g006b
Figure 7. Moisture vapor resistance according to the fabric structural parameters. (a) Ref vs. density and thickness, (b) Ref vs. weight and density.
Coatings 11 01157 g007
Table 1. Specimens according to materials and surface modification method.
Specimen GroupMaterialsNo. of
Specimens
Specimen GroupSurface
Modification
Method
No. of
Specimens
1Nylon fabric241Laminated39
2Nylon/cotton fabric62Coated14
3PET fabric133Dotlaminated11
4Nylon dense fabric84Hot-meltlaminated6
5PET/cotton fabric225Teflon finished3
Total 73 73
Table 2. Structural parameters and finishing method of the fabric specimens.
Specimen
No.
Fiber
Material
Surface Modification MethodFabric Structural ParametersSpecimen
No.
Fiber
Material
Surface Modification MethodFabric Structural Parameters
Thickness
(mm)
Weight
(g/cm2)
Warp Density
(ends/inch)
Weft Density
(picks/inch)
Thickness
(mm)
Weight
(g/cm2)
Warp Density
(ends/inch)
Weft Density
(picks/inch)
1N/DL0.12535.5229015038N/C 0.75921.649267
2N0.43924.828813039P/C0.42722.9412884
3P0.27611.751258040NC0.39115.6716056
4P0.31714.931208041N0.27614.1812580
5P0.30516.521208042P0.54420.4415073
6P0.3116.921208043N0.36615.7412572
7P0.32716.471208044N0.3215.1012571
8P/C0.34416.101656545N0.34920.6812079
9P0.30515.021007546N0.39819.7611085
10P0.199.7022012047P0.33716.6015096
11P0.1789.4818013048P0.21210.9413597
12N0.41319.16805649N0.15410.51133125
13N0.30514.181308050P/C0.25113.3814085
14P/C0.31314.451308051N0.35917.2916367
15P/C0.30114.511709052P/C0.48623.8113275
16N0.29813.241557553N0.35919.4515690
17N0.1448.2621014054P/CD0.1668.28140105
18N/D0.1206.0121013055P/C0.1739.3310584
19P/C0.1376.4613614456N0.1789.3810376
20N/D0.1255.9920513657N0.1939.3410582
21N0.1395.0316521058P/C0.1819.2417092
22N/D0.1295.1522017059N0.41316.3515457
23N0.1205.9232020060P0.25412.45150110
24N/D0.1497.4020820561N0.32715.3615593
25P/C0.2518.79888862N0.41014.8515095
26N/D0.1225.3424017563P/C0.37615.3413093
27N/D0.1375.6722519064N0.40516.5710060
28P/C0.22210.3819012865N/DH0.34913.4321072
29P0.19811.5116512066P/C0.38116.3512257
30N0.29813.641518067P/C0.28113.10156125
31P/C0.37816.871128868P/C0.29114.778772
32N/C0.55217.561528869P/C0.38614.4912076
33N/C0.52523.1117014070P/C0.1839.3317389
34N/C0.46118.4415511271NT0.1868.8810878
35N/C0.30510.4628522072P/C0.1768.0412796
36P/C0.32713.7918015073P/C0.2279.1810385
37N/C0.44218.38152115
Note: L, laminated (39); C, coated (14); D, dot laminated (11); H, hot-melt laminated (6); T, Teflon finished (3).P, PET (13); N, nylon (24); P/C, PET/cotton (22); N/C, nylon/cotton (16); N/D, nylon dense (8).
Table 3. Correlation coefficient between measuring methods according to the fiber materials and surface modification methods.
Fiber
Materials
ISO/ASTMASTM/
JIS
ISO/JISSurface Modification
Method
ISO/ASTMASTM/
JIS
ISO/JIS
Total specimens−0.537 b−0.1040.021Total specimens−0.537 b−0.1040.021
PET−0.833 0.064−0.002Laminated−0.4370.0240.032
Nylon−0.616 b0.183−0.063Coated−0.715 a−0.3250.276
Etc.−0.3840.1320.112Dot−laminated−0.258−0.268−0.478
Hot melt laminated−0.710 a−0.7100.138
Note: ASTM, upright cup method; ISO, guarded hot plate method; JIS, inverted cup method. a significant at 0.01 level, b significant at 0.05 level.
Table 4. Curvilinear regression analysis using the fabric structural parameters.
Material and Surface Modifacation
Method
Measurement MethodStructural Parameter (x)Regression EquationR2p-Value
PETASTM-96Ty = −58,963.6x2 − 53,250.8x + 9562.70.802<0.05 *
Wy = −42.6x2 − 1320.4x + 11,533.30.844<0.05 *
W/Ty = −50.5x2 + 5486.7x − 146,199.90.637<0.1
ISO 11092Ty = 648.4x2 − 220.0x + 31.150.839<0.05 *
Wy = 0.202x2 − 2.63x + 18.330.847<0.05 *
JIS L 1099B-1Dy = −403x2 + 1015.8x − 55,8720.829<0.05 *
LaminatedASTM-96Wy = −69.4x2 + 1769.5x − 8727.50.640<0.1
Dy = −0.83x2 − 175.8x + 10,927.10.659<0.1
ISO 11092Ty = 1715.1x2 − 909.6x + 127.10.872<0.05 *
Dy = 0.002x2 + 4.74x − 220.40.734<0.05 *
Wy = 1.21x2 − 31.5x + 196.00.611<0.1
JIS L 1099B-1W/Ty = −37.5x2 − 2907.9x + 65,027.70.663<0.1
* Significant at 95% level.
Table 5. Multiple linear regression analysis with the fabric structural parameters.
Material and Surface Modifacation
Method
Measurement
Method
Regression EquationR2p-Value
PETASTM-96y = 1863.5 − 116.3W − 4.6W/T − 13.8D0.887<0.05 *
ISO 11092y = −13.4 + 2.5W + 0.05W/T + 0.02D0.831<0.05 *
LaminatedASTM-96y = 60,386.4 − 147,757.2T + 2855.1W − 1116.4W/T − 10.2D0.947<0.01 **
ISO 11092y = −2065.7 + 5016.8T − 91.6W + 37.6W/T + 0.77D0.943<0.01 **
JIS L 1099B-1y = 118,939 + 307,656T − 6113W + 2665W/T − 15.8D0.878<0.05 *
* Significant at 95% level, ** Significant at 99% level.
Publisher’s Note: MDPI stays neutral with regard to jurisdictional claims in published maps and institutional affiliations.

