Article

Excellent Properties of Ni-15 wt.% W Alloy Electrodeposited from a Low-Temperature Pyrophosphate System

1
College of Materials and Chemical Engineering, Hunan Institute of Engineering, Xiangtan 411104, China
2
Key Laboratory of Green-Chemistry Materials in University of Yunnan Province, Yunnan Minzu University, Kunming 650500, China
3
National and Local Joint Engineering Research Center for Green Preparation Technology of Biobased Materials, Yunnan Minzu University, Kunming 650500, China
*
Author to whom correspondence should be addressed.
The authors contributed equally to this work as first authors.
Coatings 2021, 11(10), 1262; https://doi.org/10.3390/coatings11101262
Submission received: 13 September 2021 / Revised: 5 October 2021 / Accepted: 11 October 2021 / Published: 18 October 2021
(This article belongs to the Section Surface Characterization, Deposition and Modification)

Abstract

:
Electrodeposited Ni-W alloy coatings are considered to be one of the most suitable candidate coatings to replace carcinogenic hexavalent chromium coatings. In this work, Ni-W alloys are electrodeposited from pyrophosphate baths containing different concentrations of Na2WO4 2H2O (CW) at 40 °C. Both CW and the applied current density can affect the W content in the coatings. The effect of CW becomes weaker with the increased current density. The Ni-W alloys with 15 ± 5 wt.% W (Ni-15 wt.% W) are obtained from the bath containing 40 g L−1 CW at a high current of 8 A dm−2. The microhardness, corrosion resistance and hydrogen evolution reaction (HER) are measured with a microhardness tester and an electrochemical workstation. The modified properties are studied by heat treatment from 200 to 700 °C. The highest microhardness of 895.62 HV and the better HER property is presented after heat treatment at 400 °C, while the best corrosion resistance in 3.5 wt.% NaCl solution appears at 600 °C.

1. Introduction

With the development of science and technology, the corrosion resistance and other performance requirements of materials are continuously improved [1]. In order to improve the wear resistance and corrosion resistance of materials, materials such as nickel, cobalt, titanium and tungsten-based alloys and ceramics are usually used as coating materials [2,3]. Many studies have also reported that nickel-based coatings improve the wear and corrosion resistance of the substrate [4,5], by means of physical, chemical and electrochemical deposition. Electrodeposition is one of the most important technologies for preparing metal and alloy coatings [6]. In recent years, the research of Ni-W and Ni-W-based coatings has received extensive attention [7,8,9]. The Ni-W electroplating layer is considered to be one of the candidates to replace hard chromium plating due to its smooth surface, high hardness, excellent wear resistance, good corrosion resistance and low cost. It is widely used in the protective coating of glass membranes, hydraulic parts and valves [10].
Environmentally friendly hydrogen energy is an alternative to fossil energy [11]; therefore, electrolytic hydrogen production technology has attracted the extensive interest of researchers [12]. However, a high-energy consumption resulted from the high overvoltage of the hydrogen evolution reaction (HER) limits its practical and wide application [13]. Some materials with a low HER overvoltage and low price have become a research focus [14]. For example, transition metals such as Ni, W, Co and their alloys have attracted widespread attention in the past few years due to their richness, low cost, and high electrocatalytic performance [15]. In nickel-based alloys, Ni-W can be selected for a suitable hydrogen production process due to its high potential and strong corrosion resistance [16].
In this work, Ni-W alloy coatings were prepared by electrodeposition in a low-temperature pyrophosphate bath and their corrosion resistance and HER properties were studied in detail. Heat treatment was carried out to improve their microhardness [17,18], corrosion resistance and HER properties. The organic chelating agents, such as citric acid, were usually added into baths to obtain Ni-W alloys with good wear and corrosion resistance [19]. However, the organic chelating agents inevitably decompose during electroplating, and the electro-productions are difficult to remove completely, usually resulting in bad coatings which peel and have a low hardness. Pyrophosphate, a carbon-free chelating agent, is widely used in the electroplating field, while Ni-W coatings from the bath are rarely reported [20]. Therefore, the pyrophosphate chelating agent was selected in this work.

2. Materials and Methods

2.1. Electrodeposition of Ni-W Alloys

A pyrophosphate bath was used to prepare Ni-W coating. Table 1 lists its components and process parameters. The bath was prepared with analytical reagents and deionized water. The additions used were from Hunan Nano-film New Material Technology Co., Ltd. (Changsha, China).
Ni-W alloy coatings were deposited on Q235 carbon steel disks with a diameter of 10 mm and a thickness of 2 mm in a 500 mL plating bath under a constant current density of 4, 6, 8 and 10 A dm−2 by DC power supply (APS3005DM, ATTEN/Antaixin, Hangzhou Hamat Electronics Co., Ltd., Hangzhou, China) keeping the bath temperature at 40 °C. Before electroplating, the disks were mechanically polished with SiC waterproof sandpaper (CW-800, Shanghai Xinshangsha Abrasives Co., Ltd., Shanghai, China) and electrochemically degreased in 40 g L−1 NaOH for 10 min and rinsed with deionized water, and then washed and activated in 10% HCl for 10 sec. The electrodeposition time was 135 min to ensure a coating thickness over 100 μm, which could meet the microhardness measure and heat treatment. After electrodeposition, Ni-W alloy coatings were immediately rinsed with deionized water, dried by a blow drier and placed into a self-sealing bag.
The carbon steel disks coated with Ni-W alloys were annealed at 200, 300, 400, 500, 600, and 700 °C for 2 h in a muffle furnace.

2.2. Characterization

Chemical composition of all as-prepared samples was analyzed using energy-dispersive X-ray spectroscopy (EDX, EDX-8000, Shimadzu, Kyoto, Japan). Microscopic morphology was analyzed by scanning electron microscope (SEM, Nova 450, FEI, Hillsboro, OR, USA). Crystal structure was characterized by X-ray diffraction (XRD, D8 Advance, Bruker, Billerica, MA, USA) using Cu Kα radiation with λ= 0.15406 nm between a 2θ range from 30 to 90°, at a tube voltage of 40 kV and with a tube current of 40 mA. Their average grain size was calculated according to the Debye-Scherrer formula, d = 0.89 λ/(β cosθ) [21]. The grain size here was estimated based on the (1 1 1) diffraction peak. TG-DSC (thermogravimetric analysis-differential scanning calorimetry) tests were performed using a thermal analyzer (STA449F3, Netzsch, Selb, GER) in air from room temperature to 800 °C. The Ni-W alloy coating quality was 10 mg, which was stripped from a 304 stainless steel disk that had a low adhesion and could easily fall off.
Annealed samples at over 400 °C were polished with W (14, 7 and 3.5) metallographic sandpaper in sequence, while other samples were not polished because of the bright surface. Then, Vickers microhardness of the coating was measured using the HV-1000A microhardness tester (Laizhou Huayin Testing Instrument Co., Ltd., Laizhou, China). Take an indentation load of 100 gf and a residence time of 10 s, the average value of the five different positions was measured as the coating hardness.

2.3. Electrochemical Measurements

After a copper wire was welded on the Q235 carbon steel disks coated with Ni-W alloys, they were sealed by epoxy resin and were successively polished with SiC (CW-600, 800 and 1000) waterproof abrasive papers to expose a Ni-W alloy surface with 0.785 cm2. The saturated calomel electrode (SCE) and platinum plate were, respectively, used as reference electrode (RE) and auxiliary electrode (CE) on the electrochemical workstation to measure the electrochemical performance of the prepared electrode (working electrode, WE)., In a 3.5 wt.% NaCl solution, the Tafel curves were carried out at a scan speed of 1 mV s−1 between ±250 mV of open circuit potential (OPE) and electrochemical impedance spectroscopy (EIS) was performed with an applied AC signal amplitude of 5 mV and a scanning frequency of 0.01 Hz to 100 kHz. In a 6 wt.% NaOH solution, the behavior of HER was estimated using LSV electrochemical technology at a scan rate of 5 mV s−1. The E (vs. RHE, Reversible Hydrogen Electrode) potential was calculated according to the following formula [22].
E (vs. RHE) = E (vs. SCE) + ESCE (0.241 V) + 0.0592*pH

3. Results and Discussion

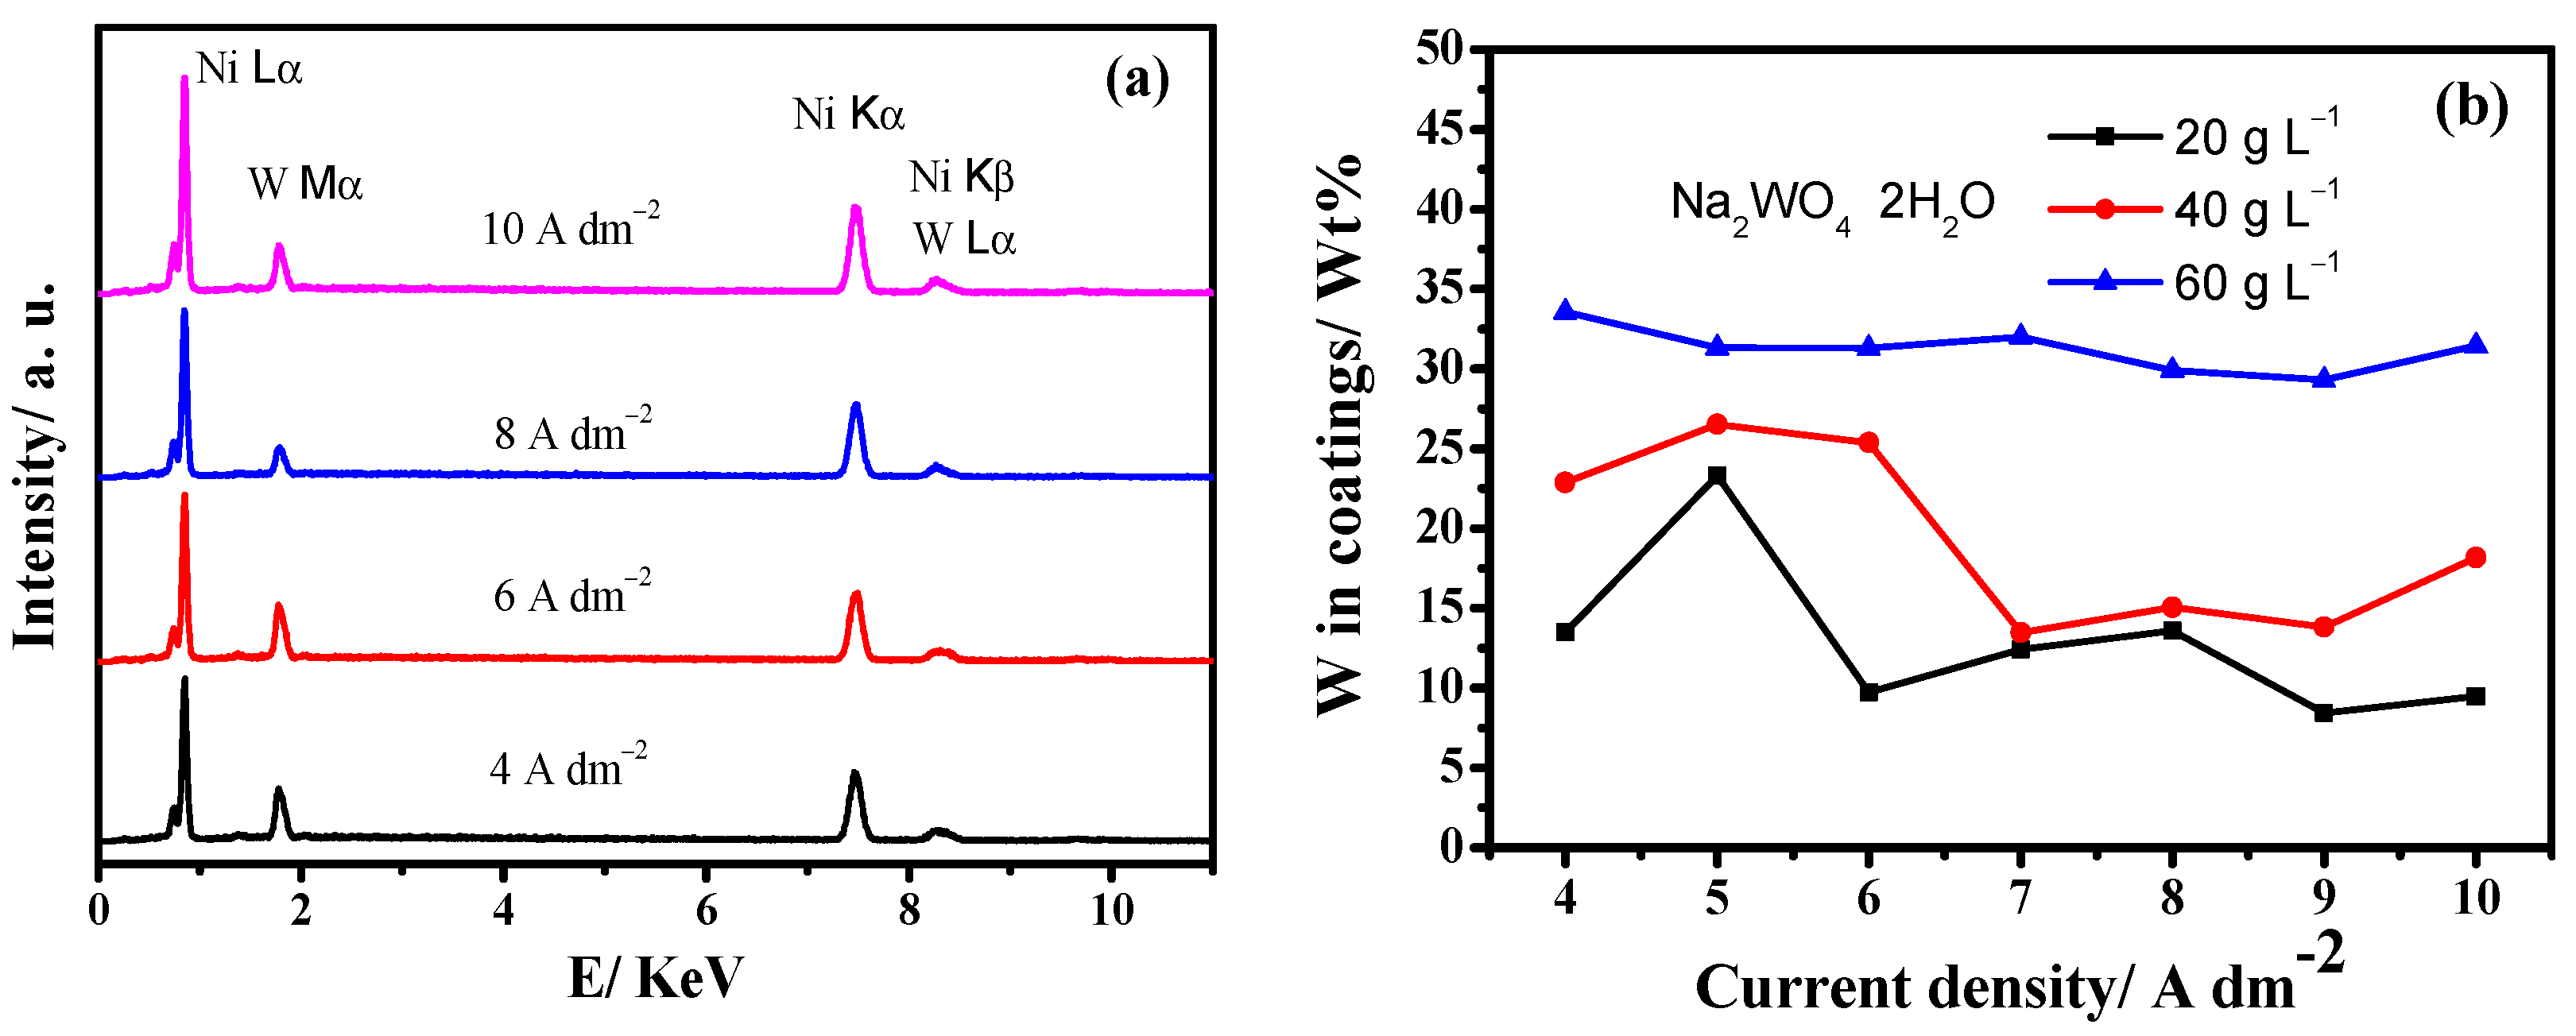
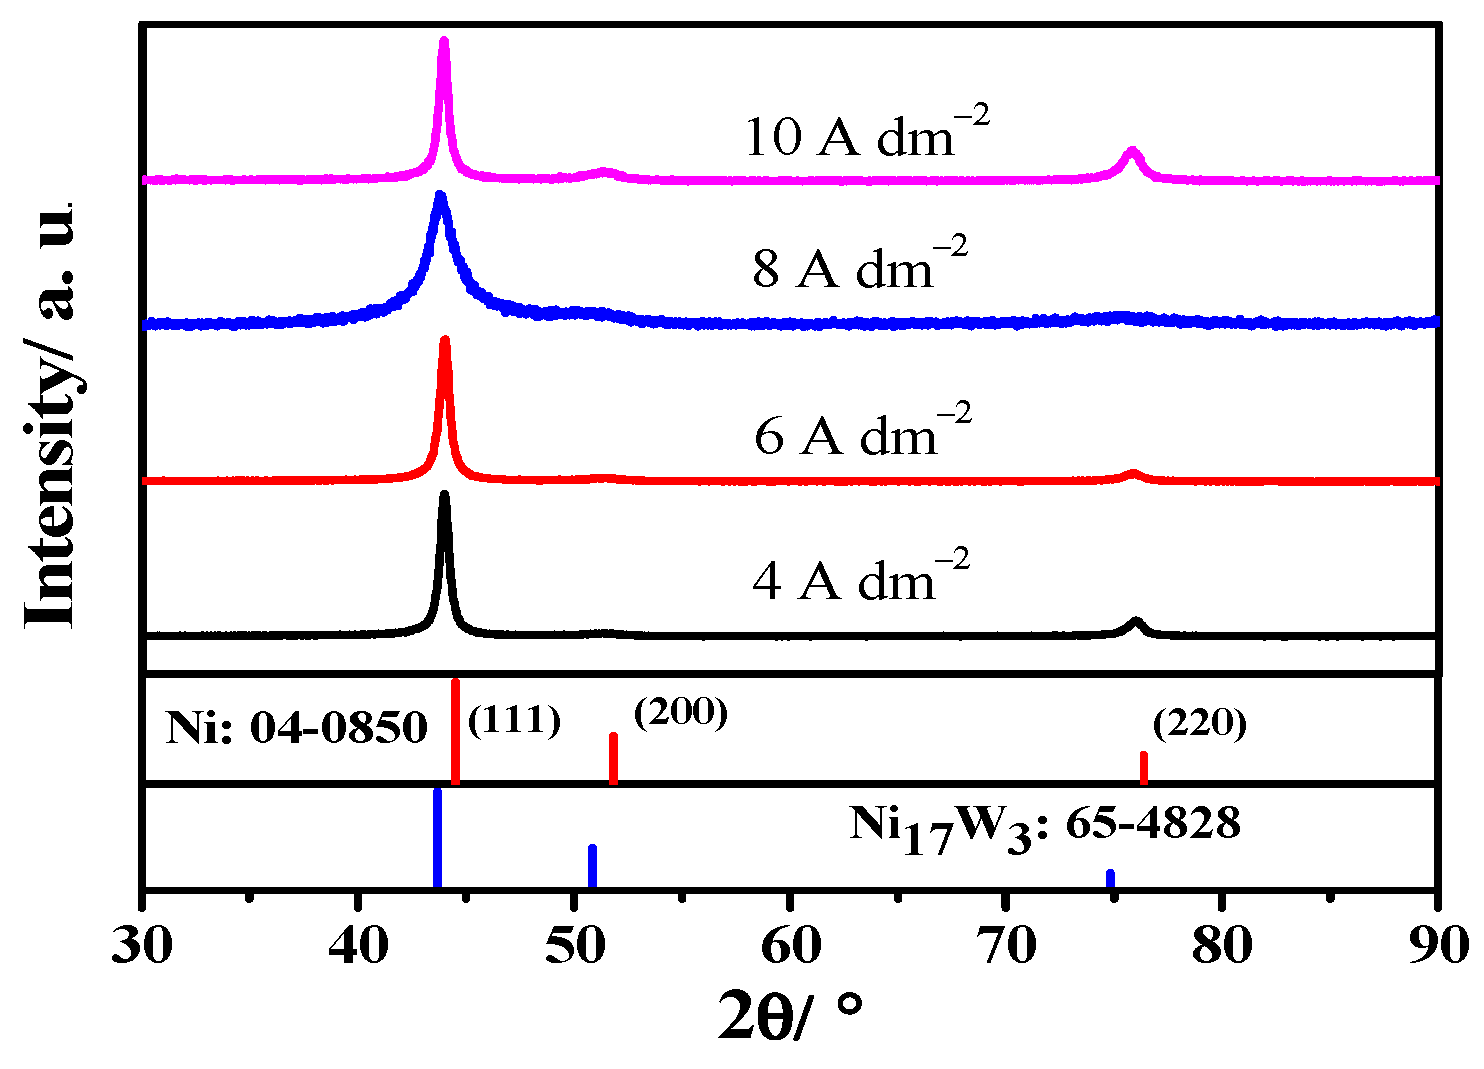
3.1. Electrodeposition of Ni-W Alloys

Figure 1a shows the EDX spectra of Ni-W alloy coatings prepared at current densities of 4, 6, 8 and 10 A dm−2 from the pyrophosphate bath containing 40 g L−1 Na2WO4 2H2O at 40 °C. From Figure 1a, the characteristic peaks of the Ni and W elements all appear at 0.85 KeV and 7.47 KeV, and 1.78 KeV, respectively, implying that the co-deposition of Ni and W has occurred.
As Figure 1b shows, in general, in 40 g L−1 Na2WO4 2H2O concentration, the W content in Ni-W alloy coatings first increase and then decrease with the increase in current density. The Ni-W alloy coatings with about 15 wt.% W can be obtained at a wide range of current density. When the concentration of Na2WO4 2H2O to 20 g L−1 decreases, the same changing trend is also presented in Figure 1b. This is the competition of the reduction of adsorptive species NiOHads and intermediate [(Ni)p(WO4)q(P2O7)m]2(p–q−2m), which affect the W content, along with current density. The W content resulting from the intermediate reduction increases and decreases because of its more positive potential and low diffusion rate, respectively. In the high Ni bath, this change trend was also observed by Suvorov et al. [20]. They considered that the electrochemical reduction of Ni ions was carried out through three subsequent reactions, while the deposition of W could be induced by means of the Ni adsorptive species [20,23]. That is, the NiOHads was further reduced by two routes of (3) and (6), and the competition between them led to the change in tungsten content:
[Ni(P2O7)2]6− + OH → P2O74− + [Ni(OH)(P2O7)]3−ads
[Ni(OH)(P2O7)]3−ads + e → NiOHads + P 2O74−
NiOHads + e → Ni0 + OH
NiOHads + WO42 − → [WO4 (NiOH)] 2 –ads
[WO4 (NiOH)]2 −ads + e → [WO4 (Ni)] 2 −ads + OH
[WO4 (Ni)]2 −ads + 4H2O + 6e → W0 + Ni0 + 8OH
However, in the bath containing 60 g L−1 Na2WO4 2H2O (the mole ratio of Ni and W in the bath is 1:4), the W content in coatings were hardly unchanged by the current density. Deposition of W may be induced by means of the mixed complex, similarly to the ternary complex of [(Ni)p(WO4)q(Cit)m]2(p–q−1.5m) in the citrate system [7]. The ternary complex is an active species, with the lower reduction potential, so Equation (7) is the main reduction process. Therefore, the W content in the coatings is almost a constant:
[(Ni)p(WO4)q(P2O7)m]2(p-q−2m) + 4sH2O + (6s + p)e→sW0 +p Ni0+ (q-s)WO42 − + 8sOH + mP2O74−
Figure 2 shows the SEM images of Ni-W alloy coatings prepared in the bath containing 40 g L−1 Na2WO4 2H2O at different current densities of 4, 6, 8 and 10 A dm−2; the SEM image of the Ni-W alloy coating prepared in 20 g L−1 and 60 g L−1 Na2WO4 2H2O bath is shown in Figure S1. It can be seen that the surface morphology of these Ni-W coatings is compact and flat without cracks. The morphology of the bright and compact Ni-W alloy coatings is mainly controlled by additives. The Ni-W alloy without additives has a honeycomb structure, as shown in Figure S2.
Figure 3 presents the XRD pattern of the as-deposited Ni-W alloy prepared in the bath containing 40 g L−1 Na2WO4 2H2O at 4, 6, 8 and 10 A dm−2. It can be seen that the main X-ray diffraction wide peak of the Ni-W coating appears at 2θ, between 40 and 47°, suggesting that it has a partly amorphous structure. The remaining two weak diffraction peaks are presented at about 2θ = 50.9 and 75.2°. These three diffraction peaks can be assigned to the FCC Ni phase (JCPDS No: 04-0850). Due to the larger atomic radius of W, the introduction of W results in the 2θ shift to a low angle, indicating a bigger lattice parameter. Compared with the Ni17W3 alloy (JCPDS No: 65-4828), the characteristic peaks are more positive because of the lower W content. The XRD patterns of 20 g L−1 and 60 g L−1 Na2WO4 2H2O baths are shown in Figure S3. It can be seen that the coating with a low tungsten concentration has a good crystallinity, and the current density will also affect the crystallinity of the coating.

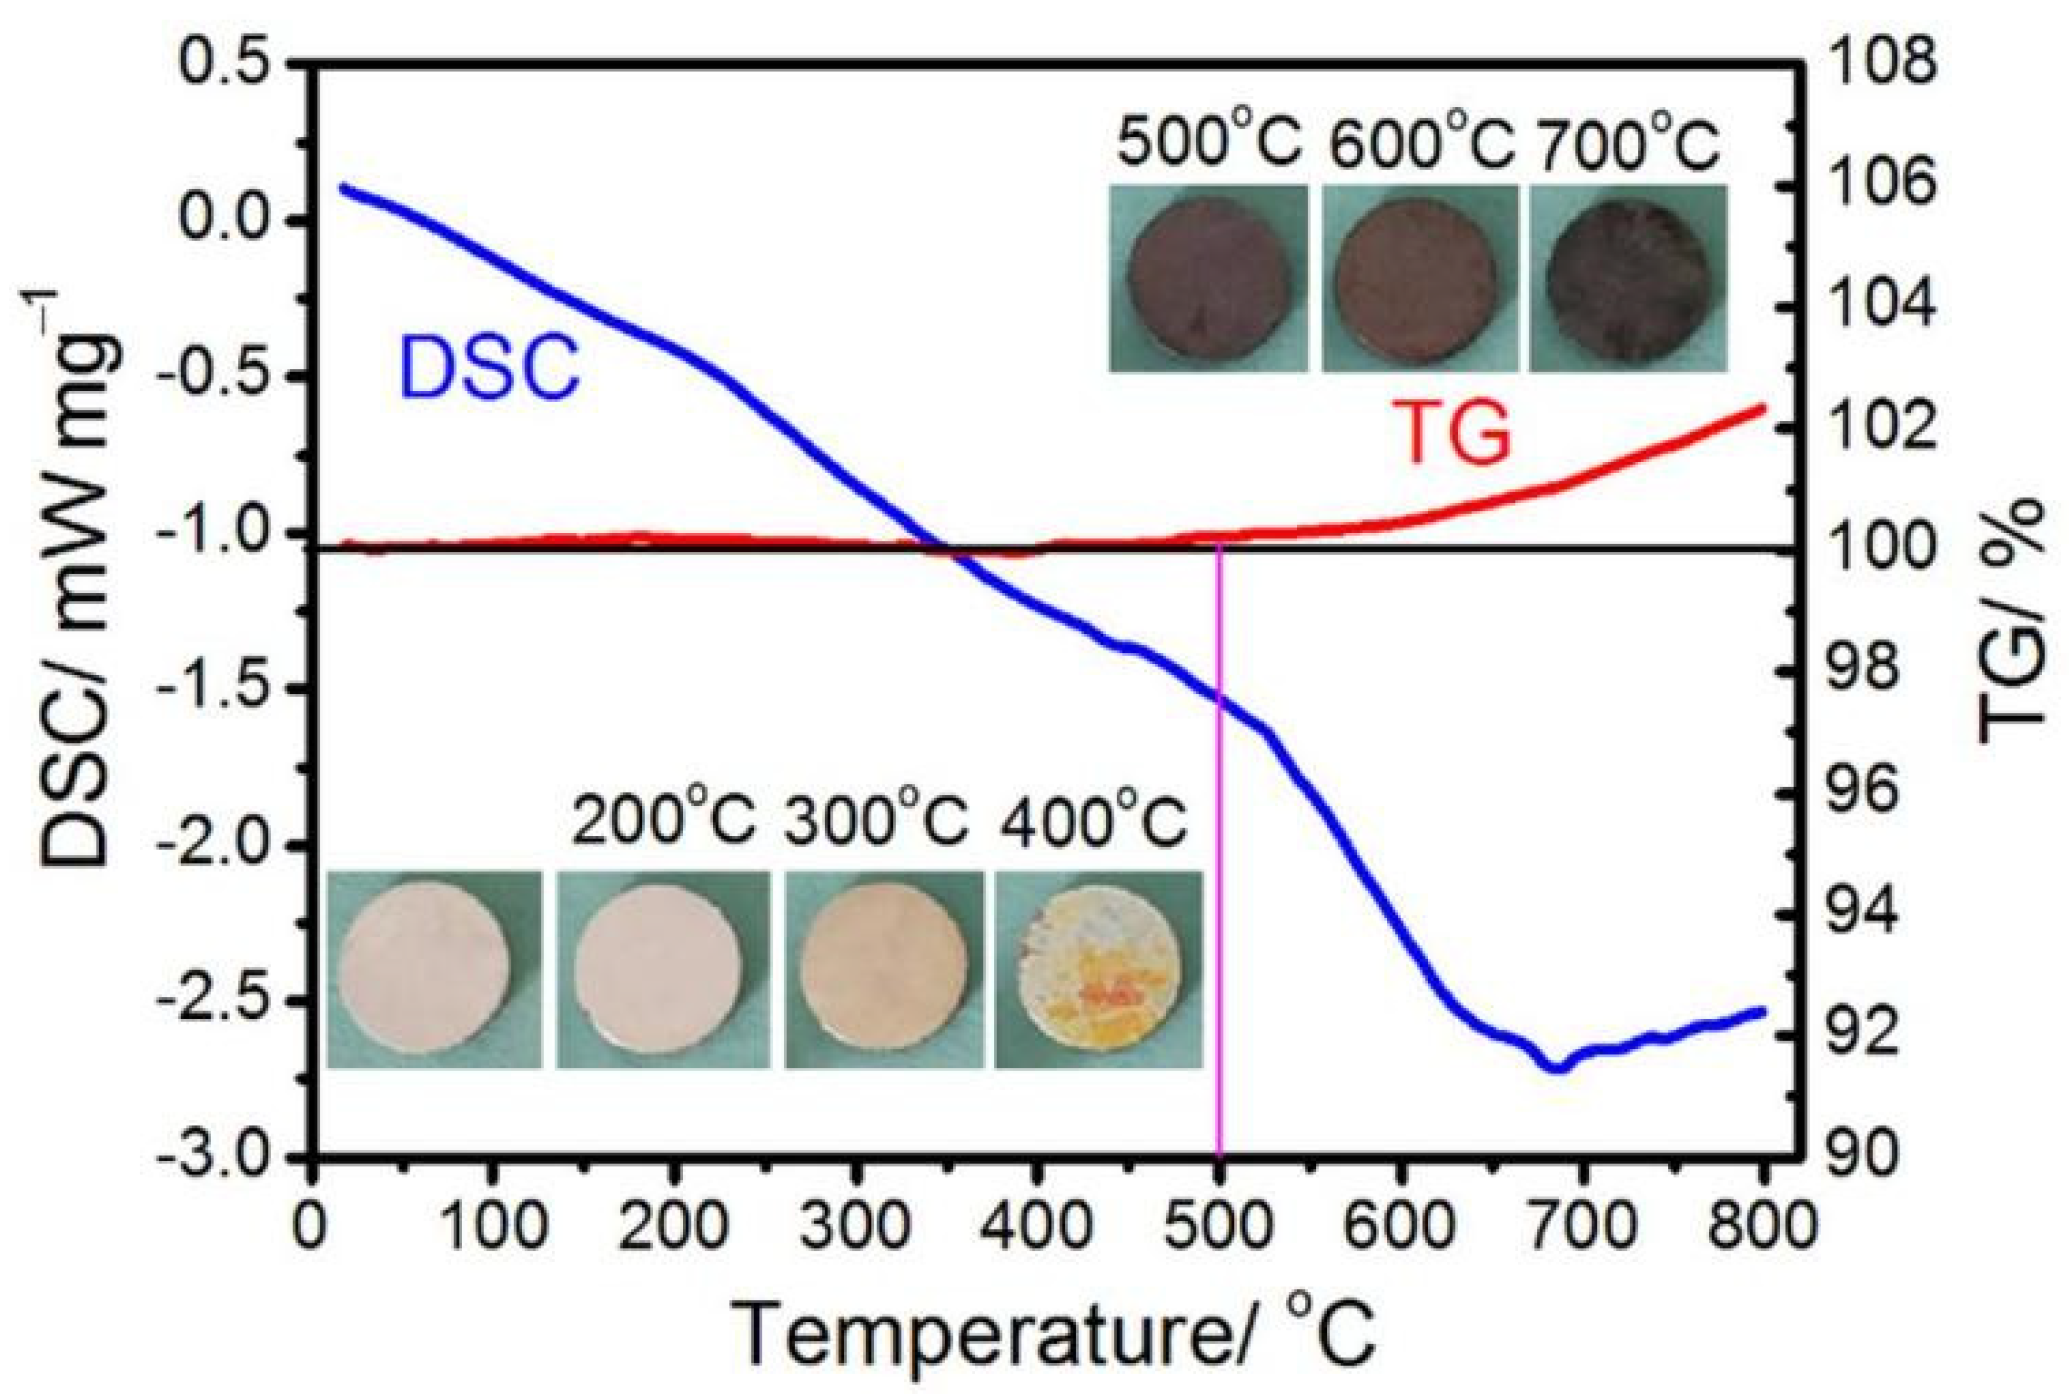
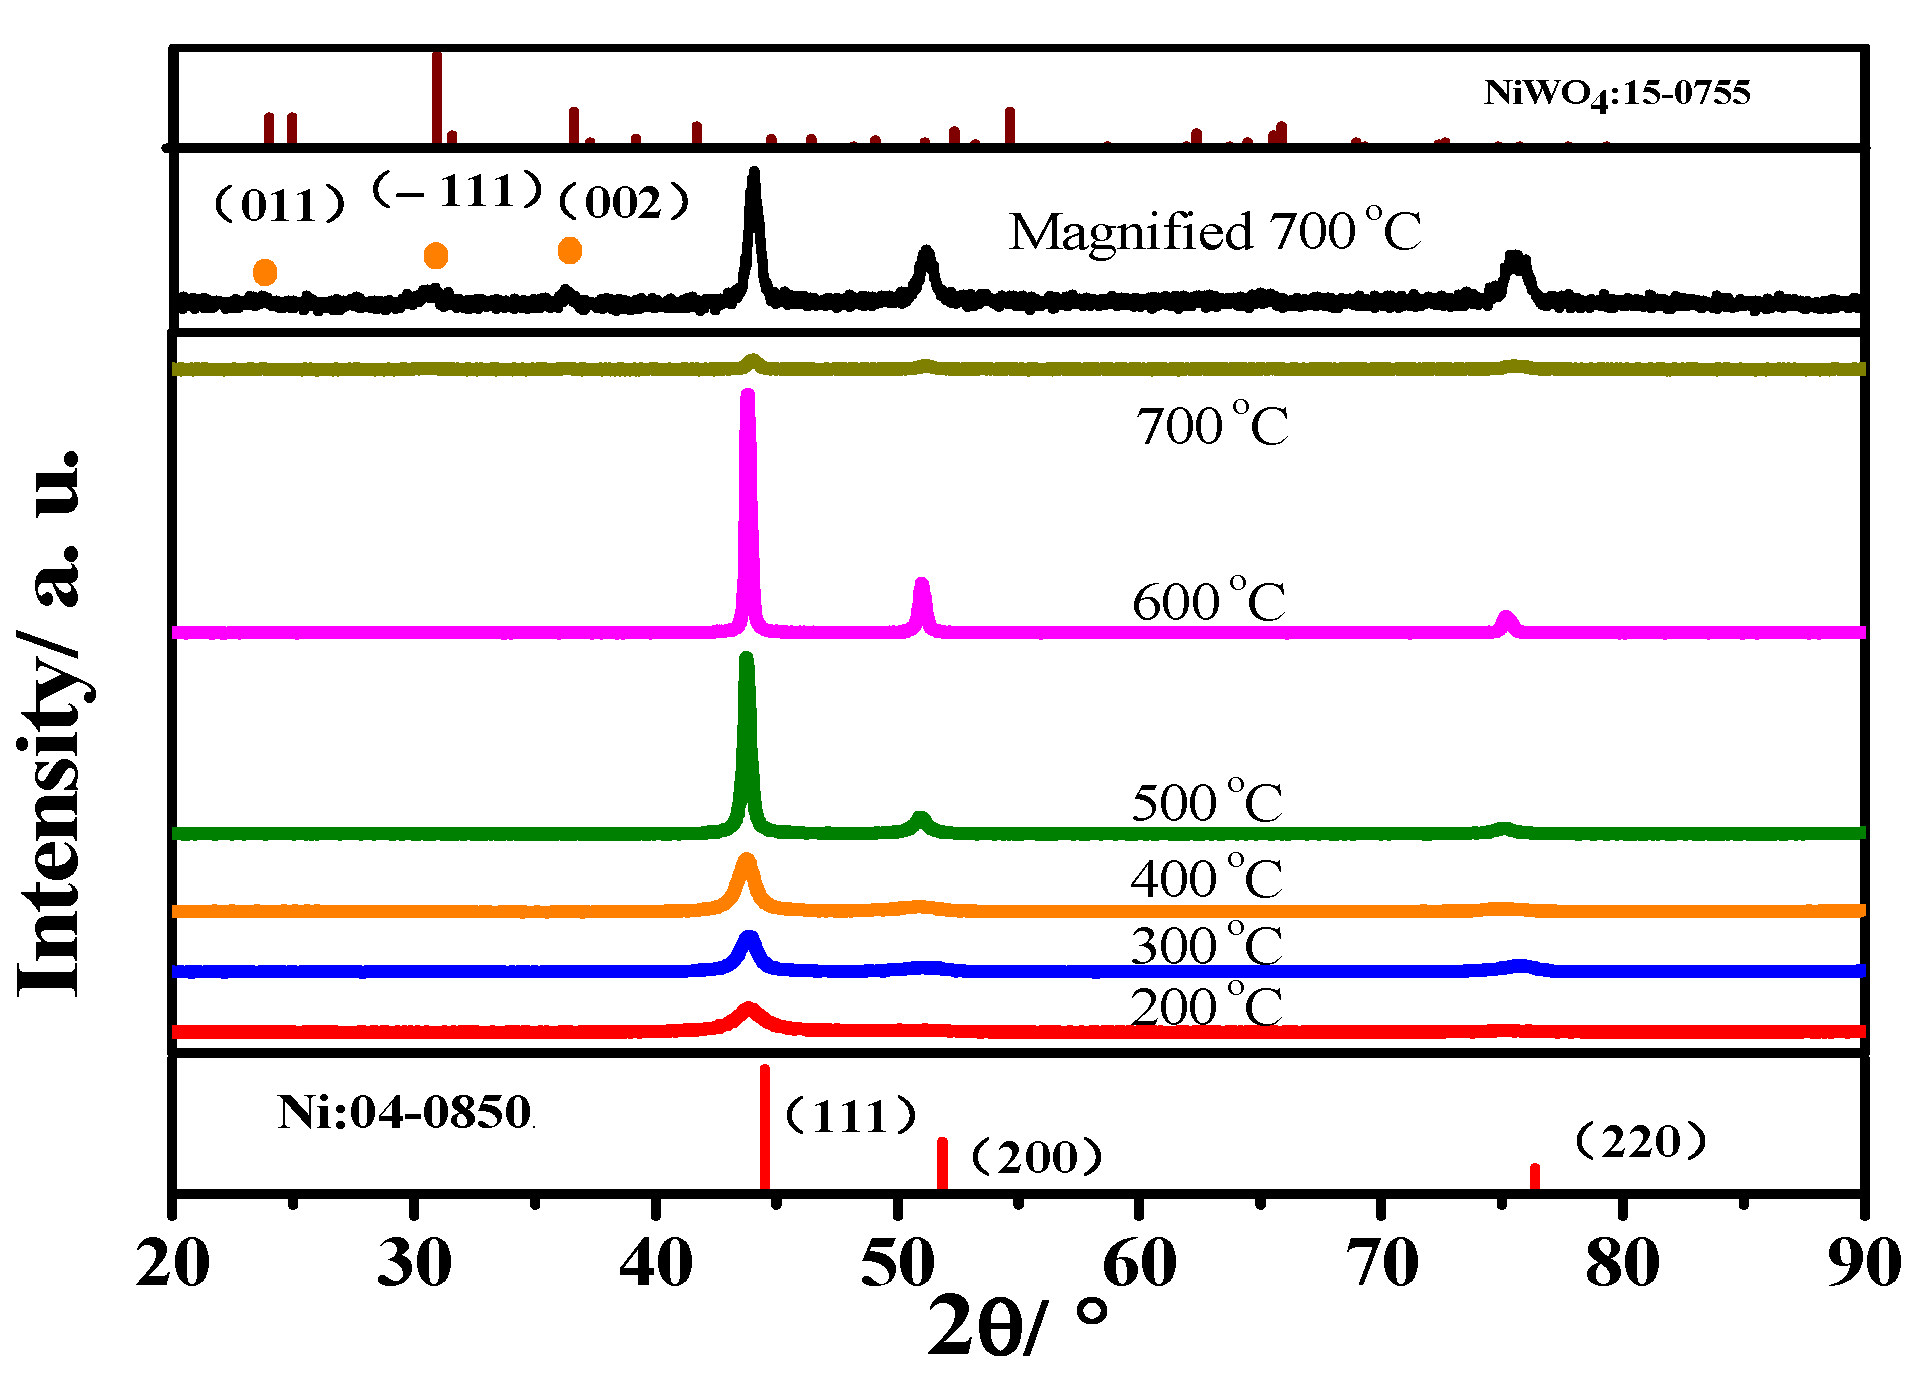
3.2. Heat Treatment of Ni-15 wt.% W Alloy

After the continuous application of the Ni-W alloy electrodeposition bath was completed, a 40 g L−1 Cw bath, which controls Cw more effectively in situ, was selected to prepare a Ni-15 wt.% W alloy coating for its subsequent characterization.
The heat treatment of the Ni-15 wt.% W alloy was carried out in the air at 200 to 700 °C. Figure 4 shows its TG(Thermogravimetric analysis) and DSC(Differential Scanning Calorimetry) curves, and the insets are the photos of the Ni-15 wt.% W alloy annealed at different temperatures for 2 h. From the TG curve, it can be seen that, at less than 500 °C, the Ni-15 wt.% W alloy did not become heavier, suggesting an antioxidant property of the alloy below 400 °C. From the insets it can be observed that the bright surface was maintained at 200 and 300 °C and became slightly orange at 400 °C, while at 500 °C its surface was oxidized to a brown color and the weight slightly increased. Although the oxidation became violent when increasing the annealed temperature, the weight increment was still less than 2.5 % until 800 °C. The exothermic behavior of the DSC curve for Ni-15 wt.% W alloy could be clearly seen, because the amorphous structure was crystallized to release heat. When over 500 °C, the heat flow increased rapidly, resulting from the surface oxidization of the alloy.
Figure 5 shows the XRD pattern evolution of the Ni-15 wt.% W alloy along with the annealed temperature. It can be difficult to see that the (1 1 1) peak has increased when the annealed temperature is below 500 °C, suggesting that a fine grain is formed during the transformation from the amorphous to the nanocrystalline structure. The (1 1 1) peak rapidly grows up at 500 °C and 600 °C, forming coarse grains. At the same time, the (2 2 0) and (2 0 0) peaks also become strong, implying that the phase is closer to the FCC Ni phase (JCPDS No: 04-0850). Although the oxidation of the Ni-15 wt.% W alloy occurs at 500 °C and 600 °C according to the TG data, the new phase peaks do not appear, indicating that the very thin oxide layer is formed. The result is consistent with that of TG. At 700 °C, the forming thick oxide layer resulting in weaker diffraction peaks, and thus new diffraction peaks appear at 30.7 and 36.3°, as the magnified XRD pattern shows in Figure 5. According to the Debye-Scheller formula, the grain size of the strongest peak of the (1 1 1) crystal plane was calculated, and the results are listed in Table 2. It can be observed that the increase in the annealing temperature from 200 °C to 400 °C corresponds to the slow growth in grain size from 10.23 nm to 12.96 nm, and the temperature rapidly increases to 26.21 nm at 500 °C and 36.03 nm at 600 °C.

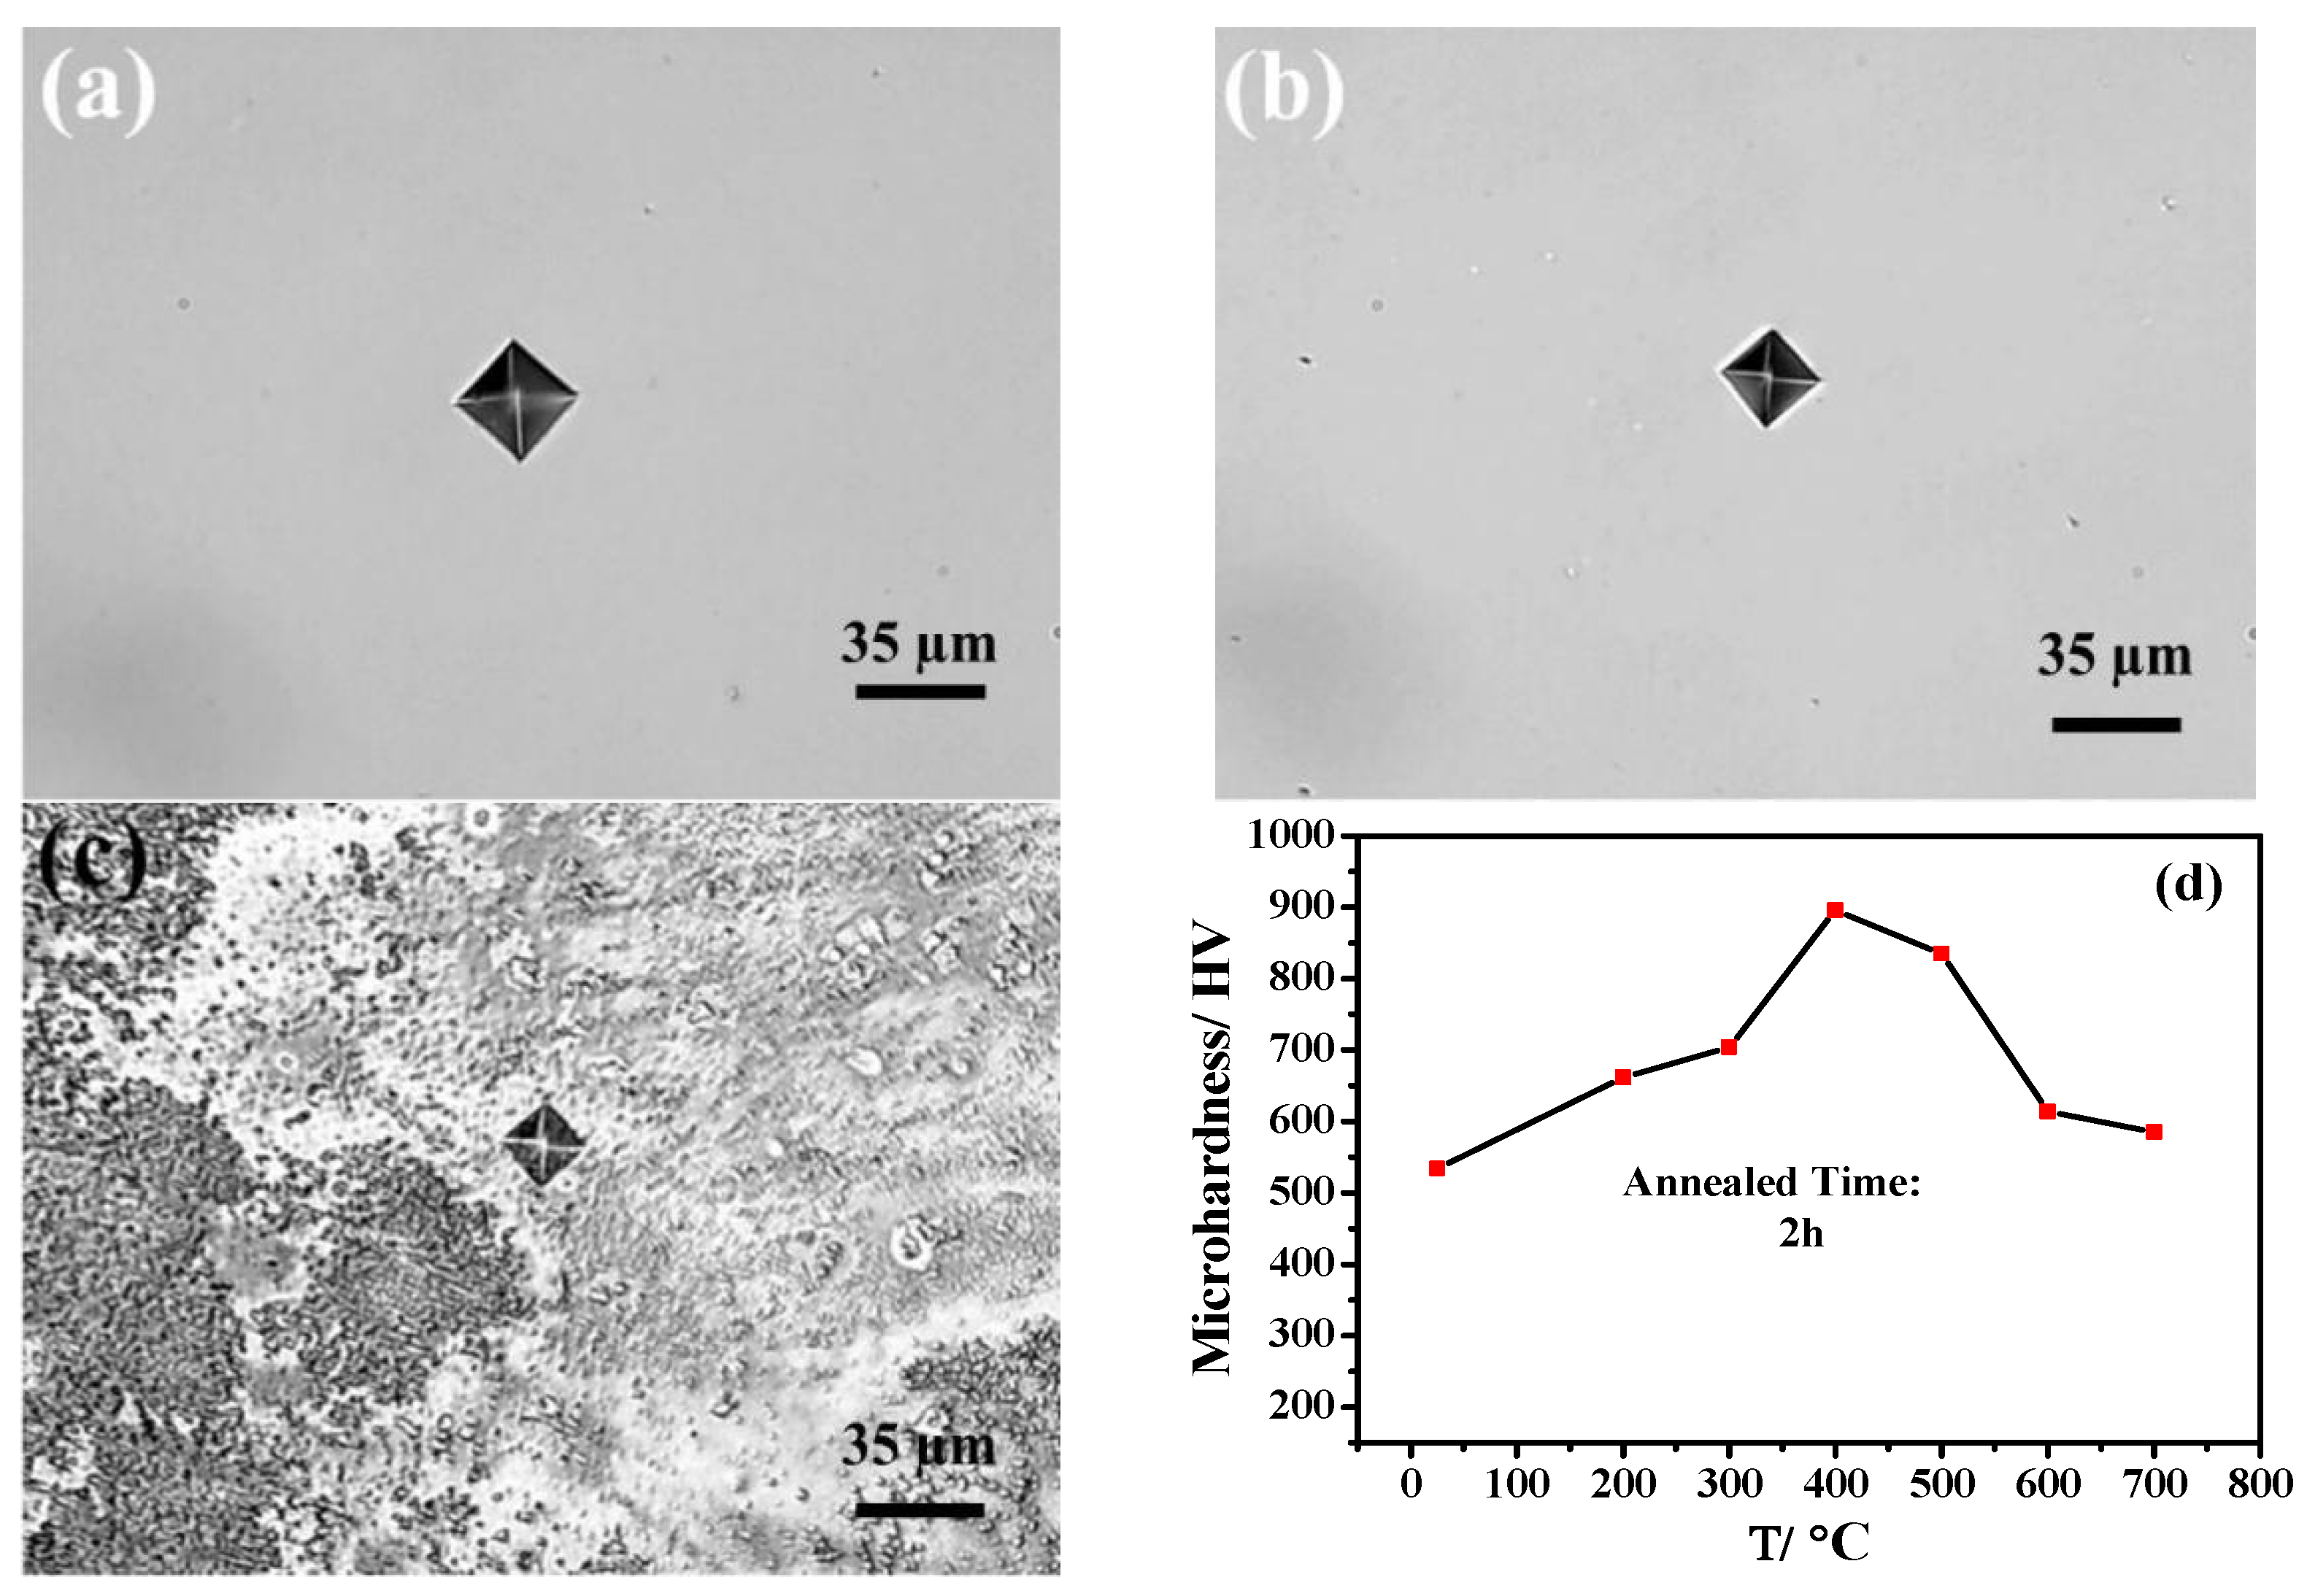
3.3. Microhardness of Ni-15 wt.% W Alloy

Below 500 °C, the Ni-15 wt.% W alloy surface is compact, flat and without cracks, so the microhardness is directly measured. The optical indentation images of the Ni-15 wt.% W alloy as-deposited and annealed at 300 and 400 °C are shown in Figure 6a–c, respectively. Although there is a slight oxidation at 400 °C, the diamond indentation shapes are clearly observed. It is found that the Ni-15 wt.% W alloy does not crack under the pressure of the diamond indenter, suggesting a good ductility. As shown in Figure 6d, the microhardness value of the sample was displayed. The microhardness of Ni-15 wt.% W as-deposited alloy coating at 534 HV was similar to the reported value of 460–740 HV [24]. When the annealed temperature was increased from 200 °C to 300 °C, the microhardness increased slowly and then rapidly reached the maximum of 895 HV at 400 °C. In contrast, the higher published value of Ni-21 at.% W was 1005 HV [25], but this was still higher than the value of 650–800 HV studied by Haj-Taieb et al. [26]. This difference is mainly caused by the difference in W content. Because the growth of the Ni-W crystal phase promotes grain refinement and is strengthened according to the DSC and XRD data, it promotes the increase in microhardness, as evidenced by the results of many reports [7,18,27]. When the annealed temperature is higher than 400 °C, the microhardness slightly decreases because of the coarse crystals.

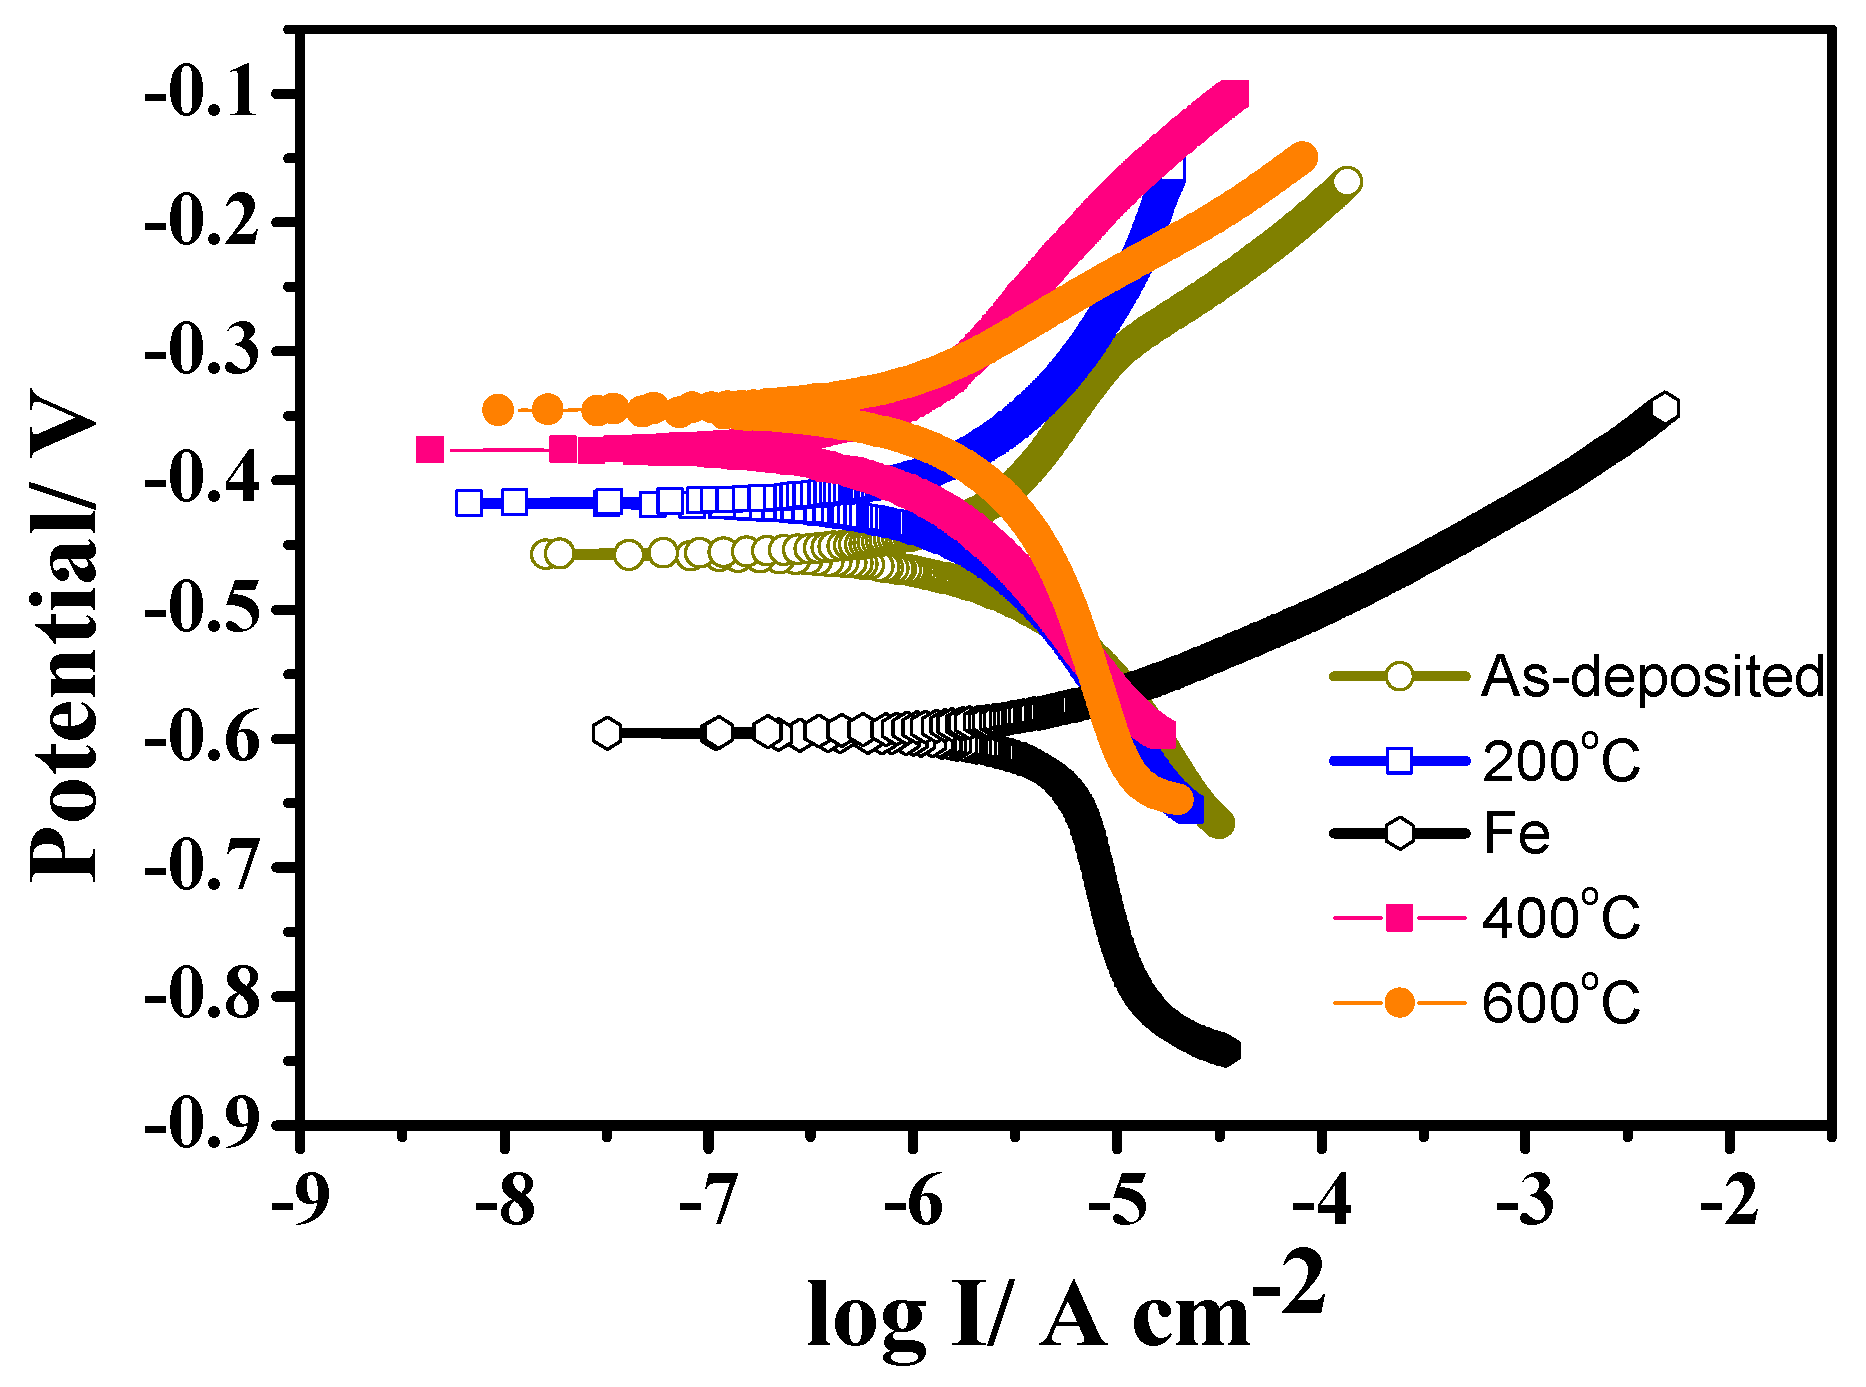
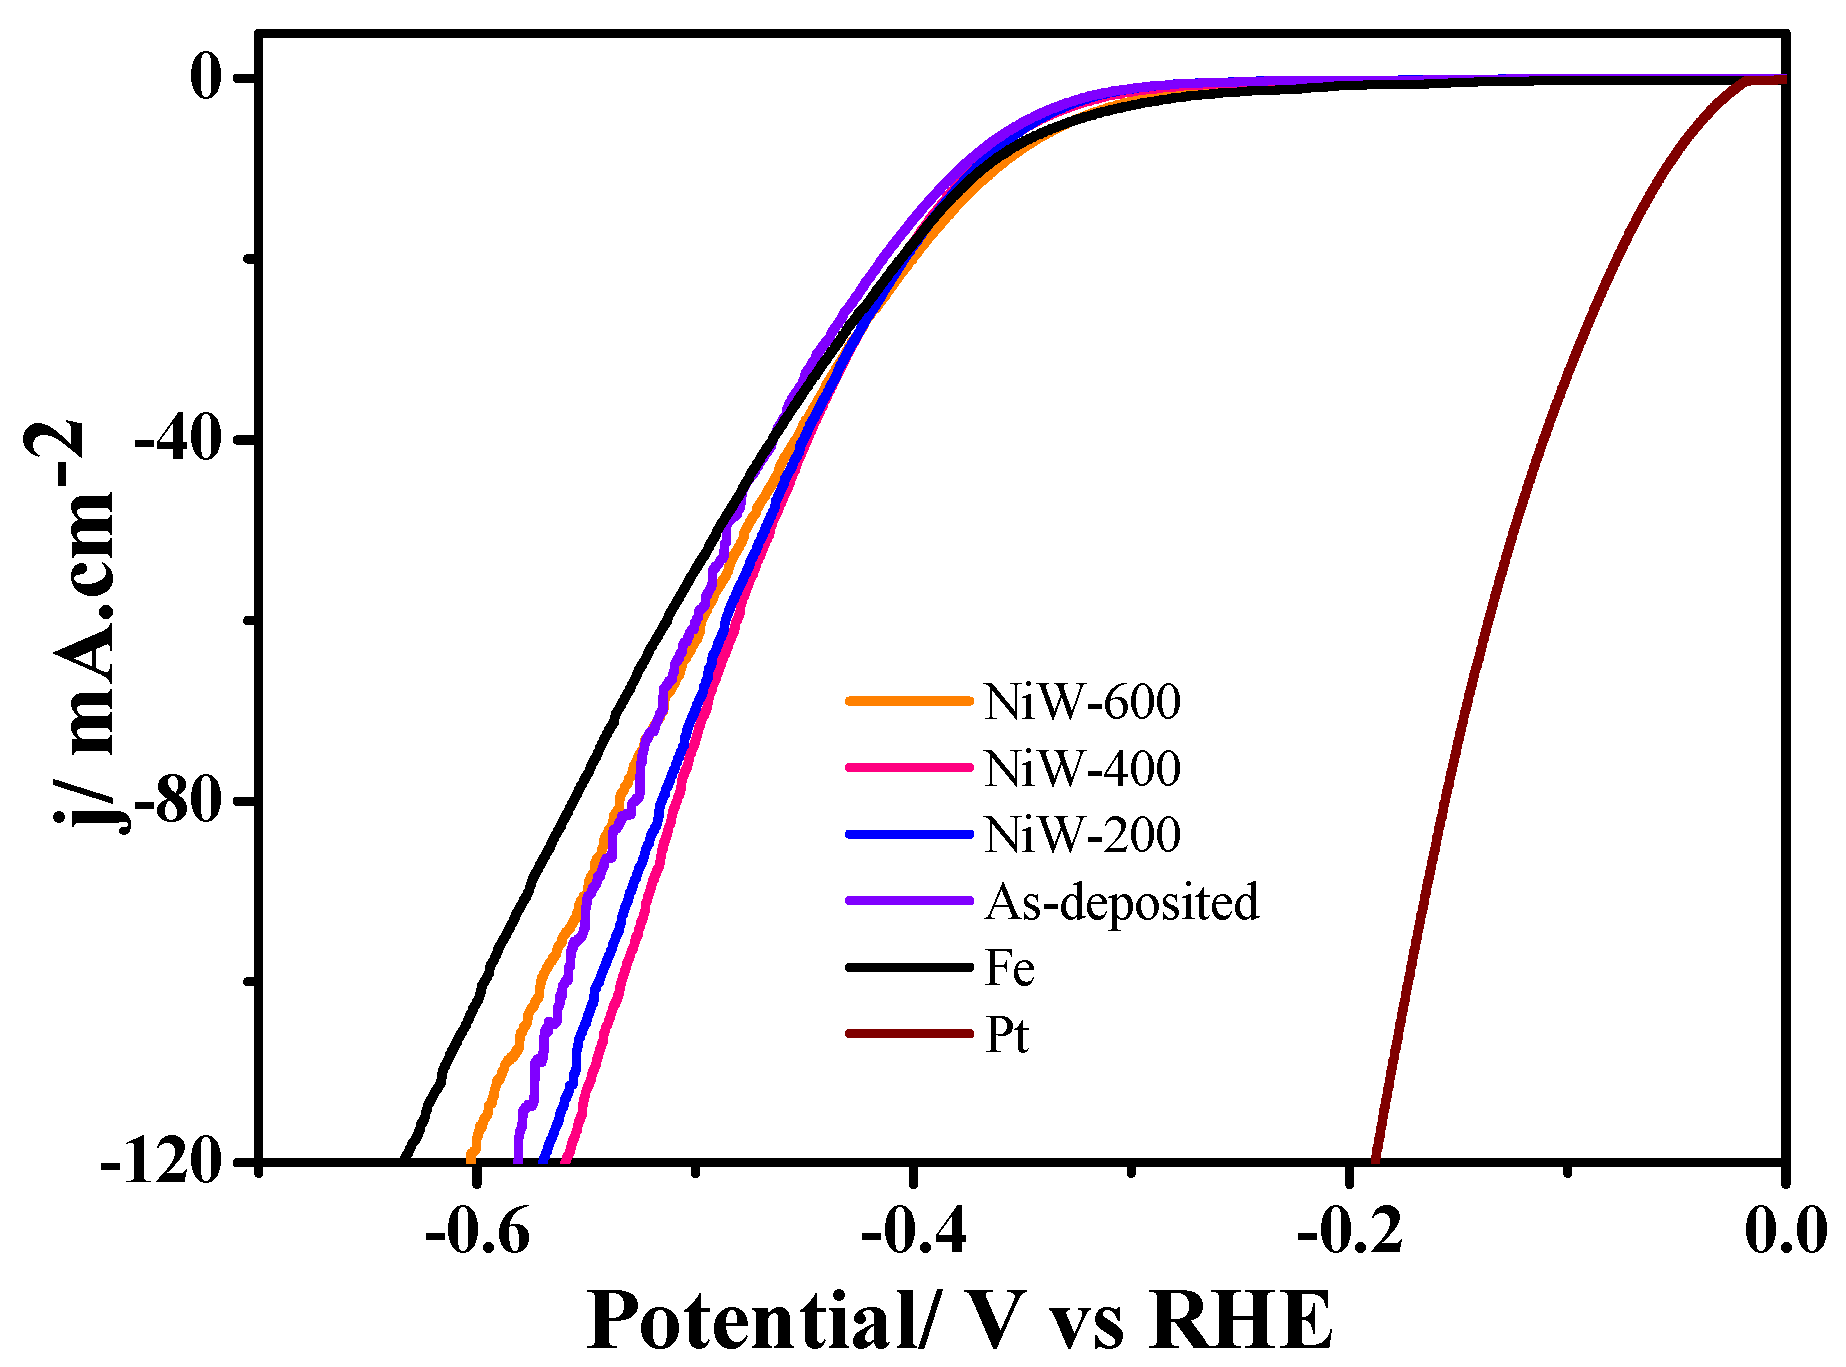
3.4. Electrochemical Properties of Ni-15 wt.% W Alloy Coating

The corrosion resistance of Ni-15 wt.% W alloy coating was estimated by Tafel curves and EIS spectra measured in the 3.5 wt.% NaCl solution, adding a base material of Q235 carbon steel disks (Fe) as a test for comparison. As Figure 7 and Figure S4 show, the corrosion potential (Ecorr) was clearly and positively shifted after the Ni-15 wt.% W alloy was electrodeposited on the Q235 carbon steel disks, implying an improved corrosion resistance [28]. Along with the increase in the annealed temperature, the positive potential increment (ΔE) also increased. At 600 °C, ΔE dramatically improved because of the surface oxidization. The corrosion potential and current (Icorr) were analyzed by the Tafel extrapolation method, and the results are shown in Table 3 and Table S1. Icorr decreased with the annealed temperature, indicating a corrosion resistance improvement. This was attributed to the passivation of the Ni-W coating [29,30].
Figure 8a and Figure S5 show the EIS spectra of the Ni-15 wt.% W alloy coatings. All Nyquist curves present a flat semicircle which indicates that the Fe, as-deposited and annealed Ni-W alloy coatings have undergone the same corrosion reaction process. The different semicircle sizes indicate that the difficulty and speed of the corrosion reaction are different [31]. Fitting through the equivalent circuit diagram of Figure 8b, the results are shown in Table 4 and Table S2: where Rct is the charge transfer resistance, Rs is the solution resistance, CPE1 is the electric double layer capacitor, CPE2 is the coating capacitor and Rf is the coating resistance [32]. It can be seen that the Rct is largely improved from about 1000 to over 20,000 Ω cm2, after coating the Ni-W alloy in the Fe substrate, indicating that the coatings improved corrosion resistance [33]. Moreover, this value was much higher than the reported value (5619 Ω cm2), and so the corrosion resistance was better than the value reported in [29]. At 600 °C, the brown oxide layer further increased the Rct, implying a better corrosion resistance.
The electrocatalytic HER performance of the Ni-15 wt.% W alloy coating was assessed in 6 wt.% NaOH solution by LSV electrochemical technology. The results are shown in Figure 9. As Figure 9 shows, the Ni-15 wt.% W alloy coating prepared by the pyrophosphate system exhibits a good catalytic activity. It requires an overpotential of 0.55 V to drive a current density of 100 mA cm−2, which is lower than that of Fe (0.59 V) and much higher than that of Pt (0.17 V). The HER activity of the compact and flat Ni-15 wt.% W alloy coating was slightly better than that of the surface of the relatively flat Ni-W alloys [34,35,36,37] (see Table 5); as it is affected by the roughness [38], it is weaker than the nanostructured and porous Ni-W alloys [22]. The alloys’ HER activity can be further improved along with the annealed temperature, suggesting that the crystallization material is better than that of the amorphous structure. This is due to the elimination of the internal stress and an increased grain growth, which positively influence the hydrogen absorption capacity of Ni-W coating. However, at 600 °C, the HER activity becomes weaker, which is attributed to the surface oxidation state.

4. Conclusions

In summary, the compact and flat Ni-15 wt.% W alloy without cracks was electrodeposited from a pyrophosphate system at 40 °C and presented a high microhardness, excellent oxidation resistance, excellent corrosion resistance and good HER activity. The Ni-15 wt.% W coating had a microhardness of 534 HV at room temperature and 895 HV at 400 °C, attributed to the nanocrystalline structure transformed from its as-deposited amorphous structure. Compared with the bare Fe substrate, the as-deposited and annealed Ni-15 wt.% W coatings possessed an improved corrosion resistance, for example, at 600 °C, the coating positively shifted to −349 mV and ΔEcorr is 262 mV. The low Icorr of 1.91 μA cm−2 and high Rct of 37,552 Ω cm2 for the sampled annealed at 600 °C implied an excellent corrosion resistance, attributed to the surface oxidation in the air in a high temperature environment, while the best HER activity appeared at an intermediate temperature of 400 °C, attributed to the joint effect of the nanocrystalline structure formation and surface oxidation.

Supplementary Materials

The following are available online at https://www.mdpi.com/article/10.3390/coatings11101262/s1, Figure S1: SEM images of Ni-W alloy coatings prepared from the pyrophosphate system at a temperature of 40 °C, at different current densities of (a) 4, (b) 6, (c) 8 and (d) 10 A dm−2 in 20 g L−1 Na2WO4 2H2O bath, and at different current densities of (e) 4, (f) 6, (g) 8, and (h) 10 A dm−2 in 60 g L−1 Na2WO4 2H2O bath, Figure S2: SEM images of nickel-tungsten alloy obtained in an additive-free bath, Figure S3: XRD patterns of as-deposited alloys prepared at current densities of 4, 6, 8 and 10 A dm−2 in dif-ferent bath concentrations (a) 20 g L−1 Na2WO4 2H2O and (b) 60 g L−1 Na2WO4 2H2O, Figure S4: Tafel curves of Ni-15 wt.% W coatings as-deposited and annealed at different temperatures in air for 2 h, Figure S5: Nyquist plots of annealed Ni-15 wt.% W coated on Fe substrates, Table S1: Corrosion resistance of Ni-15 wt.% W alloy coatings as-deposited and annealed, Table S2: EIS spectrum fitting results of Ni-W coating in 3.5 wt.% NaCl solution.

Author Contributions

Conceptualization, C.S. and W.B.; Data curation, Z.S., C.S. and L.Z.; Formal analysis, F.W. and C.S.; Investigation, Z.S.; Resources, C.S. and W.B.; Validation, Y.L.; Writing—original draft, Z.S. and C.S.; Writing—review & editing, Z.S. and C.S. All authors have read and agreed to the published version of the manuscript.

Funding

This research was funded by Provincial Natural Science Foundations of Hunan (2021JJ30184, 2021JJ30180, 2020JJ4243), the Scientific Research Fund of Hunan Provincial Education Department (20A108), the National Natural Science Foundation of China (51561032) and Doctoral Research Fund of Hunan Institute of Engineering (09001003-21017).

Acknowledgments

The authors acknowledge the financial support from Provincial Natural Science Foundations of Hunan (2021JJ30184, 2021JJ30180, 2020JJ4243), the Scientific Research Fund of Hunan Provincial Education Department (20A108), the National Natural Science Foundation of China (51561032) and Doctoral Research Fund of Hunan Institute of Engineering (09001003-21017).

Conflicts of Interest

The authors declare no conflict of interest.

References

  1. Wang, Y.; Zhou, Q.; Li, K.; Zhong, Q.; Bui, Q.B. Preparation of Ni–W–SiO2 nanocomposite coating and valuation of its hardness and corrosion resistance. Ceram. Int. 2015, 41, 79–84. [Google Scholar] [CrossRef]
  2. Määttä, A.; Kanerva, U.; Vuoristo, P. Structure and Tribological Characteristics of HVOF Coatings Sprayed from Powder Blends of Cr3C2-25NiCr and NiCrBSi Alloy. J. Therm. Spray Technol. 2010, 20, 366–371. [Google Scholar] [CrossRef]
  3. Huang, B.; Gao, Y.; Chen, P.; Xiong, W.; Tang, J. Microstructure and properties of Ni + B4C/Ti coatings by high-frequency induction cladding. Surf. Innov. 2019, 7, 59–67. [Google Scholar] [CrossRef]
  4. Zikin, A.; Antonov, M.; Hussainova, I.; Katona, L.; Gavrilović, A. High temperature wear of cermet particle reinforced NiCrBSi hardfacings. Tribol. Int. 2013, 68, 45–55. [Google Scholar] [CrossRef]
  5. Garrido, A.H.; González, R.; Cadenas, M.; Battez, A.H. Tribological behavior of laser-textured NiCrBSi coatings. Wear 2011, 271, 925–933. [Google Scholar] [CrossRef]
  6. Gyftou, P.; Stroumbouli, M.; Pavlatou, E.A.; Asimidis, P.; Spyrellis, N. Tribological study of Ni matrix composite coatings containing nano and micro SiC particles. Electrochim. Acta 2005, 50, 4544–4550. [Google Scholar] [CrossRef]
  7. Allahyarzadeh, M.H.; Aliofkhazraei, M.; Rezvanian, A.R.; Torabinejad, V.; Sabour Rouhaghdam, A.R. Ni-W electrodeposited coatings: Characterization, properties and applications. Surf. Coat. Technol. 2016, 307, 978–1010. [Google Scholar] [CrossRef]
  8. Hosseini, M.G.; Abdolmaleki, M.; Sadjadi, S.A.S. Electrodeposition and mechanical properties of Ni-W-B composites from tartrate bath. Prot. Met. Phys. Chem. Surf. 2010, 46, 117–122. [Google Scholar] [CrossRef]
  9. Kirihara, S.; Umeda, Y.; Tashiro, K.; Honma, H.; Takai, O. Development of Ni-W alloy plating as a substitution of hard chromium plating. Trans. Mater. Res. Soc. Jpn. 2016, 41, 35–39. [Google Scholar] [CrossRef] [Green Version]
  10. Donten, M.; Cesiulis, H.; Stojek, Z. Electrodeposition and properties of Ni-W, Fe-W and Fe-Ni-W amorphous alloys. A comparative study. Electrochim. Acta 2000, 45, 3389–3396. [Google Scholar] [CrossRef]
  11. Fang, M.; Dong, G.; Wei, R.; Ho, J.C. Hierarchical Nanostructures: Hierarchical Nanostructures: Design for Sustainable Water Splitting. Adv. Energy Mater. 2017, 7, 1770135. [Google Scholar] [CrossRef] [Green Version]
  12. Zhang, W.; Qi, J.; Liu, K.; Cao, R. A Nickel-Based Integrated Electrode from an Autologous Growth Strategy for Highly Efficient Water Oxidation. Adv. Energy Mater. 2016, 6, 1502489. [Google Scholar] [CrossRef]
  13. Pletcher, D.; Li, X. Prospects for alkaline zero gap water electrolysers for hydrogen production. Int. J. Hydrogen Energy 2011, 36, 15089–15104. [Google Scholar] [CrossRef] [Green Version]
  14. Du, Y.; Li, Z.; Liu, Y.; Yang, Y.; Wang, L. Nickel-iron phosphides nanorods derived from bimetallic-organic frameworks for hydrogen evolution reaction. Appl. Surf. Sci. 2018, 457, 1081–1086. [Google Scholar] [CrossRef]
  15. Zheng, Y.; Jiao, Y.; Zhu, Y.; Li, L.H.; Han, Y.; Chen, Y.; Du, A.; Jaroniec, M.; Qiao, S.Z. Hydrogen evolution by a metal-free electrocatalyst. Nat. Commun. 2014, 5, 15729–15735. [Google Scholar] [CrossRef] [Green Version]
  16. McKone, J.R.; Marinescu, S.C.; Brunschwig, B.S.; Winkler, J.R.; Gray, H.B. Earth-abundant hydrogen evolution electrocatalysts. Chem. Sci. 2014, 5, 865–878. [Google Scholar] [CrossRef] [Green Version]
  17. Karaguiozova, Z.; Stavrev, S.; Babul, T.; Ciski, A. Influence of cubic nanostructure additions on the properties of electroless coatings. Int. J. Nanomanufacturing 2010, 5, 129–138. [Google Scholar] [CrossRef]
  18. Wang, H.-T.; Sheu, H.-H.; Ger, M.-D.; Hou, K.-H. The effect of heat treatment on the microstructure and mechanical properties of electrodeposited nanocrystalline Ni–W/diamond composite coatings. Surf. Coat. Technol. 2014, 259, 268–273. [Google Scholar] [CrossRef]
  19. Yamasaki, T.; Oda, N.; Matsuoka, H.; Fukami, T. Tensile strength of electrodeposited nanocrystalline Ni–W alloys with finely dispersed micrometer-sized array through-holes. Mater. Sci. Eng. A 2007, 449–451, 833–835. [Google Scholar] [CrossRef]
  20. Suvorov, D.; Gololobov, G.; Tarabrin, D.; Slivkin, E.; Karabanov, S.; Tolstoguzov, A. Electrochemical Deposition of Ni–W Crack-Free Coatings. Coatings 2018, 8, 233. [Google Scholar] [CrossRef] [Green Version]
  21. Ghorbanian, B.; Tajally, M.; Khoie, S.M.M.; Tavakoli, H. Corrosion Behavior of MoS2-Incorporated PEO Coatings Prepared on Al Alloy. Surf. Innov. 2020, 8, 252–262. [Google Scholar] [CrossRef]
  22. Jameei Rad, P.; Aliofkhazraei, M.; Barati Darband, G. Ni-W nanostructure well-marked by Ni selective etching for enhanced hydrogen evolution reaction. Int. J. Hydrogen Energy 2019, 44, 880–894. [Google Scholar] [CrossRef]
  23. Krasikov, A.V.; Krasikov, V.L. Mechanism of Nickel-Tungsten Alloy Electrodeposition from Pyrophosphate Electrolyte. Bull. SPbSTI 2016, 36, 12–23. [Google Scholar] [CrossRef]
  24. Panagopoulos, C.N.; Plainakis, G.D.; Lagaris, D.A. Nanocrystalline Ni–W coatings on copper. Mater. Sci. Eng B 2011, 176, 477–479. [Google Scholar] [CrossRef]
  25. Yin, D.; Marvel, C.J.; Cui, F.Y.; Vinci, R.P.; Harmer, M.P. Microstructure and fracture toughness of electrodeposited Ni-21 at.% W alloy thick films. Acta Mater. 2018, 143, 272–280. [Google Scholar] [CrossRef]
  26. Haj-Taieb, M.; Haseeb, A.S.M.A.; Caulfield, J.; Bade, K.; Aktaa, J.; Hemker, K.J. Thermal stability of electrodeposited LIGA Ni–W alloys for high temperature MEMS applications. Microsyst. Technol. 2008, 14, 1531–1536. [Google Scholar] [CrossRef]
  27. Hwang, W.S.; Lee, J.J. Effects of Heat Treatment on Hardness of Nanocrystalline Ni-W Electrodeposits. Mater. Sci. Forum 2006, 510–511, 1126–1129. [Google Scholar] [CrossRef]
  28. Hernn, D.M.V.; Aida, M.E.; Gilberto, B.G. Detailed Study of the Electrochemical Behavior of Low Reflectivity TiAlN Coatings. Surf. Innov. 2021, 9, 293–307. [Google Scholar] [CrossRef]
  29. Hosseini, M.G.; Abdolmaleki, M.; Ghahremani, J. Investigation of corrosion resistance of electrodeposited Ni–W/SiC composite coatings. Corros. Eng. Sci. Technol. 2013, 49, 247–253. [Google Scholar] [CrossRef]
  30. Popczyk, M.; Kubisztal, J.; Swinarew, A.S.; Waśkiewicz, Z.; Stanula, A.; Knechtle, B. Corrosion Resistance of Heat-Treated Ni-W Alloy Coatings. Materials 2020, 13, 1172. [Google Scholar] [CrossRef] [Green Version]
  31. Xiao, Y.; Yu, L.B.; Zhong, Q.J.; Gu, J.F.; Zhou, Q.Y.; Zhong, Q.D. The Effect of Cl- Concentration on the Corrosion Behavior of Electroplated Cu-Ni-W Alloy Coating. Adv. Mater. Res. 2013, 785–786, 953–956. [Google Scholar] [CrossRef]
  32. Jinlong, L.; Zhuqing, W.; Tongxiang, L.; Suzuki, K.; Hideo, M. Effect of tungsten on microstructures of annealed electrodeposited Ni-W alloy and its corrosion resistance. Surf. Coat. Technol. 2018, 337, 516–524. [Google Scholar] [CrossRef]
  33. Gao, Y.; Wu, Y.; He, H.; Tan, W. Potentiostatic electrodeposition of Ni-Se-Cu on nickel foam as an electrocatalyst for hydrogen evolution reaction. J. Colloid Interface Sci. 2020, 578, 555–564. [Google Scholar] [CrossRef] [PubMed]
  34. Elias, L.; Scott, K.; Hegde, A.C. Electrolytic Synthesis and Characterization of Electrocatalytic Ni-W Alloy. J. Mater. Eng. Perform. 2015, 24, 4182–4191. [Google Scholar] [CrossRef]
  35. Elias, L.; Cao, P.; Hegde, A.C. Magnetoelectrodeposition of Ni–W alloy coatings for enhanced hydrogen evolution reaction. RSC Adv. 2016, 6, 111358–111365. [Google Scholar] [CrossRef]
  36. Elias, L.; Hegde, A.C. Electrolytic Synthesis of Ni-W-MWCNT Composite Coating for Alkaline Hydrogen Evolution Reaction. J. Mater. Eng. Perform. 2018, 27, 1033–1039. [Google Scholar] [CrossRef]
  37. Ábel, M.; Záchenská, J.; Dobročka, E.; Zemanová, M. Electrocatalytic properties of pulse plated Ni-W alloy coatings in alkaline electrolytes. Trans. IMF 2021, 99, 23–28. [Google Scholar] [CrossRef]
  38. Ahn, S.H.; Choi, I.; Park, H.Y.; Hwang, S.J.; Yoo, S.J.; Cho, E.; Kim, H.J.; Henkensmeier, D.; Nam, S.W.; Kim, S.K.; et al. Effect of morphology of electrodeposited Ni catalysts on the behavior of bubbles generated during the oxygen evolution reaction in alkaline water electrolysis. Chem. Commun. 2013, 49, 9323–9325. [Google Scholar] [CrossRef]
Figure 1. (a) EDX spectra of N-W alloy coatings prepared at different current densities from the pyrophosphate bath containing 40 g L−1 Na2WO4·2H2O at 40 °C. (b) The relationship between current density and W content in the coatings electrodeposited from the baths containing different concentrations of Na2WO4·2H2O.
Coatings 11 01262 g001
Figure 2. SEM images of Ni-W alloy coatings prepared from the pyrophosphate system at a temperature of 40 °C, at different current densities of (a) 4, (b) 6, (c) 8 and (d) 10 A dm−2.
Coatings 11 01262 g002
Figure 3. The XRD patterns of as-deposited alloys prepared at 4, 6, 8, and 10 A dm−2 current densities.
Coatings 11 01262 g003
Figure 4. TG and DSC curves of theNi-15 wt.% W alloy.
Coatings 11 01262 g004
Figure 5. The XRD pattern evolution of theNi-15 wt.% W alloy along with the heat treatment temperature.
Coatings 11 01262 g005
Figure 6. Indentation optical images of Ni-15 wt.% W alloy coating (a) as-deposited, (b) annealed at 300 °C and (c) annealed at 400 °C. (d) The microhardness curve annealed at different temperatures of from 200 to 700 °C in air for 2 h.
Coatings 11 01262 g006
Figure 7. Tafel curves of Ni-15 wt.% W coatings as-deposited and annealed at different temperatures in air for 2 h.
Coatings 11 01262 g007
Figure 8. (a) Nyquist plots of as-deposited and annealed Ni-15 wt.% W coated on Fe substrates. (b) Equivalent circuit diagram.
Coatings 11 01262 g008
Figure 9. HER of Ni-15 wt.% W alloy in 6 wt.% NaOH solution as-deposited and annealed at different temperatures. For comparison, the HER curves of Fe and Pt electrodes are shown.
Coatings 11 01262 g009
Table 1. Bath compositions and plating conditions for Ni-W alloy coatings from a pyrophosphate system.
Chemicals/Parameters Values (g/L)
NiSO4·6H2O12
NaWO4·2H2O20, 30, 40, 50, 60
Na4P2O7·10H2O40
H3PO4 (85%)10
NH3·H2O (25–28%)~20
Additions20
Bath temperature40 °C
Current density4–10 A/dm2
pH8.5–9.0
Table 2. Grain size of Ni-15 wt.% W alloy as-deposited and annealed.
T/°C2θ/°β/°d/nm
As-deposited43.8490.62913.46
20043.890.82810.23
30043.8490.68912.29
40043.7470.65312.96
50043.7480.32326.21
60043.7890.23536.03
70044.0340.451-
Table 3. Corrosion resistance of Ni-15 wt.% W alloy coatings as-deposited and annealed.
SampleT/°CIcorr/μA.cm−2Ecorr (vs. SCE)/mVΔEcorr/mV
Fe-5.71-6110
Ni-W alloy coatingAs-deposited4.45-447164
2002.33-440171
4002.02-386225
6001.91-349262
Table 4. EIS spectrum fitting results of Ni-W coating in 3.5 wt.% NaCl solution.
SampleT/(°C)Rs/
Ω cm2
CPE1-T/
F cm−2
CPE1-PRf/
Ω cm2
CPE2-T/
F cm−2
CPE2-PRct/
Ω cm2
Fe-5.420.000590.7627.610.00220.90958
Ni-W alloy coating-5.390.0000390.8412.250.00000501.0921,468
2005.740.0000330.855.170.00000861.0522,547
4005.790.0000260.8612.910.00000181.1020,561
6005.870.0000440.8620.620.00000151.1637,552
Table 5. Comparison of HER over-potential of Ni-W alloys at 20 mA cm−220) and 100 mA cm−2100).
NO.η20/Vη100/VMicrostructureReference
10.410.55Compact, flat and without cracks.This work
20.560.73Micro-cracks[34]
30.470.56Micro-cracks[35]
40.470.54Smooth, flat, micro-cracks[36]
5-0.56Nodular[37]
Publisher’s Note: MDPI stays neutral with regard to jurisdictional claims in published maps and institutional affiliations.

