Article

Corrosion Behavior of Alloyed Cast Iron in Ethylene Glycol-Based Engine Coolants at Elevated Temperature

Materials Science & Technology, Cummins Inc. Columbus, IN 47201, USA
*
Authors to whom correspondence should be addressed.
Coatings 2021, 11(3), 357; https://doi.org/10.3390/coatings11030357
Submission received: 9 February 2021 / Revised: 8 March 2021 / Accepted: 9 March 2021 / Published: 21 March 2021

Abstract

:
For enhanced engine performance, corrosivity of the engine coolants would play a significant role. In this work, corrosion investigation was performed on cast iron material in pre-mixed engine coolant environment to understand the threshold limits of contaminants. The pre-mixed coolant contained combination of organic additives viz. sebacate (SA), 2-ethylhexanoate (2-EH), and tolyltriazole (TTA) with varying concentrations of chloride contaminant. Constant immersion of cast iron samples in engine coolant with different chloride levels at 90 °C was followed by room temperature electrochemical tests. The potentiodynamic polarization tests showed no instability until 100 ppm chloride additions exposed up to 28 days. At lower frequencies in electrochemical impedance spectroscopy (EIS) spectra, inhibition layer characteristics changed from highly capacitive to highly resistive and concurrently a sharp decrease in charge transfer resistance was observed with time for samples exposed to >100 ppm chloride levels. In the longer duration corrosion tests, higher pit depths with increased number density of attacks were observed for cast iron samples exposed to engine coolants containing >100 ppm chloride. For elevated temperature exposures a threshold limit of <200 ppm chloride was established for cast iron samples.

1. Introduction

From environmental point of view the demands to enhance the efficiency of diesel engines are increasing and this creates new challenges for development of materials [1]. Chemical nature of engine coolant and its interaction with the materials in contact can significantly influence the overall engine performance. Historically, cast irons have been used as materials for multiple engine components viz. cylinder heads, engine blocks, tappet valves, cylinder liners, etc. owing to their lower cost, ease of processing, damping properties, etc. [1]. It is known that cast irons on their own are less corrosion resistant even in atmospheric conditions and therefore could be susceptible to corrosion by small concentrations of corrosive species viz. chlorides, nitrates, sulfates, carbonates [2]. To protect cast irons from corrosion, the engine coolants typically contain corrosion inhibitors e.g. organic acids, inorganic additives, or combinations of both to simultaneously boost the corrosion resistance and heat transfer performance [3,4]. Pellet et al. compared the corrosion inhibition of cylinder liners in engine coolants containing nitrites and carboxylates which reported improved liner protection in presence of carboxylates and showed no necessity of refortification of the additives [5]. Taking in to account the freezing point requirements, the engine coolants invariably contain fractions of ethylene glycol in its composition. The ingress and leaching of corrosive contaminants during operation and likelihood of formation of glycol degradation acids like glycolic acid, oxalic acid, formic acid, acetic acid, etc. due to oxidation of ethylene glycol has potential to lead to corrosive attack [5]. The carboxylate and carboxylate-nitrite added coolants markedly improved the corrosion behavior of cast iron material mainly attributed to minimal depletion of nitrites and carboxylate [6]. Maes et al. compared performance of different organic compounds using rapid cyclic potentiodynamic polarization studies [7]. In another study, Yang et al. reported screening of aluminum alloys exposed to higher temperatures in engine coolant environment using electrochemical tests [7,8]. Rajeshwari et al. employed organic compounds viz. glucose, gellan gum, and hydroxypropyl cellulose for corrosion inhibition of cast iron samples in aggressive 1 M HCl solutions and reported significant improvement in corrosion resistance attributed to the chemisorption mechanism [9]. In a recent study reported by Vieira et al. intercalated Mg–Al–Ce layered double hydroxides (LDHs) coatings over cast iron showed improvement in corrosion resistance in sodium chloride environment [10]. Studies have shown use of azoles as corrosion inhibitors on ferrous alloys (steels) and enhancement in corrosion resistance is attributed to adsorption of organic chain on the substrate [11,12]. Organic acid technology (OAT) coolants (wherein one or more organic acids are mixed together) have been reported to show marked increase in the corrosion inhibition of ferrous as well as non-ferrous engine components [3,13]. Santambrogio et al. showed that the kinetics of corrosion are significantly affected due to formation of complex between Fe ions and the major degradation acidic products viz. glycolic acid, formic acid, acetic acid, and oxalic acid of ethylene glycol which is one of the primary components of engine coolant formulation [14].
From engine application point of view, the frequency of engine coolant replacement depends on the extent of coolant degradation experienced during engine operations. Often, it is found that the coolant degradation is either qualitatively determined or through a historic dataset. However, there needs to be a more experimental test data-based decision-making in determination of coolant degradation—particularly the concentration of corrosive species. Considering this, the objective of present study was to understand the allowable threshold limits of corrosive species in the engine coolant. Cast iron material with enhanced mechanical properties was selected to investigate the corrosion behavior. Electrochemical tests were conducted on samples at room temperature as well as on the samples pre-exposed to high temperature coolant solutions.

2. Materials and Methods

2.1. Materials

Alloyed cast iron having nominal chemistry as described in Table 1 was used in this study. The principal alloying included additions either one or all of Cu, Cr, Mo, and Ni with micro-alloying additions of Nb, V, and Ti. The typical microstructure as illustrated in Figure 1 consisted of Type A graphite flakes and predominantly pearlite matrix per ASTM A247 [15]. The minimum tensile strength of this material was 295 MPa. Note carbon equivalent (C.E.) was estimated per summation of %C and one third of total Si and P.

2.2. Corrosion Testing

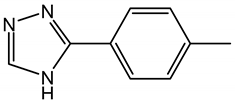
Room temperature and elevated temperature corrosion testing of cast iron samples were conducted in engine coolant environment containing sebacate (SA), 2-ethylhexanoate (2-EH), and tolyltriazole (TTA) organic inhibitor additives. Table 2 summarizes the molecular formula and respective structural notifications of these inhibitor additives. The samples for electrochemical testing were ground till 1200 grit followed by cleaning with ethanol. To understand the anodic behavior of the coolant inhibition on cast iron samples, potentiostatic polarization scans were performed. Cast iron samples were ground up to 1200 grit and cleaned in ethanol and were subjected to anodic polarization of +250 mV vs. respective open circuit potentials (OCP) up to 15 min in engine coolant with different chloride concentrations. Current density profile as a function of time was measured for this duration to understand the passivation behavior. Furthermore, electrochemical impedance spectroscopy (EIS) and potentiodynamic polarization scans were performed at room temperature with varying concentration of chlorides (0, 100, 200, and 500 ppm) in the coolant using a state of the art Potentiostat (Gamry, Warminster, PA, USA). Prior to all the EIS and polarization scans, OCP was measured for 30 min to stabilize the surface conditions. EIS scans were conducted at OCP using 10 mV sinusoidal perturbations in a frequency range of 0.01 Hz to 100 kHz. The EIS spectra were analyzed using ZView software (version 3.5) to extract the magnitudes of electrochemical parameters. The potentiodynamic polarization scans were performed from −750 to 2000 mV vs. OCP at a scan rate of 0.5 mV/s.
For further studies, the samples were subjected to constant immersion in inhibited engine coolants with varying chloride concentrations at 90 °C. At pre-determined times, the samples were removed and were subsequently followed and analyzed by EIS and potentiodynamic polarization scans in their respective chloride contaminated coolant environments. All the electrochemical tests were performed using state of the art Potentiostat (Gamry, Warminster, PA, USA) in a standard three electrode flat cell with sample as the working electrode, graphite as the counter electrode, and Ag/AgCl as the reference electrode. All the electrochemical tests were checked for repeatability by running multiple runs. Scanning electron microscopic (SEM, Hitachi, Atlanta, GA, USA) observations and energy dispersive spectroscopic (EDS, EDAX Genesis 4000, Mahwah, NJ, USA) analysis were performed on selected immersion samples to understand the corrosion behavior. Fourier transform infrared spectroscopy (FTIR, Therma Nicolet iN10, Thermo Fisher, Cincinnati, OH, USA) was performed on selected immersion samples to characterize the inhibition layer. Time of Flight Secondary Ion Mass Spectrometry (TOF-SIMS, PHI TRIFT III, Champaign, IL, USA) was conducted on the samples to gain an enhanced understanding of the composition of adsorbed inhibitor species. Data was collected in both positive and negative polarities with an Au+ liquid metal ion gun (LMIG, Physical Electronics, Champaign, IL, USA) using an ion beam potential of 22 kV over a 250 µm × 250 µm area.

3. Results

3.1. Potentiodynamic Polarization

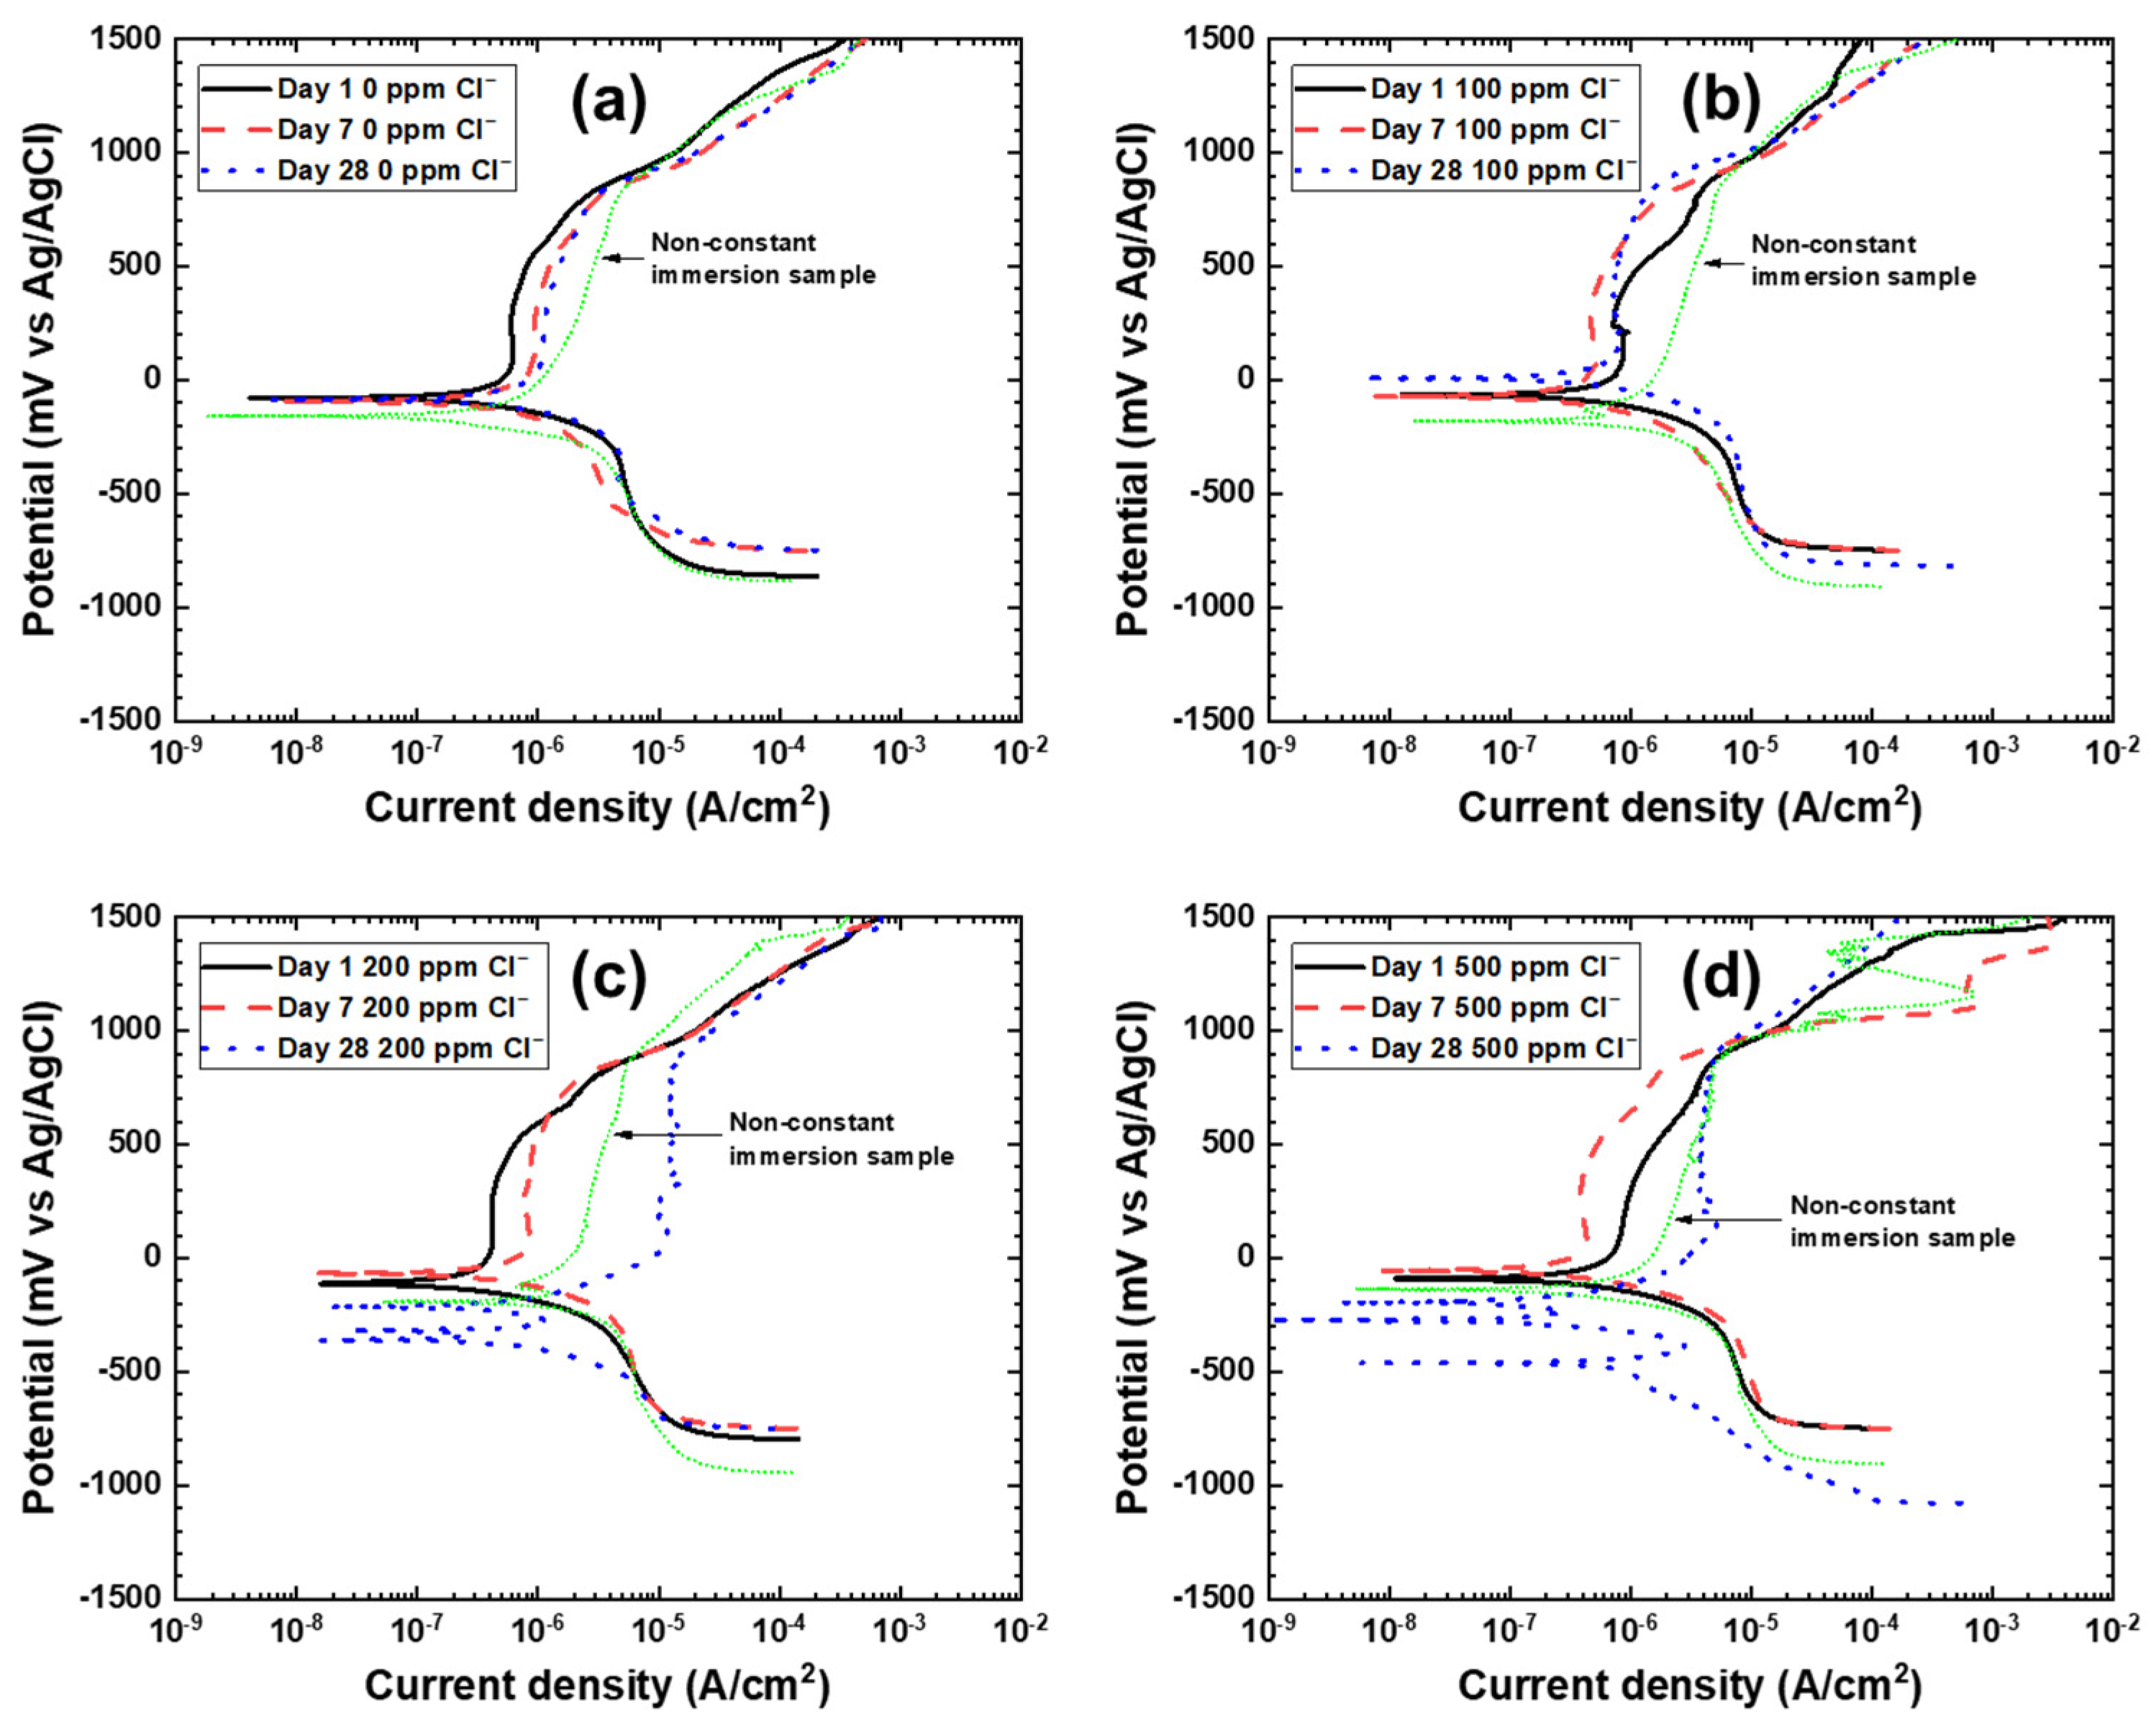
The results of potentiodynamic polarization of cast iron samples in coolants with different chloride concentrations and exposure times are shown in Figure 2. It was observed that the corrosion current (icorr) was in the similar range (~2–4 µA/cm2) for cast iron samples irrespective of the chloride concentration and exposure time. This includes cast iron samples pre-exposed to 90 °C temperature and different immersion times and the day 0 samples (polarization scan conducted after 30 min of OCP measurement at room temperature). This indicates that no cathodic inhibition was seen with the additive inhibitor package in the coolant in the presence of chloride additions. Figure 2 has day 0 sample designated as non-constant immersion sample. Although no clear trends in terms of icorr were observed, corrosion potential (Ecorr) shifted to negative potentials with an increase in Cl- ion concentrations. Cast iron samples exposed to 28 days in coolants containing 200 and 500 ppm Cl showed more negative corrosion potentials (~−350 to −465 mV vs. Ag/AgCl). In addition to this, these samples showed unstable passivity in the anodic arm of the polarization scan close to Ecorr and multiple Ecorr values were also observed (see Figure 2c,d. Moreover, these samples displayed one order of magnitude higher anodic current densities as compared to their counterparts day 0, 1, and 7 samples. This corresponds to the shift in Ecorr to more active potentials. In contrast to this, all the cast iron samples exposed to no Cl or 100 ppm Cl showed lower anodic current densities in a similar range of the order of ~10−6 µA/cm2. The cathodic arm of the polarization scans also showed similar behavior. It was found that the anodic current densities of the samples immersed in 0 ppm and 100 ppm chloride additions in the coolant solution, had lower anodic current densities immersed up to 28 days of exposure than the day 0 sample. This indicates sluggish inhibition kinetics of the inhibitor package in the coolant. On the contrary, the samples immersed in 200 and 500 ppm chloride additions in the coolant solution, had lower anodic current densities immersed only up to 7 days of exposure than the day 0 sample. The anodic kinetics increased by more than an order of magnitude at lower overpotentials (<500 mV above OCP) from day 7 to day 28 for the samples immersed in 200 and 500 ppm chloride additions in the coolant solution. The anodic current densities of these day 28 samples were higher than their day 0 samples. This indicates that the passive layer ceases to fully inhibit the chloride attack at chloride additions >200 ppm. Therefore, polarization results for cast iron indicated that the coolant corrosion inhibition efficiency remains unaffected at <200 ppm Cl concentrations, however, a decline in corrosion resistance offered by the coolant was seen for samples exposed to ≥200 ppm Cl concentrations for longer exposure times. Electrochemical parameters extracted from polarization are summarized in Table 3.

3.2. Potentiostatic Polarization

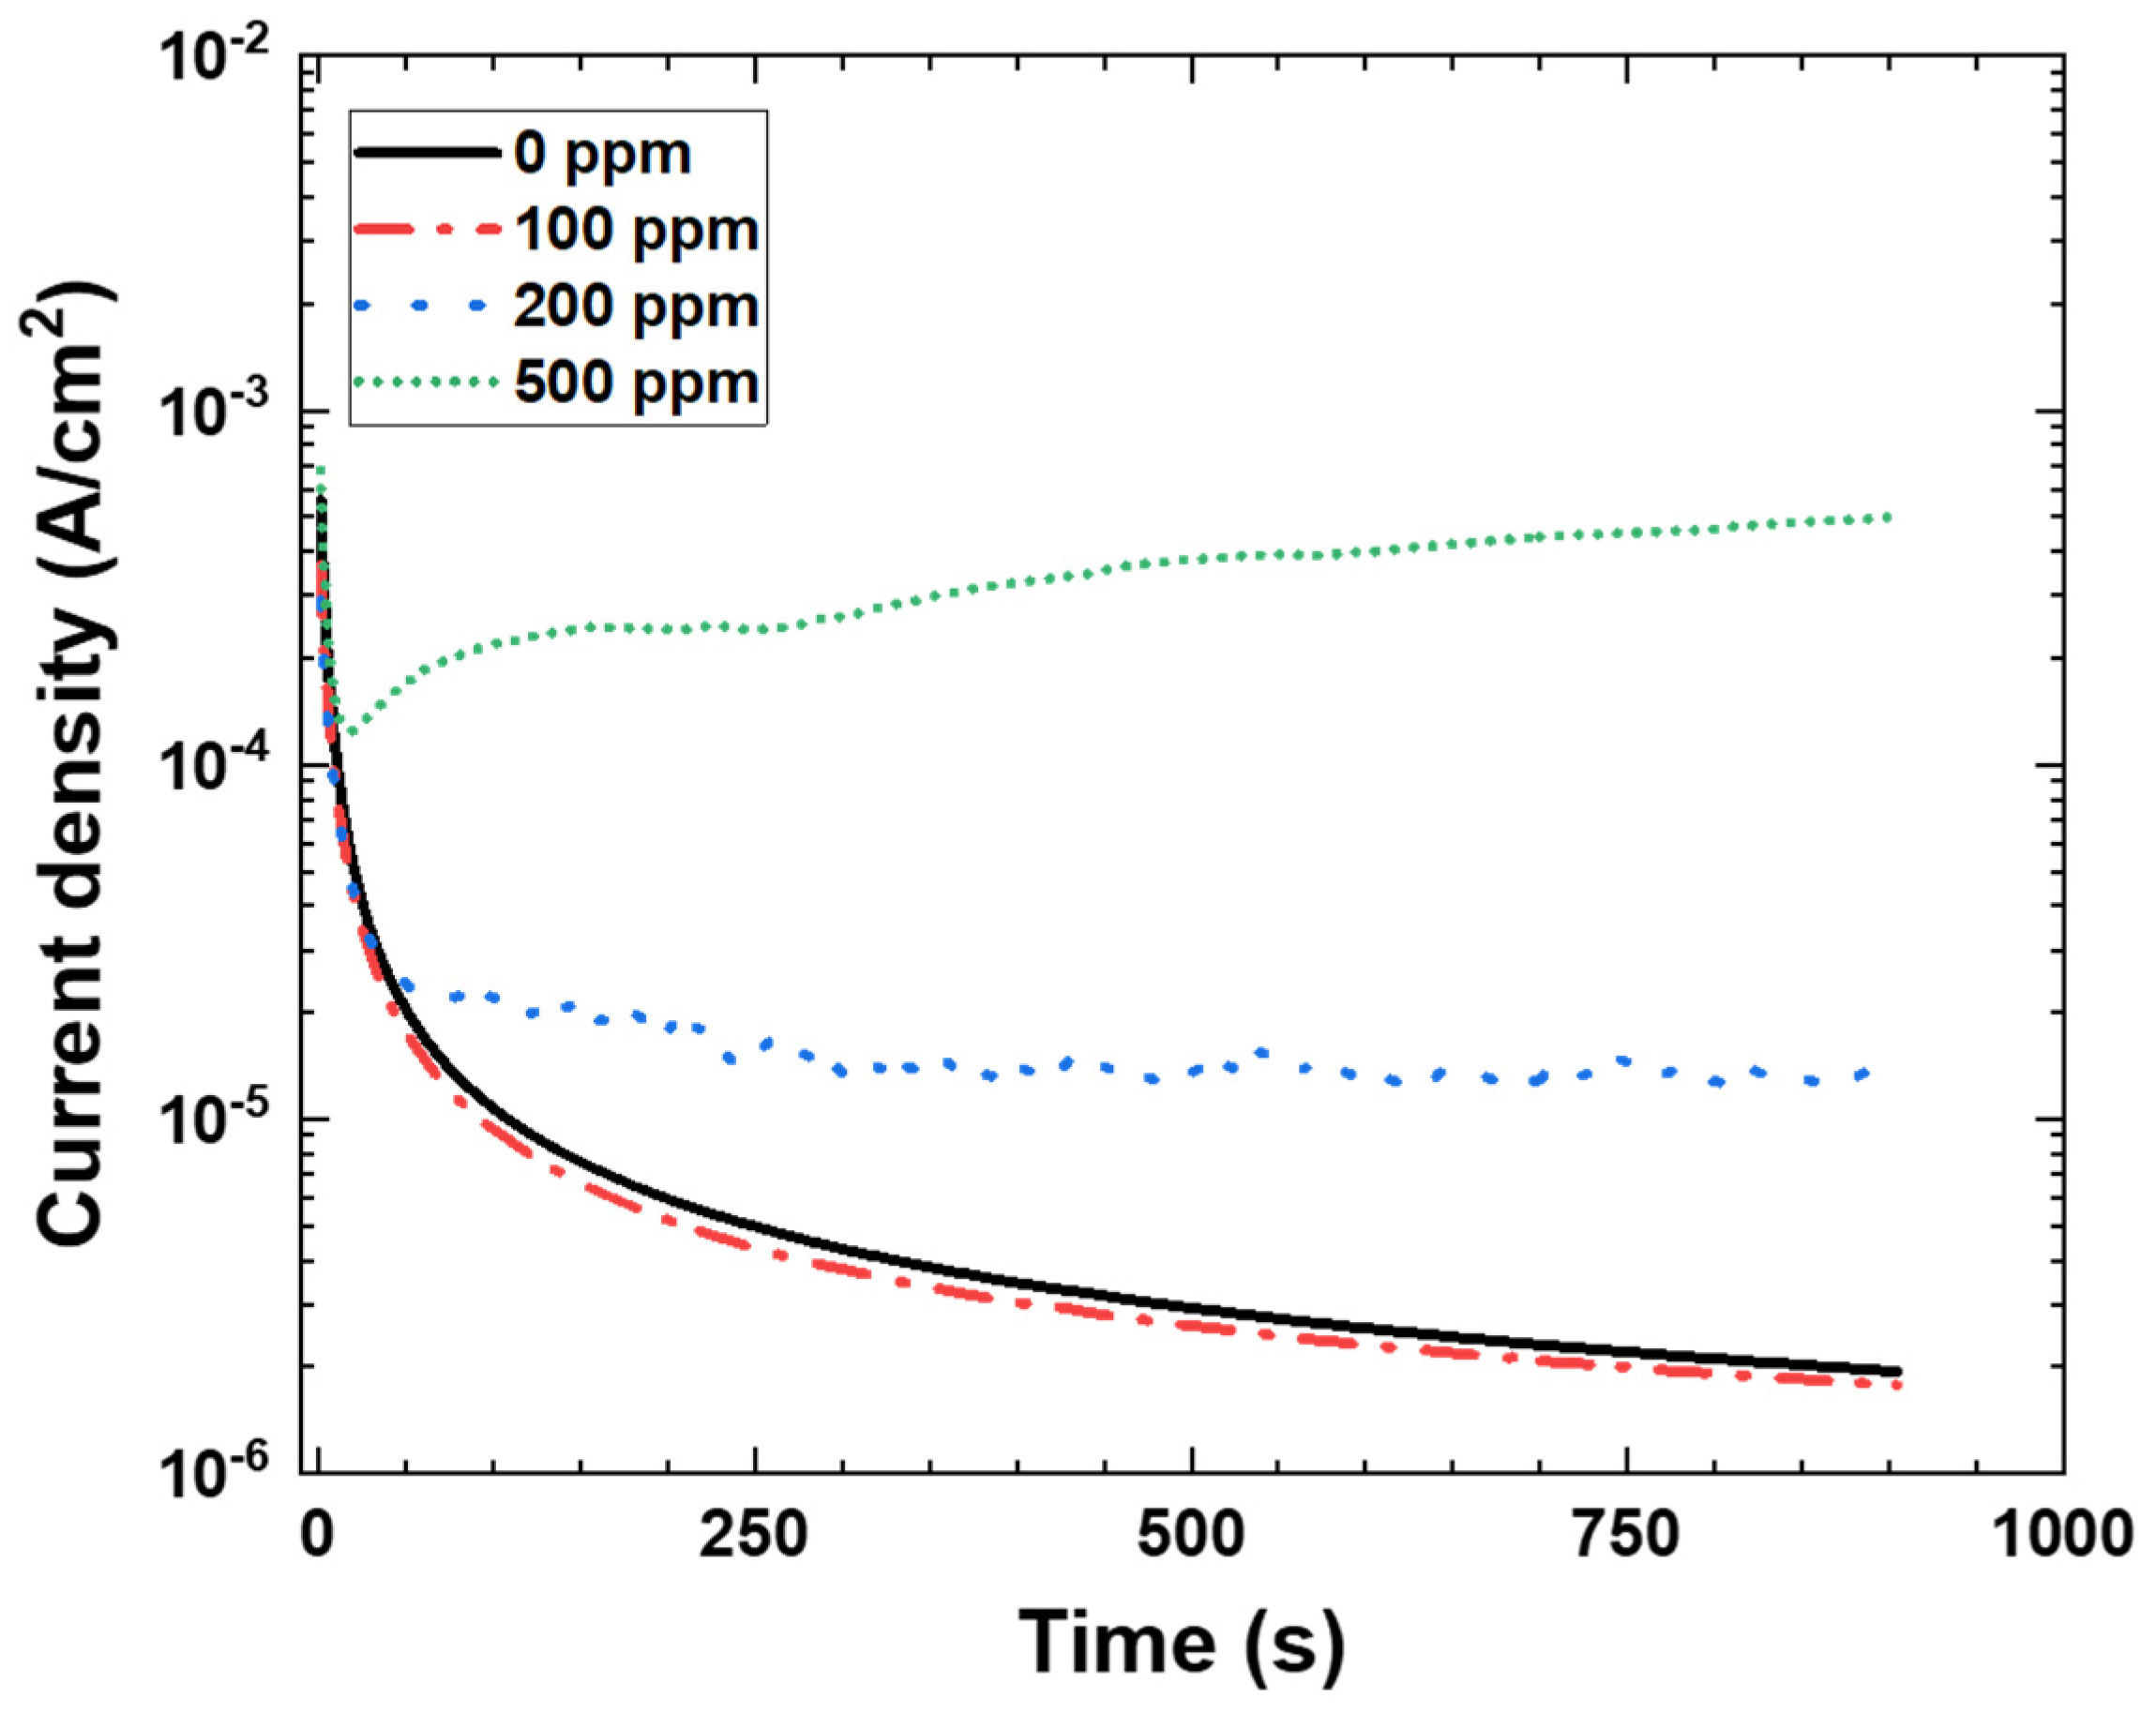
It was evident from the potentiodynamic polarization study that the corrosion inhibitor additives in the coolant influence the anodic behavior of the cast iron. Considering this, cast iron samples were subjected to anodic potentiostatic polarization test to understand the extent of corrosion inhibition action of the engine coolant additives. These samples were exposed to 0, 100, 200, and 500 ppm Cl with an impressed potential of +250 mV vs. respective OCP (OCP for 0 ppm: −75 mV, 100 ppm: −75 mV, 200 ppm: −160 mV, and 500 ppm: −250 mV vs. Ag/AgCl). Current density vs. time profiles of cast iron samples in different chloride containing engine coolants are shown in Figure 3. It was evident from the current density profiles that samples exposed to 0 and 100 ppm Cl concentrations displayed a decrease to a stable current density (~2–4 × 10⁻⁶ A/cm2) in approx. about 250 s. These current densities were within the range of their corrosion currents as observed in the polarization results for non-constant immersion sample in Figure 2. On the other hand, the sample exposed to 200 ppm Cl showed stabilized current density of one order of magnitude higher at approx. 2 × 10⁻⁵ A/cm2 within a similar time scale of 250 s. However, the sample with 500 ppm Cl additions showed an increasing trend in the current density with increasing time. The current density levels were significantly higher than 0, 100, or 200 ppm Cl levels of the order of 2–4 × 10⁻⁴ A/cm2. These potentiostatic results indicated that higher Cl contaminant levels (≥200 ppm) in inhibited engine coolants are detrimental to the cast iron as the inhibitor additives in the engine coolant lose their ability to provide corrosion protection. The chloride ion concentrations were able to breach the inhibition layer which was reflected in the higher current density values for 200 and 500 ppm Cl.

3.3. Electrochemical Impedance Spectroscopy

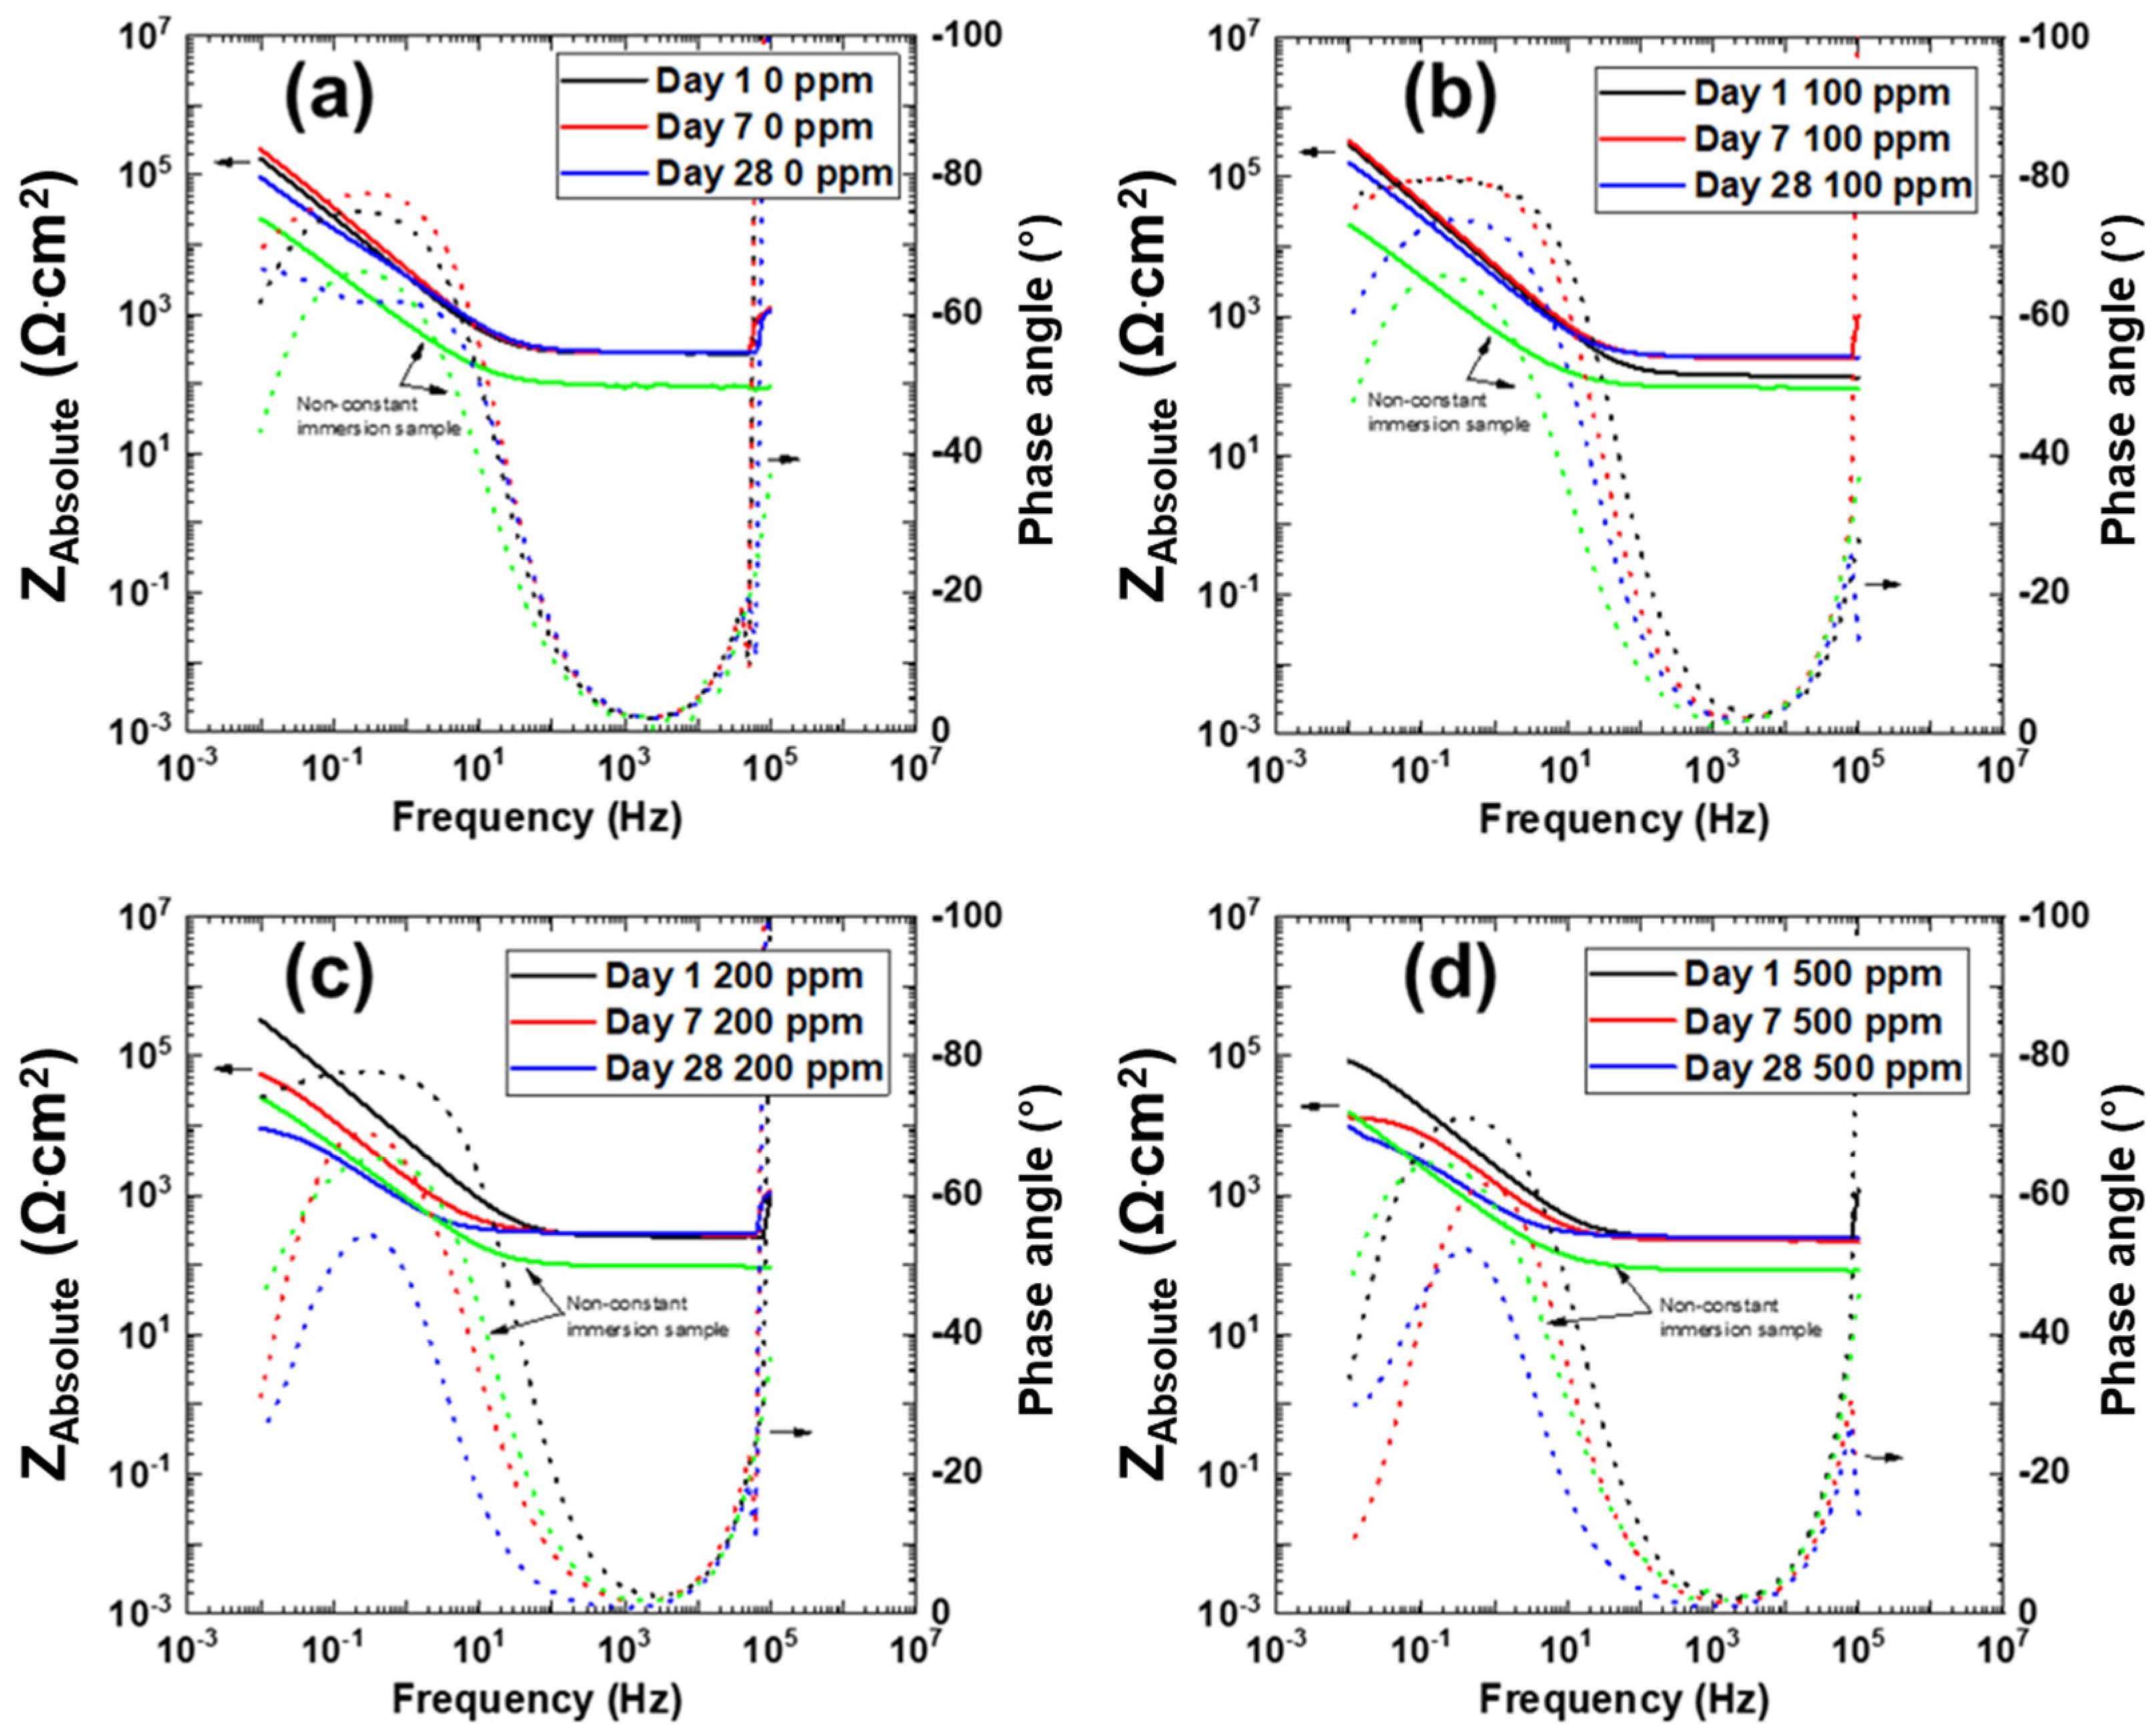
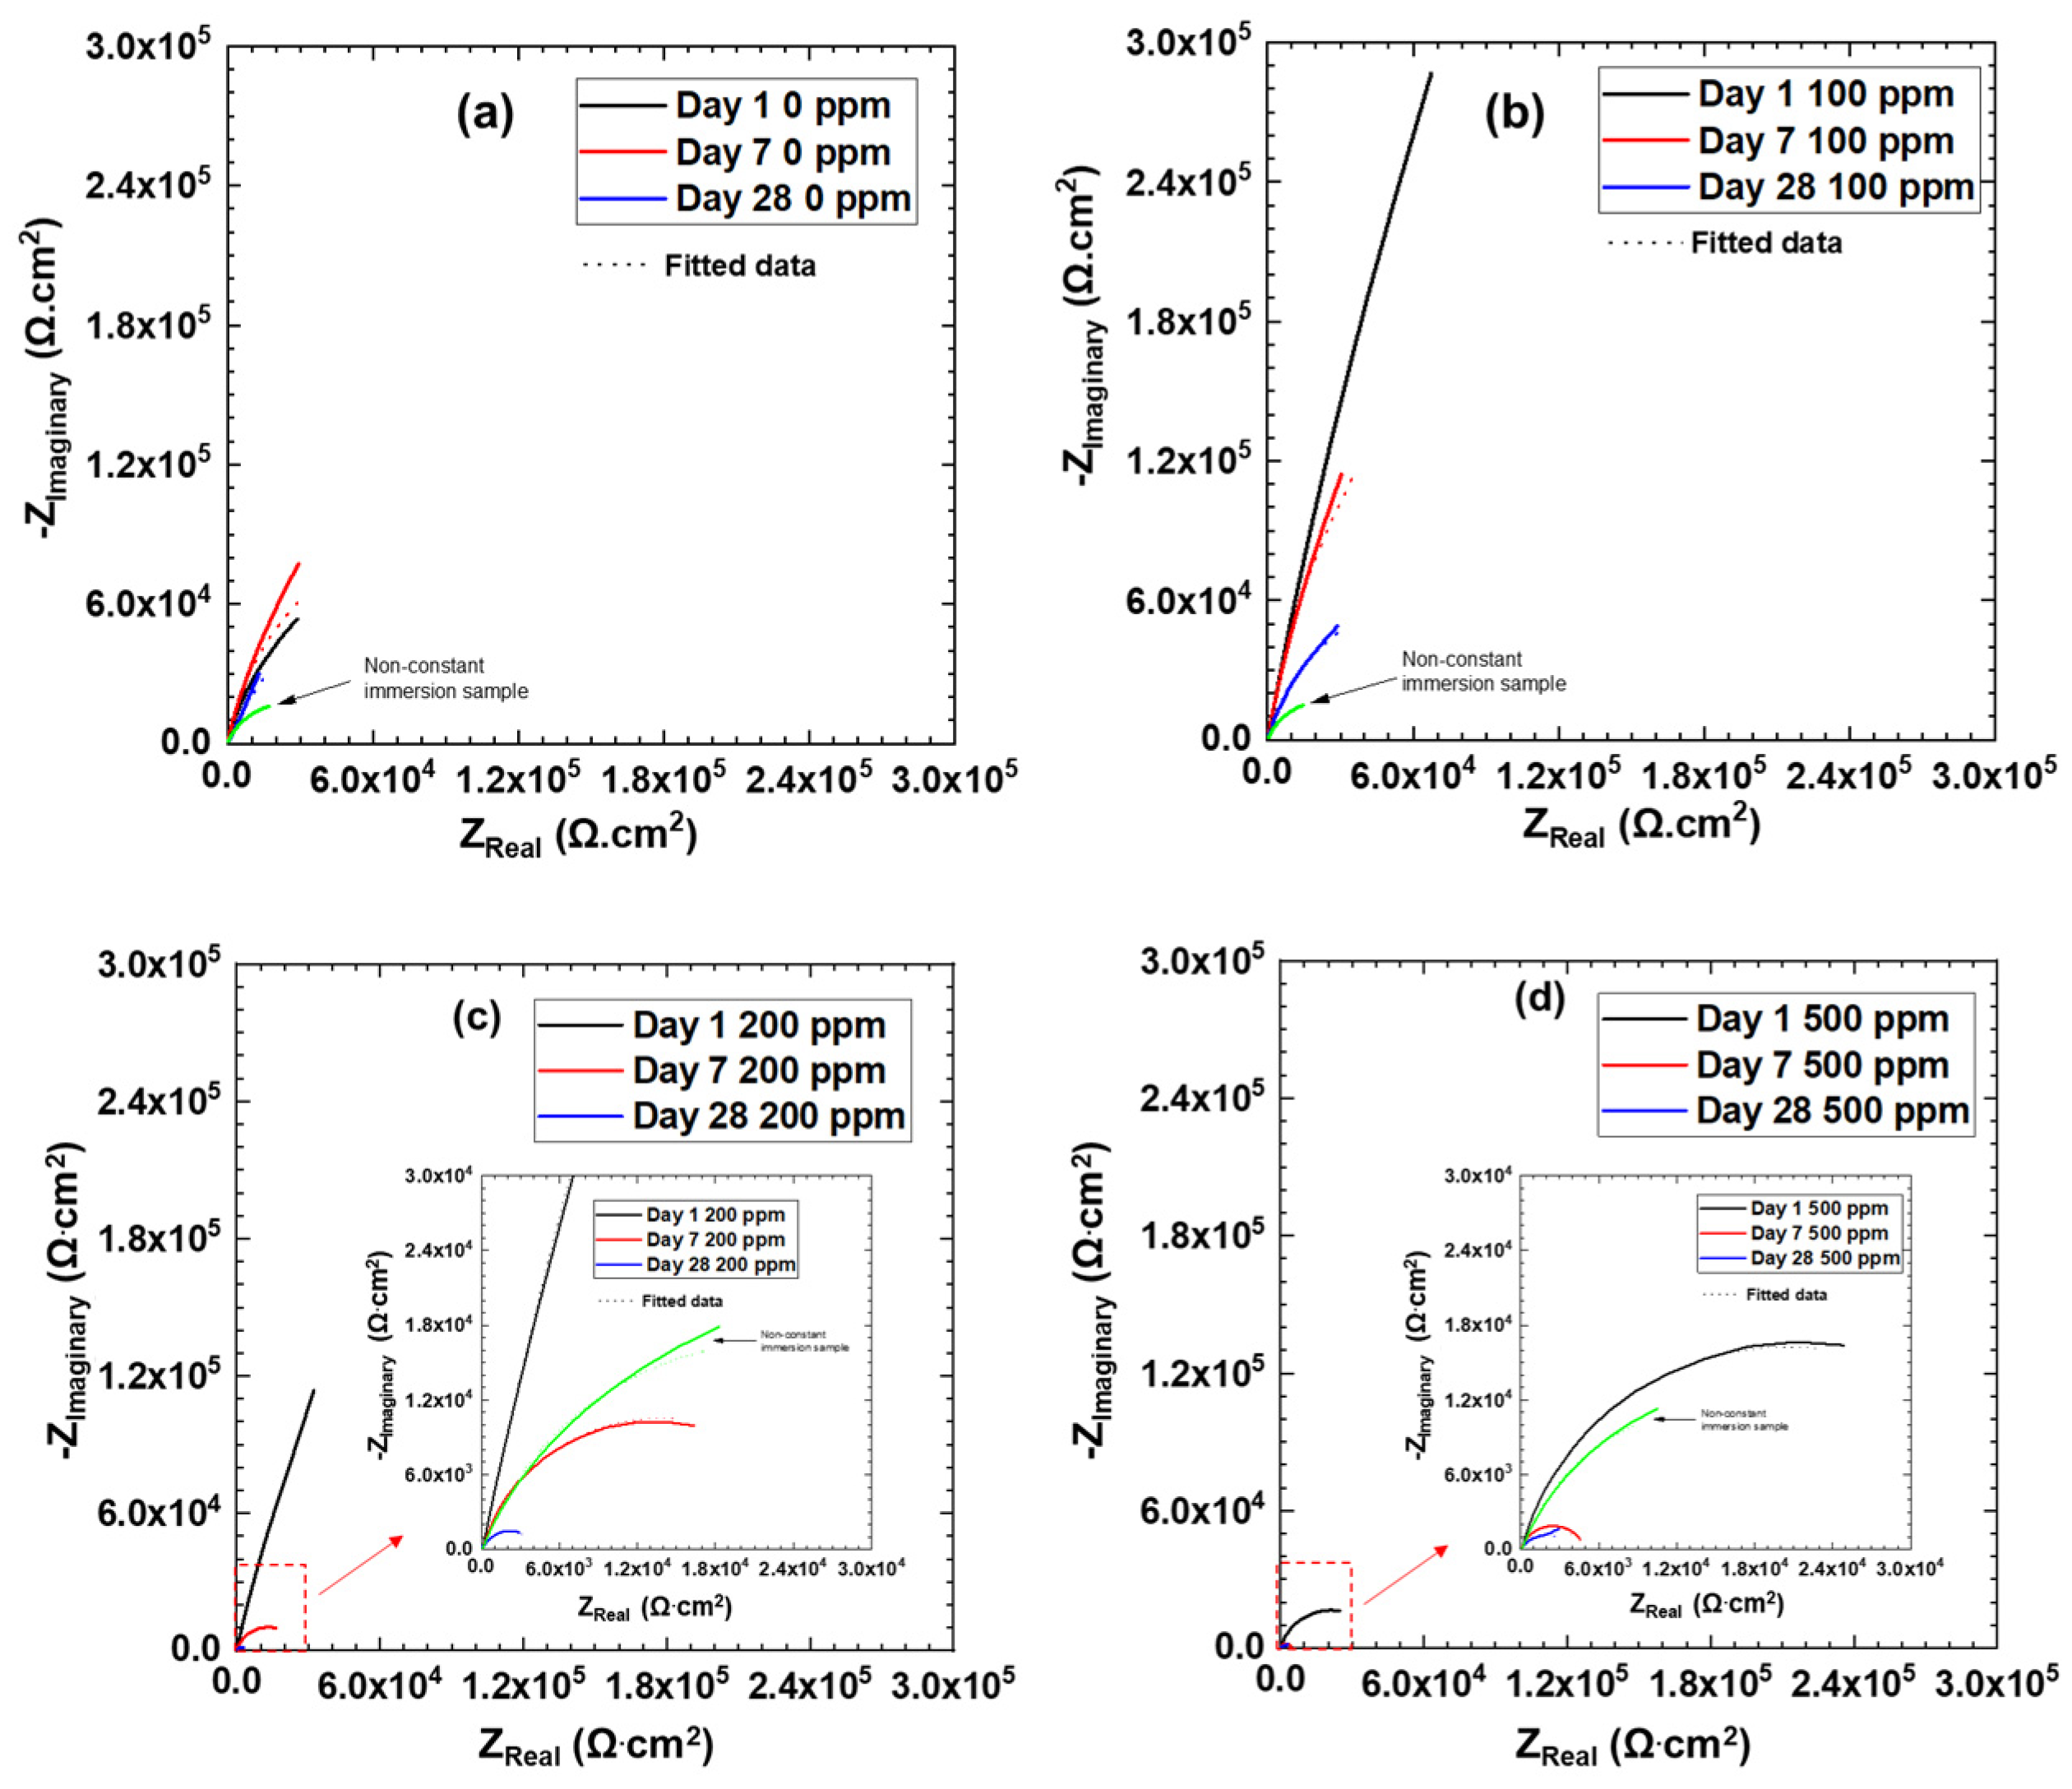
The corrosion inhibition mechanism of cast iron in engine coolant environment was probed using electrochemical impedance spectroscopy (EIS). Figure 4 and Figure 5 show the Bode and the Nyquist plots of cast iron samples in engine coolants with varying chloride concentrations, respectively. These plots include the results of freshly polished samples with no pre-exposure as well as constant immersion exposed samples in their respective chloride added coolant solutions. For all the samples, high phase angle values at higher frequencies are attributed to the presence of ethylene glycol (~40 vol.%) in the solution which can increase the dielectric properties of the electrolyte. The EIS behavior of all the cast iron samples were fitted using ZView software with an equivalent circuit given in Figure 6a and the fitted data are shown on the Nyquist plots in Figure 5. EIS data of cast iron samples were fitted by a single couple of resistance and constant phase element (CPE) circuit as shown in Figure 6a indicative of one-time constant behavior. The depressed nature of semi-circular profiles observed in Nyquist plots (see Figure 2) led to the use of constant phase elements (CPEs) instead of the ideal capacitor in the equivalent circuit. The impedance associated with CPEs can be expressed by the following equation:
Z C P E = ( J ω C ) n
where ZCPE is impedance, j is the square root of −1, ω is the angular frequency, C is the capacitance and n is the measure of the non-ideality of the capacitor with values between 0 and 1. The fitted parameters summarizing the variations in the charge transfer resistance (Rct) and double layer capacitance (Cdl) are shown Figure 6b,c. The double layer capacitances of cast iron samples under different environments were calculated using expression given in Equation (2).
C = T 1 / n R 1 n n
where, C is the capacitance, F/cm2, T is CPE-T values, n is the non-ideality as described earlier, and R is the value of resistance associated with the CPE element.
The immersion cast iron samples exposed to 0 and 100 ppm chloride additions in coolant up to 28 days showed similar EIS profiles (from Day 1 to Day 28) with low frequency |Z| values of the order of 105 ohm·cm2. The phase angle values at lower frequencies also showed a higher angle for cast iron samples exposed to 0 and 100 ppm chlorides solutions. Contrary to this, EIS profiles of non-constant immersion cast iron samples in 0 and 100 ppm chloride solutions with no pre-exposure showed completely different behavior when compared to the corresponding chloride ppm immersion samples. The low frequency impedance |Z| values for these non-constant immersion samples in 0 and 100 ppm samples were found to be lower by at least one order of magnitude and the low frequency phase angle profiles were found to be at lower angles when compared to the day 1 through day 28 samples. Moreover, a lower capacitance proportional to higher impedance at the sloped region in the EIS profiles were seen in the immersion samples exposed up to 28 days. The immersion in inhibited engine coolant environment for longer exposure times could have led to the formation of a metal-carboxylate protective layer. For the non-immersion samples, the formation of this layer likely was not there or was partial owing to lesser time of exposure and led to leaky capacitive characteristic (lower phase angle values at lower frequencies) of the surface layer. This corroborates with the observations seen in the polarization curves where lower anodic current densities were seen with longer exposure times in coolant solutions with coolant additions up to 100 ppm. Again, this indicates the sluggish inhibitor kinetics where longer exposure times show a more robust film formation on the metal surface.
On the other hand, the cast iron samples exposed to 200 and 500 ppm chlorides for 28 days showed |Z| values of the order of 104 ohm·cm2 at lower frequencies for non-immersion as well as immersion samples. Concurrently, the phase angle profiles also indicated more resistive behavior at lower frequencies with an increase in exposure time and a leaky capacitive behavior of the surface layer. The Day 1 results for both 200 and 500 ppm chlorides showed higher |Z| values at lower frequencies. Nyquist plots shown in Figure 5 showed diminishing nature of the loop for cast iron samples exposed to coolants containing 200 and 500 ppm chlorides (see Figure 5c,d. The samples exposed for longer immersion times in 200 and 500 ppm chloride solutions (day 7 and day 28) showed lower impedances than their day 1 and non-constant immersion samples. However, for samples exposed to 0 and 100 ppm chlorides, the Nyquist plots showed similar behavior with no shrinking in the loop (Figure 5a,b. The impedances of the samples exposed to 0 and 100 ppm chloride added coolant solutions exposed to days 1 through day 28 showed a higher impedance than the corresponding non-constant immersion samples. However, note that the impedance of the day 28 sample in these solutions showed lower values than that of day 1 and day 7 samples.
Electrochemical parameters calculated from EIS analysis have been summarized in Table 4. The data was fitted using ZView software by employing equivalent circuit shown in Figure 6a. The trends of electrochemical parameters; charge transfer resistance (Rct) and double layer capacitance (Cdl), calculated from the fitting of EIS profiles are represented in Figure 6b,c. Note that the Day 0 values in Figure 6b,c are the Rct and Cdl values calculated for the non-immersion cast iron samples in respective chloride solutions. The charge transfer resistance showed initially (for Day 0) low values which increased at Day 1 for 0, 100, and 200 ppm chlorides. The charge transfer resistance values showed significant drop (>2 orders of magnitude) for cast iron samples exposed to 28 days in 200 ppm chloride solutions. For the cast iron samples exposed to 0 and 100 ppm chloride solutions, the charge transfer resistance was maintained at an average of of ~106 ohm·cm2 for all the durations of exposure. The cast iron samples exposed to 500 ppm chlorides showed monotonous drop in the charge transfer resistance and the 28 Day samples showed ~2 orders of magnitude lower values as compared to their counterparts with 0 and 100 ppm chloride samples. The double layer capacitance showed a drop from day 0 to day 1 for all the samples in the chloride solutions and also showed a consistent increase with increase in exposure time from day 7 to day 28 for all the cast iron samples. However, it was observed that the longer duration samples exposed to 100 ppm chloride solutions showed a double layer capacitance of approximately one order of magnitude lower as compared to the samples exposed to 200 and 500 ppm chloride solutions.

3.4. Surface Analysis of Corrosion Coupons

3.4.1. SEM Analysis of the Constant Immersion Coupons

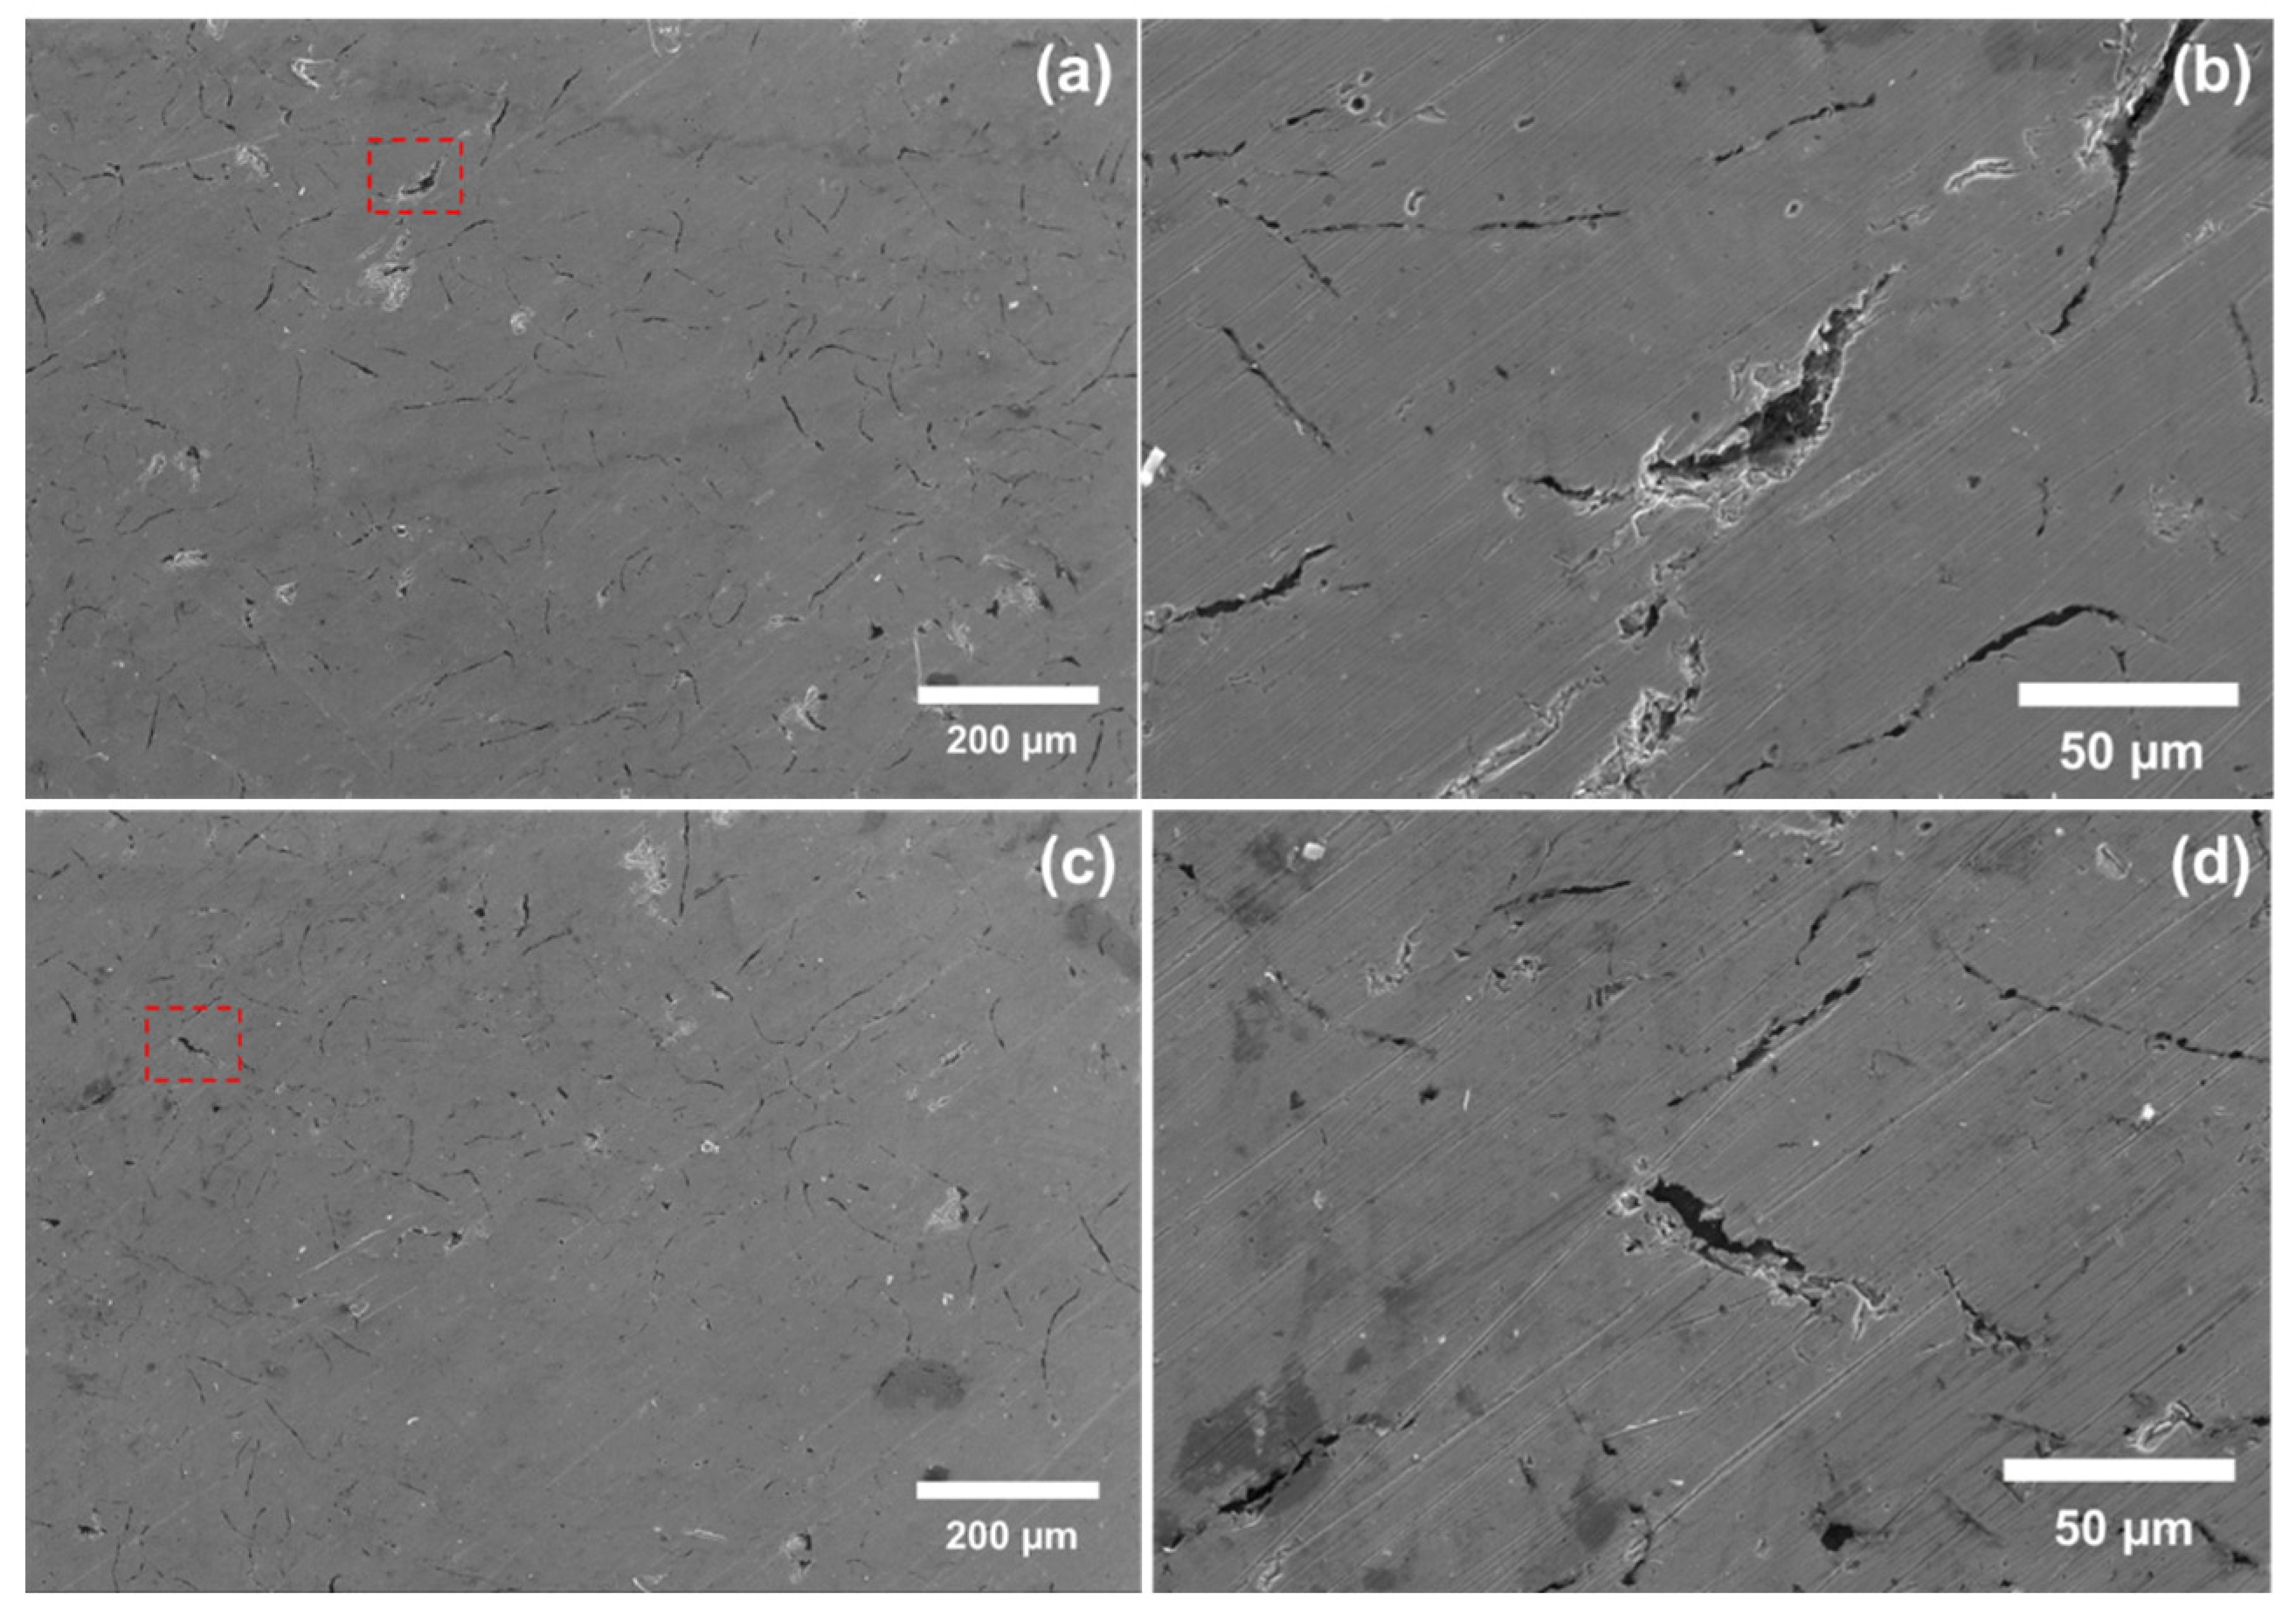
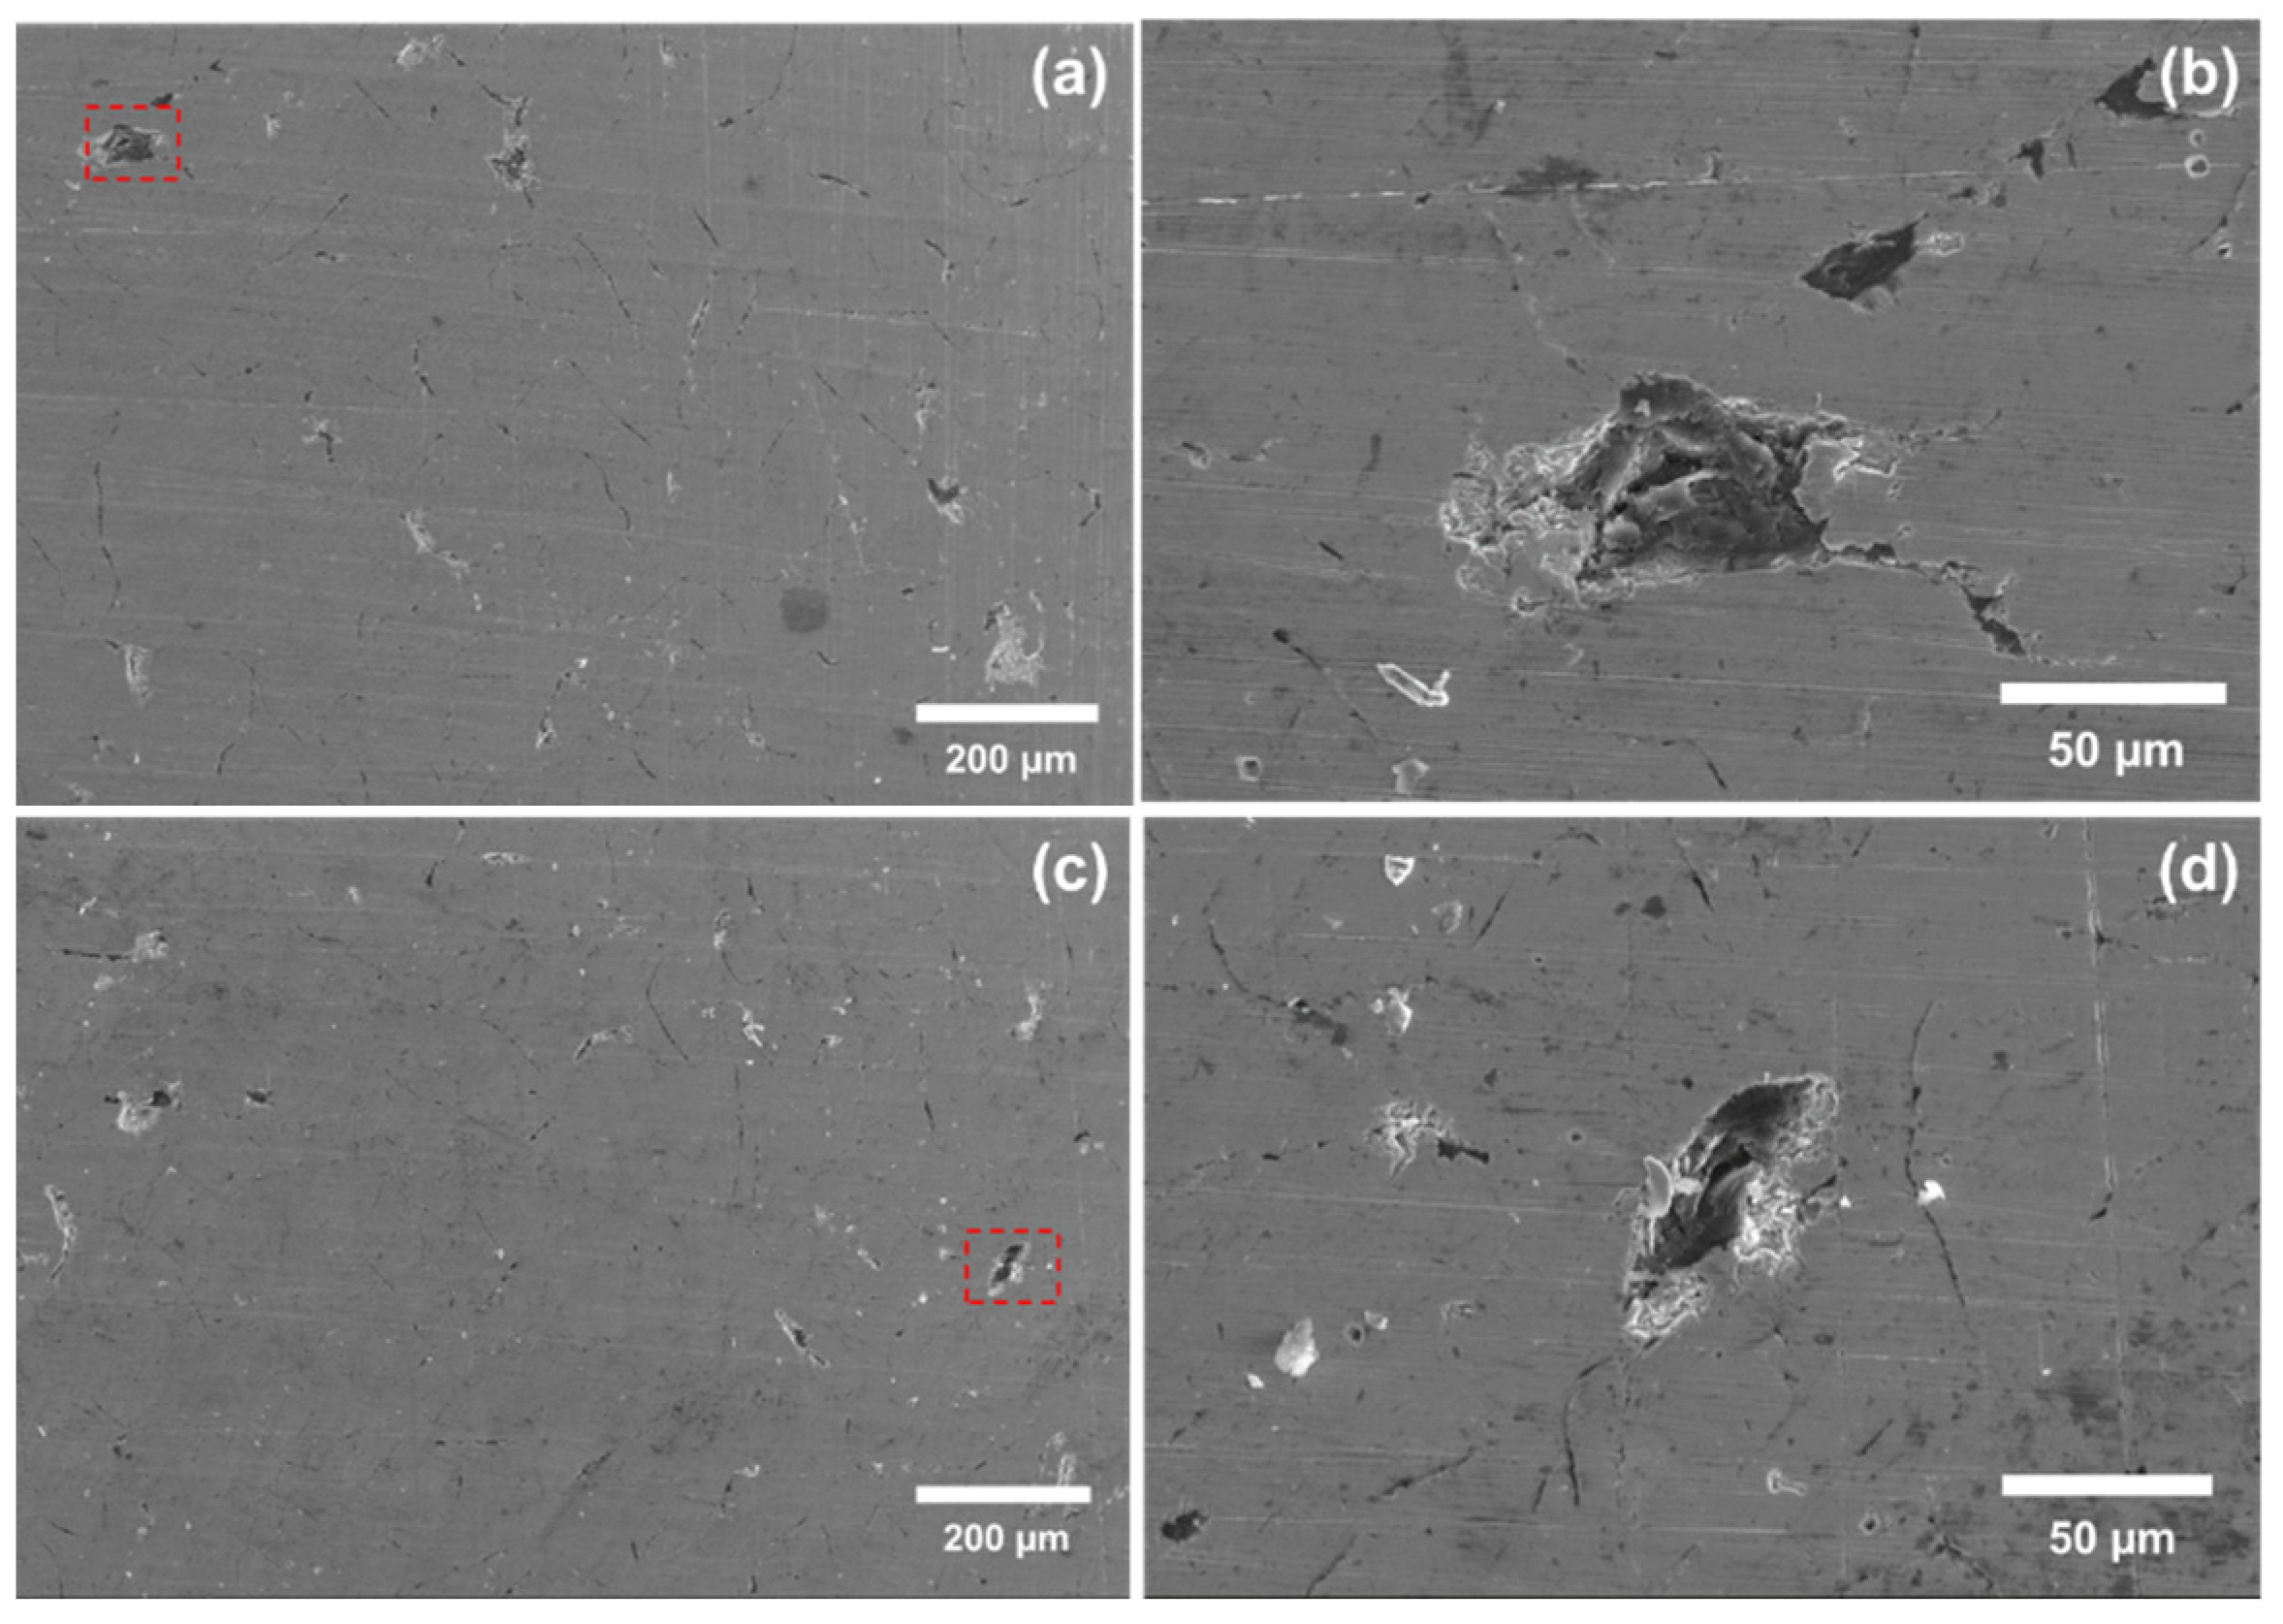
Cast iron samples exposed to 28 days in engine coolant containing 100 and 500 ppm chlorides were observed under scanning electron microscope (SEM). The samples exposed to 100 ppm chlorides showed lesser intensity of attack with shallower pit depths and lower number of pit density in a unit area as compared to those exposed to 500 ppm chlorides. Representative SEM micrographs of the cast iron sample surface exposed to 100 and 500 ppm chlorides are illustrated in Figure 7 and Figure 8, respectively. The localized corrosion attack initiated at the graphite flake boundaries with the pearlitic matrix and the profile of attack followed pattern of graphite flake. However, in the case of sample exposed to 500 ppm chlorides the severity of attack appeared to have resulted in a large coverage of the matrix beyond the confines of graphite flake morphology. In addition to this, the high magnification micrographs (see Figure 7b,d and Figure 8b,d depicted significant depth of attack/metal dissolution for samples exposed to 500 ppm chlorides as against shallower depth of attack for those exposed to 100 ppm chlorides.

3.4.2. FTIR and Zygo Analysis

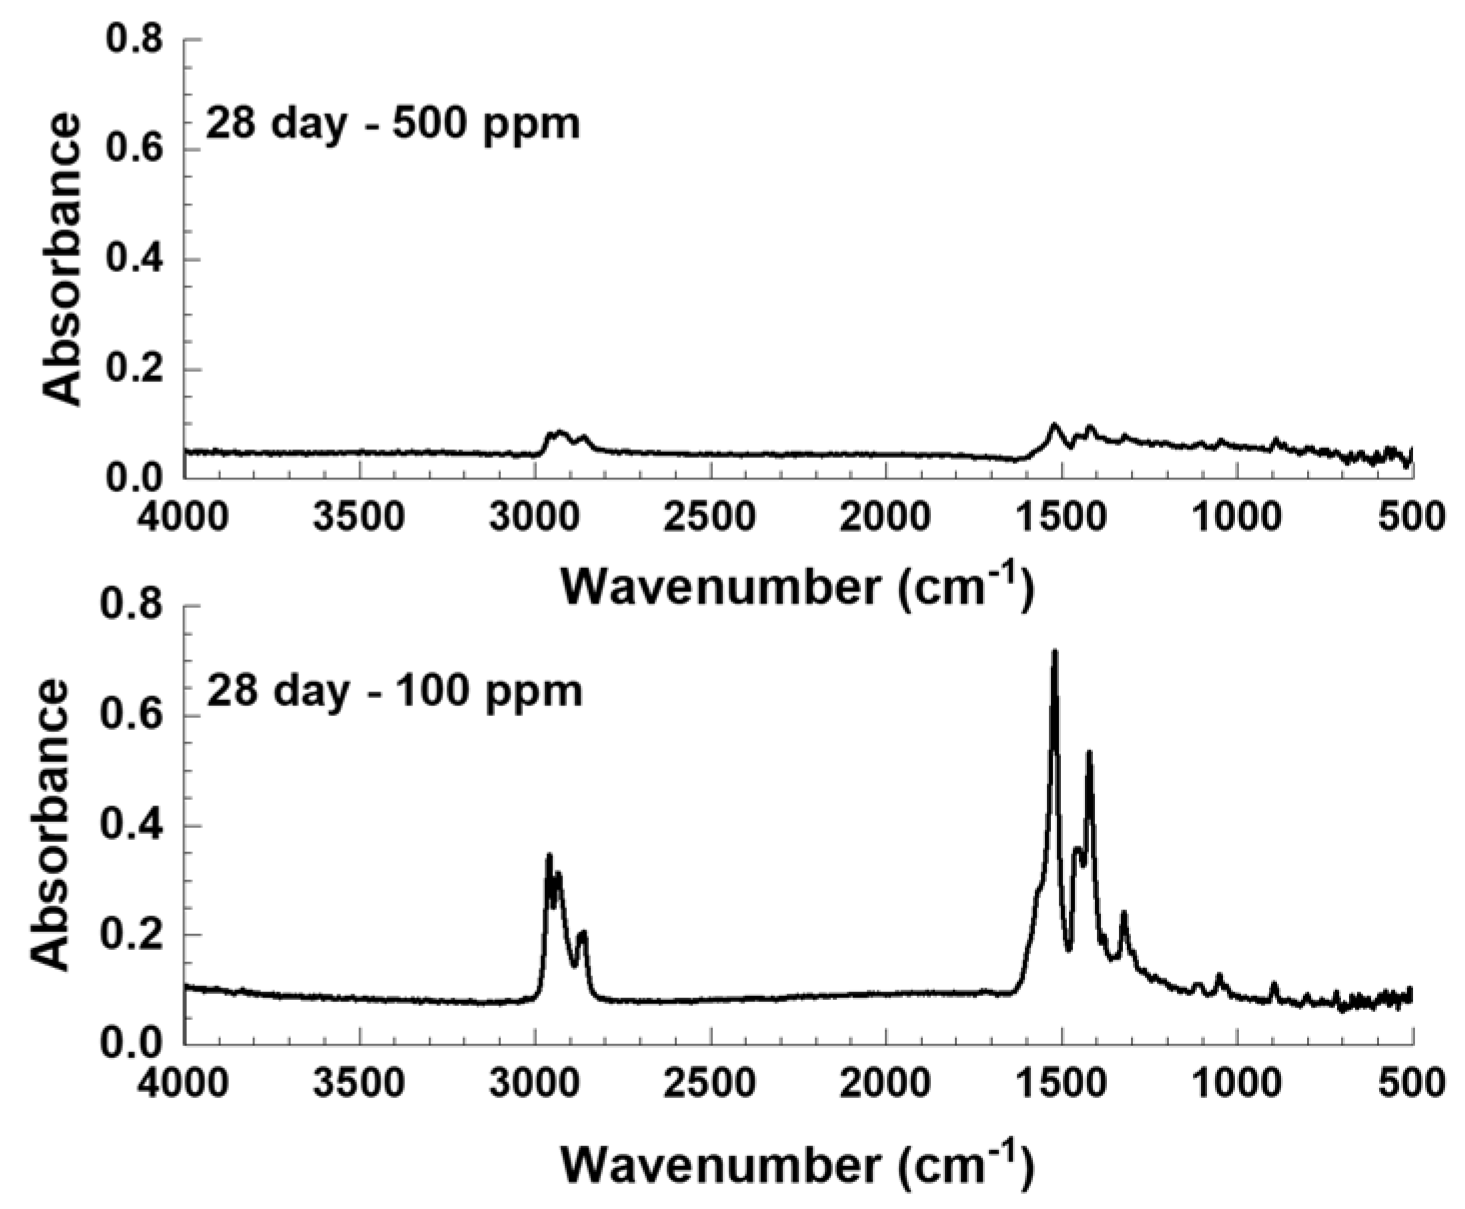
In the current work, two cast iron samples were selected for Fourier transforms infrared (FTIR) spectroscopic examination to understand the nature of the corrosion inhibition film formation. Figure 9 shows the FTIR absorbance profiles of 28 day cast iron samples exposed to engine coolants containing 100 and 500 ppm chlorides. The data were processed for baseline correction, atmospheric suppression, and smoothing algorithms were applied to the spectra using OMNIC Picta FTIR analysis software (version 9.8). These spectra clearly indicated the presence of a metal-carboxylate salt. Spectra collected from this region on each coupon were largely similar, with the key differentiator being a difference in peak height. The difference in the magnitude of the absorbance signal may be attributed to the differences in the thickness of the inhibition layer and possible differences in the reflective properties of deposited material. The peaks from 3000–2800 cm−1 in both regions indicate the presence of C–H bonds. Peaks at 1560 cm−1 are characteristic of antisymmetric stretching of bonds in the COO group found in a carboxylate, while peaks at 1450–1400 cm−1 are characteristic of the symmetric stretching of the bonds in the COO group. This data suggests the presence of a thinner protective carboxylate film on the sample exposed to 500 ppm chloride added coolant solution that does not inhibit chloride ingression.
To understand the nature and morphology of corrosion attack, further investigation was performed by surface profilometry of cast iron samples exposed to 100 and 500 ppm chloride solutions for the duration of 28 days. As indicated in Figure 10, the average depth of attack was almost 2.5 times higher for sample exposed to 500 ppm chloride (pit depth of ~6.6 µm) as compared to 100 ppm chloride which showed ~2.7 µm pit depth. It was also observed that the number density of corrosion attacks/pits were higher for 500 ppm chloride concentration.

4. Discussion

4.1. Evolution of Corrosion Behavior

The evolution of the inhibition mechanism of the organic additives in the engine coolant on cast iron samples can be understood in more detail by analyzing the anodic behavior of the polarization curves. A plot of the anodic current densities of various cast iron samples in different chloride concentrations with varying exposure times has been summarized in Figure 11. Current densities were measured at two potentials of +250 and +500 mV with respect to reference electrode Ag/AgCl. For all the cast iron sample conditions, it was observed that there were no major differences in the current densities when taken at +250 or +500 mV vs. Ag/AgCl. For 0 and 100 ppm chloride samples, the current densities for Day 0 samples were approx. one order higher in magnitude as compared to Day 1 exposed samples. This is also seen from the EIS plots in Figure 4 and Figure 5 where the non-constant immersion sample (day 0) showed lower low frequency impedance than that of the day 1 and day 7 samples for the 0 and 100 ppm chloride added coolant solutions. This is also seen in the summary plot where higher charge transfer resistance values (Figure 6) were seen at Day 1 compared to Day 0 for 0 and 100 ppm chloride samples. This indicates sluggish kinetics of the corrosion inhibitor package of the coolant where the coolant inhibitor package does not show immediate inhibition but takes up to 24 h to provide full protection up to 100 ppm chloride contamination. The current densities were found to increase or decrease marginally for Day 7 samples which then stayed nearly constant till Day 28 samples for the 0 ppm and the 100 ppm chloride samples. This indicates that the carboxylate protective layer once fully formed continues to protect the cast iron sample even at longer exposure times. The 100 ppm chloride contaminated sample shows slightly lower anodic corrosion densities at the end of day 7 and day 28 samples compared to that of 0 ppm sample indicating that the presence of chloride contamination assists in the formation of a robust protective film. On the other hand, for 200 and 500 ppm chloride samples, although the current densities initially decreased between Day 0 and Day 1 samples, a sharp and consistent increase in current densities were observed up to 28 days of immersion. This indicates that the carboxylate layer formed on the 200 and 500 ppm samples does not help with inhibition beyond 7 days of exposure time. Between 0 and 100 ppm and 200 and 500 ppm chloride samples for Day 28 exposure, nearly an order of magnitude difference in the current densities were observed. Pellet et al. [5] in their synergistic inhibition study on cast iron samples showed improvement in the anodic behavior of the polarization plots with a large passive range in ethylene glycol + corrosive water as specified in ASTM D 1384 [16]. It was interesting to note that the charge transfer resistance and double layer capacitance (see Figure 6b,c which represent the electrochemical parameters taken at the open circuit potential conditions also followed similar behavior as those by the anodic current densities (far away conditions than open circuit potentials) shown in Figure 11.

4.2. Inhibition Mechanism

Summary of electrochemical parameters as a function of chloride concentration has been presented in Figure 12. The charge transfer resistance as obtained from the EIS analysis is proportional to the inverse of corrosion rate and is shown in Figure 12a. Figure 12a also shows a secondary Y-axis which has the double layer capacitances plotted as a function of chloride concentration. The trends in corrosion rate for all the exposure time curves are very similar to the trends in double layer capacitance [17]. The threshold concentration for the chloride contamination from Figure 12a is about 100 ppm as the corrosion rates stay the lowest in spite of longer exposures at day 7 and day 28. Day 1 continues to show lower corrosion rates even at higher chloride concentrations indicating that shorter exposure times do not give the right threshold contamination values and inhibitors should be evaluated for their efficiency in the presence of contaminants as a function of time.
Figure 12b shows the stabilized current density during the anodic potentiostatic tests (extracted from Figure 3) on the Y-axis plotted as function of chloride concentration. The current density profile in Figure 12b as a function of chloride concentration is much similar to the profile seen in the day 28 corrosion rate in Figure 12a.
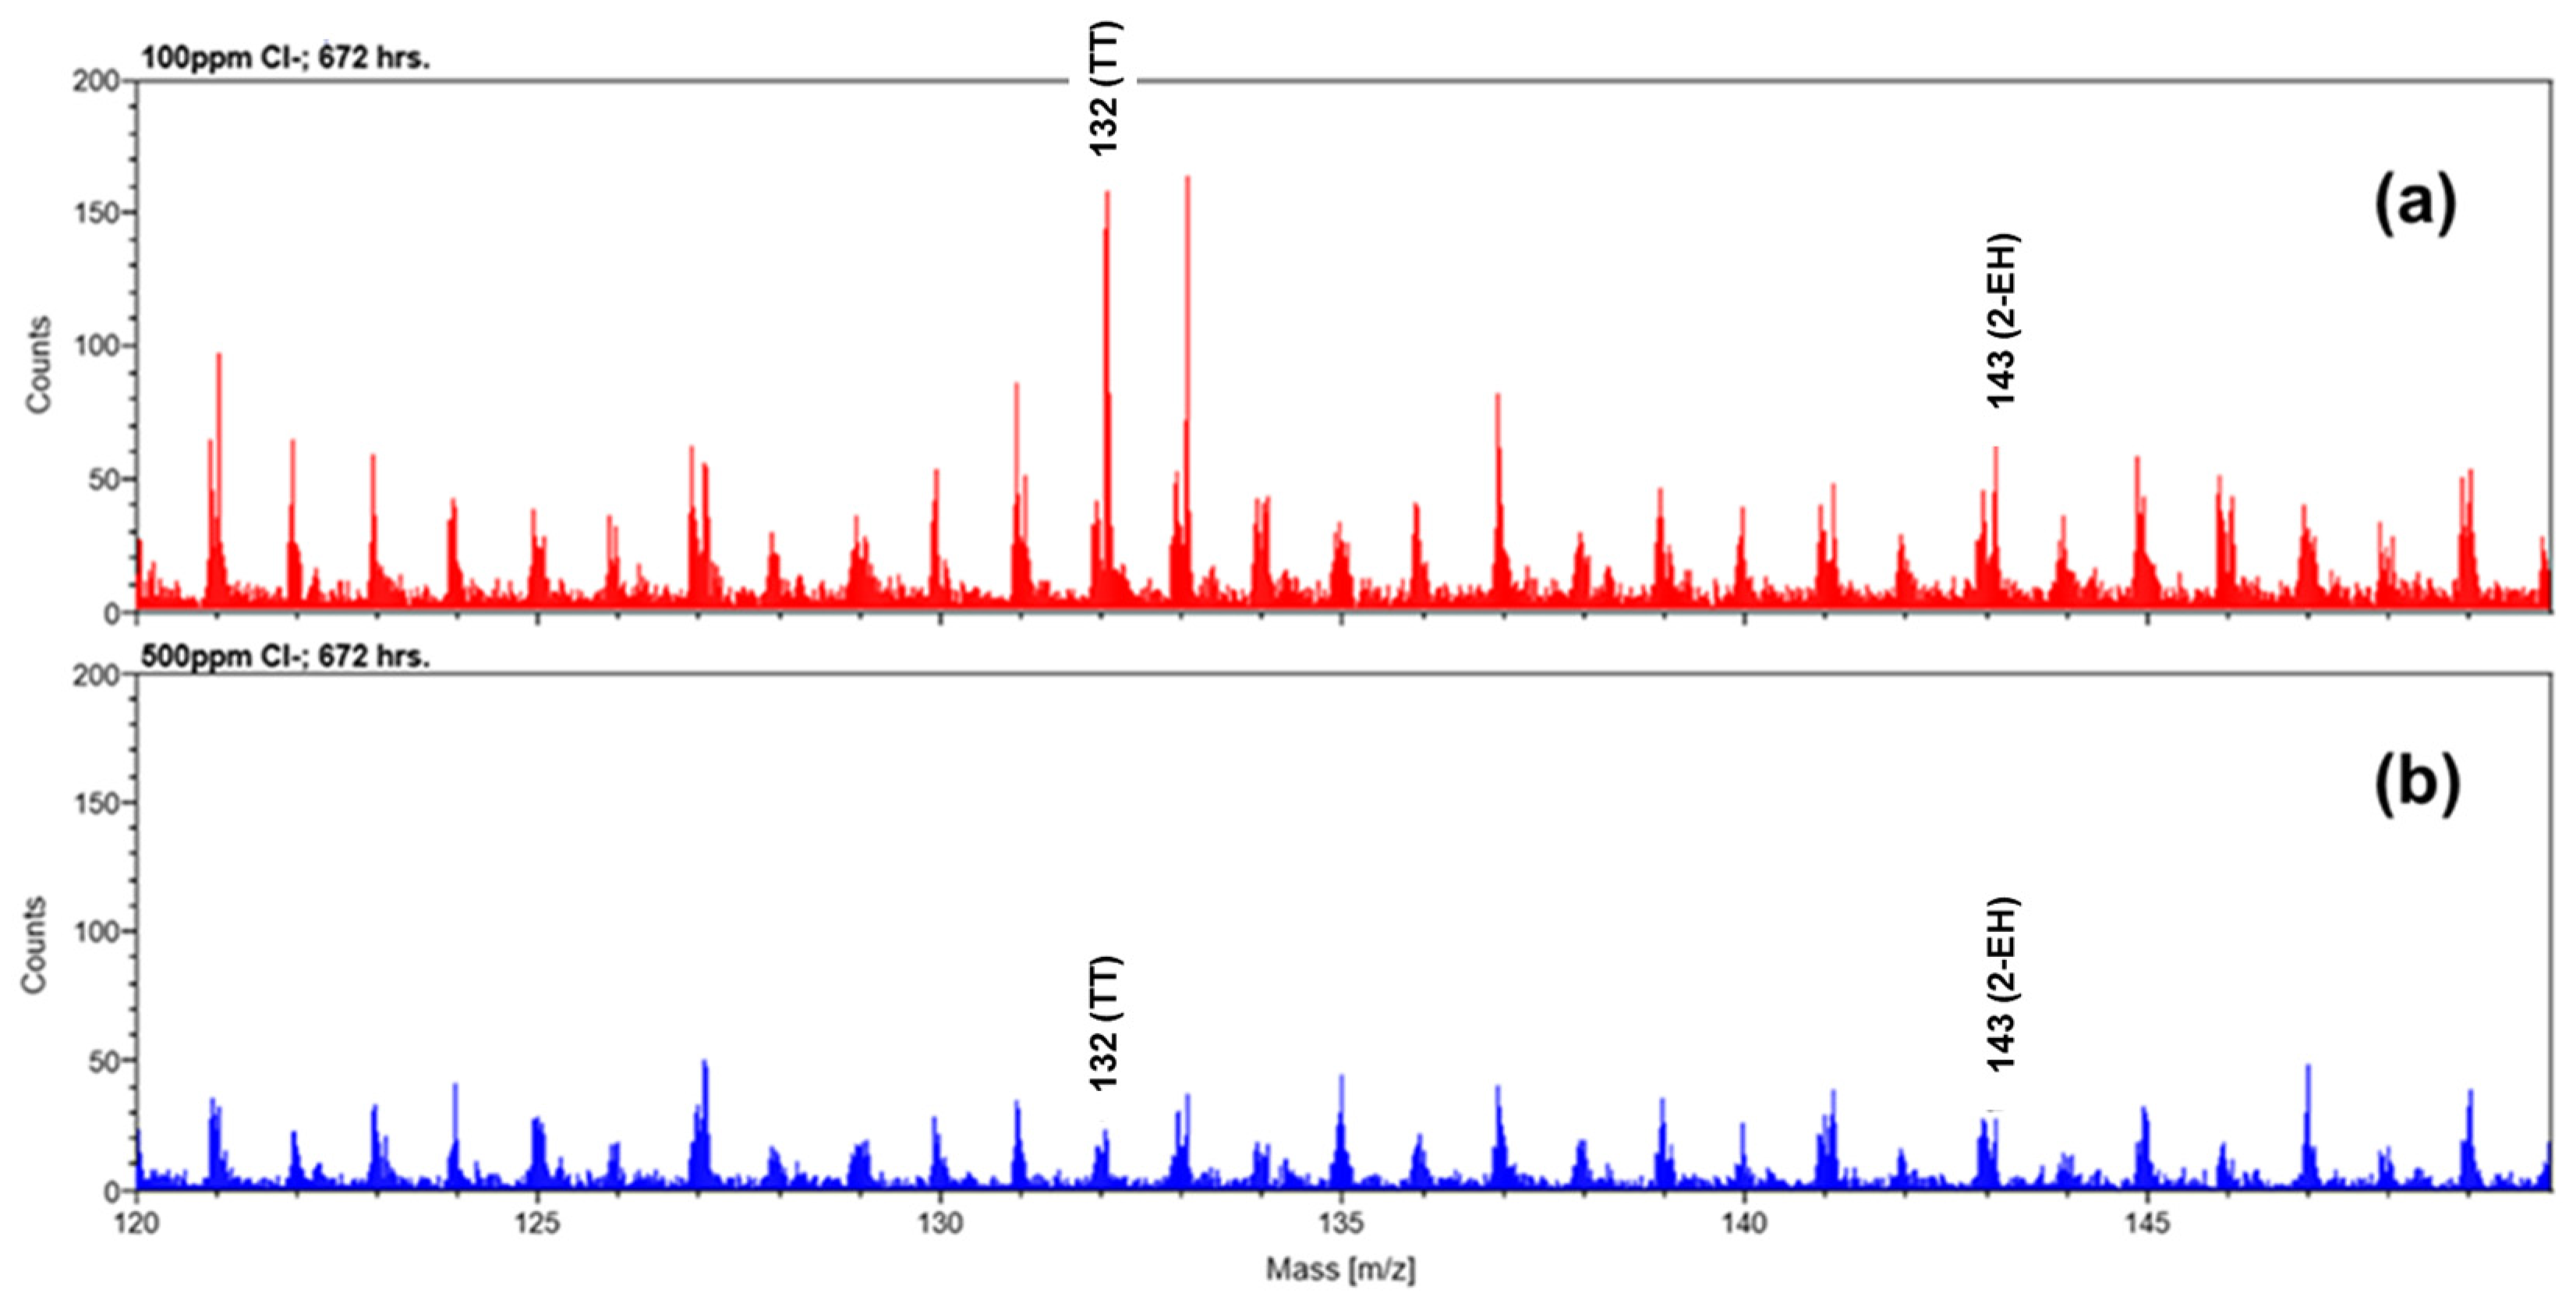
In the EIS analysis, it was observed that at lower frequencies the phase angle shifted to lower values for all the 28-day exposed cast iron samples (up to 500 ppm chloride added coolant exposed samples) indicating continued corrosion through the film. For the samples exposed to 200 and 500 ppm chlorides this lowering of phase angles was observed even in the initial days of exposure to engine coolant environment. As mentioned earlier, this was indicative of change in inhibition layer characteristics to a more leaky capacitive behavior. The low frequency phase angles for 0 and 100 ppm chloride added coolant exposed samples were higher than those of the 200 and 500 ppm at the end of 28 days of exposure. This can be attributed to the formation of a metal-chelate between substrate Fe ions and carboxylate additives in the engine coolant. There have been studies reported in the literature about formation of metal-chelate through chemisorption process between iron-based substrate material in presence of carboxylate as inhibitors [18,19,20,21,22,23,24]. The chain length of carboxylate has significant influence on the corrosion inhibition efficiency, and it was reported that chain length >4 leads to formation of insoluble Fe3+ ligands and enhances the corrosion resistance of iron-based substrates [24]. In the presence of TTA and chloride environment, iron-based substrate has been reported to show thermodynamic driving force to form corrosion protective layer through chemisorption process [22]. In addition to this, the characteristics of carboxylate additives in engine coolants from corrosion inhibition point of view particularly for the iron-based system is that these organic compounds tend to form ligands [5,7,24,25,26,27]. FTIR spectra shown in Figure 9 clearly indicated the presence of a film which is most likely a metal-carboxylate salt. TOF-SIMS has been employed on various alloy systems to understand the characteristics of inhibition/coating layer and the subsequent corrosion protection mechanism [28,29,30,31]. In the present study, for further confirmation of the corrosion inhibition mechanism, TOF-SIMS was conducted on cast iron coupons from 28 day exposure to high temperature coolant solution containing 100 ppm Cl and 500 ppm Cl. Figure 13a,b show negative ions secondary mass spectra for mass to charge ratios (m/z) between 120 to 150 mass range for 28 day exposed 100 and 500 ppm Cl, respectively. Evidence of corrosion inhibition was observed wherein two peaks as identified at 132 and 143 m/z corresponding to C7H6N3 (TTA) and C8H15O2−1 (2-EH), respectively were detected. Further it was observed, that cast iron coupon exposed to 100 ppm Cl demonstrated larger concentration of TTA and 2-EH (comparatively higher intensities) adsorbed on the surface as compared to that of 500 ppm Cl added coolant. FTIR and TOF-SIMS data paired with SEM-EDS spectra and the knowledge of the additive chemistry of the coolant the cast iron coupons were immersed in, gives us a high confidence that the film deposited is a metal carboxylate. The precise wave number associated with the antisymmetric COO stretching peak can be correlated to the identity of the metal cation. In this case we expect the primary cation to be Fe2+ since the coupon is cast iron. However, this peak is shifted slightly higher than 1560 cm−1 for the coupon immersed in the 100 ppm Cl containing coolant indicating that the carboxylate salts present in the pitted region of this coupon may also contain some of the other alloying elements from the base material. The formation of metal-chelate in presence of TTA and 2-EH in combination appeared to have influenced the corrosion inhibition of cast iron [32,33]. There is a formation of metal-complex chelate which gets adsorped on the surface to prevent interaction of corrosive species with the base metal. Note that the identification of which model is followed during this adsorption phenomenon is not in the scope of this current work. A free energy driven adsorption phenomenon has been reported for ferrous substrate in the presence of TTA [34]. In the present study, it was observed that the higher (>100 ppm) chloride concentration (i.e., the chemical potential of corrosion attack) in the engine coolants was found to cause corrosion activity in longer durations resulting in degradation of the coolant inhibition efficiency.
It is intuitive that, having higher inhibition thickness would result in enhanced corrosion inhibition efficiency and this was ascertained by both the SEM and surface profilometry results. The formation of metal-carboxylate chelate after initial hours of exposure and which remained intact prevented further corrosion of cast iron coupons when the chloride concentration was 100 ppm. The electrochemical characteristics of the inhibition layer formed on these cast iron samples resulted in thicker passive layer and resulted in significant corrosion resistance to localized corrosion. This inhibition layer was also found to have established an equilibrium with the inhibition package added in the coolant and sustained the corrosion inhibition capabilities for longer durations. On the other hand, the layer on cast iron samples exposed to 500 ppm chloride concentration showed dynamic changes in the thicknesses and thus resulted in loss of corrosion inhibition layer in longer duration. In the presence of higher chloride concentration, the metal-carboxylate chelates appeared to have been breached under higher chemical potential of chlorides which resulted in localized corrosion attack.

5. Conclusions

Threshold limits of chloride concentration in the engine coolants at 90 °C temperature were characterized using combination of long-term constant immersion tests followed by electrochemical measurements of alloyed cast iron. Coolant package consisting of sebacate (SA), 2-ethylhexanoate (2-EH), and tolyltriazole (TTA) displayed decrease in corrosion inhibition efficiency for chloride concentrations >100 ppm levels. Potentiodynamic polarization scans showed unstable passive layer for cast iron samples exposed to 200 and 500 ppm chloride concentrations. In addition to this, these cast irons samples during electrochemical impedance spectroscopy depicted change in the inhibition layer characteristics with a leaky capacitive behavior at lower frequencies. The surface analysis of the cast iron samples analyzed post exposure to engine coolants contaminated with chloride concentrations correlated with the formation of metal-carboxylate chelate which resulted in higher resistance to localized corrosion attack and showed shallower corrosion pit depths and lesser number density of corrosion attacks for cast iron samples exposed to 100 ppm as compared to 500 ppm chloride levels.

Author Contributions

Conceptualization, A.C. and G.A.; methodology, A.C.; software, M.V., J.S., J.D., and C.W.; validation, A.C., G.A., and J.P.; formal analysis, A.C., G.A., and J.P.; investigation, A.C., G.A., and J.P.; resources, J.S., J.D., and C.W.; data curation, A.C. and G.A.; writing—original draft preparation, G.A., A.C., and J.P.; writing—review and editing, A.C. and G.A.; visualization, C.T.; supervision, C.T.; project administration, C.T.; funding acquisition, C.T. All authors have read and agreed to the published version of the manuscript.

Funding

This research received no external funding.

Institutional Review Board Statement

Not Applicable.

Informed Consent Statement

Not applicable.

Acknowledgments

Authors would like to thank the Chemistry Laboratory team of Cummins Technical Center at Columbus, IN for helping with the preparation of engine coolants for this study.

Conflicts of Interest

The authors declare no conflict of interest.

References

  1. Pierce, D.; Haynes, A.; Hughes, J.; Graves, R.; Maziasz, P.; Muralidharan, G.; Shyam, A.; Wang, B.; England, R.; Daniel, C. High temperature materials for heavy duty diesel engines: Historical and future trends. Prog. Mater. Sci. 2019, 103, 109–179. [Google Scholar] [CrossRef]
  2. Reynaud, A. 3.02-Corrosion of cast irons. Shreir’s Corros. 2010, 3, 1737–1788. [Google Scholar]
  3. Hudgens, R.D. Comparison of conventional and organic acid technology (OAT) coolants in heavy duty diesel engine service. SAE Trans. 1999, 108, 82–91. [Google Scholar]
  4. Weir, T.W.; Ven, P.V. Review of organic acids as inhibitors in engine coolants. SAE Tech. Paper 1996, 37–47. [Google Scholar]
  5. Pellet, R.J.; Bartley, L.S.; Hunsicker, D.P. The role of carboxylate-based coolants in cast iron corrosion protection. SAE Trans. 2001, 110, 1342–1348. [Google Scholar]
  6. Darden, J.W.; Triebel, C.A.; Maes, J.P.; VanNeste, W. Monoacid/diacid combination as corrosion inhibitors in antifreeze formulations. SAE Trans. 1990, 99, 1664–1680. [Google Scholar]
  7. Maes, J.P.; VanNeste, W.A. Corrosion inhibited antifreeze formulations having monocarboxylic, triazole, and imidazole compounds. U.S. Patent 5,366,651, 22 November 1994. [Google Scholar]
  8. Yang, B.; Woyciesjes, P.; Gershun, A. Comparison of extended life coolant corrosion protection performance. SAE Tech. Paper 2017, 28. [Google Scholar] [CrossRef]
  9. Rajeshwari, V.; Kesavan, D.; Gopiraman, M.; Viswanathamurthi, P. Physicochemical studies of glucose, gellan gum, and hydroxypropyl cellulose - inhibition of cast iron corrosion. Carbohydr. Polym. 2013, 95, 288–294. [Google Scholar] [CrossRef]
  10. Vieira, D.E.L.; Sokol, D.; Smalenskaite, A.; Kareiva, A.; Ferreira, M.G.S.; Vieira, J.M.; Salak, A.N. Cast iron corrosion protection with chemically modified Mg-Al layered double hydroxides synthesized using a novel approach. Surf. Coat. Technol. 2019, 375, 158–163. [Google Scholar] [CrossRef]
  11. Finsgar, M.; Petovar, B.; Xhanari, K.; Maver, U. The corrosion inhibition of certain azoles on steel in chloride media: Electrochemistry and surface analysis. Corros. Sci. 2016, 111, 370–381. [Google Scholar] [CrossRef]
  12. Sahin, M.; Bilgic, S.; Yilmaz, H. The inhibition effects of some cyclic nitrogen compounds on the corrosion of the steel in NaCl mediums. Appl. Surf. Sci. 2002, 195, 1–7. [Google Scholar] [CrossRef]
  13. Hudgens, R.D.; Hercamp, R.D. A perspective on extended service intervals and long-life coolants for heavy duty engines. SAE Trans. 1996, 105, 1877–1887. [Google Scholar]
  14. Santambrogio, M.; Perrucci, G.; Trueba, M.; Trasatti, S.P.; Casaletto, M.P. Effect of major degradation products of ethylene glycol aqueous solutions on steel corrosion. Electrochim. Acta 2016, 203, 439–450. [Google Scholar] [CrossRef]
  15. ASTM A247-19. Standard Test Method for Evaluating the Microstructure of Graphite in Iron Castings; ASTM International: West Conshohocken, PA, USA, 2019. [Google Scholar] [CrossRef]
  16. ASTM D1384-05. Standard Test Method for Corrosion Test for Engine Coolants in Glassware; ASTM International: West Conshohocken, PA, USA, 2019. [Google Scholar] [CrossRef]
  17. Chilukuri, A. Corrosion Inhibition by Inorganic Cationic Inhibitors on the High Strength Aluminum Alloy. Ph.D Thesis, The Ohio State University, Columbus, OH, USA, 2012. Available online: https://etd.ohiolink.edu/apexprod/rws_etd/send_file/send?accession=osu1343784869&disposition=inline (accessed on 21 March 2021).
  18. Rammelt, U.; Koehler, S.; Reinhard, G. Electrochemical characterisation of the ability of dicarboxylic acid salts to the corrosion inhibition of mild steel in aqueous solutions. Corros. Sci. 2011, 53, 3515–3520. [Google Scholar] [CrossRef]
  19. Somers, A.; Hinton, B.R.W.; Bruin-Dickason, C.D.; Deacon, G.B. New, environmentally friendly, rare earth carboxylate corrosion inhibitors for mild steel. Corros. Sci. 2018, 139, 430–437. [Google Scholar] [CrossRef]
  20. Valek, L.; Martinez, S.; Rnardić, I.; Mikulić, D. The inhibition activity of ascorbic acid towards corrosion of steel in alkaline media containing chloride ions. Corros. Sci. 2008, 50, 2705–2709. [Google Scholar] [CrossRef]
  21. Lebrini, M.; Fontaine, G.; Gengembre, L.; Traisnel, M. Corrosion protection of galvanized steel and electroplating steel by decanoïc acid in aqueous solution: Electrochemical impedance spectroscopy, XPS and ATR-FTIR. Corros. Sci. 2009, 51, 1201–1206. [Google Scholar] [CrossRef]
  22. Deng, Q.; Ding, N.; Wei, X.; Cai, L.; He, X.; Long, Y.; Chen, G.; Chen, K. Identification of diverse 1,2,3-triazole connected benzyl glycoside-serine/threonine conjugates as potent corrosion inhibitors for mild steel in HCl. Corros. Sci. 2012, 64, 64–73. [Google Scholar] [CrossRef]
  23. Rammelt, U.; Koehler, S.; Reinhard, G. Synergistic effect of benzoate and benzotriazole on passivation of mild steel. Corros. Sci. 2008, 50, 1659–1663. [Google Scholar] [CrossRef]
  24. Rammelt, U.; Koehler, S.; Reinhard, G. EIS characterization of the inhibition of mild steel corrosion with carboxylates in neutral aqueous solution. Electrochim. Acta 2008, 53, 6968–6972. [Google Scholar] [CrossRef]
  25. Mercer, W.C. An investigation of carboxylic acids as corrosion inhibitors in engine coolant. ASTM STP 1993, 3, 44–62. [Google Scholar]
  26. Butler, G.; Mercer, A.D. Inhibitor formulations for engine coolants. Br. Corros. J. 1977, 12, 171–174. [Google Scholar] [CrossRef]
  27. Petrunin, M.; Maksaeva, L.; Gladkikh, N.; Makarychev, Y.; Maleeva, M.; Yurasova, T.; Nazarov, A. Thin benzotriazole films for inhibition of carbon steel corrosion in neutral electrolytes. Coatings 2020, 10, 362. [Google Scholar] [CrossRef] [Green Version]
  28. Finšgar, M. Electrochemical, 3D topography, XPS, and ToF-SIMS analyses of 4-methyl-2-phenylimidazole as a corrosion inhibitor for brass. Corrs. Sci. 2020, 169, 108362. [Google Scholar] [CrossRef]
  29. Coelho, L.B.; Cossement, D.; Olivier, M.G. Benzotriazole and cerium chloride as corrosion inhibitors for AA2024-T3: An EIS investigation supported by SVET and ToF-SIMS analysis. Corrs. Sci. 2018, 130, 177–189. [Google Scholar] [CrossRef]
  30. Chauhan, D.S.; Quraishi, M.A.; Carriere, C.; Seyeux, A.; Marcus, P.; Singh, A. Electrochemical, ToF-SIMS and computational studies of 4-amino-5-methyl-4H-1,2,4-triazole-3-thiol as a novel corrosion inhibitor for copper in 3.5% NaCl. J. Mol. Liq. 2019, 289, 111113. [Google Scholar] [CrossRef]
  31. Esmaily, M.; Malmberg, P.; Shahabi-Navid, M.; Svensson, J.E.; Johansson, L.G. A ToF-SIMS investigation of the corrosion behavior of Mg alloy AM50 in atmospheric environments. Appl. Surf. Sci. 2016, 360, 98–106. [Google Scholar] [CrossRef] [Green Version]
  32. Argade, G.R.; Chilukuri, A.; Perry, J.; Trobaugh, C.; Schafer, R.; Raisor, E.; Steenhoek, J.; Lugo, G.P. An investigation of cast iron corrosion behavior in chloride containing engine coolant environment. Mater. Sci. Technol. 2019, 737–741. [Google Scholar] [CrossRef]
  33. Chilukuri, A.; Argade, G.R.; Perry, J.; Trobaugh, C.; Schafer, R.; Raisor, E.; Steenhoek, J.; Lugo, G.P. A corrosion study of light metal cylinder head material in chloride containing engine coolant environment. Mater. Sci. Technol. 2019, 1255–1259. [Google Scholar] [CrossRef]
  34. Yan, Y.; Shi, H.; Wang, J.; Liu, F.; Han, E. Corrosion inhibition of galvanized steel in NaCl solution by tolytriazole. Acta Metall. Sin. 2019, 32, 471–480. [Google Scholar] [CrossRef] [Green Version]
Figure 1. Optical microstructures of the cast iron material are shown in (a) depicting typical Type A graphite morphology with predominantly pearlitic matrix. High magnification microstructure shown in (b) confirmed fine pearlitic matrix.
Coatings 11 00357 g001
Figure 2. Polarization plots of cast iron in (a) 0 ppm, (b) 100 ppm, (c) 200 ppm, and (d) 500 ppm chloride containing coolants and different exposure times. Non-constant immersion sample scan (day 0 sample) was performed after ~30 min of exposure to respective chloride concentration.
Coatings 11 00357 g002
Figure 3. Current density vs. time profiles for cast iron in varying chloride concentrations during potentiostatic polarization of +250 mV vs. OCP.
Coatings 11 00357 g003
Figure 4. Bode plots of cast iron samples after different constant exposure to engine coolant environment containing (a) 0 ppm Cl, (b) 100 ppm Cl, (c) 200 ppm Cl, and (d) 500 ppm Cl. Solid lines are absolute Z profiles and dotted lines are the respective phase angle profiles of each conditions. Non-constant immersion sample scan was performed after ~30 min of exposure to respective chloride concentration.
Coatings 11 00357 g004
Figure 5. Nyquist plots of cast iron samples after different constant exposure to engine coolant environment containing (a) 0 ppm Cl (b) 100 ppm Cl (c) 200 ppm Cl and (d) 500 ppm Cl. Non-constant immersion sample scan was performed after ~30 min of exposure to respective chloride concentration.
Coatings 11 00357 g005
Figure 6. Equivalent circuit employed to fit the EIS data is shown in (a) and the trends of electrochemical parameters; charge transfer resistance and double layer capacitance are presented in (b,c), respectively.
Coatings 11 00357 g006
Figure 7. SEM micrographs of cast iron sample exposed to engine coolant containing 100 ppm chloride for 28 days are shown in (a) through (d). (Note: (b,d) illustrates high magnification SEM micrographs of highlighted regions in (a,c), respectively).
Coatings 11 00357 g007
Figure 8. SEM micrographs of cast iron sample exposed to engine coolant containing 500 ppm chloride for 28 days are shown in (a) through (d). (Note: (b,d) illustrates high magnification SEM micrographs of highlighted regions in (a,c), respectively).
Coatings 11 00357 g008
Figure 9. FTIR profiles of the cast iron samples exposed to 100 and 500 ppm chlorides containing engine coolants for 28 days.
Coatings 11 00357 g009
Figure 10. White light interferometry performed for pit depth analysis on the cast iron samples exposed to (a) 100 ppm and (b) 500 ppm chloride containing engine coolants for constant immersion up to 28 days (avg. pit depth 100 ppm–2.73 µm and 500 ppm–6.60 µm).
Coatings 11 00357 g010
Figure 11. Current density profiles taken at 250 and 500 mV vs. Ag/AgCl as a function of chloride concentrations and exposure days in engine coolants.
Coatings 11 00357 g011
Figure 12. Corrosion rate parameter and double layer capacitance as calculated from EIS tests are shown in (a) and potential values obtained from OCP vs. time profile and a stable current density as observed during potentiostatic tests are shown in (b); both presented as a function of chloride concentration for cast iron samples with varying exposure times. (Note: Dotted lines in (a) are respective double layer capacitances of 0, 100, 200, and 500 ppm chlorides. Also, green line is stabilized current density from Figure 3 of 0, 100, 200, and 500 ppm chlorides.)
Coatings 11 00357 g012
Figure 13. Negative Ion Secondary Mass Spectra Detected by TOF-SIMS for 120–150 m/z on the samples—(a) 100 ppm chloride solution sample exposed to 28 days (b) 500 ppm chloride solution sample exposed to 28 days.
Coatings 11 00357 g013
Table 1. Nominal chemistry and tensile strength of the cast iron material under investigation.
Nominal Chemistry CSiMnSPCr + Mo + Cu + NiNb + Ti + VCarbon Equivalent (C.E.)
Weight %3.0–3.51.5–2.5Max. 1.0Max. 0.20Max. 0.15Max. 2.5Max. 0.025Max. 4.25
UTS (MPa)Min. 295
Table 2. List of inhibitor additives in the engine coolants used in this study.
Chemical NameAbbreviationChemical FormulaStructural Notification
SebacateSAC10H16O4−2 Coatings 11 00357 i001
2-Ethylhexanoate2-EHC8H15O2−1 Coatings 11 00357 i002
TolyltriazoleTTAC7H7N3 Coatings 11 00357 i003
Table 3. Summary of polarization results on cast iron samples in engine coolant environment.
TitleExposure TimeEcorr
mV vs. Ag/AgCl
icorr
µA/cm2
Ebreakdown
mV vs. Ag/AgCl
0 ppm ClDay 1−75.63.2831.9
Day 7−101.91.7782.7
Day 28−84.93.6730.0
100 ppm ClDay 1−72.24.4854.8
Day 7−72.21.6798.8
Day 283.405.5844.7
200 ppm ClDay 1−114.62.2830.2
Day 7−65.43.6878.3
Day 28−200.12.9875.4
500 ppm ClDay 1−91.74.1818.3
Day 7−52.64.7703.7
Day 28−180.43.0870.6
Table 4. Summary of electrochemical parameters extracted from EIS analysis of cast iron samples post exposure to various engine coolant environment.
Exposure TimeCl Concentration (ppm)Charge Transfer Resistance
Rct
(Ω·cm2)
Constant Phase Element
CPEdl-T
(F cm−2 s−n)
Constant Phase Element
CPEdl-P
(n)
Double Layer CaPacitance
Cdl
(F·cm−2)
Day 10208,9301.60 × 10−40.862.83 × 10−4
1004,653,0004.0 × 10−50.897.6 × 10−5
2001,115,3009.27 × 10−50.881.74 × 10−4
50041,0632.2 × 10−40.853.24 × 10−4
Day 70233,5101.60 × 10−40.92.39 × 10−4
100711,7301.0 × 10−40.911.52 × 10−4
20027,2543.4 × 10−40.845.2 × 10−4
50044954.0 × 10−40.874.37 × 10−4
Day 280323,3502.2 × 10−40.759.12 × 10−4
100163,2501.60 × 10−40.862.72 × 10−4
20040781.0 × 10−30.781.49 × 10−3
50034661.2 × 10−30.781.79 × 10−3
Publisher’s Note: MDPI stays neutral with regard to jurisdictional claims in published maps and institutional affiliations.