Article

Superlow Friction of a-C:H Coatings in Vacuum: Passivation Regimes and Structural Characterization of the Sliding Interfaces

by
Takuya Kuwahara
1,
Yun Long
2,
Maria-Isabel De Barros Bouchet
2,
Jean Michel Martin
2,
Gianpietro Moras
1 and
Michael Moseler
1,3,4,5,*
1
MicroTribology Center μTC, Fraunhofer Institute for Mechanics of Materials IWM, Wöhlerstraße 11, 79108 Freiburg im Breisgau, Germany
2
Laboratory of Tribology and System Dynamics, Ecole Centrale de Lyon, University of Lyon, CNRS UMR5513, 69134 Lyon, France
3
Cluster of Excellence LivMatS, Freiburg Center for Interactive Materials and Bioinspired Technologies, University of Freiburg, Georges-Köhler-Allee 105, 79110 Freiburg im Breisgau, Germany
4
Institute of Physics, University of Freiburg, Hermann-Herder-Straße 3, 79104 Freiburg im Breisgau, Germany
5
Freiburg Materials Research Center, University of Freiburg, Stefan-Meier-Straße 21, 79104 Freiburg im Breisgau, Germany
*
Author to whom correspondence should be addressed.
Coatings 2021, 11(9), 1069; https://doi.org/10.3390/coatings11091069
Submission received: 10 August 2021 / Revised: 31 August 2021 / Accepted: 2 September 2021 / Published: 4 September 2021
(This article belongs to the Special Issue Tribology and Mechanical Behavior of Amorphous Carbon Coatings)

Abstract

:
A combination of atomistic simulations and vacuum tribometry allows atomic-scale insights into the chemical structure of superlubricious hydrogenated diamond-like carbon (a-C:H) interfaces in vacuum. Quantum molecular dynamics shearing simulations provide a structure-property map of the friction regimes that characterize the dry sliding of a-C:H. Shear stresses and structural properties at the sliding interfaces are crucially determined by the hydrogen content C H in the shear zone of the a-C:H coating. Extremely small C H   (below 3 at.%) cause cold welding, mechanical mixing and high friction. At intermediate C H (ranging approximately from 3 to 20 at.%), cold welding in combination with mechanical mixing remains the dominant sliding mode, but some a-C:H samples undergo aromatization, resulting in a superlubricious sliding interface. A further increase in C H (above 20 at.%) prevents cold welding completely and changes the superlubricity mechanism from aromatic to hydrogen passivation. The hydrogen-passivated surfaces are composed of short hydrocarbon chains hinting at a tribo-induced oligomerization reaction. In the absence of cold welding, friction strongly correlates with nanoscale roughness, measured by the overlap of colliding protrusions at the sliding interface. Finally, the atomistic friction map is related to reciprocating friction experiments in ultrahigh vacuum. Accompanying X-ray photoelectron and Auger electron spectroscopy (XPS, XAES) analyses elucidate structural changes during vacuum sliding of a hydrogen-rich a-C:H with 36 at.% hydrogen. Initially, the a-C:H is covered by a nanometer-thick hydrogen-depleted surface layer. After a short running-in phase that results in hydrogen accumulation, superlubricity is established. XPS and XAES indicate a non-aromatic 1–2-nm-thick surface layer with polyethylene-like composition in agreement with our simulations.

1. Introduction

Friction reduction in mechanical contacts is essential for improving energy efficiency and saving resources [1]. The extraordinary thermal, chemical, and mechanical properties of diamond-like amorphous carbon (DLC) coatings make them suitable materials for tribological applications, such as camshafts, piston rings, and valves in automotive engines [2]. DLC coatings are classified as amorphous carbon (a-C), tetrahedral amorphous carbon (ta-C), and hydrogenated amorphous carbon (a-C:H) according to the hydrogen content and sp2/sp3 ratio [3,4]. Hydrogenated amorphous carbon is one of the most technologically relevant classes of DLC coatings. A striking tribological feature of a-C:Hs is superlubricity (friction coefficient μ < 0.01) in ultrahigh vacuum (UHV) and dry gas environments without any lubricating oils. Erdemir et al. reported a deposition recipe for synthesizing near-frictionless a-C:H coatings [5]. UHV friction tests by Donnet et al. [6] showed that hydrogen-rich a-C:H (with a hydrogen content CH of 40 at.%) reaches a stable superlubricity state (μ = 0.003), whereas a decrease in the hydrogen content (CH = 34 at.%) causes a rise in the friction coefficient (μ = 0.6) and severe wear. Unfortunately, in this case, because of hydrogen depletion, superlubricity of a-C:H in vacuum does not last for a long time compared to MoS2 coatings, which, however, do not show superlubricity if not stoichiometric. Interestingly, superlubricity of a-C:H with lower hydrogen content is achieved by the introduction of hydrogen gas into the contact area [6].
These experimental observations suggest that passivation of surface carbon dangling bonds with hydrogen atoms plays an important role in a-C:H’s superlubricity. Asperity collisions create reactive dangling bonds on the surface by removal of passivating CxHy fragments, but H2 molecules can undergo dissociative chemisorption and repassivate the surface dangling bonds. The tribological behavior is determined by the competition between de- and repassivation processes, i.e., by the amount of hydrogen molecules inside the contact area. Erdemir [7] suggested that electrostatic repulsive interactions between positively charged hydrogen atoms are responsible for the superlow friction in a-C:H. However, a recent theoretical study by Reichenbach et al. [8] revealed that electrostatic interactions play a minor role and instead contact potential energy corrugation due to Pauli repulsion determines the friction coefficient.
Surface graphitization represents an alternative superlubricity mechanism on a-C:H surfaces. State-of-the-art friction experiments of a-C:H (with 39 at.% H) in N2 dry atmosphere by Chen et al. [9] showed hydrogen depletion and formation of sp2-hybridized graphitic structures within a 3-nm-thick topmost surface layer. They reported that superlubricity is achieved at two different Hertzian contact pressures and caused by the formation of two different interfacial nanostructures. At contact pressures below 1 GPa, the a-C:H stays hydrogen-rich, even within the top 3 nm of the coating. An increase in the contact pressure to 1.2 GPa triggers a hydrogen depletion in the 3-nm-thick topmost layer and a phase transition from an sp3-rich a-C:H to an sp2-rich H-depleted lamellar phase. Analogous, tribologically-induced sp3-to-sp2 transitions were observed in our previous atomistic simulations, revealing shear-induced aromatic surface reconstructions on diamond (111) surfaces lubricated with water [10,11] and ta-C surfaces lubricated with glycerol [12]. The delocalization of π-electrons on the graphenoid surfaces makes them chemically inert and, thus, shields them from cold welding, even at high contact pressures [10,13].
In this article, quantum molecular dynamics simulations are performed to further elucidate friction mechanisms and structural changes in a-C:H under vacuum sliding conditions. Our simulations show that friction of a-C:H is strongly influenced by the hydrogen content. Plotting the steady-state shear stresses as a function of C H provides a map that allows to distinguish various friction regimes. At C H below about 3 at.%, a-C:H surfaces cold weld, and mechanical mixing leads to high friction. At C H ranging from 3 to 20 at.%, a-C:H surfaces are still likely to cold weld but can occasionally undergo aromatization. In the latter case, the formation of highly aromatic mono- or bi-layer graphenoid structures leads to superlow friction. When the hydrogen content is above approximately 20 at.%, hydrogen passivation of the sliding interfaces becomes dominant, and no cold welding occurs. We suggest a simple geometrical overlap model that explains friction variations of hydrogen-passivated surfaces by a nanoscale roughness parameter. The larger the atomic-scale overlaps between asperities of two sliding surfaces, the larger the friction coefficient. Moreover, we find that shear induces oligomerization of hydrocarbon fragments at the a-C:H sliding interface. As a result, the top layer of hydrogen-passivated surfaces consists of hydrocarbon chains with C–H and C–H2 groups.
In accompanying experiments, the chemical structure of an a-C:H surface is examined using X-ray photoelectron spectroscopy (XPS) and X-ray excited Auger electron spectroscopy (XAES). C1s XPS and first-derivative C KLL XAES spectra show that a nanolayer on top of a pristine a-C:H surface contains less hydrogen than the a-C:H bulk region. Upon sliding, this hydrogen-depleted a-C-like layer is mechanically transformed, and a superlubricious hydrogen-rich layer forms. While no fingerprints of aromatic rings are detected, the first-derivative XAES spectra indicate the presence of polyethylene-like oligomeric structures in the topmost 1–2 nm region, which is consistent with our simulations. Therefore, this study unveils that a-C:H’s superlubricity is due to either aromatization or hydrogen passivation and can be controlled by tuning the local hydrogen content and, thus, interfacial mechanochemistry. In particular, we propose a new picture for hydrogen-passivation of a-C:H surfaces due to shear-induced phase transition of the topmost a-C:H layer, resulting in oligomeric hydrocarbon structures.

2. Methods

2.1. Computational Details

The frictional behavior of a-C:H is studied using the self-consistent-charge density-functional tight-binding molecular dynamics (SCC-DFTB MD) method [14] as implemented in the Atomistica software suite [15]. Random atomic configurations containing a total of 216 carbon and hydrogen atoms and different amounts of hydrogen ( 0.0 C H 40.7 at.%) are initially prepared in a simulation box with size 11.25 × 11.25 × 11.25 Å3 (corresponding to densities between 1.9 and 3.0 g cm−3), where periodic boundary conditions are applied along the three Cartesian directions. All a-C:H samples are generated by quenching a melt from 5000 to 0 K at a constant rate of 0.1 K fs−1. Subsequent DFTB MD shearing simulations of a-C:H bulks are carried out for 1 ns with Lees-Edwards boundary conditions [16], which are often employed in non-equilibrium MD simulations to generate a simple shear flow in a representative volume element (see an example of the simulation model in Figure 1a). The system temperature T is kept constant at 300 K using a Peters thermostat [17], and the equations of motion are integrated with a time step Δ t = 0.5 fs using the velocity Verlet algorithm [18]. The system pressure P is kept at 5 GPa for all three directions using a Berendsen barostat [19]. We note that the choice of the barostat, with its intrinsic limitations [20], plays a minor role in the interfacial phenomena reported in this article. Indeed, a similar superlubricity interface was observed for SCC-DFTB MD simulations of ta-C lubricated with glycerol using a different pressure-coupling algorithm [12]. The systems are sheared at a constant speed of 100 m s−1 along the x axis, and the averaged shear stress τ is calculated from the component τ zx of the stress tensor.
In order to characterize the aromatization state of the samples an aromaticity index, I a is computed for each 5- and 6-membered carbon ring using the harmonic oscillator model of aromaticity [21]:
  I a = 1 α C C n i n ( r C C opt r i ) 2 ,
where α C C is an empirical constant (equal to 78.6 ), n is the size of a ring, r C C opt is the optimum C–C bond length in a fully aromatic six-membered ring (=1.388 Å), and r i is the real bond length of the i-th C–C bond in a ring. Ring statistics is computed by finding the shortest pathways between bonded atoms [22]. Bond cutoffs of 1.85, 1.30, and 1.00 Å are employed for C–C, C–H, and H–H bonds, respectively. When a ring is aromatic (e.g., benzene), I a is close to 1. In contrast, I a takes a negative value for a non-aromatic ring. Here, we consider all negative I a as 0. We, thus, assign aromaticity indices between 0 and 1 to all carbon atoms. If an atom belongs to multiple rings, we take a maximum value. For hydrogen atoms, I a = 1 is assigned for the sake of visibility in color-coded snapshots.
An averaged aromaticity index I ¯ a is defined as the total aromaticity index (sum of the individual atomic aromaticity indices I a i excluding H atoms with I a = 1 ) divided by the number n C of carbon atoms in the system:
I ¯ a = 1 n C { i C } I a i .
The aromaticity index I ¯ a measures the fraction of carbon atoms that belong to an aromatic ring system.

2.2. Experimental Details

2.2.1. Materials

a-C:H samples with 36 at.% hydrogen are provided by the HEF/IREIS Group (Andrézieux-Bouthéon, Loire, France). They are produced by plasma-assisted chemical vapor deposition from the gaseous precursor acetylene. The steel samples are degreased with ethyl acetate and rinsed with ethanol. They are placed on the substrate holder and the chamber is pumped down while heated at 150 °C to promote degassing. After 2 h heating, the samples are bias-etched with argon to remove the passive layer on steel and promote adhesion of a W-based, carbon-graded sublayer before a hydrogenated amorphous carbon is grown. Ion energy through the biasing of the sample during growth allows to adjust the properties, including the hydrogen content, to produce a coating that provides very low friction under dry atmosphere, including vacuum. The coatings are deposited on M2 steel (elastic modulus of 207 GPa, Poisson number of 0.29, Rockwell hardness of 64) substrates and have an elastic modulus of 80 GPa, a Poisson number of approximately 0.2, and a hardness of 9 GPa.
Graphene oxide (GO) is prepared as a reference material for the XPS and XAES analysis as follows. Graphite flakes (reference: 808091) are purchased from Sigma-Aldrich (St. Louis, MO, USA). Three grams of pristine graphite flakes are mixed with 75 mL of concentrated H2SO4 (98%) into a 250 mL beaker. Nine grams of KMnO4 is gradually added into the mixture while keeping the temperature low (<10 °C) in an ice bath. The obtained dark green suspension is continuously stirred at 35 °C for 2 h. Next, 75 mL of deionized water is added to the suspension under vigorous stirring until the dark green mixture turns fuchsia. Finally, 7.5 mL of 35% aq. H2O2 is added to finish the reaction, leading the mixture to turn brown/yellow [23]. To remove impurity ions, the product is washed two or three times with HCl in 30% v/v, deionized water, and ethanol [24]. Finally, GO is obtained by centrifugation and then dried out in an oven at 105 °C to remove water.

2.2.2. Friction Tests

Friction tests are conducted in an UHV analytical chamber [25] at ambient temperature and pressure ( < 10 6 Pa). Since a linear reciprocating ball-on-plate tribometer [25], as well as XPS and XAES (ULVAC-PHI, Inc., Kanagawa, Japan), are installed in the same UHV chamber, in situ XPS/XAES can be directly performed after friction tests without exposure to air. For the friction tests, a-C:H samples are sonicated first in ethanol and then heptane for 5 min each. After removing heptane residuals by evaporation in a ventilation chamber, the a-C:H samples are introduced into the UHV chamber. The stroke length in the ball-on-plate tribo tests is 2 mm, the average sliding speed is 0.2 mm s−1, and a maximum Hertzian contact pressure of 580 MPa can be estimated from the 10 mm ball radius.

2.2.3. Surface Analyses

Samples are optically imaged by digital microscopy (VHX-6000, Keyence, Osaka, Japan). Their depth profile and surface roughness Sa are recorded by an interferometer ContourGT-X (Bruker, Billerica, MA, USA), where a 100× objective is used to acquire Sa. This corresponds to an area of 63.0 × 47.5 μm2 with a lateral resolution of 0.1 μm. It is worth mentioning that, for the balls, a curvature fitting is applied to eliminate the influence of the ball’s curvature on the roughness calculations. Changes in surface chemical structures after friction tests are analyzed by XPS/XAES with a ULVAC-PHI Versa Probe II spectrometer (ULVAC-PHI, Inc., Kanagawa, Japan) using Al Kα X-ray source (1486.6 eV), a take-off angle of 45°, and a 50 × 50 μm² probed area. In order to avoid charging, a neutralization system is used. Spectra of C1s XPS and C KLL XAES are obtained with a pass energy of 23.5 eV. All peaks are fitted with the Multipack software using a Shirley background. Quantification is carried out using the transmission function of the apparatus and an angular distribution correction for a 45° angle. Sensitivity factors are extracted from the work by Wagner et al. [26], where cross section and escape depth correction are integrated.

3. Results

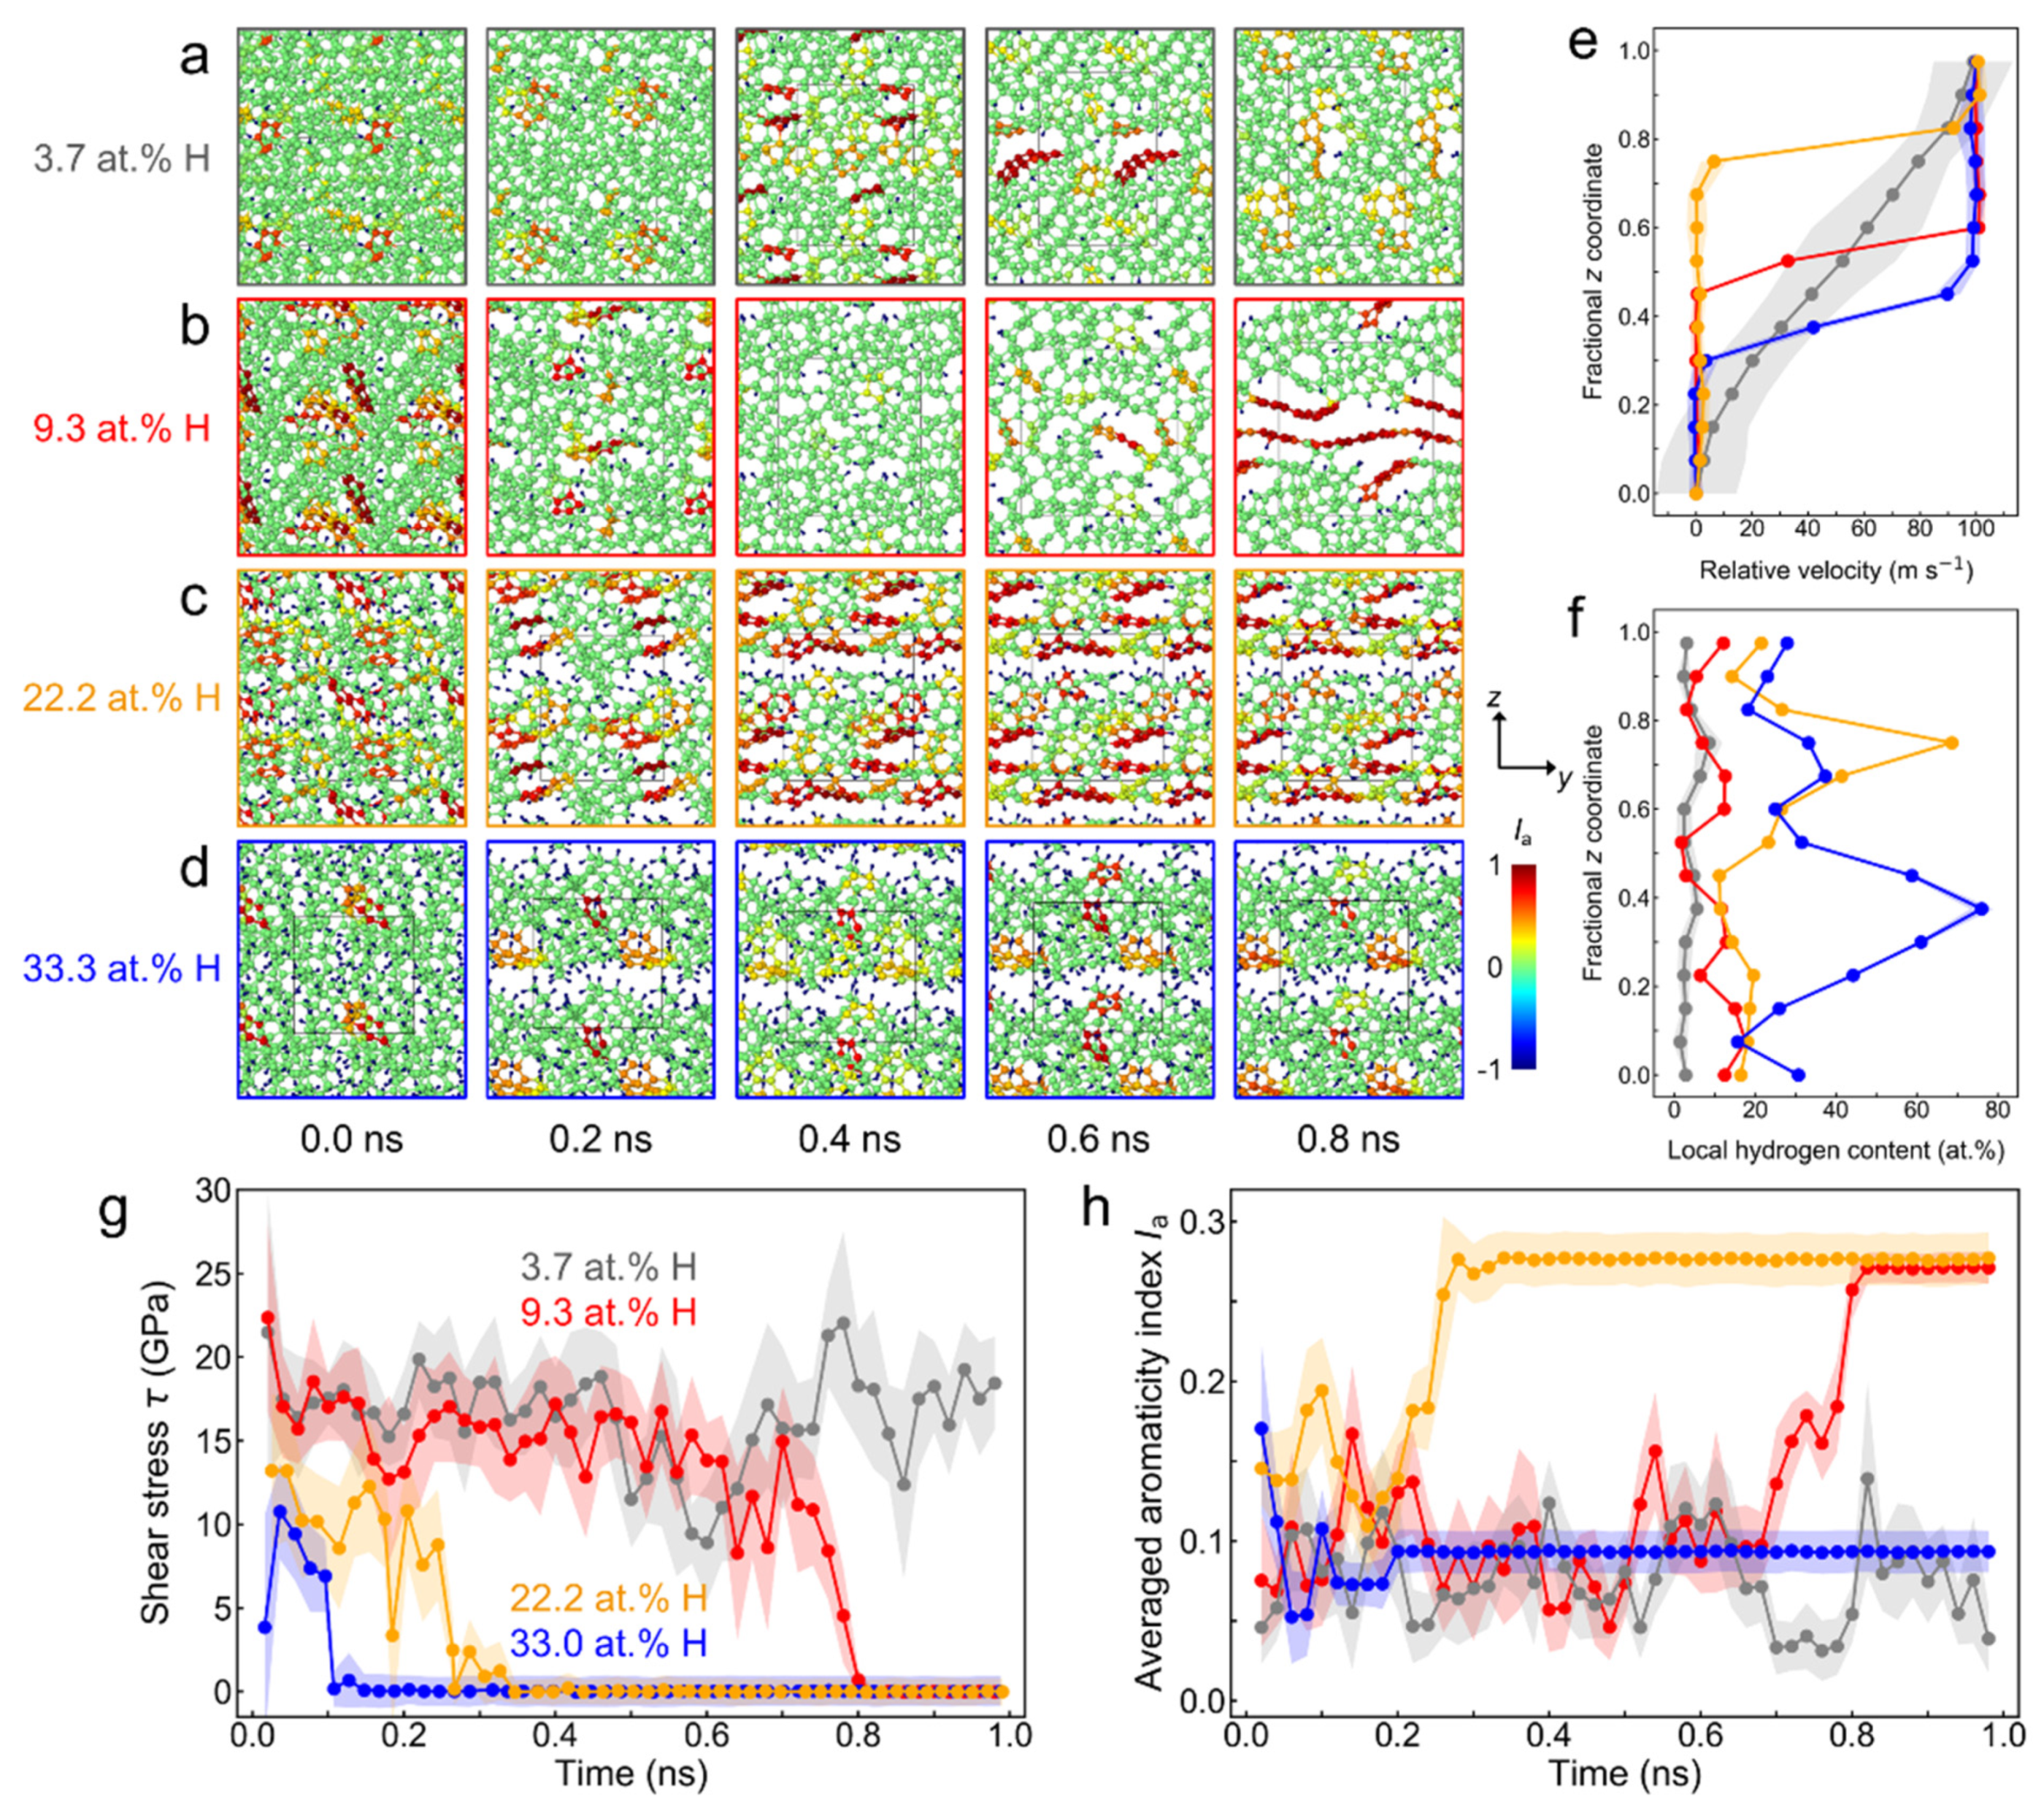
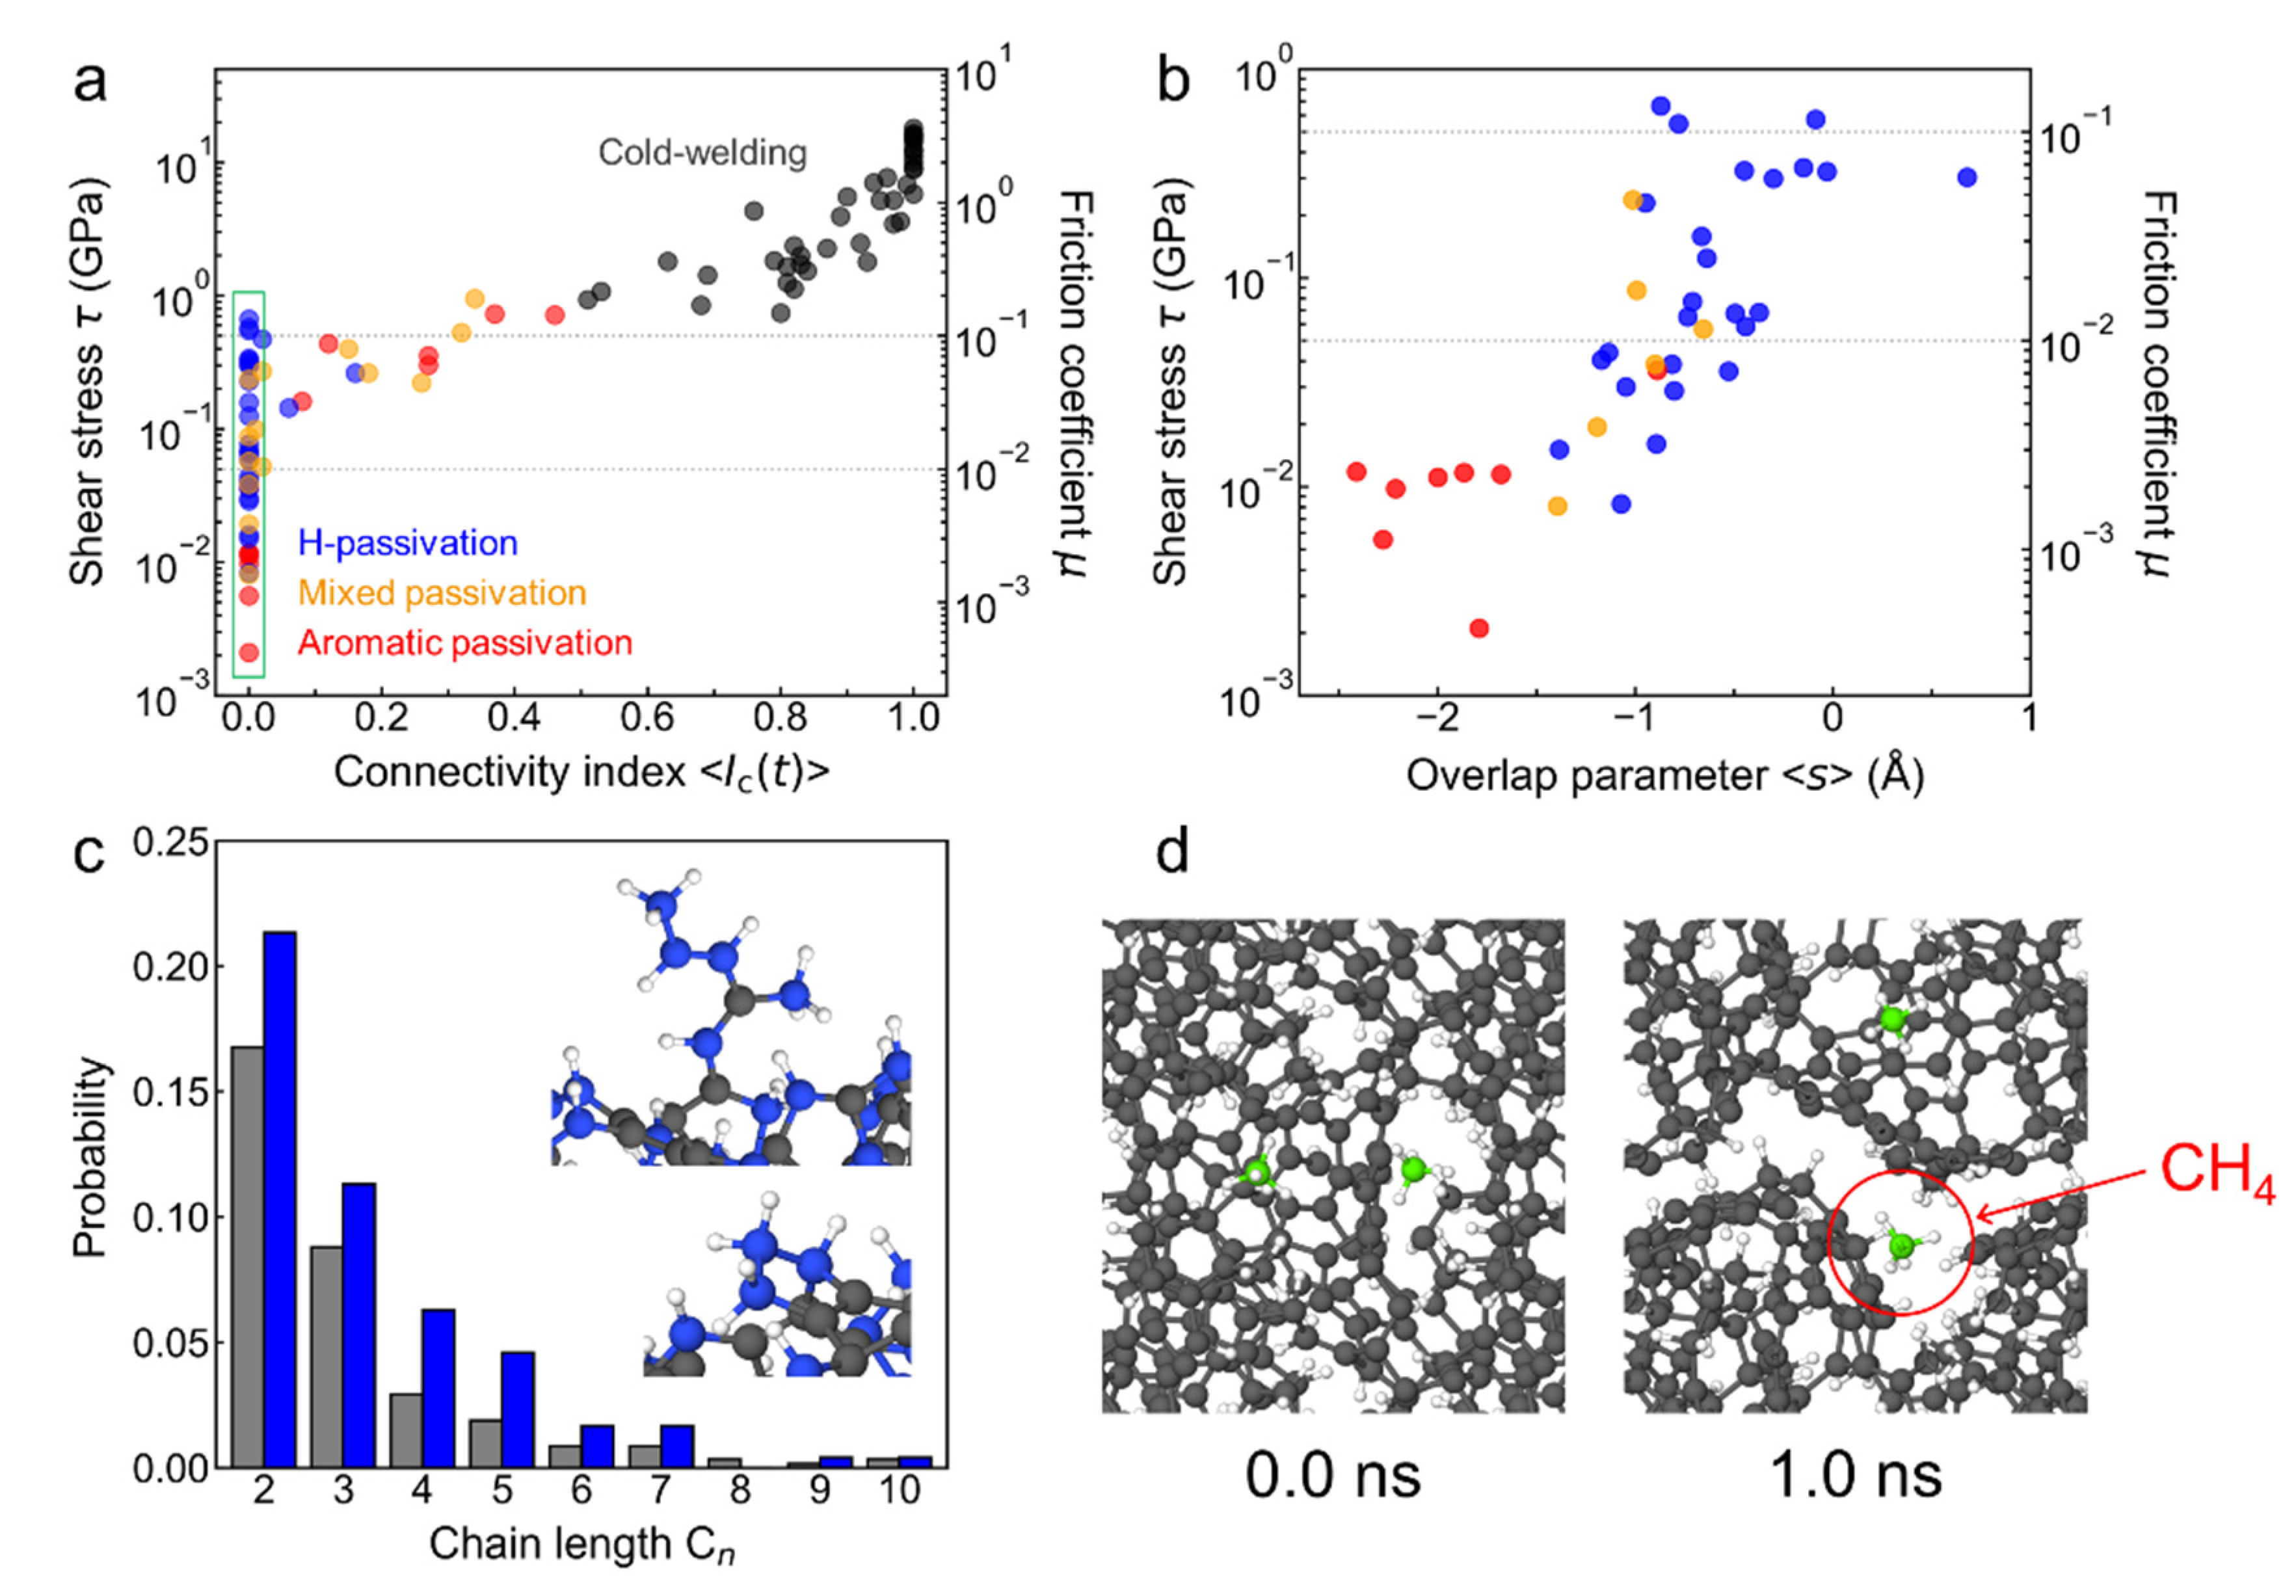
3.1. Quantum Molecular Dynamics Shearing Simulations

We study the frictional behavior of a-C:H bulk samples with varying hydrogen contents C H by performing 1-ns SCC-DFTB MD simulations with Lees-Edwards boundary conditions. Figure 1a–d show representative snapshots of the evolution of atomic configurations for a-C:Hs with different C H . In Figure 1a–d, atoms are colored according to their aromaticity indices. At C H = 3.7 at.%, the system contains an aromatic ring before sliding (Figure 1a). This ring deforms and is ruptured immediately when shear is imposed. The formation and rupture of aromatic rings continuously take place under shear (e.g., at 0.4 ns and 0.6 ns in Figure 1a). The shear deformation is characterized by a Couette-like velocity profile (gray curve in Figure 1e), and no shear localization (that would result in a weak shear interface) can be detected. The hydrogen content is homogeneously distributed over the whole height of the system (gray curve in Figure 1f).
At C H = 9.3 at.%, the a-C:H bulk initially contains more aromatic rings (Figure 1b). However, until t 0.7 ns, the shear deformation is accommodated in the entire system, and no structural difference between a-C:Hs with C H = 3.7 and 9.3 at.% is observed. Once a small aromatic network forms in the matrix at t 0.7 ns, it rapidly grows, and, subsequently, the system is separated into two disconnected subsystems by two aromatic graphenoid layers. The aromatic layers are highly localized and supported by non-aromatic regions. The velocity profile displays a clear step (red curve in Figure 1e), while local hydrogen content is still homogeneously distributed (red curve in Figure 1f).
At C H = 22.2 at.%, an aromatic lamella structure is generated already at t = 0.2 ns (Figure 1c). At t = 0.4 ns, we observe a sliding interface consisting of a hydrogen- and an aromatic-passivated surface. Accordingly, the steady-state velocity profile exhibits a discontinuity at the sliding interface (yellow curve in Figure 1e), whose location coincides with a marked peak in the local hydrogen concentration (yellow curve in Figure 1f) originating in the hydrogen passivation layer.
At C H = 33.3 at.%, the system immediately develops two hydrogen-passivated surfaces (as shown in the blue line of Figure 1f) and almost no changes in the hybridization of carbon atoms are observed (Figure 1d). No plastic events occur after 0.2 ns. As for C H = 22.2 at.%, the velocity profile shows a step (blue curve in Figure 1e), and the local hydrogen content is peaked (blue curve in Figure 1f). However, the latter is broader than in the C H = 22.2 at.% case since two hydrogen-passivated surfaces are involved.
Figure 1g,h depict the time evolution of the shear stresses τ and averaged aromaticity indices I ¯ a , respectively, for the four MD trajectories displayed in Figure 1a–d. At C H = 3.7 at.%, τ is high ( τ 15 GPa) and I ¯ a fluctuates below 0.1 throughout the simulation. A similar evolution of the shear stress is observed at C H = 9.3 at.% for t 0.7 ns, but the shear stress drops suddenly as the aromaticity index increases (red lines in Figure 1g,h). The average shear stress is 0.01 GPa for the last 0.2 ns. The a-C:H with C H = 22.2 at.% also undergoes a drastic decrease in τ to 0.01 GPa and an increase in I ¯ a , but this transition occurs earlier than in the system with C H = 9.3 at.%. At C H = 33.3 at.%, the running-in period is the shortest compared with the other three systems, and the steady-state shear stress is 0.04 GPa. The I ¯ a in the initial phase of shearing is the largest among the four a-C:H samples with different hydrogen contents but decreases rapidly under further shearing.
Next, we perform additional simulations for a wide range of hydrogen contents ( 0.0 C H 40.7 at.%). The C H range is sampled by 17 different hydrogen contents and, for each C H value, 6 trajectories are generated, resulting in a total of 102 MD trajectories. For each 1-ns-long trajectory, the final shear stress is determined as averages over the last 0.1 ns. A plot of this final shear stresses τ (along with the corresponding friction coefficients μ = τ / P N , which are only meaningful for non-cold-welded interfaces) for all samples is displayed in Figure 2. The resulting friction map can be classified into four friction regimes: cold-welding (CW), aromatic passivation, mixed passivation, and hydrogen passivation (see different colors in Figure 2).
This classification of the friction regimes is based on structural criteria calculated for the last 0.1 ns, i.e., for steady-state friction. First, a connectivity index I c is employed to check whether or not the a-C:H cold-welds. The connectivity index at time t, I c ( t ) , is defined as 0 when the a-C:H matrix is separated into two disconnected blocks; otherwise, I c ( t ) is equal to 1. The latter indicates that there is at least one C–C bond between the two blocks. When the time average of I c ( t ) for the last 0.1 ns, I c ( t ) , is larger than 0.5, we consider a sample as completely cold-welded (CW, represented by gray markers in Figure 2a). For systems that are not completely CW (where I c ( t ) < 0.5 ), chemical structures of the surfaces at the sliding interface are analyzed further. To consider the geometrical roughness of the interface area, we subdivide the system into grids along the x- and y-axis with a grid size d = 2 Å. For each grid square, atoms lying within 2.5 Å from the highest and lowest atom on the lower and upper surface, respectively, are defined as surface atoms. Only for the surface atoms, the averaged aromaticity index I a ,   surf and hydrogen content C H ,   surf are calculated as averages over the last 0.1 ns of sliding. When I a ,   surf is larger than 0.3, the friction regime is defined as aromatic passivation (represented by red markers in Figure 2a). In contrast, when the C H ,   surf is larger than 30 at.%, the hydrogen passivation regime applies (represented by blue markers in Figure 2a). For systems that do not meet both criteria, a mixed passivation regime is assumed (represented by orange markers in Figure 2a).
This mapping of friction regimes shows that the friction of a-C:H is strongly influenced by its hydrogen content. The CW regime causes high friction ( μ 0.2 ), whereas the other friction regimes can establish superlubricity states. At C H 22 at.%, cold welding can occur (Figure 2b). However, the CW probability decreases as C H increases. At extremely small C H ( < 3.7 at.%), only the CW regime is observed. At 3.7   at . % C H < 22 at.%, three friction regimes can coexist. In this range, superlubricity is mostly triggered by surface aromatization (Figure 2c). In an intermediate range of friction coefficients ( 0.05 μ 0.2 ), C–C bonds across the sliding interface form, i.e., 0.0 < I c ( t ) , due to the presence of less-aromatic, reactive carbon atoms. The transition from aromatic to hydrogen passivation occurs at C H 22 at.%. The mixed passivation regime, where aromatic graphenoid and hydrogen-passivated patches coexist, represents another friction regime. This regime is established at around C H = 5 at.% and extends until a transition point at C H = 22 at.% is reached (Figure 2d). Friction coefficients in this regime can range from 0.002 to 0.2, indicating a broad spectrum of frictional responses from superlubricity to partial cold welding. At C H > 22 at.%, the CW regime is not observed anymore. For almost all trajectories, the hydrogen passivation regime applies, and I c ( t ) is equal to 0. Nevertheless, the shear stresses are scattered broadly in a range of 2 orders of magnitude.
For completely and partially cold-welded systems the shear stress τ is strongly correlated with the connectivity index I c ( t ) (see data points with I c ( t ) > 0 in Figure 3a). We note that, for an infinitely long sliding time, all metastable cold-welded interfaces would reach the thermodynamically stable graphitic state (i.e., aromatic or partially aromatic passivation). However, as the typical size of an asperity on a a-C:H surface is of the order of 100 nm [4], the typical duration of asperity-asperity collisions in DLC is less than a μs for sliding speeds of ~1 m s−1. Thus, some cold-welded interfaces can be expected to persist for the duration of the asperity-asperity collisions. In contrast, the large variations in the shear stress in the non-cold-welded samples (where I c ( t ) = 0 ) can be explained by the broad range of surface morphologies that can be obtained in such disordered materials and, thus, by the broad range of atomic-scale roughness values of the sliding surfaces, resulting in different magnitudes of the steric hindrance between surfaces during sliding (Figure 3b). We here introduce a simple geometric model to calculate how often the nanoscale protrusions on one surface overlap with the protrusions on the counter-surface under shear and how large the overlap is. For the configurations in the last 0.1 ns of each run, height profiles h ( x , y , t ) of the surfaces are obtained by subdividing the systems into grids with a step size d = 3 Å along the x- and y-axis. At each grid point ( x , y ) , the highest and lowest atomic z-coordinates are chosen for the lower and upper surface, respectively, resulting in surface topographies h lower ( x , y , t ) and h upper ( x , y , t ) .
Next, we calculate for fixed y and t the vertical distance s ( y , t ) between the lowest point of the upper and highest point of the lower surface
s ( y , t ) = [ max x h lower ( x , y , t ) min x h upper ( x , y , t ) ] .
Equation (3) measures the local instantaneous geometric overlap of the heights h lower and h upper on a line with fixed y value at a time t during sliding along the x-axis. Note, that s ( y , t ) can be positive (overlap) or negative (no overlap). We define an average overlap parameter s ( y , t ) by averaging the overlap parameters over all y lines and all sampling times ( = t 1 t 0 ) :
s = 1 t t 0 t 1 d t 1 L y   0 L y d y   s ( y , t ) .
Here, t 0 and t 1 are 0.9 and 1.0 ns, respectively. In a contact between perfectly flat, fully hydrogen-passivated diamond surfaces, s would be equal to zero, and this would correlate with the extremely low friction observed for these surfaces [8]. Figure 3b shows the shear stress τ and friction coefficient μ as a function of the averaged overlap parameter s for all non-CW trajectories (where I c ( t ) = 0 ). A clear correlation between friction coefficient and atomic-scale contact roughness (correlation coefficient 0.8) suggests that friction in these systems is related to elastic instabilities caused by collisions between atomic protrusions on the sliding surfaces. Our aromatic surfaces are smoother than hydrogen-passivated ones, and, consequently, the friction coefficients in the aromatic passivation regime are smaller than those in the hydrogen passivation regime.
It is also interesting to see how a-C:H surfaces are passivated with hydrogen. Structural analyses of sliding interface regions reveal that hydrogen-passivated a-C:H surfaces are oligomerized after running-in (Figure 3c). We calculate the chain length for structures whose carbon atoms are bound to hydrogen atoms in the simulation box before and after 1-ns sliding for all a-C:H with C H > 30.0 at.%. Figure 3c shows that the probability of hydrocarbons with chain lengths ranging from 2 to 7 increases by more than a factor of 2, whereas the probability of isolated hydrocarbon groups CHx ( x = 1 3 ) decreases by 0.15. Before sliding, carbon atoms bound to hydrogen atoms are likely not to be connected with each other and randomly distributed in a-C:H matrices. However, shear induces oligomerization of hydrocarbon fragments, resulting in the formation of a low-friction tribo-interface. As shown in the insets of Figure 3c, surfaces are covered with oligomers consisting of CHx groups ( x = 1 3 ). The carbon atoms are also both sp2 and sp3-hybridized, and the chemical structure is close to a mixture of poly-ethylene and -acetylene.
Interestingly, our hydrogen-rich a-C:H samples sometimes contain methane (CH4) molecules after sample preparation. An example is shown in the left panel of Figure 3d. Here, we observe the presence of two CH4 molecules in the initial a-C:H bulk sample. Shear-induced mixing of the a-C:H matrix allows CH4 molecules to move into the surface region. One of the CH4 molecules is trapped at an atomic-scale valley of the surface (in the right panel of Figure 3d). We detect such processes in three independent shearing simulations at C H = 33.3, 37.0, and 40.7 at.%. The observed outgassing of methane could contribute to a hydrogen depletion in the topmost region of an a-C:H during sliding [9].

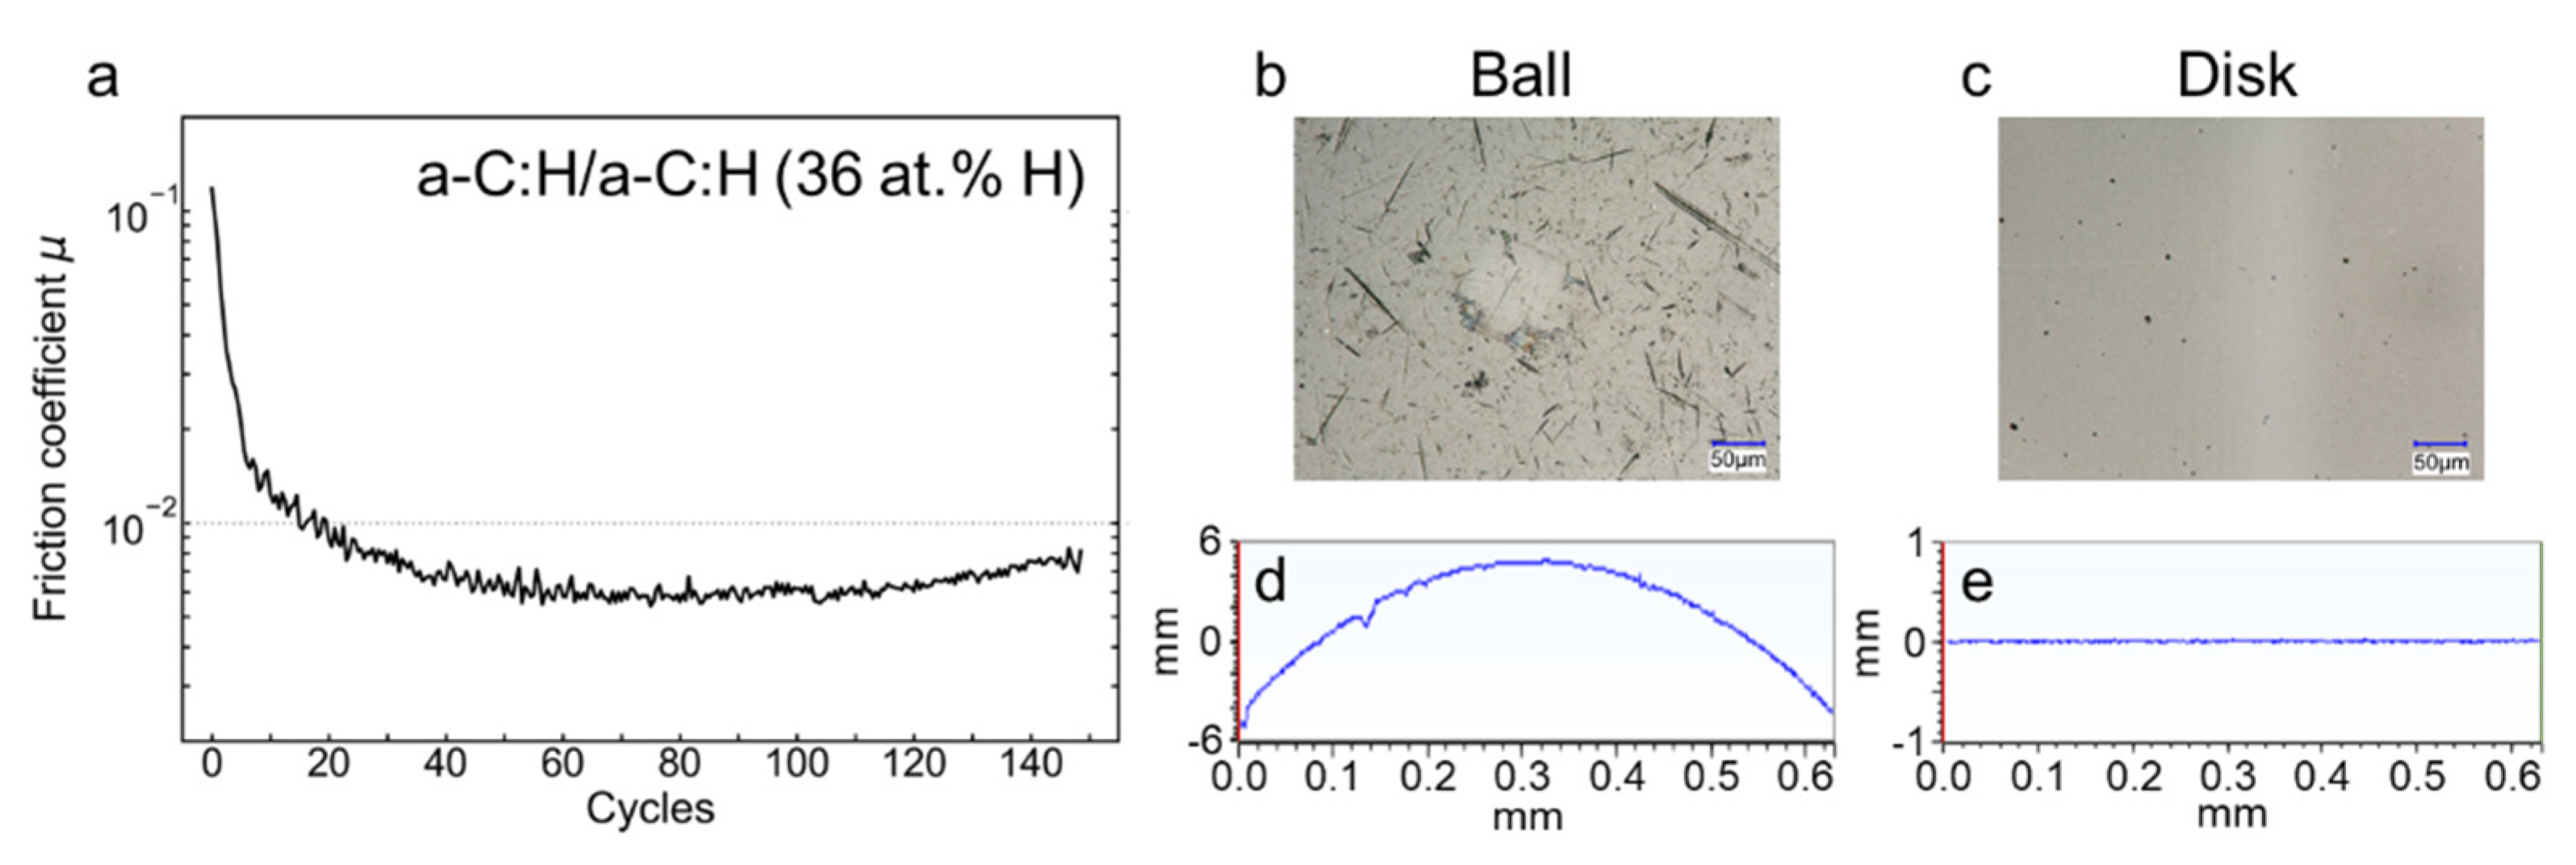
3.2. Reciprocating Friction Experiments

In order to assess the predictive power of the atomistic friction map presented above, reciprocating friction tests of self-mated a-C:H coatings with 36 at.% H are conducted in UHV. In the first sliding cycle, the averaged friction coefficient μ is about 0.11, and the instantaneous μ fluctuates largely during a stroke. However, it drops immediately and reaches a superlubricity state ( μ < 0.01 ) after 12 cycles of running-in (Figure 4a). In the final sliding cycles, the instantaneous μ stays constant during the entire stroke. Since we are only interested in the investigation of the tribological system in the superlubricity state, we stopped the test after 140 cycles (about 1 h duration) because the friction coefficient began slightly to rise, indicating forthcoming H depletion and possible seizure with sudden increase of friction up to values near unity. It has been documented that superlubricity of hydrogenated DLC at ambient temperature in UHV does not last a long time (see Donnet [6], for example). Optical images of wear scars after sliding tests show that the diameters of wear scars on the ball and disk (112 and 106 μm, respectively) are slightly larger than the initial Hertzian contact diameter of 85 μm (Figure 5b,c). However, depth profiles of ball and disk recorded by interferometer show no detectable changes (Figure 5d,e), indicating that wear is extremely small. The surface roughness R a of a-C:H on the ball decreases from 43.3 to 16.0 nm, while that on the disk remains almost unchanged at R a = 6.4 nm.

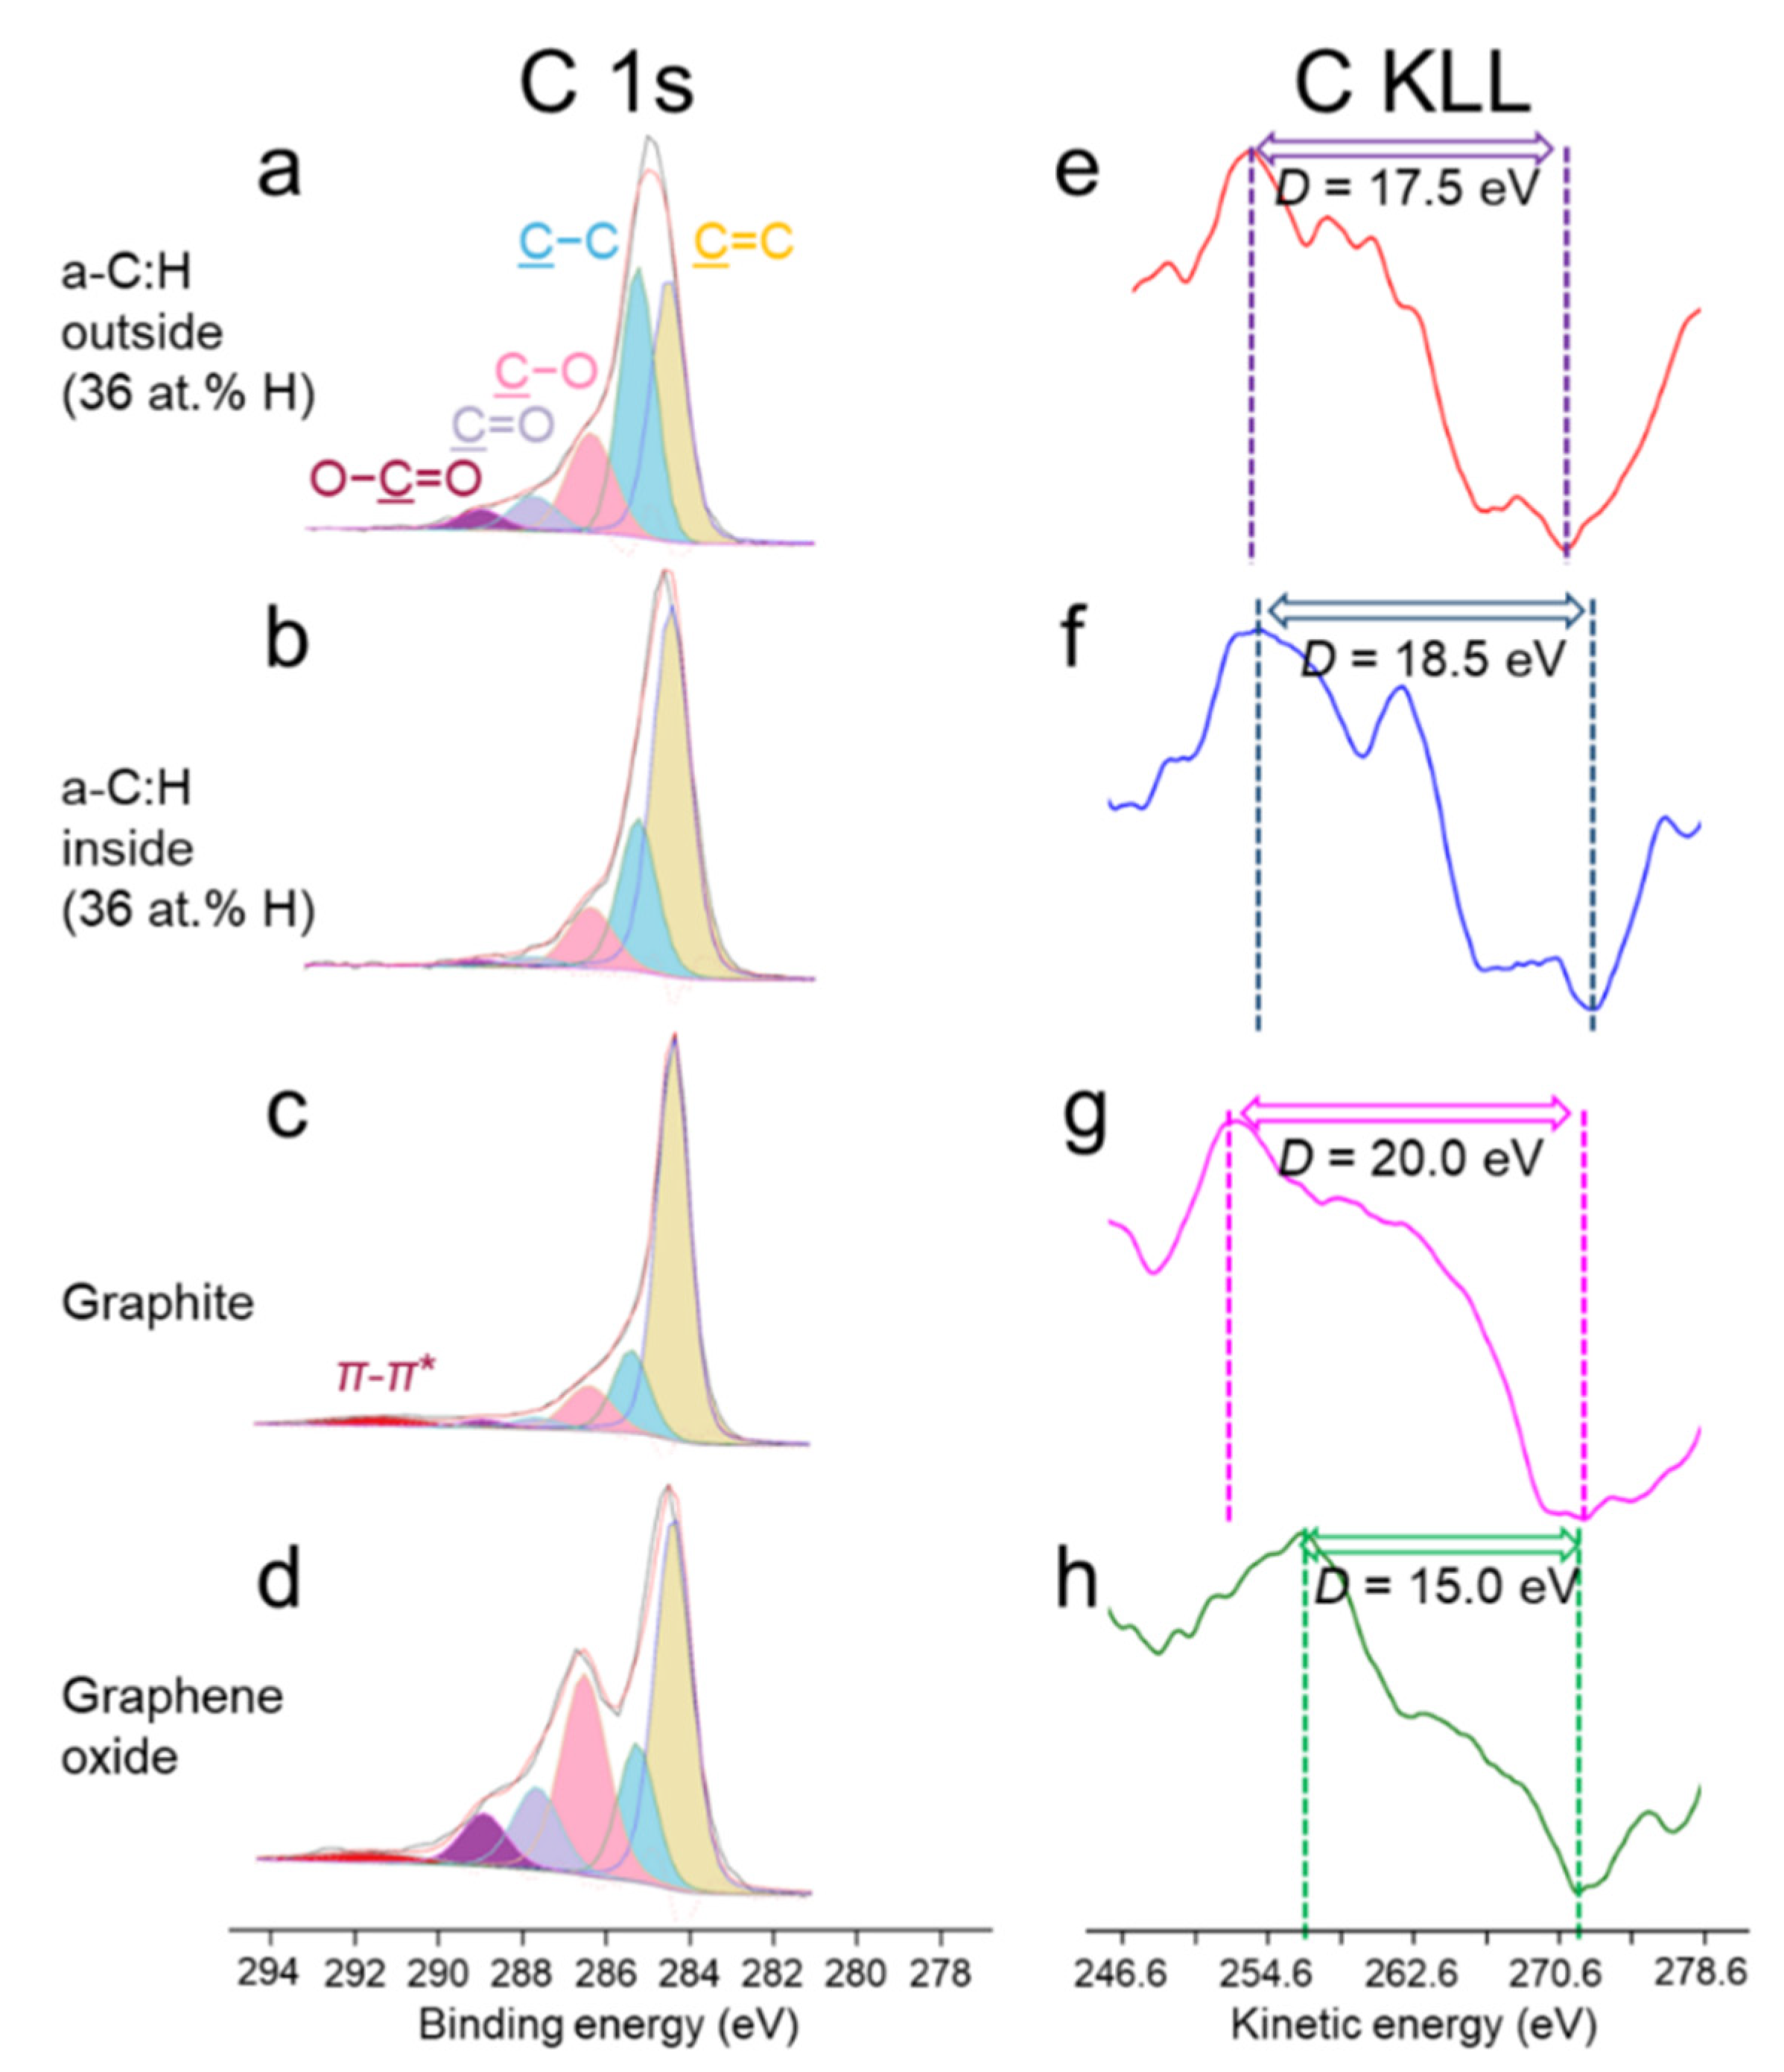
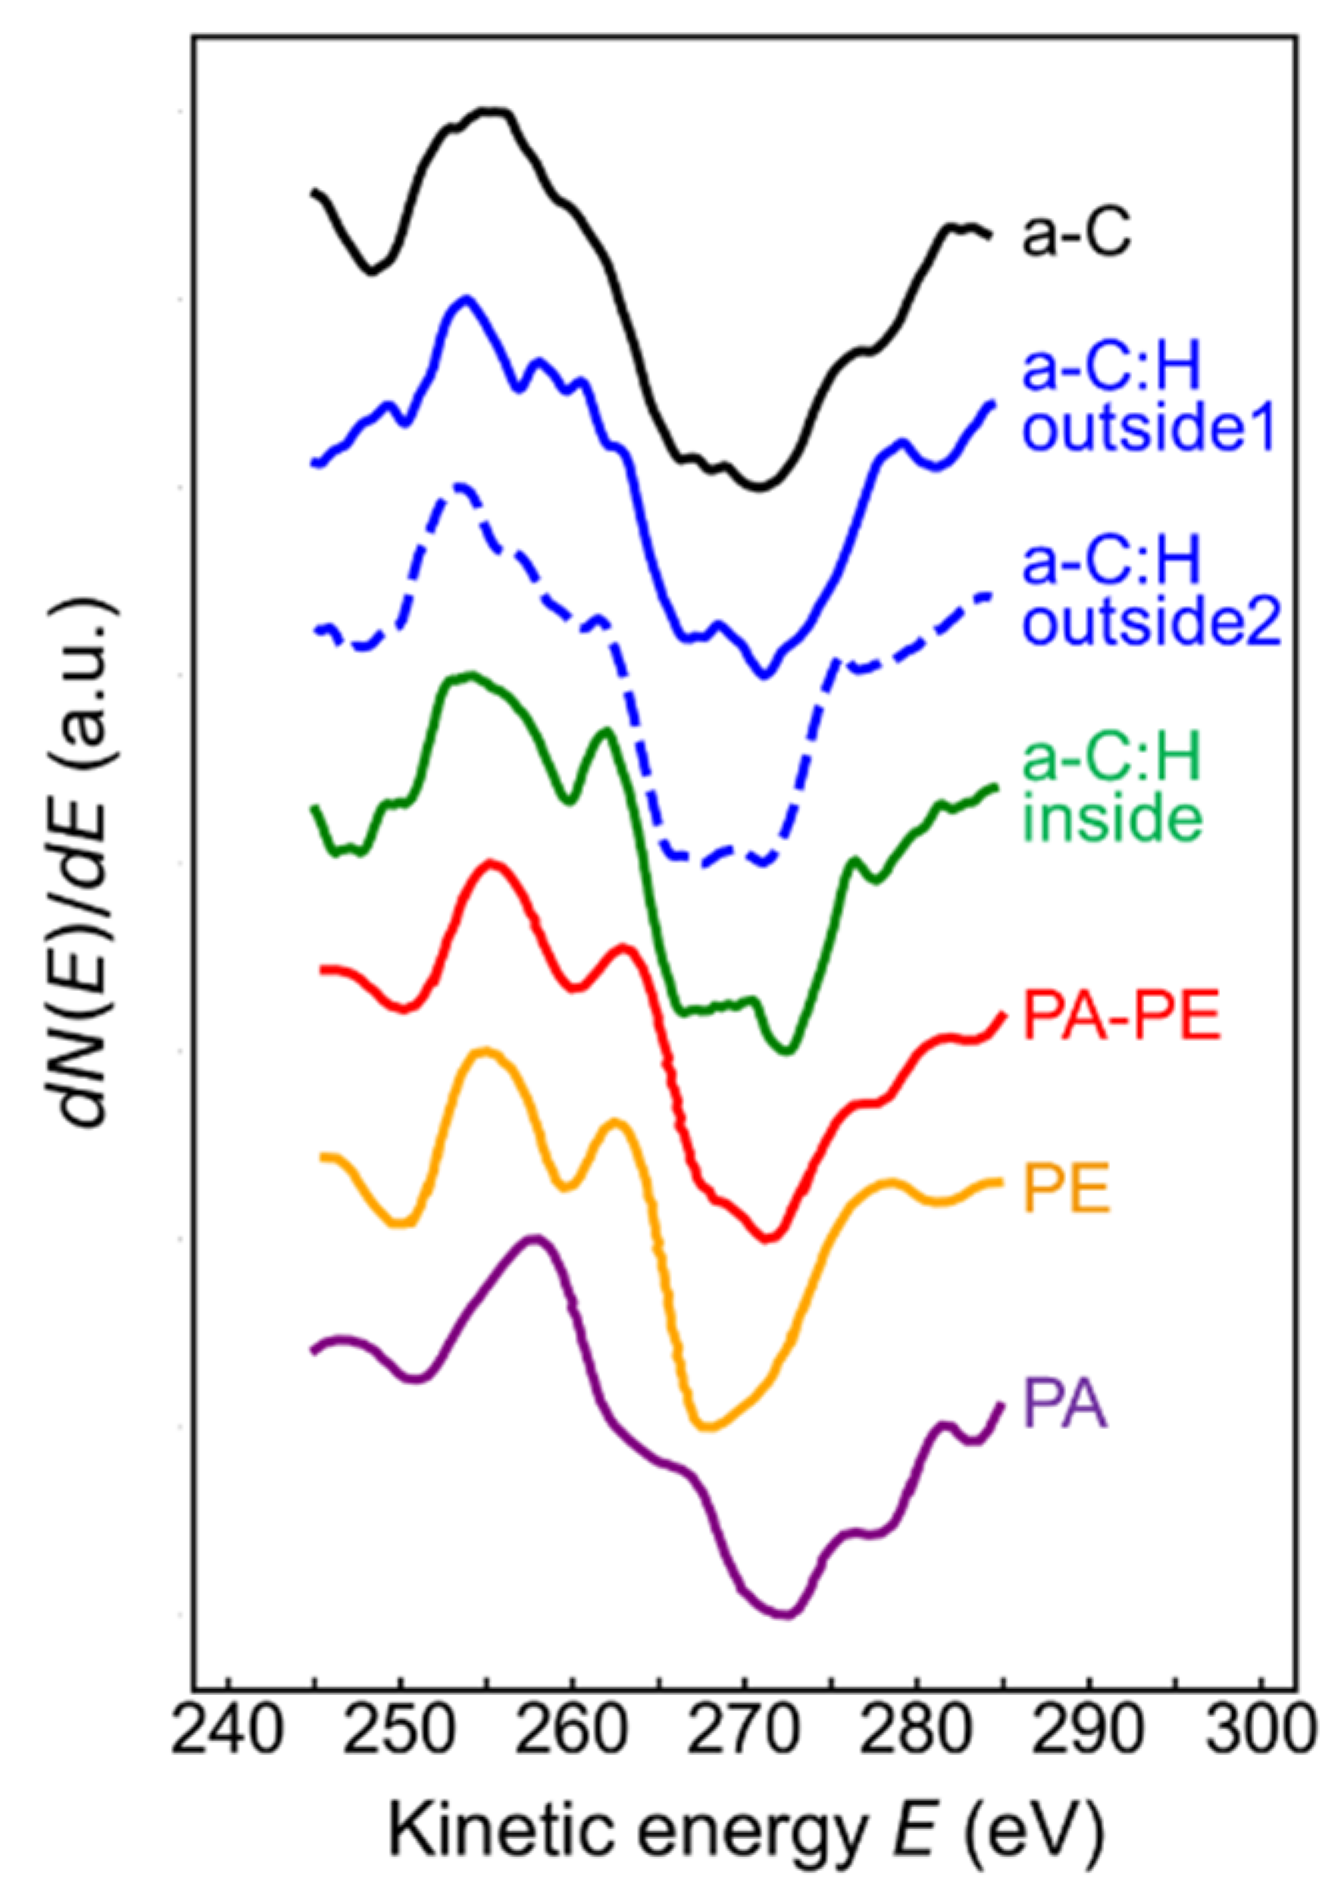
3.3. XPS/XAES Surface Analyses

To understand surface chemical changes induced by sliding, in situ XPS/XAES analyses are performed on the a-C:H-coated flat immediatelly after the friction test. The XPS spectra show that the a-C:H surface contains only carbon and oxygen (in addition to hydrogen, which cannot be detected by XPS). An oxygen content of 8.5 and 19.2 at.% is detected inside and outside the wear scar, respectively. This difference in the oxygen content inside and outide the wear scar is also detected in the C1s XPS spectra (Figure 5a,b). Outside the wear scar, clear contributions of O–C=O, C=O, C–O are observed at binding energies of 288.9, 287.8, and 286.4 eV, respectively (Figure 5a). In contrast, inside the wear scar (Figure 5b), the contribution of C–O is smaller and those of O–C=O and C=O are negligibly small. Here, the C1s major peaks are deconvoluted into two peaks at 284.4 and 285.3 eV, attributed to C=C and C–C bonds, respectively. This deconvolution indicates that more C=C bonds exist than C–C bonds inside the wear scar, whereas, outside the wear scar, the amounts of C–C and C=C bonds are similar. For comparison, the C1s spectra of graphite and graphite oxide are displayed in Figure 5c,d, respectively. The full width at half maximum (FWHM) of the C1s peaks on a-C:H surfaces, both inside and outside the wear scar, is 1.4 eV, which is larger than the FWHM of graphite’s C1s major peak (0.9 eV, Figure 5c). The C1s spectra of graphite and graphene oxide contain π−π* shakeup peaks characteristic of aromatic compounds (Figure 5c,d). However, no π−π* shakeup peaks are detected for the XPS spectra of the a-C:H surface both inside and outside the wear scar.
Surface chemical structures are further scrutinized by XAES analyses (Figure 5e–h). We note that C KLL Auger electrons have a smaller kinetic energy then C1s photoelectrons, and, consequently, their reduced mean free path renders XAES more surface sensitive. In general, the sp2/sp3 ratio on a carbon surface is estimated by the D parameter defined as the kinetic energy difference between the maximum and minimum point in the first derivative of the C KLL XAES spectrum. We assume a linear relationship bettween the sp2/sp3 ratio and D parameter [27]. D parameter of diamond [28] and graphite are 14.2 and 20.0 eV, respectively (Figure 5g). Inside and outside the wear scar, D parameters are 17.5 and 18.5 eV, respectively (Figure 5e,f). This indicates that the sp2 content inside the wear scar increases from 60% to 72% [29].
Interestingly, a peak at 262 eV becomes prominent for the first-derivative XAES spectrum of a-C:H recorded inside the wear scar. This peak is not found for the other three spectra. A comparison of the spectra of a-C:H with those of polyacetylene (PA), polyethylene (PE), and a PA−PE mixture [30] suggests that the a-C:H surface has accumulated C–H2 functional groups inside the wear scar (Figure 6). The peak at 262 eV does not appear for PA (chains of CH groups) but does for PE (chains of CH2 groups), and the whole spectra for a-C:H inside the wear scar resembles that of the PA−PE mixture. In contrast, the first-derivative C KLL spectrum outside the wear scar is similar to an a-C. These results indicate that the surface chemical structure significantly changes during sliding. Most likely, the superlubricious a-C:H surface is passivated by oligomeric CH/CH2 species, whereas the pristine a-C:H surface is hydrogen-depleted and oxidized.

4. Discussion

Our atomistic simulations reveal that friction of a-C:H can be classified into cold-welded, aromatic, mixed, and hydrogen passivation regimes, depending on the hydrogen content. According to this map, superlubricity of a-C:H in vacuum is mostly due to aromatic passivation at C H 22 at.% H and hydrogen passivation at C H > 22 at.% H. However, the hydrogen content C H in our friction map cannot be directly related to C H values measured in macroscopic experiments. While an experimental hydrogen content is often reported for the bulk of the a-C:H coating (in the experiment presented in this article C H 36 at.%), our atomistic model must be applied to the topmost region (1–2 nm) of the experimental a-C:H coating. As evidenced by Chen et al. [9], the hydrogen content of the topmost surface can significantly differ from its bulk value. Indeed, the occurrence of such a hydrogen gradient is also likely for the experiments presented in this article. The resemblance of the first-derivative C KLL spectrum of the a-C:H recorded outside the wear scar to that of a-C (Figure 6) indicates that the topmost 1–2 nm region of the a-C:H coating consists of a hydrogen-depleted a-C-like region.
Since our friction map predicts cold welding and mechanical mixing for hydrogen-depleted surfaces, eventually, hydrogen from the bulk will be transported to the surface, and the experimental sliding interface will be enriched in hydrogen. Thus, this shear-induced mechanical transformation of the hydrogen-depleted top layers leads to the formation of a hydrogen-passivated superlubricious interface. As evidenced by a comparison between the first-derivative XAES C KLL spectra of the a-C:H recorded inside the wear scar and a polyacetylene-polyethylene mixture, the superlubricious layer is likely to be oligomerized and consisting of short hydrocarbon chains with C–H and C–H2 groups.
In addition, our simulations (Figure 3c) show oligomerization and the presence of a mixture of C–Hx units ( x = 1 3 ) on the a-C:H surface after running-in. In previous pictures of hydrogen passivation of carbon surfaces (for example, proposed by Erdemir [7]), this tribo-induced oligomerization and resulting surface terminations with C–H and C–H2 groups is not discussed. Therefore, our study provides complementary insights into the chemical structure of the superlubricious a-C:H surface. However, we admit that the interpretation of XAES carbon spectra is difficult due to the lack of theoretical background. The empirical comparison with XAES reference spectra is rather speculative and can only provide ideas about structural motifs and evolution. Therefore, atomistic simulations are extremely useful to support conclusions that are drawn from an XAES analysis. In the future, we will continue to investigate XAES spectra of a-C:H coatings with various hydrogen contents and sp2/sp3 ratios and contrast these results with corresponding molecular dynamics simulations.
In summary, the atomic-scale tribological phenomena in our experiment are interpreted as follows, based on our quantum molecular dynamics simulations. After growth of the a-C:H coatings, the topmost regions are strongly hydrogen-depleted (Figure 5). Consequently, our a-C:H/a-C:H sliding couple starts within the CW regime (corresponding to the upper left part of Figure 2a); therefore, friction is high for the first 10 cycles (Figure 4a). During running-in, mechanical mixing leads to a strong increase in hydrogen content on top of the a-C:H surfaces. Thus, the a-C:H/a-C:H sliding couple enters the hydrogen passivation regime (corresponding to the lower right part of Figure 2a). This change in regimes is accompanied by a strong friction reduction. Therefore, the experimental evolution of the friction coefficient, and also of the structural parameters, is explained well by the friction regime map in Figure 2 when we assume that the hydrogen content in our simulation model is representing the surface hydrogen content (within a 1–2 nm-thick layer on top of the coating) in the experiments.
In our experiments, we do not observe any aromatization of a-C:H. Interestingly, for sliding of a-C:H with 39 at.% H in a dry N2 atmosphere, Chen et al. [9] showed that the as-grown surface is superlubricious without any structural modification at a low contact pressure ( < 1 GPa). However, an increase in the contact pressure induces hydrogen depletion and structural transformation to sp2-ordering within 3 nm of the topmost surface. The graphitic layers also provided a super-low friction coefficient. The former and latter superlubricity regimes correspond to hydrogen and aromatic passivation, respectively. Interestingly, the surface aromatization proceeds in the opposite direction to our experimental observation of hydrogen passivation. In their experiments, initially, the a-C:H surface contained as many hydrogen atoms as in the bulk and, thus, started in the hydrogen passivation regime (in the lower right of Figure 2a). Sliding under a Hertzian contact pressure of 1.1 GPa caused hydrogen depletion of the top layer. The drop of hydrogen content in the surface region could be related to an outgassing of methane under higher pressures (as suggested by our results in Figure 3d) or to the formation of ammonia via a reaction of surface passivating H with N2 molecules. In both cases, our friction map predicts a change of the friction regime from hydrogen-passivated to cold-welded. Since graphitic layers were detected in the experiments, we conclude that further sliding leads to a transition from the cold-welded regime into the aromatic regime (i.e., from the upper left to the lower left region of our friction map in Figure 2a), which would be expected for long-enough sliding times based on thermodynamic considerations (as discussed in Section 3.1).
More in general, the limited time scale of the simulations is not the only factor affecting the comparison between simulations and experiments. In spite of the accuracy of quantum-mechanical MD simulations, the sliding speeds remain orders of magnitude larger than the experimental ones, although this aspect does not affect the outcome of the mechanically driven chemical reactions we observe under shear [4,12]. Moreover, the limited size of the simulation box poses other limits to the comparison to experiments. For instance, shear rates can be very high, unless the thickness of real shear bands is in the order of some nm, and surface roughness features above the nm scale are necessarily neglected. These can, however, be considered indirectly by calculating nm-scale asperity-asperity contact pressures via contact mechanics and then applying these pressure values in the MD simulation [4].

5. Conclusions

In spite of these general limitations, this study sheds light on atomic-scale structures of the superlubricious a-C:H surface during UHV friction through a synergistic combination of atomistic simulations and experiments. Our atomistic friction map clearly reveals that the chemical structure of a-C:H surfaces and their UHV superlubricity can be controlled by tuning the local surface hydrogen content. Further studies are needed to elucidate the relation between local hydrogen content and contact pressure. Since the latter is determined by the contact modulus and average slopes of the a-C:H surface [4], tuning mechanical properties or topographical features of the coatings could also be used to control friction.

Author Contributions

Conceptualization, T.K., G.M. and M.M.; investigation, T.K. and Y.L.; analysis, T.K. and Y.L.; writing—original draft preparation, T.K.; writing—review and editing, M.M. and G.M.; visualization, T.K.; supervision, J.M.M. and M.M.; project administration, J.M.M., G.M. and M.M.; funding acquisition, M.-I.D.B.B., G.M. and M.M. All authors have read and agreed to the published version of the manuscript.

Funding

This research was funded by the BMWi (Federal Ministry of Economics and Technology, Germany) within the project Poseidon II (03ET1477D) and by the Fraunhofer-Gesellschaft through the Fraunhofer PREPARE project SupraSlide. The APC was funded by the Fraunhofer-Gesellschaft.

Institutional Review Board Statement

Not applicable.

Informed Consent Statement

Not applicable.

Data Availability Statement

The data presented in this study are available on request from the corresponding author.

Acknowledgments

The authors gratefully acknowledge the company HEF/IREIS, particularly Christophe Héau, for providing the hydrogenated DLC coatings for this study. The authors acknowledge support for high-performance computational resources by the state of Baden-Württemberg through bwHPC and the German Research Foundation (DFG) through grant no INST 39/963-1 FUGG (bwForCluster NEMO).

Conflicts of Interest

The authors declare no conflict of interest. The funders had no role in the design of the study; in the collection, analyses, or interpretation of data; in the writing of the manuscript, or in the decision to publish the results.

References

  1. Holmberg, K.; Andersson, P.; Erdemir, A. Global energy consumption due to friction in passenger cars. Tribol. Int. 2012, 47, 221–234. [Google Scholar] [CrossRef]
  2. Vetter, J. 60 years of DLC coatings: Historical highlights and technical review of cathodic arc processes to synthesize various DLC types, and their evolution for industrial applications. Surf. Coat. Technol. 2014, 257, 213–240. [Google Scholar] [CrossRef]
  3. Robertson, J. Diamond-like amorphous carbon. Mater. Sci. Eng. R Rep. 2002, 37, 129–281. [Google Scholar] [CrossRef] [Green Version]
  4. Salinas Ruiz, V.R.; Kuwahara, T.; Galipaud, J.; Masenelli-Varlot, K.; Hassine, M.B.; Héau, C.; Stoll, M.; Mayrhofer, L.; Moras, G.; Martin, J.M.; et al. Interplay of mechanics and chemistry governs wear of diamond-like carbon coatings interacting with ZDDP-additivated lubricants. Nat. Commun. 2021, 12, 4550. [Google Scholar] [CrossRef] [PubMed]
  5. Erdemir, A.; Eryilmaz, O.L.; Fenske, G. Synthesis of diamondlike carbon films with superlow friction and wear properties. J. Vac. Sci. Technol. A 2000, 18, 1987–1992. [Google Scholar] [CrossRef] [Green Version]
  6. Donnet, C.; Fontaine, J.; Grill, A.; Le Mogne, T. The role of hydrogen on the friction mechanism of diamond-like carbon films. Tribol. Lett. 2001, 9, 137–142. [Google Scholar] [CrossRef]
  7. Erdemir, A. The role of hydrogen in tribological properties of diamond-like carbon films. Surf. Coat. Technol. 2001, 146, 292–297. [Google Scholar] [CrossRef]
  8. Reichenbach, T.; Mayrhofer, L.; Kuwahara, T.; Moseler, M.; Moras, G. Steric effects control dry friction of H- and F-terminated carbon surfaces. ACS Appl. Mater. Interfaces 2020, 12, 8805–8816. [Google Scholar] [CrossRef] [PubMed]
  9. Chen, X.; Zhang, C.; Kato, T.; Yang, X.; Wu, S.; Wang, R.; Nosaka, M.; Luo, J. Evolution of tribo-induced interfacial nanostructures governing superlubricity in a-C:H and a-C:H:Si films. Nat. Commun. 2017, 8, 1675. [Google Scholar] [CrossRef]
  10. Kuwahara, T.; Moras, G.; Moseler, M. Friction Regimes of Water-Lubricated Diamond (111): Role of Interfacial Ether Groups and Tribo-Induced Aromatic Surface Reconstructions. Phys. Rev. Lett. 2017, 119, 096101. [Google Scholar] [CrossRef]
  11. Kuwahara, T.; Moras, G.; Moseler, M. Role of oxygen functional groups in the friction of water-lubricated low-index diamond surfaces. Phys. Rev. Mater. 2018, 2, 073606. [Google Scholar] [CrossRef]
  12. Kuwahara, T.; Romero, P.A.; Makowski, S.; Weihnacht, V.; Moras, G.; Moseler, M. Mechano-chemical decomposition of organic friction modifiers with multiple reactive centres induces superlubricity of ta-C. Nat. Commun. 2019, 10, 151. [Google Scholar] [CrossRef] [Green Version]
  13. Long, Y.; Kuwahara, T.; De Barros Bouchet, M.I.; Ristić, A.; Dörr, N.; Lubrecht, T.; Dupuy, L.; Moras, G.; Martin, J.M.; Moseler, M. In Situ Synthesis of Graphene Nitride Nanolayers on Glycerol-Lubricated Si3N4 for Superlubricity Applications. ACS Appl. Nano Mater. 2021, 4, 2721–2732. [Google Scholar] [CrossRef]
  14. Elstner, M.; Porezag, D.; Jungnickel, G.; Elsner, J.; Haugk, M.; Frauenheim, T.; Suhai, S.; Seifert, G. Self-consistent-charge density-functional tight-binding method for simulations of complex materials properties. Phys. Rev. B 1998, 58, 7260–7268. [Google Scholar] [CrossRef]
  15. Interatomic Potentials Library Atomistica. Available online: http://www.atomistica.org/ (accessed on 1 September 2021).
  16. Lees, A.W.; Edwards, S.F. The computer study of transport processes under extreme conditions. J. Phys. C Solid State Phys. 1972, 5, 1921–1929. [Google Scholar] [CrossRef]
  17. Peters, E.A.J.F. Elimination of time step effects in DPD. Europhys. Lett. 2004, 66, 311–317. [Google Scholar] [CrossRef] [Green Version]
  18. Frenkel, D.; Smit, B. Understanding Molecular Simulations: From Algorithms to Applications, 2nd ed.; Academic Press: New York, NY, USA, 2001; ISBN 978-0-12-267351-1. [Google Scholar]
  19. Berendsen, H.J.C.; Postma, J.P.M.; van Gunsteren, W.F.; DiNola, A.; Haak, J.R. Molecular dynamics with coupling to an external bath. J. Chem. Phys. 1984, 81, 3684–3690. [Google Scholar] [CrossRef] [Green Version]
  20. Wong-ekkabut, J.; Karttunen, M. The good, the bad and the user in soft matter simulations. Biochim. Biophys. Acta Biomembr. 2016, 1858, 2529–2538. [Google Scholar] [CrossRef]
  21. Frizzo, C.P.; Martins, M.A.P. Aromaticity in heterocycles: New HOMA index parametrization. Struct. Chem. 2012, 23, 375–380. [Google Scholar] [CrossRef]
  22. Franzblau, D.S. Computation of ring statistics for network models of solids. Phys. Rev. B 1991, 44, 4925–4930. [Google Scholar] [CrossRef]
  23. Choi, E.-Y.; Choi, W.S.; Lee, Y.B.; Noh, Y.-Y. Production of graphene by exfoliation of graphite in a volatile organic solvent. Nanotechnology 2011, 22, 365601. [Google Scholar] [CrossRef]
  24. Park, S.; An, J.; Jung, I.; Piner, R.D.; An, S.J.; Li, X.; Velamakanni, A.; Ruoff, R.S. Colloidal Suspensions of Highly Reduced Graphene Oxide in a Wide Variety of Organic Solvents. Nano Lett. 2009, 9, 1593–1597. [Google Scholar] [CrossRef] [PubMed]
  25. Le Mogne, T.; Martin, J.M.; Grossiord, C. Imaging the chemistry of transfer films in the AES/XPS analytical UHV tribotester. Lubr. Front. 1999, 36, 413–421. [Google Scholar] [CrossRef]
  26. Wagner, C.D.; Davis, L.E.; Zeller, M.V.; Taylor, J.A.; Raymond, R.H.; Gale, L.H. Empirical Atomic Sensitivity Factors for Quantitative Analysis by Electron Spectroscopy for Chemical Analysis. Surf. Interface Anal. 1981, 3, 211–225. [Google Scholar] [CrossRef]
  27. Sohbatzadeh, F.; Shakerinasab, E.; Eshghabadi, M.; Ghasemi, M. Characterization and performance of coupled atmospheric pressure argon plasma jet with n-hexane electrospray for hydrophobic layer coatings on cotton textile. Diam. Relat. Mater. 2019, 91, 34–45. [Google Scholar] [CrossRef]
  28. Lascovich, J.C.; Giorgi, R.; Scaglione, S. Evaluation of the sp2/sp3 ratio in amorphous carbon structure by XPS and XAES. Appl. Surf. Sci. 1991, 47, 17–21. [Google Scholar] [CrossRef]
  29. Turgeon, S.; Paynter, R.W. On the determination of carbon sp2/sp3 ratios in polystyrene-polyethylene copolymers by photoelectron spectroscopy. Thin Solid Films 2001, 394, 44–48. [Google Scholar] [CrossRef]
  30. Lee, S.Y.; Lyu, J.; Kang, S.; Lu, S.J.; Bielawski, C.W. Ascertaining the Carbon Hybridization States of Synthetic Polymers with X-ray Induced Auger Electron Spectroscopy. J. Phys. Chem. C 2018, 122, 11855–11861. [Google Scholar] [CrossRef]
Figure 1. DFTB MD simulations of bulk a-C:H with the Lees-Edwards boundary conditions for 1 ns. Structural evolutions of the a-C:H samples with (a) 3.7, (b) 9.3, (c) 22.2, and (d) 37.0 at.% H. The carbon atoms are colored according to aromatization index ( I a , 0 I a 1 ) analysis for each 5- and 6-membered ring. I a = 1 is assigned to all hydrogen atoms (represented by blue spheres). All snapshots are side (yz) views of the simulation systems. In the panels (ad), the simulation cells are replicated periodically in all directions. The unit cells are indicated by gray rectangles. Profiles of (e) velocities along the x-axis and (f) local hydrogen contents during the last 0.1 ns for the four representative MD trajectories of a-C:H with 3.7 (gray), 9.3 (red), 22.2 (orange), and 33.3 (blue) at.% H. Semi-transparent regions represent standard deviations. Time evolutions of (g) shear stresses τ and (h) averaged aromaticity indices I ¯ a . I ¯ a is defined as i n C I a i / n C , where I a i is the aromaticity index of i-th carbon atom, and n C is the number of carbon atoms in each system. Values of τ and I a are computed as 2-ps averages, and they are further averaged every 20 ps. Semi-transparent regions represent standard deviations of the 20-ps averages.
Coatings 11 01069 g001
Figure 2. (a) Shear stresses τ averaged over the last 0.1 ns and friction regime map of a-C:H with varying hydrogen contents. Each marker represents the result of a MD trajectory and is colored according to the structural analysis described in the main text of Section 3.1. In addition, friction coefficients μ ( = τ / P N ) are given on the right y-axis. Note that these values are meaningful for non-cold-welded regimes only. Two dotted horizontal lines corresponds to μ = 0.01 and 0.1 . Representative snapshots for (b) cold-welding (CW), (c) aromatic, (d) mixed, and (e) hydrogen passivation regime. All snapshots are side (yz) views of the simulation systems. In the panels (be), the simulation cells are replicated periodically in all directions. The unit cells are indicated by gray rectangles.
Coatings 11 01069 g002
Figure 3. (a) Shear stress τ and friction coefficient μ as a function of (a) the averaged connectivity index I c ( t ) and (b) the averaged overlap parameter s . In panel (b), all trajectories where I c ( t ) = 0 are considered (indicated by a green rectangle in panel (a)). Yellow, red, and blue markers are results of mixed, aromatic, and hydrogen-passivated surfaces, respectively. (c) Probability of hydrocarbon chain length C n before (gray) and after 1-ns sliding (blue). The chain length is calculated by analyzing the connectivity of carbon atoms bound to hydrogen atoms. All trajectories of a-C:H with C H > 30.0 at.% are considered. The insets represent examples of the oligomerized surface for a-C:H with C H = 37.0 at.% after sliding. Carbon atoms bonded with hydrogen atoms are presented by blue spheres. (d) Example of outgassing of methane stored in the a-C:H matrix under shear. Carbon atoms in the methane molecules are colored in green.
Coatings 11 01069 g003
Figure 4. Reciprocating friction tests of self-mated a-C:H with 36 at.% H in UHV. (a) Evolution of the friction coefficient μ. Optical images of wear scars on the a-C:H-coated steel ball (b) and disk (c) after sliding. Depth profiles of wear scars on the a-C:H-coated steel ball (d) and disk (e) after sliding.
Coatings 11 01069 g004
Figure 5. C1s XPS spectra recorded (a) outside and (b) inside the wear scare of the a-C:H-coated steel disk after sliding. C1s XPS spectra recorded for (c) graphite and (d) graphene oxide. First-derivative C KLL XAES spectra recorded (e) outside and (f) inside the wear track of the a-C:H-coated steel disk after sliding. First-derivative XAES C KLL spectra recorded for (g) graphite and (h) graphene oxide. The D parameter is defined as the kinetic energy difference between the maximum and minimum points in the first derivatives of the XAES C KLL spectra.
Coatings 11 01069 g005
Figure 6. Comparison of first derivatives of XAES C KLL spectra for a-C (black), a-C:H outside the wear scar (blue), a-C:H inside the wear scar (green), a mixture of poly-acetylene (PA), and poly-ethylene (PE) (red), pure PE (orange), and pure PA (purple). The spectra for a-C:H outside the wear scare were obtained at two different locations (as shown in a blue solid and dashed line). The spectra for PA−PE, PE, and PA are reproduced from Lee et al. [30]. Reprinted with permission from [30]. Copyright 2018 American Chemical Society.
Coatings 11 01069 g006
Publisher’s Note: MDPI stays neutral with regard to jurisdictional claims in published maps and institutional affiliations.

