Abstract
The process parameters of laser cladding have a significant influence on the forming quality of the coating. This research investigates the relationship between input process parameters (laser power, scanning speed, pre-placed thickness) and output responses (height, width, dilution rate) of Mo2FeB2 coating through sensitivity analysis. The microstructure and properties of selected coatings were analyzed to discuss the corresponding relations. The results showed that the laser power positively affected the coating width and dilution rate, while negatively affecting the coating height. The scanning speed had a negligible effect on the height and dilution rate. The pre-placed thickness had a positive influence on the height and width; it negatively affected the dilution rate. Based on the sensitivity analysis, the thickness of the pre-placed coating determined the most sensitivity to the height. The sensitivity of the width to laser power was the highest among all parameters. The sensitivity of dilution rate to laser power and pre-placed powder thickness showed a noticeable impact. When the scanning speed was 3 mm/s, the forming quality of coating had a significant sensitivity for a higher or lower laser power (1.5, 2.1 kW) and higher or lower powder thickness (0.8, 1.2 mm). The analysis of microstructure and microhardness of Mo2FeB2 coating indicates that the Mo2FeB2 coating improves substrate properties. The microhardness of the Mo2FeB2 coating was 4–6 times that of the substrate, and the highest microhardness could be obtained by 1.5 kW laser power, 3 mm/s scanning speed, and 1.2 mm powder thickness from the sensitivity analysis results.
1. Introduction
Laser cladding, as one of the additive manufacturing technologies, utilizes a high-energy laser beam as the heat source to melt cladding powder, and part of the substrate to form the cladding layer with metallurgical bonding [1,2]. Laser cladding displays lots of advantages, such as low heat damage to substrate, a rapid heating rate and solidification rate, low dilution rate, unlimited selection of cladding powder, and excellent metallurgical bonding between the cladding layer and substrate [2,3,4,5]. Hence, it has been widely used in various industrial applications of surface modification to improve the service life of parts, e.g., in aerospace, oil and gas, marine and offshore, biomedical, chemical, and other industries [6,7]. The surface-modified parts using laser cladding technology have excellent properties, such as high hardness and wear resistance, and perfect corrosion resistance [2].
However, effectively controlling the forming quality of the cladding layer has become a key area in urgent need of research. In recent years, a large number of scholars have launched a series of studies about parameter optimization, which focused on the types of cladding powder and optimization methods. In recent years, there have been many studies to establish mathematical models and analyze the influence of parameters on the forming quality of the coating, such as the response surface methodology, regression analysis, and Taguchi orthogonal analysis. A detailed summary is shown in Table 1 [8,9,10,11,12,13,14,15], while there are few reports about the sensitivity of the responses correlated to the input parameters.

Table 1.
Summary of input parameter optimization studies from other scholars.
Meanwhile, with the development of industrial materials, borides, especially ternary borides, have attracted more attention because of their excellent properties. Their high melting point, perfect hardness, excellent wear resistance, good corrosion resistance, and superior resistance to high-temperature oxidation make them a remarkable material in industrial applications [16,17,18,19,20]. The prepared Mo2FeB2 coating can be applied in cutting tools and other machine parts. In our previous study, the fabricated Mo2FeB2 coating via laser cladding demonstrated excellent microhardness, wear resistance, and fracture toughness, owing to the dense structure and outstanding metallurgical bonding [4,21,22]. Among all the typical ternary borides, although Mo2FeB2 requires a simple preparation method and possesses superior mechanical properties [23,24,25], there are fewer reports about whether it can be used in the preparation of laser cladding coating.
This research aims at the preparation of Mo2FeB2 coating by laser cladding technology. In order to investigate the sensitivity of output responses (height, width, and dilution rate) to input parameters (laser power, scanning speed, and thickness of pre-placed powder), a full factorial 33 = 27 design was used to verify the sensitivity of the output responses to input parameters [26]. The research results provide guidance for parameter adjustment by sensitivity analysis of the responses to the input parameters, where the combined influence of the process parameters set on the coating properties can be unambiguously analyzed. The research outcomes also prove the feasibility of the Mo2FeB2 coating prepared via laser cladding, and present the Mo2FeB2 application to additive manufacturing, repairing of components, increasing the lifespan, and decreasing the manufacturing cost of high value parts.
2. Materials and Methods
2.1. Materials
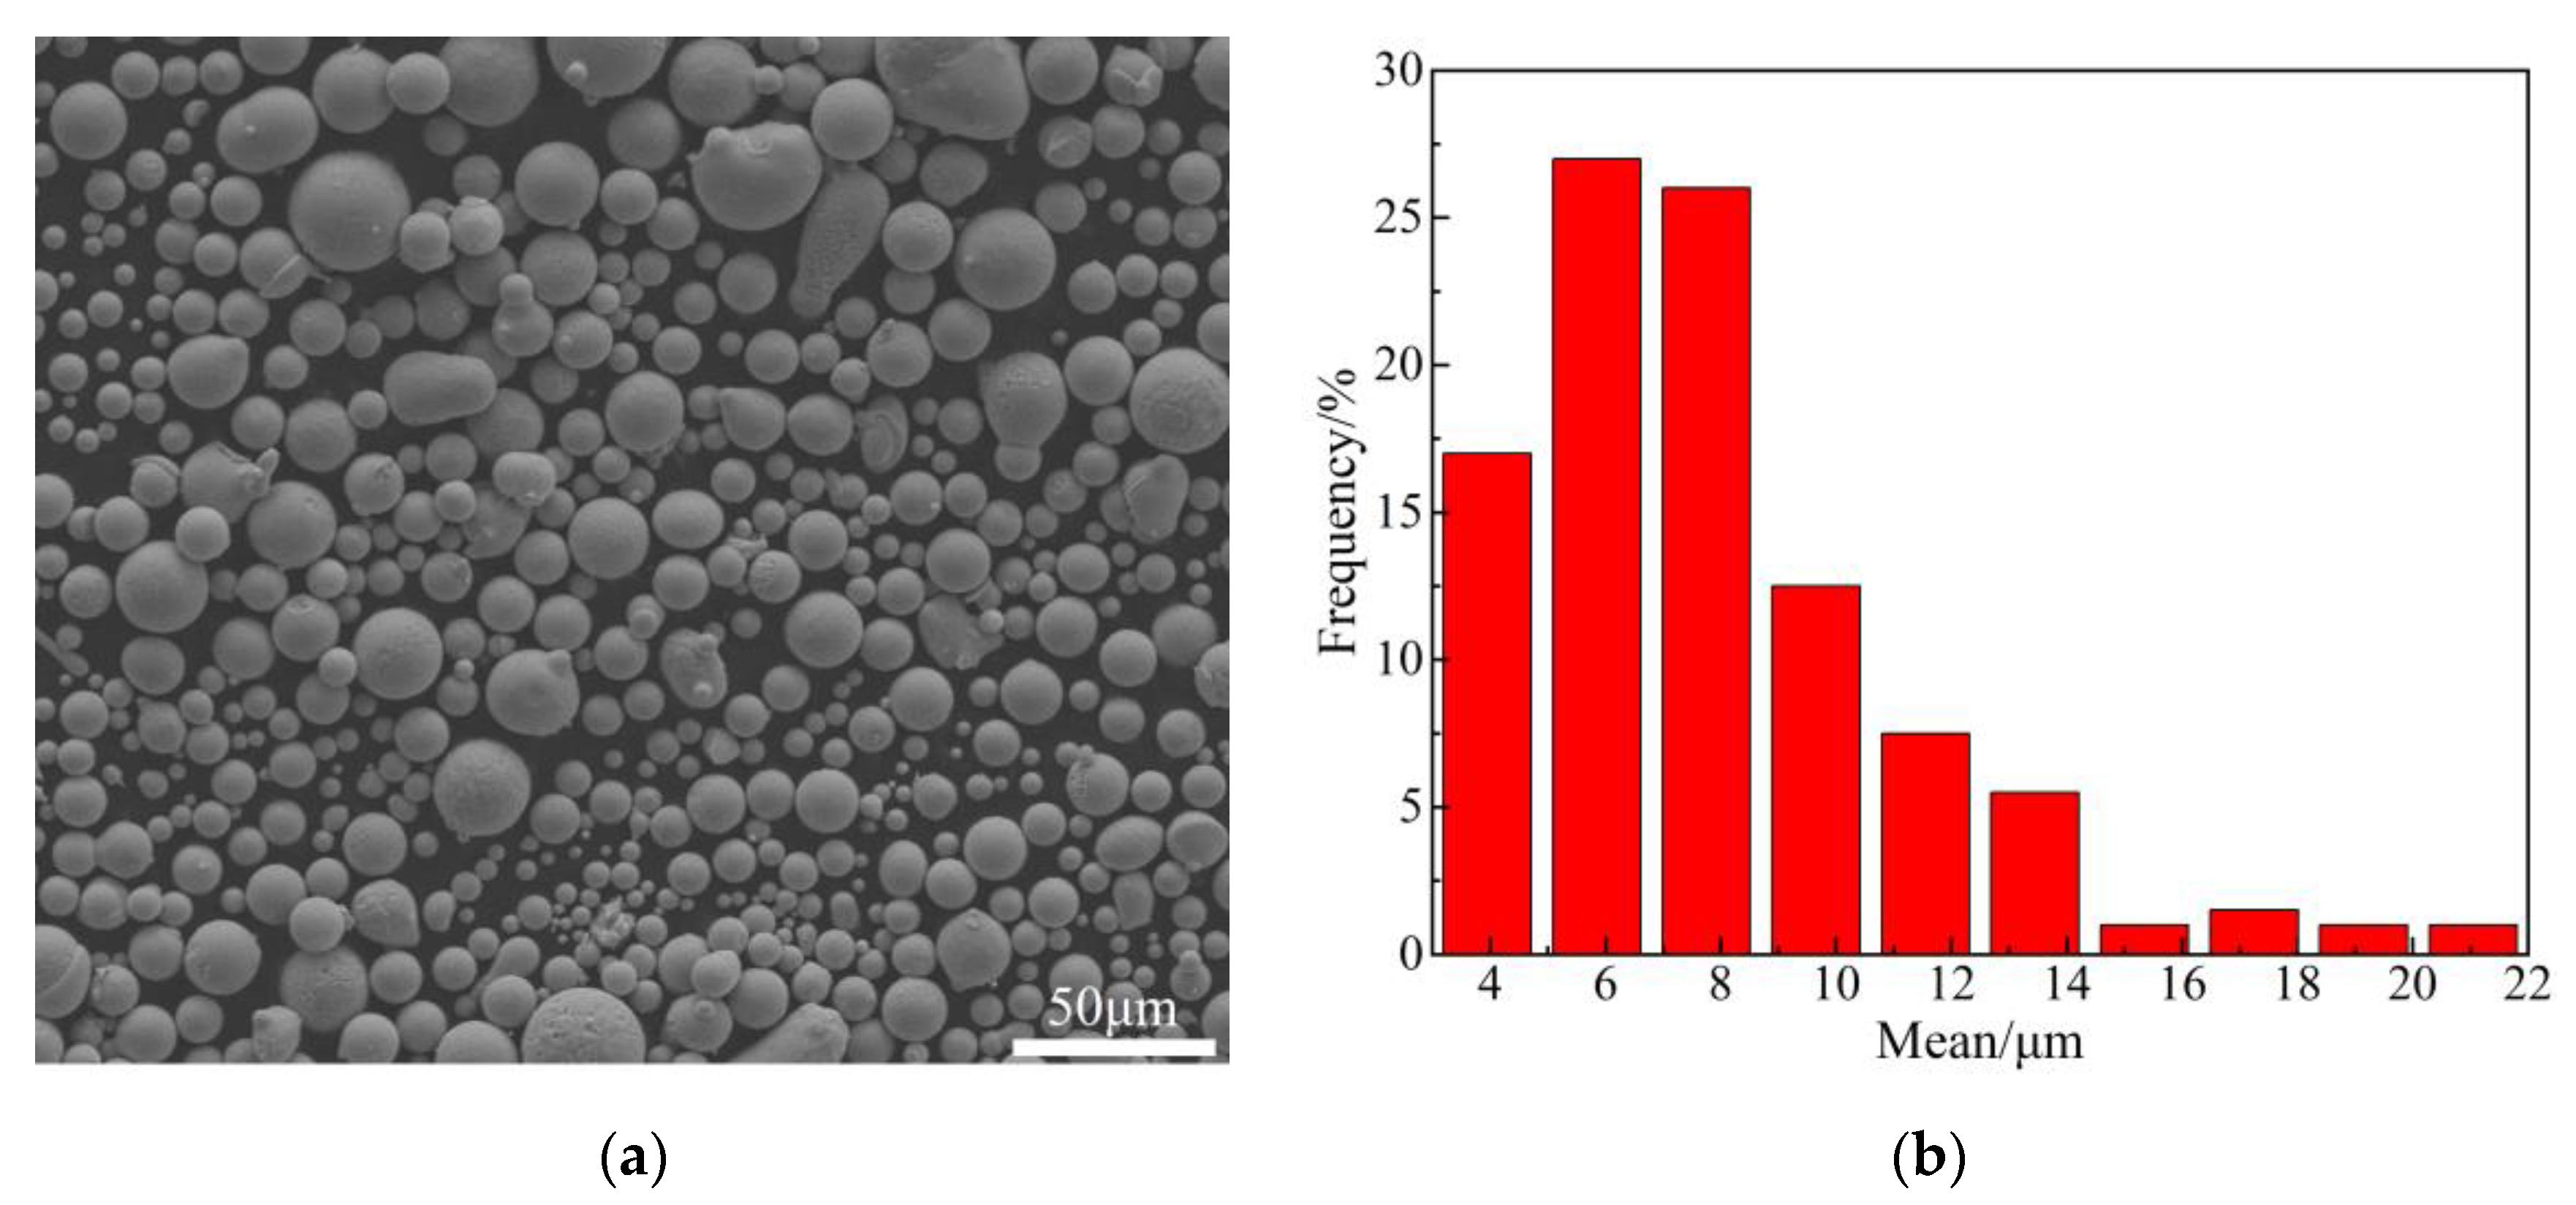
In this research, the AISI 1045 medium steel was selected as the substrate (40 mm × 20 mm × 10 mm). Its elemental composition is shown in Table 2. The cladding powder (Mo2FeB2) was prepared by the vacuum induction gas atomization method, and the powder composition, SEM morphology, and size distribution of Mo2FeB2 are shown in Table 3 and Figure 1ab. The Mo2FeB2 powder was supplied by Avimetal Powder Metallurgy Technology Co., Ltd. (Beijing, China).
Table 2.
Elemental composition (wt.%) of the AISI 1045 steel substrate.
Table 3.
Elemental composition (wt.%) of the Mo2FeB2 powder.
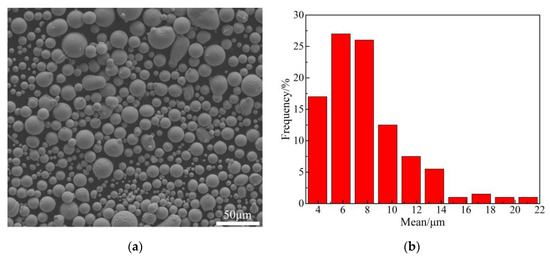
Figure 1.
(a) The SEM morphology of Mo2FeB2 powder; (b) size distribution of Mo2FeB2.
2.2. Laser Cladding Process
Before laser cladding, the surface of the substrate was cleaned with ethanol to remove the impurity, and 5 wt.% polyvinyl alcohol binder was added to the powder. Then the cladding powder was pre-placed as 1 mm thickness on the surface of the substrate under the pressure of 100 MPa for 1 min where the size of the substrate was 40 mm × 20 mm × 10 mm (length × width × height). Afterwards, both were placed in the vacuum dryer for an additional 2 h at a temperature of 120 °C.
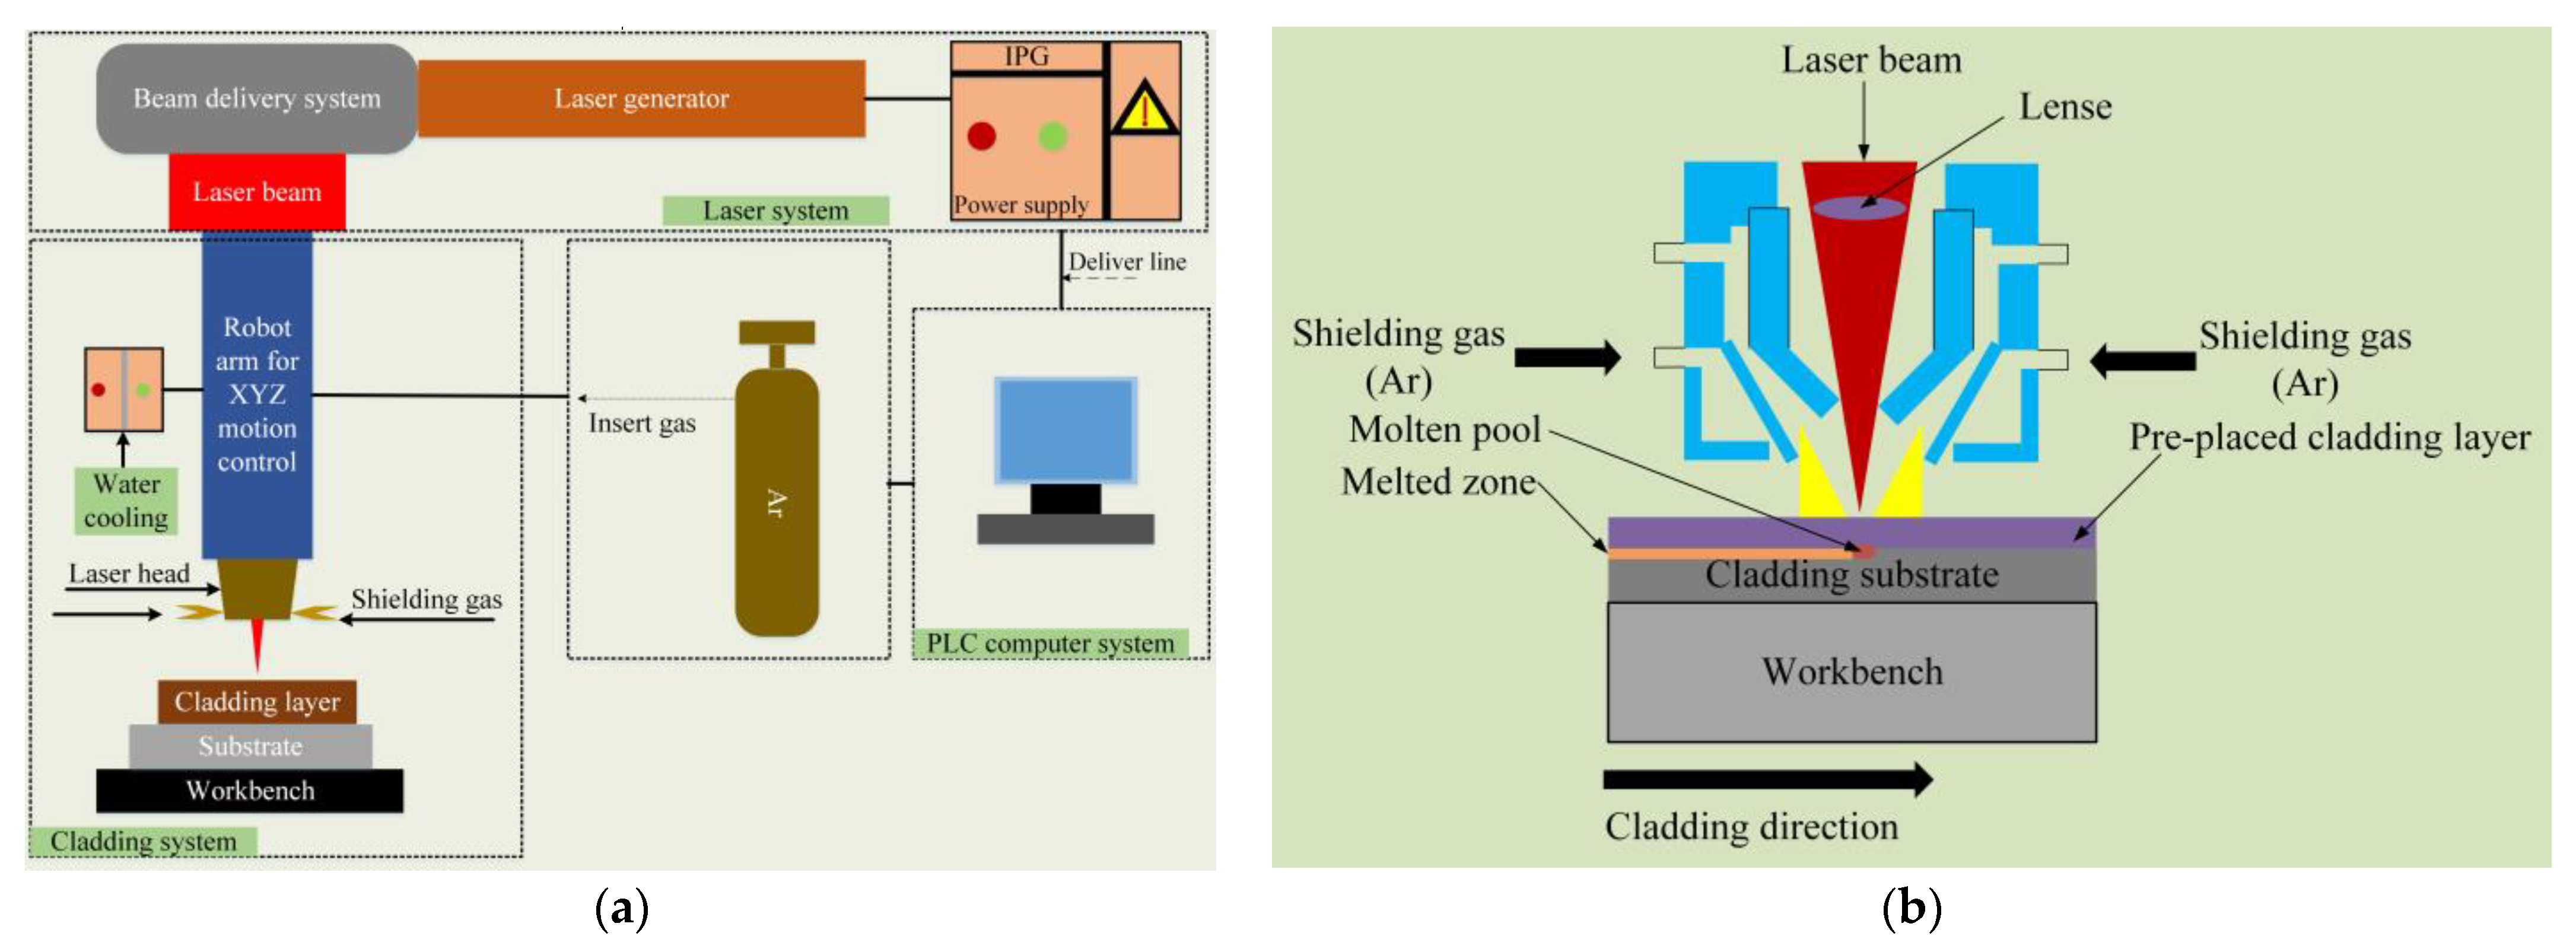
The laser cladding system (Figure 2a) was mainly composed of a laser system (YLS-3000, IPG, Burbach, Germany), cladding system (SX14-012PULSE, IPG, Burbach, Germany), water cooling system (TFLW-4000WDR-01-3385, Sanhe Tongfei, Sanhe, China), and PLC computer system (PLC, Mitsubishi, Tokyo, Japan). The cladding process was finished by the six-axis industrial robot (M-710iC/50, FANUC, Yamanashi, Japan). The pre-placed method of laser cladding is shown in Figure 2b. The laser spot diameter was set as 4 mm during the cladding process. The laser beam was generated in the laser system to irradiate the pre-placed cladding powder layer and the cladding substrate located on top of the workbench. A molten pool was formed under the high energy laser beam irradiation. An industrial robot was used to control the movement of the laser head with a selected scanning speed to complete the cladding process. Argon was used as the shielding gas during the cladding process. The experimental runs followed the 33 factorial design of three process parameters with three levels (Table 4), and 27 samples were fabricated.
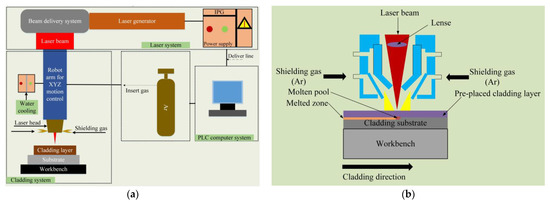
Figure 2.
(a) Schematic illustration of laser cladding system; (b) pre-placed powder method of laser cladding.
Table 4.
Parameter variables of laser cladding.
2.3. Characterization
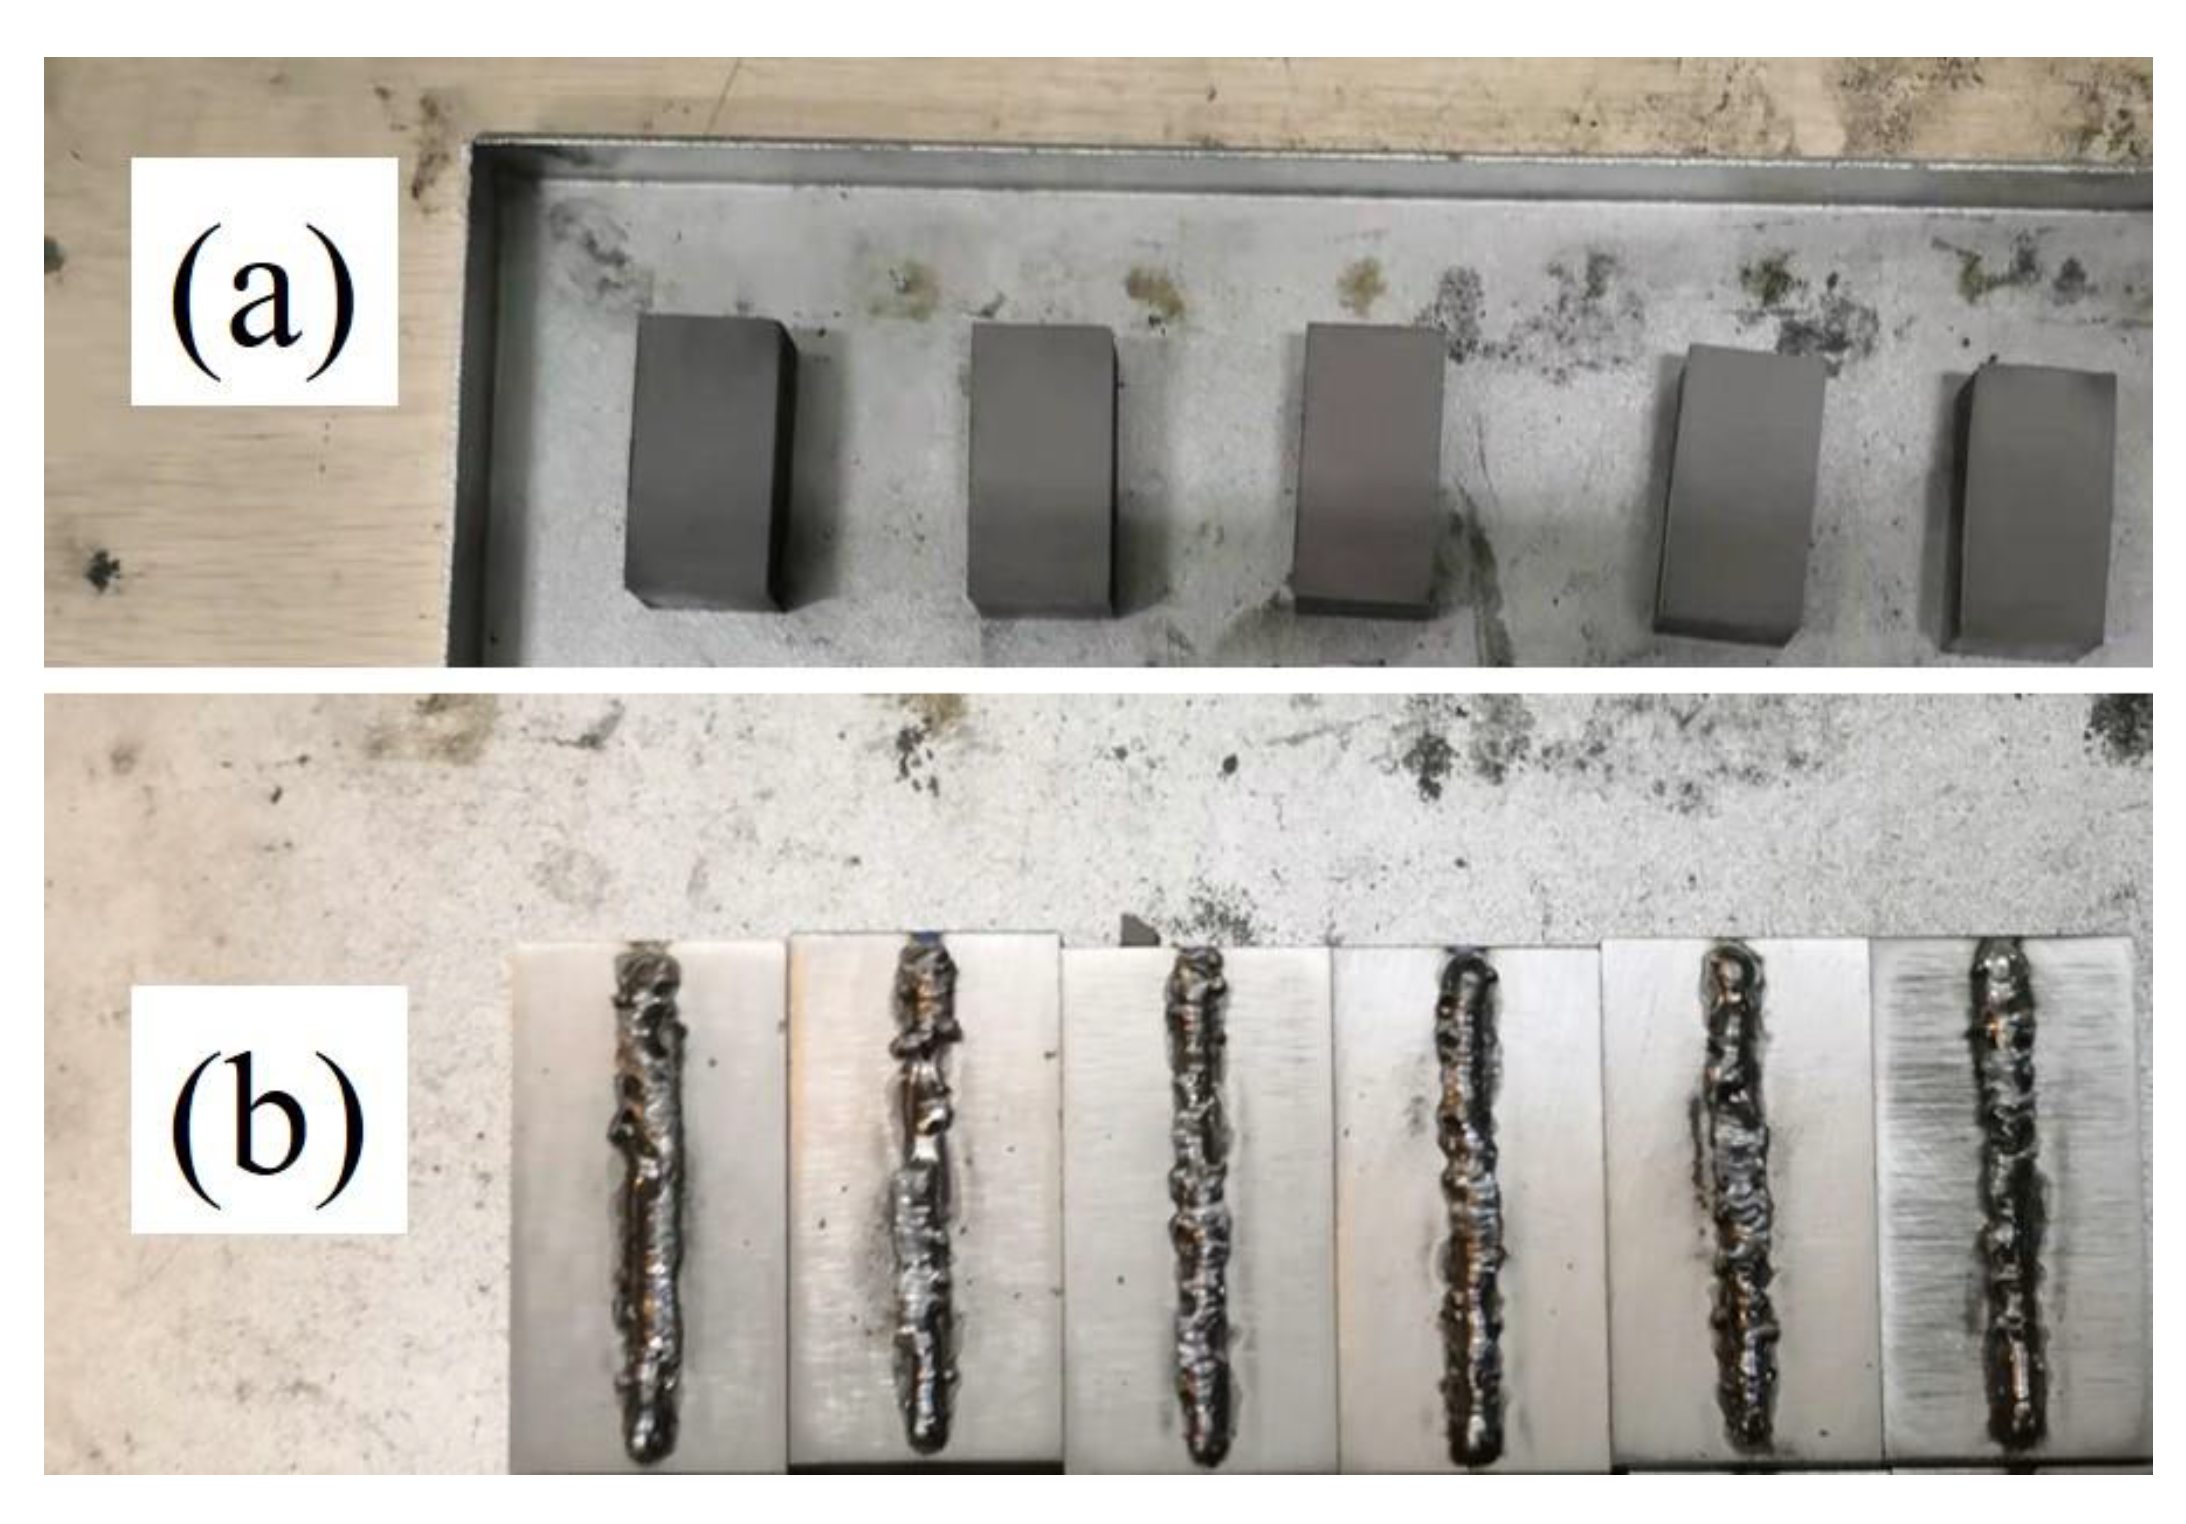
After the completion of laser cladding, the sample was cut into 10 mm × 5 mm × 5 mm blocks, and then the sample preparation for characterization was finished with setting, grinding, and polishing. The cross-section of samples was immersed in a 1:1:10 ratio of K3[Fe(CN)6]4:NaOH:H2O solution for 20 s, and then cleaned with alcohol by ultrasonic. Figure 3a shows the macro view of the uncoated samples and Figure 3b shows the macro view of the coated samples.

Figure 3.
(a) Macro view of the uncoated samples; (b) macro view of the coated samples.
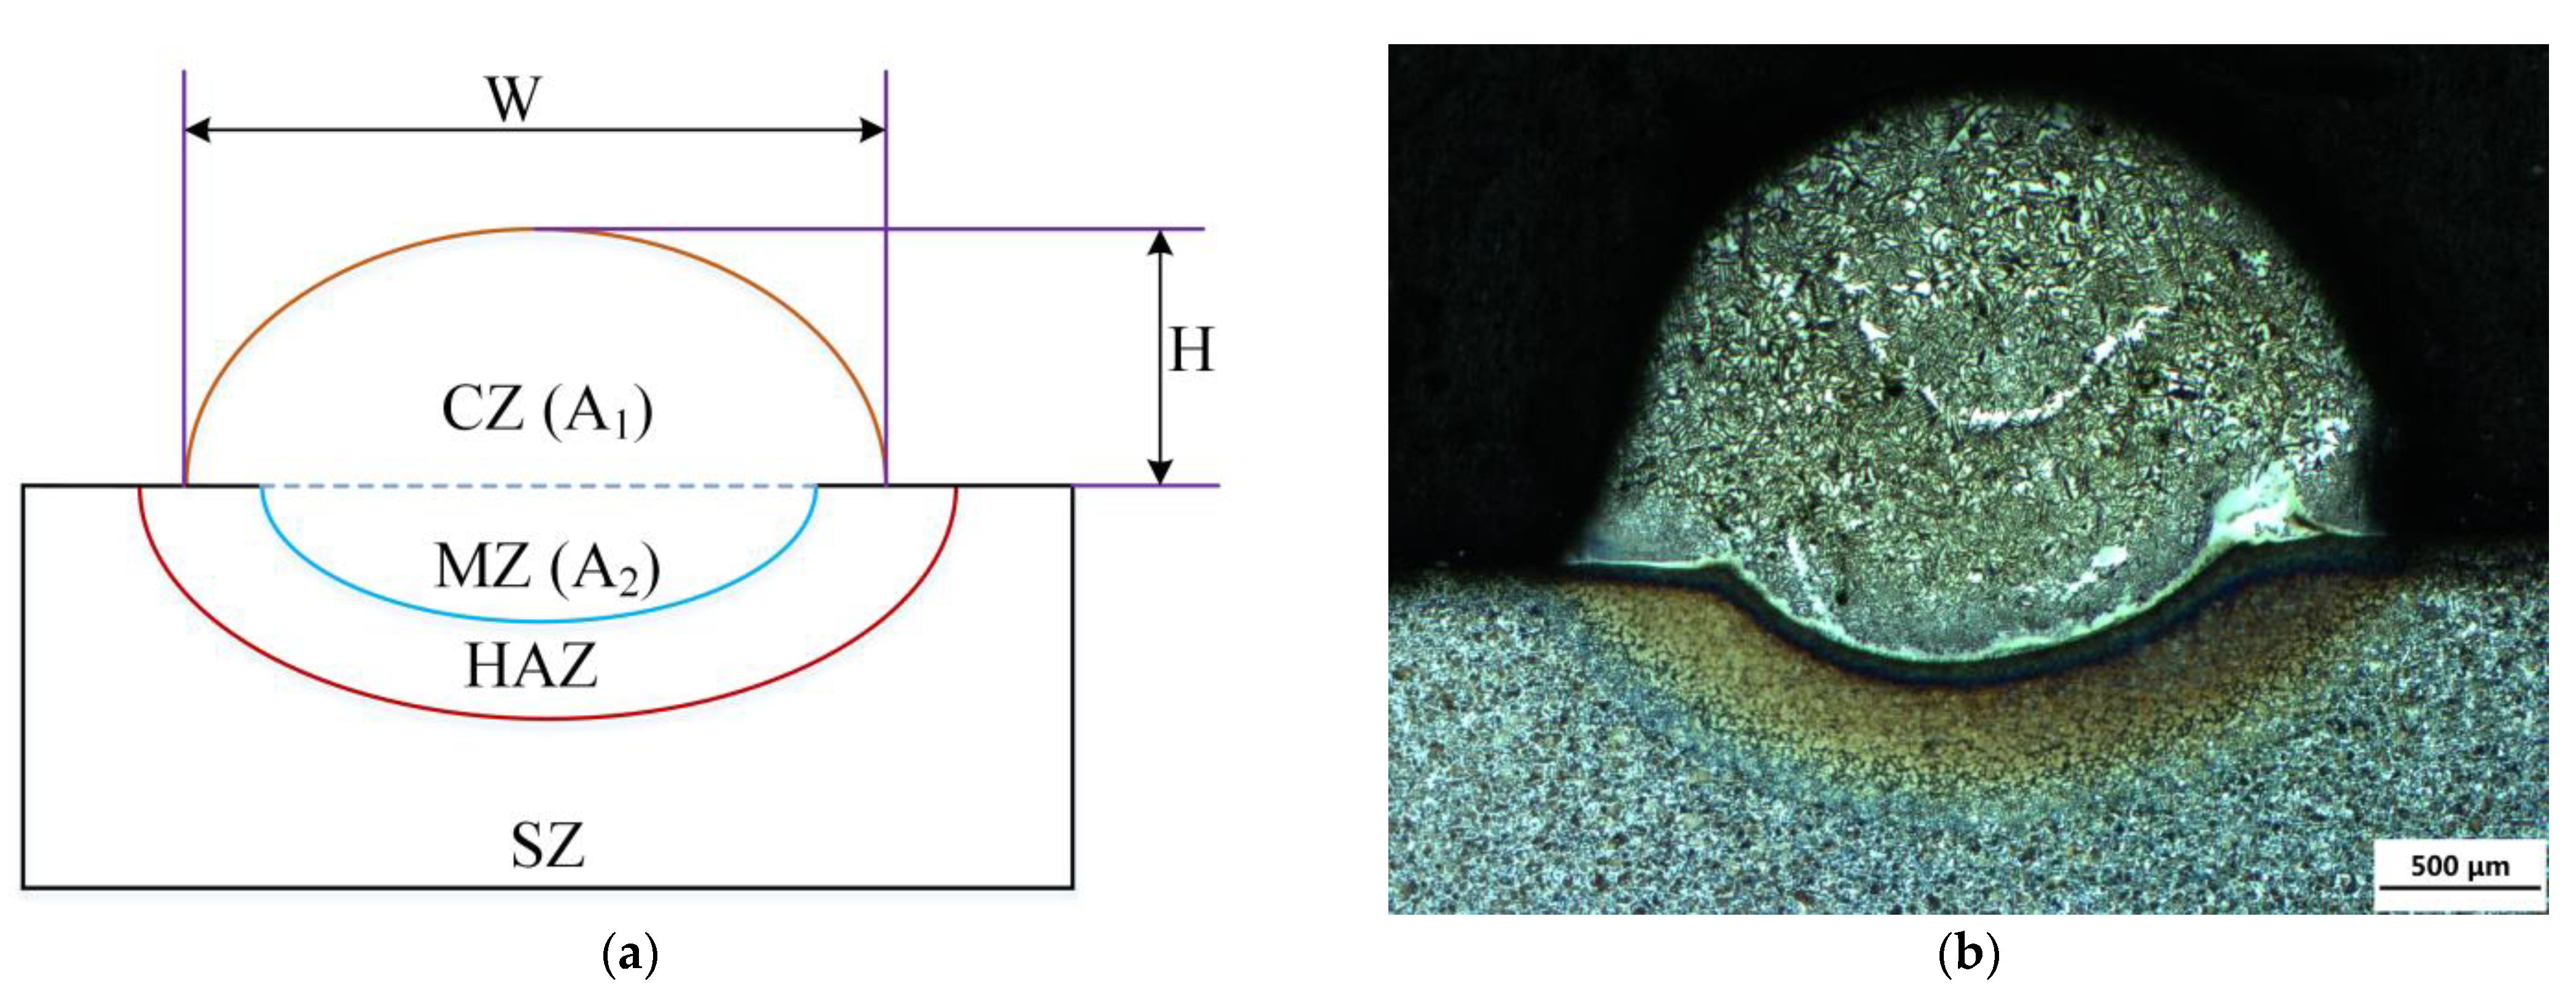
Afterward, the morphology of the coating was observed by the ZEISS Axio Plan2 Optical Microscope (OM) (Zeiss, Shanghai, China), and the image-Pro plus software was used to measure the height (H), width (W), and dilution rate (D = A2/A1 + A2) (Figure 4a,b), where CZ stands for coating zone, MZ denotes melted zone, HAZ represents heat-affected zone, and SZ is substrate. The geometric characteristics of the 27 obtained samples are shown in Table 5.

Figure 4.
(a) Schematic illustration of cross-sectional measurements of the clad; (b) cross-sectional morphology of Mo2FeB2 coating.
Table 5.
Geometric characteristics measured from obtained samples.
The microstructure of the coating was analyzed by a field emission scanning electron microscope (Nova 400 Nano SEM, FEI, Hillsboro, OR, USA) and field emission electron probe microanalyzer (FE-EPMA, EPMA-8050G, Shimadzu, Kyoto, Japan). The microhardness of the cross-section of the coating was measured by an HX-500 microhardness tester (Laizhou Yutong Test Instrument Co., Ltd., Laizhou, China) with a 500 g force applied for a 10-s duration.
3. Results and Discussion
3.1. Development of Empirical Models
The empirical models of laser cladding process parameters and coating geometry (H, W, and D) can be constructed with combination parameters (LPαSSβPTγ) [27]. The model can effectively predict the influence of the parameters on the laser cladding geometry (H, W, and D) [27,28]. Hence, the value of α, β, and γ can be calculated with regression analysis using the logarithmic function, and then the function expression such as yi = aLPαSSβPTγ + b can be constructed to analyze the sensitivity value of output responses to input parameters [29,30], where i is the output response (H, W, and D), while a and b are constant values. After calculation, the function expressions of different output responses are shown in Equations (1)–(3).
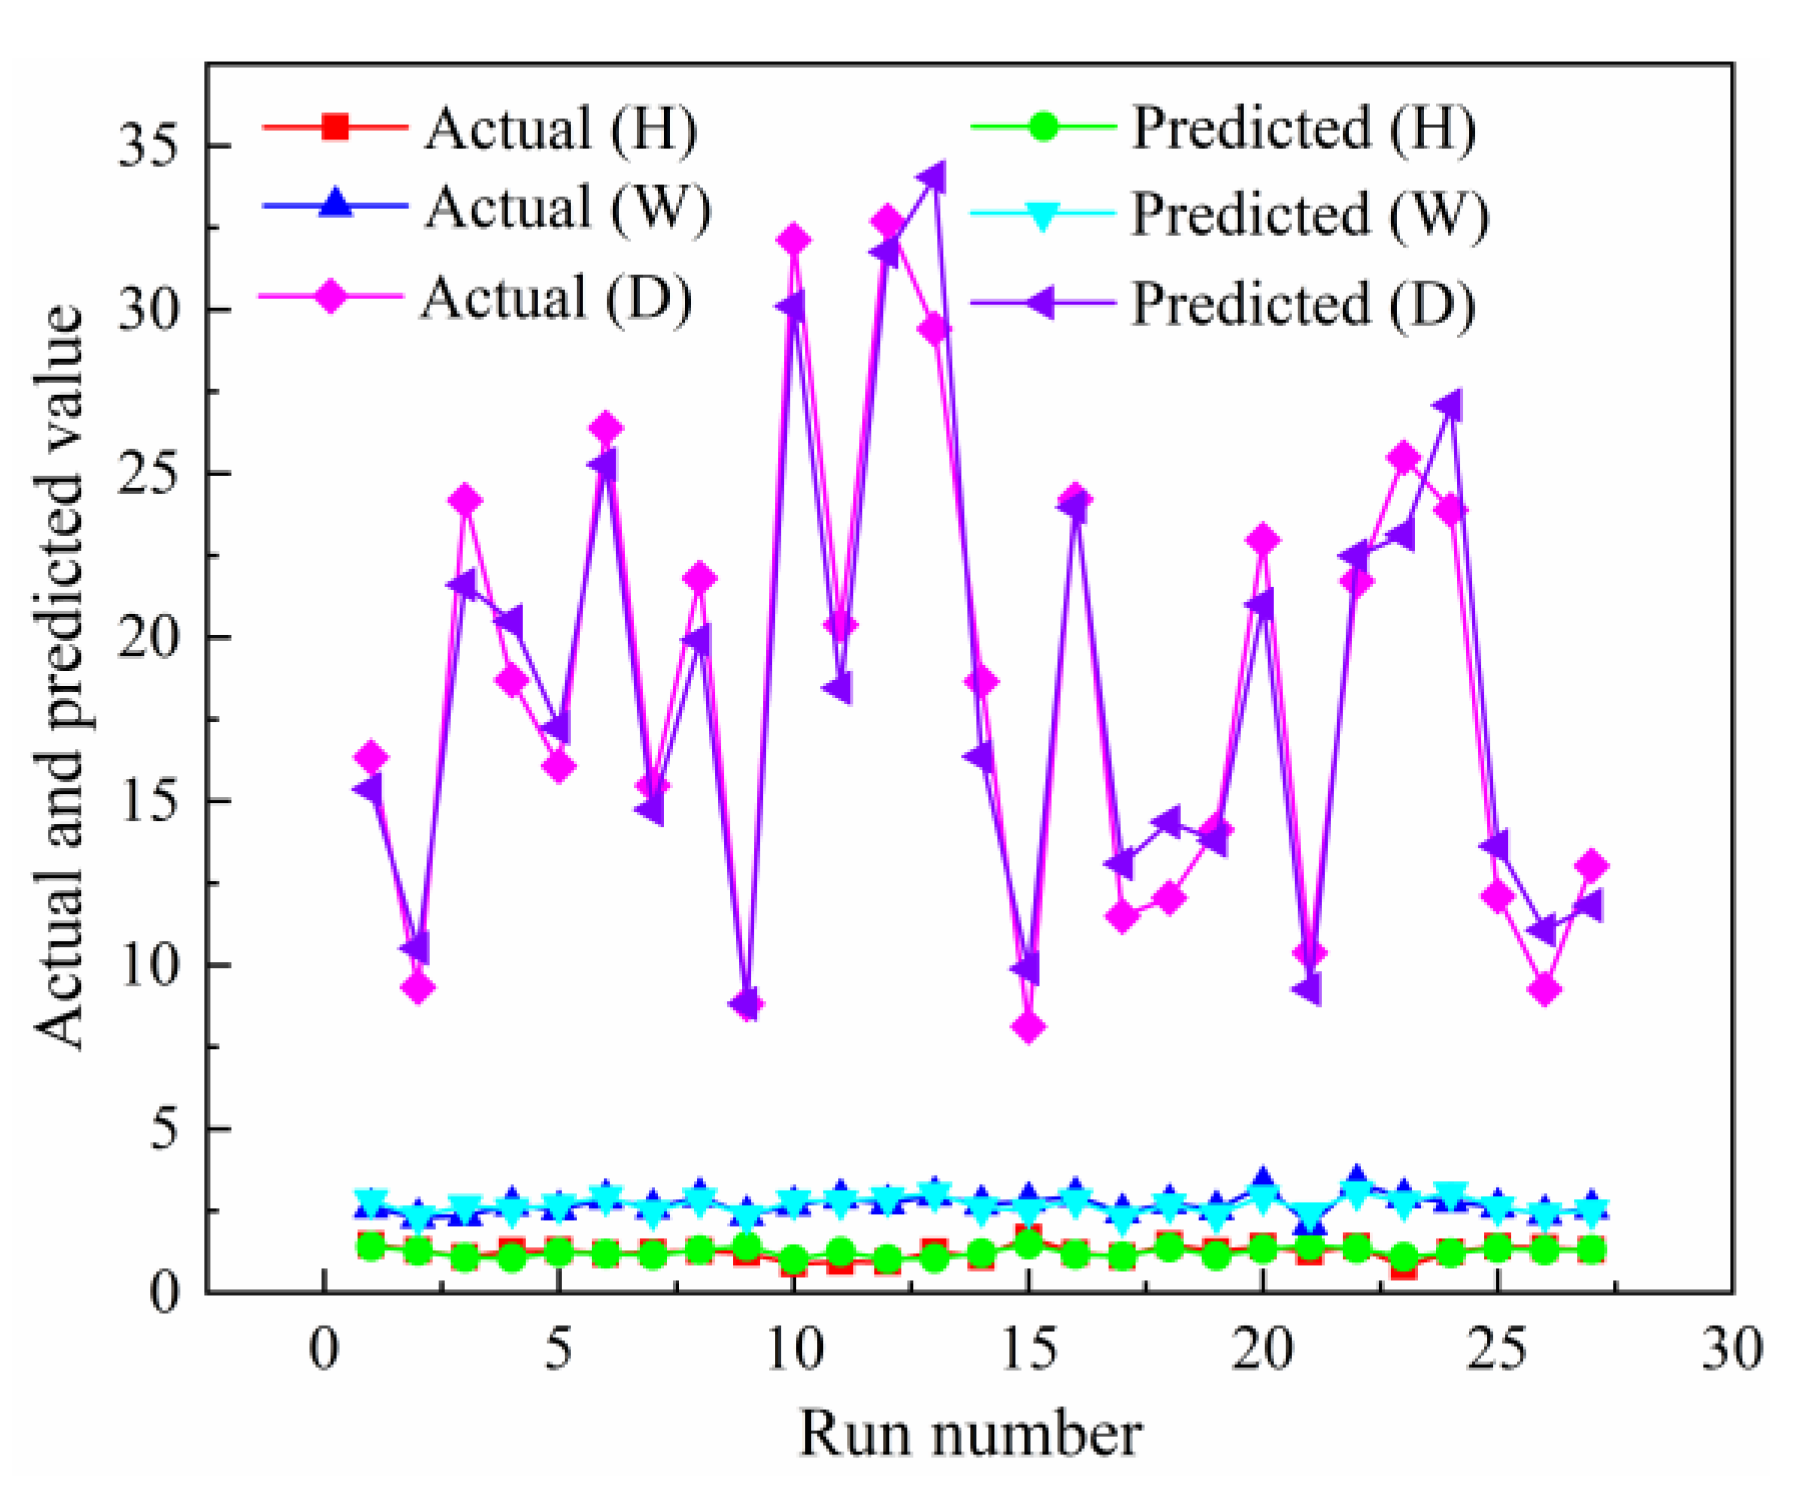
According to Equations (1)–(3), the relationship between the input parameters and output responses can be discussed. The actual values derived by the experiment and predicted values computed by Equations (1)–(3) are shown in Figure 5. It can be clearly seen that all the output responses fit well with the input parameters by the empirical models, shown by the close alignment between the actual and predicted values for each output response.

Figure 5.
Comparative chart for the actual and predicted value.
3.2. Influence of Parameters on Coating Geometry
The empirical models constructed in Section 3.1 indicated the relationship between the input parameters and output geometry. In terms of coating height, the laser power and scanning speed had a negative effect on the height, while the pre-placed thickness stated the opposite. Laser power determined the input energy on the powder and molten pool. When the laser power was increased, the height of the coating was reduced due to the flattening effect of gravidity under the same scanning speed and pre-placed thickness. The increased thickness of the pre-placed cladding layer led to an increased amount of powder melting, which resulted in an increase in the coating height. It is evident that the pre-placed thickness of powder was the most significant parameter for the coating height. According to the height model, it can be found that the scanning speed mostly had no significant impact on the height compared with laser power and the pre-placed powder thickness. The coating width increased with the increase in laser power and the pre-placed thickness of powder, yet the scanning speed showed the opposite correlation, and the laser power was the most significant impact factor on the coating width. Owing to the concentrated energy in the center area of the circular laser spot, melted powder flowed from the center to the surrounding sides. Hence, a high laser power can increase the laser energy absorption and expand the width. Similarly, a low scanning speed can extend the cladding time and powder fluidity to increase the width, while the pre-placed powder thickness had no significant impact on the width compared to that of the laser power and scanning speed.
The laser power and pre-placed thickness had a positive effect on the dilution rate, and the scanning speed had a negative effect on the dilution rate. The increase in laser power and decrease in scanning speed increased the area of the melting zone, as a result of the higher energy input and longer irradiation time of the laser energy. When the coating was prepared with a larger thickness of the pre-placed powder, it required more time to melt the powder. Hence, the area of the melting zone decreased, and the area of the coating increased, causing a decrease in the dilution rate.
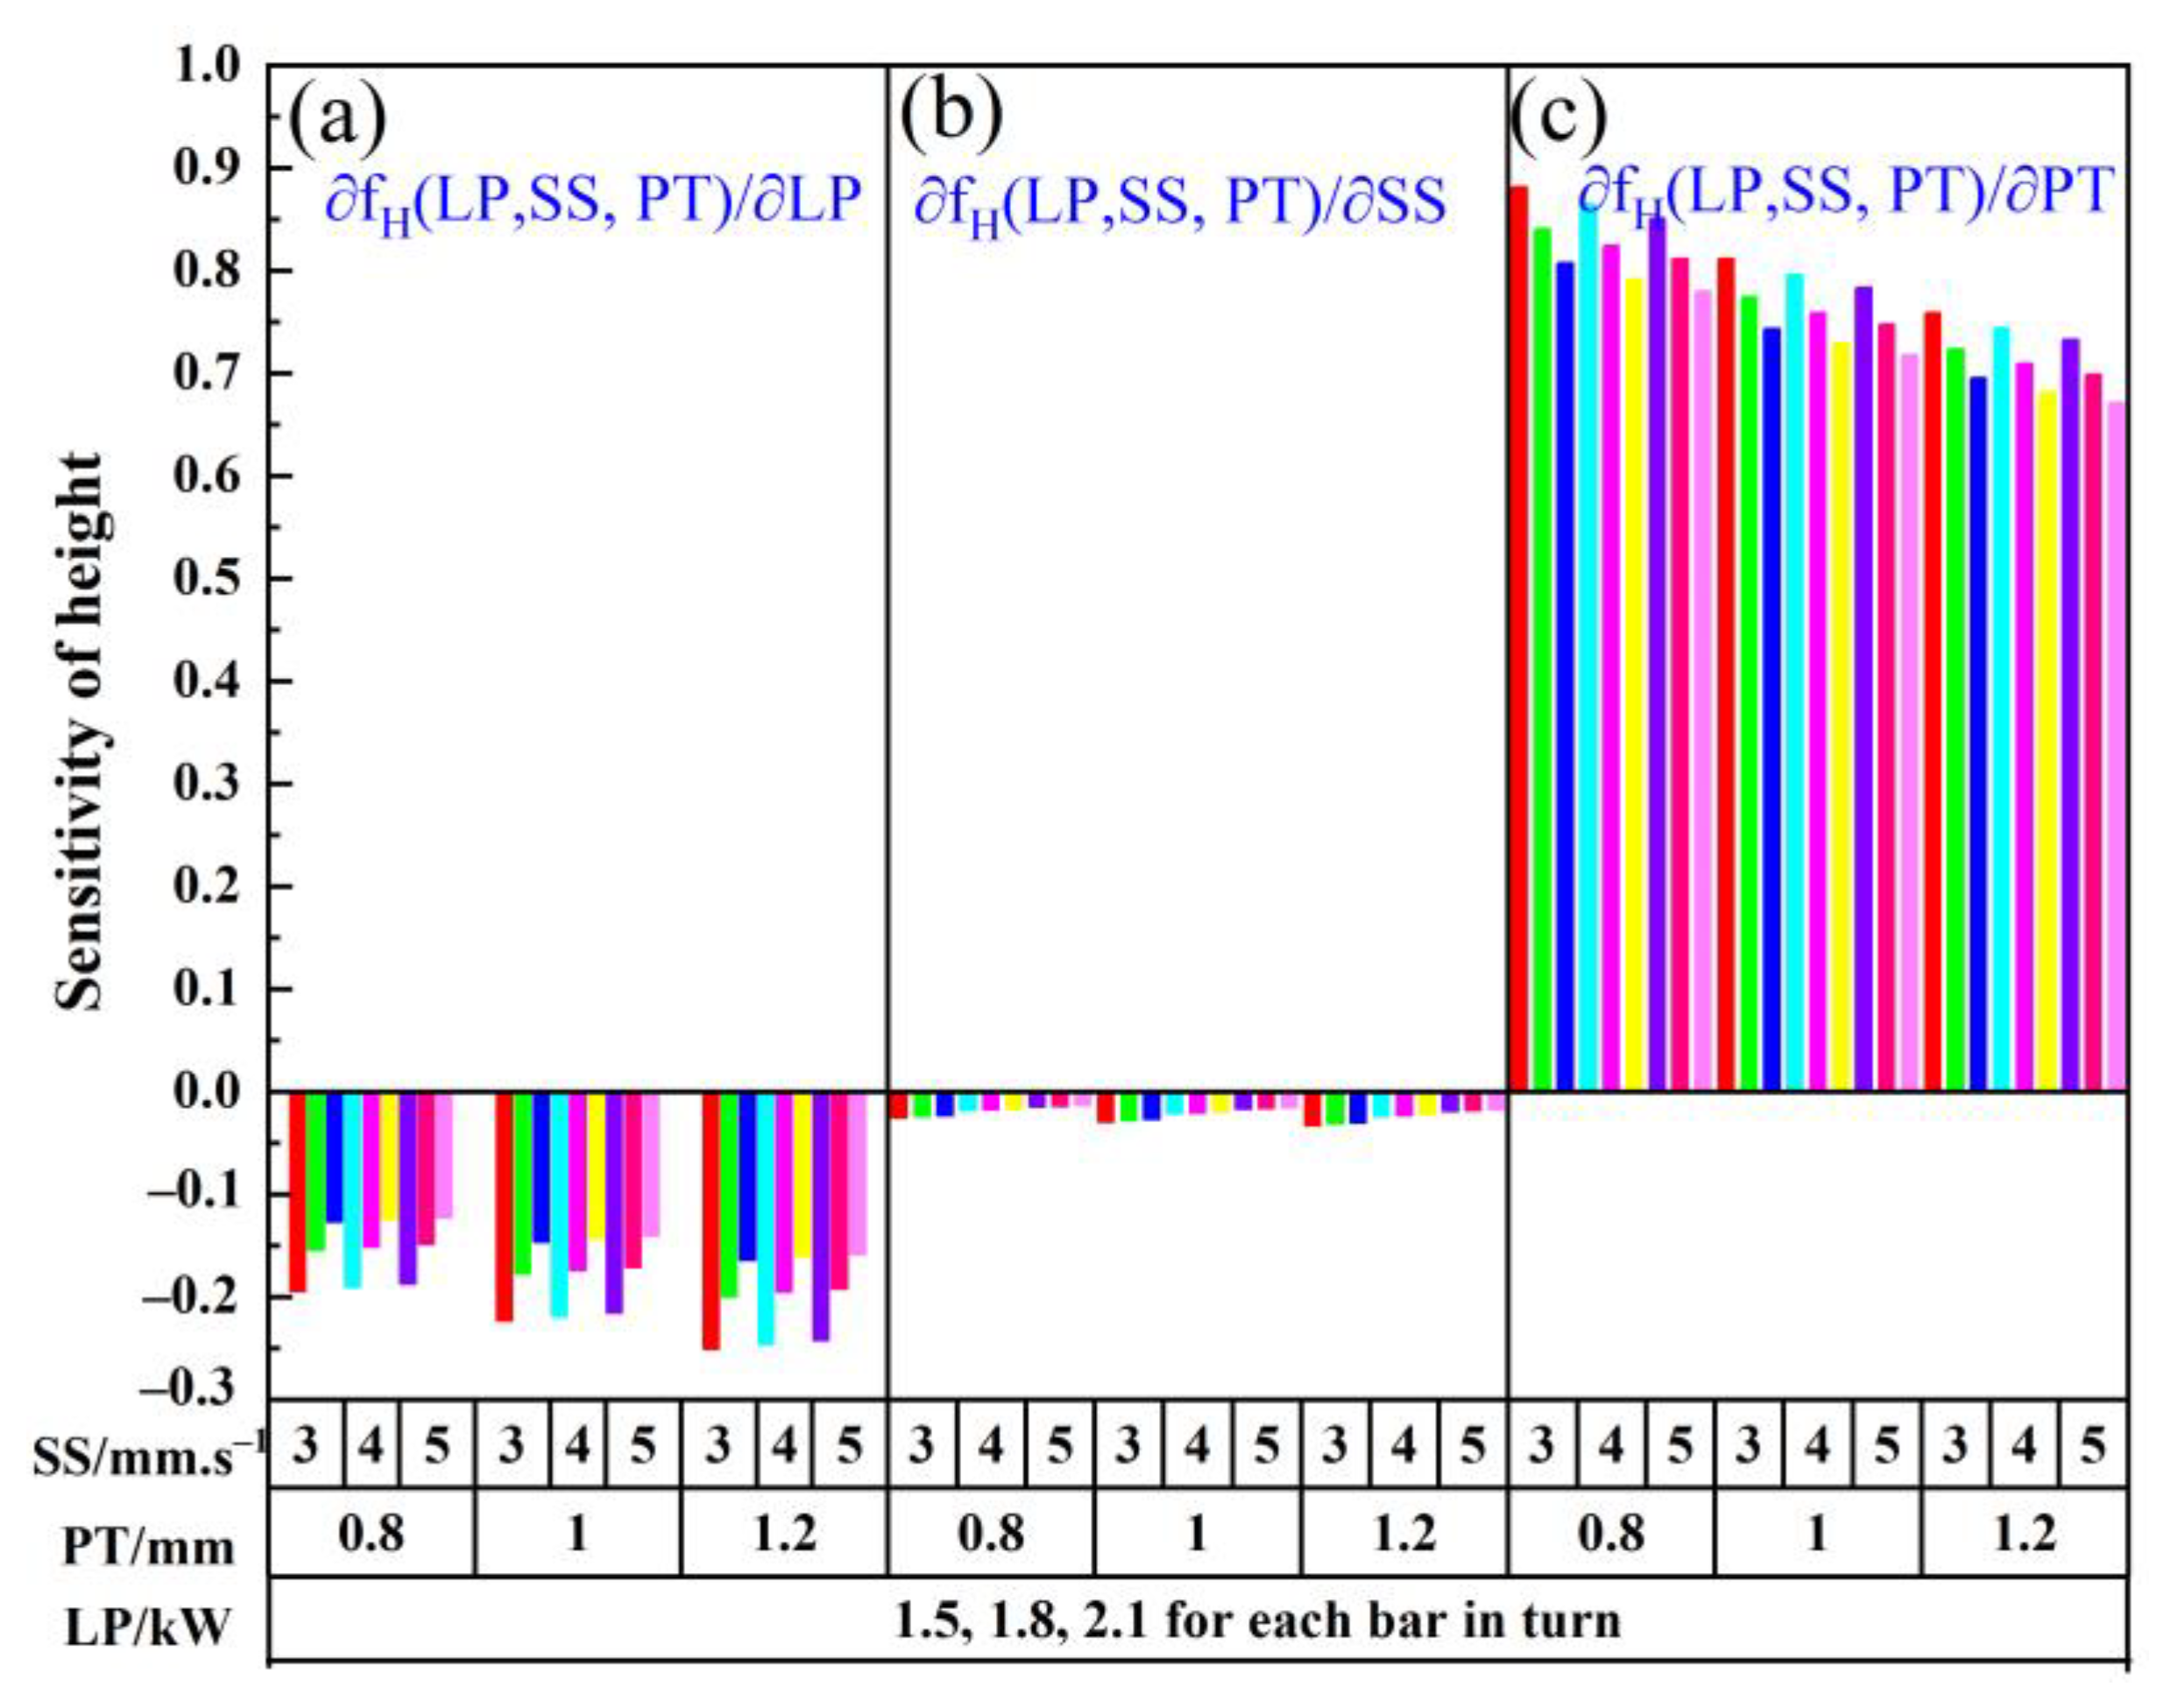
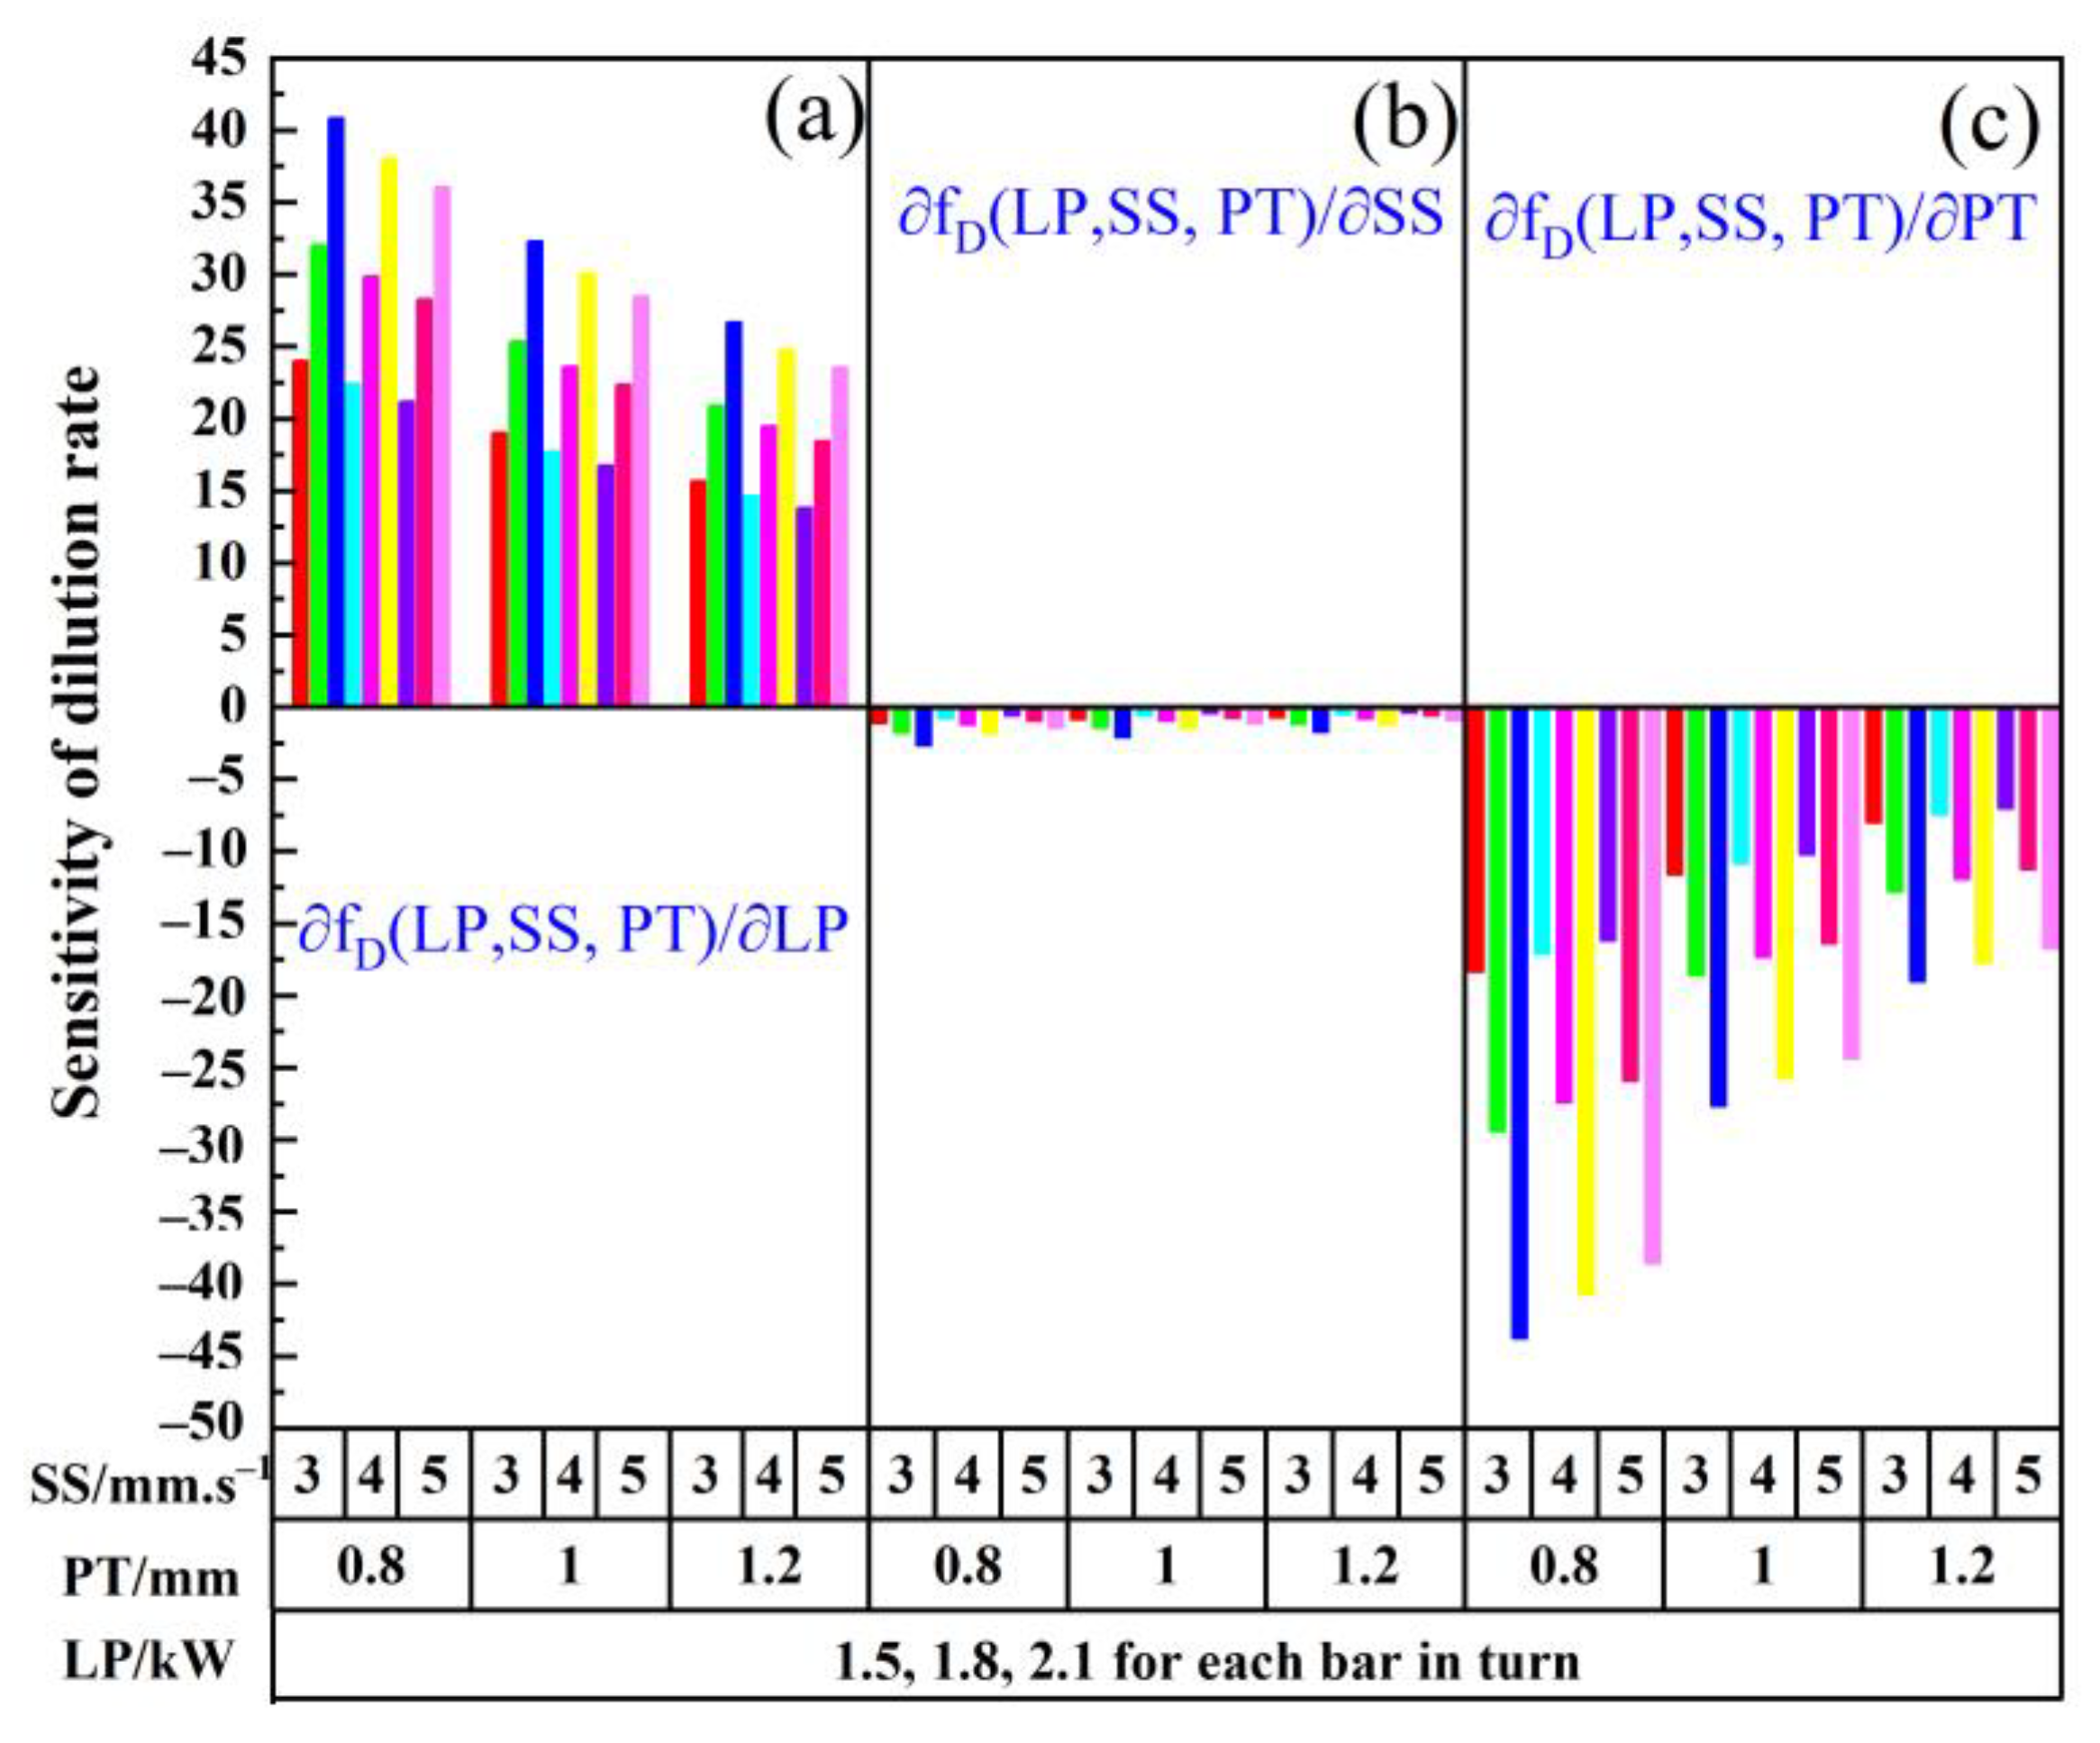
3.3. Sensitivity Analysis of Coating Geometry
The derivations of sensitivity from different input parameters for output geometries are shown in Equations (4)–(12), where Equations (4)–(6), Equations (7)–(9), and (10)–(12) are the sensitivity of height to different parameters, the sensitivity of width to different parameters, and the sensitivity of the dilution rate to different parameters, respectively [29,30].
The sensitivity analysis is used to disclose the change in output responses accounting from the input parameters. The results of the output responses to the input parameters are depicted in Figure 6, Figure 7 and Figure 8.
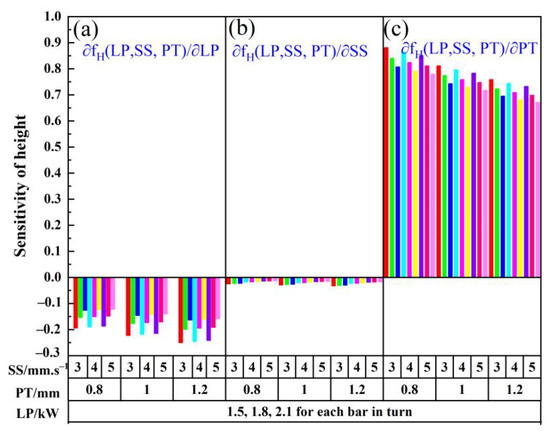
Figure 6.
Sensitivity of height to cladding parameters. (a) laser power; (b) scanning speed; (c) powder thickness.
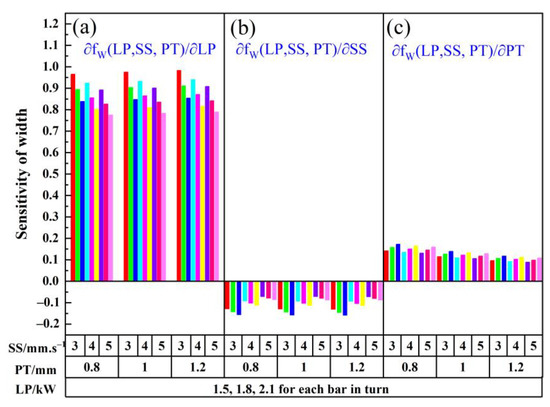
Figure 7.
Sensitivity of width to cladding parameters. (a) laser power; (b) scanning speed; (c) powder thickness.
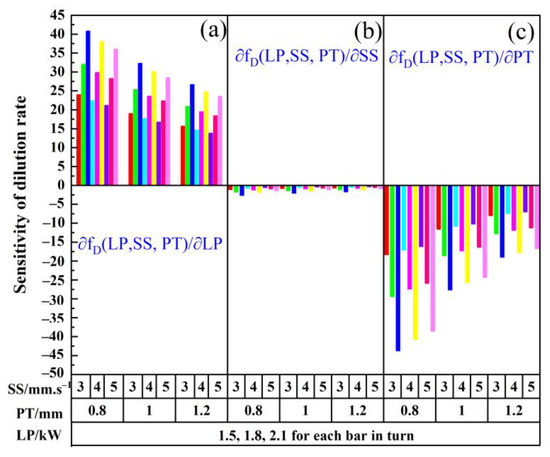
Figure 8.
Sensitivity of dilution rate to cladding parameters. (a) laser power; (b) scanning speed; (c) powder thickness.
As shown in Figure 6, it implies the sensitivity of the height to laser cladding parameters. It can be seen that the sensitivity of the height to laser power and thickness of the pre-placed powder were a lot greater than the scanning speed, which was consistent with the analysis results of Section 3.2. Since the height was more sensitive to the thickness of the pre-placed powder and laser power, the height can be effectively adjusted by adjusting the thickness of the pre-placed powder and laser power. The sensitivity value of the height to laser power and scanning speed was negative, while the thickness of the pre-placed powder was positive. The sensitivity of the height to laser power decreased with the increasing laser power and increased with the increasing thickness of pre-placed powder (Figure 6a). In other words, the highest sensitivity of height can be obtained under a relatively low laser power (1.5 kW), relatively low scanning speed (3 mm/s), and relatively large thickness of pre-placed powder (1.2 mm). As depicted in Figure 6b, the height was not sensitive to the scanning speed. Thus, the adjustment of the scanning speed cannot effectively control the change in height. It is noticed from Figure 6c that laser power, scanning speed, and the thickness of the pre-placed powder had positive effects on the sensitivity of the height to the thickness of the pre-placed powder. The maximum sensitivity of the height to the thickness of the pre-placed powder can be found at a relatively low laser power (1.5 kW), relatively low scanning speed (3 mm/s), and relatively small thickness of the pre-placed powder (0.8 mm).
It is obvious that laser power and the thickness of pre-placed powder had a positive effect on the sensitivity of width, whereas the scanning speed had a negative influence. Laser power displayed the most sensitivity on the change in width. The change in laser power can effectively adjust the width to determine the forming quality of the coating.
As shown in Figure 7a, it is apparent that the sensitivity of the width to the laser power decreased with the increasing of laser power and scanning speed, while it increased with the increasing of the pre-placed thickness of powder. The results predict that a maximum sensitivity of width to laser power can be observed at a lower laser power (1.5 kW), a lower scanning speed (3 mm/s), and a larger thickness of pre-placed powder (1.2 mm). Figure 7b reveals the effect of sensitivity to scanning speed with the input parameters. The sensitivity of width had a negative effect with increasing scanning speed. On the contrary, the sensitivity of width had a positive effect with increasing laser power and the thickness of the pre-placed powder, which indicates that a maximum sensitivity of width can be acquired at a higher laser power (2.1 kW), larger thickness of pre-placed powder (1.2 mm), and lower scanning speed (3 mm/s) combination. The sensitivity of the width to thickness of the pre-placed powder is shown in Figure 7c. The sensitivity increased with the increase in the laser power, and the scanning speed and thickness of the pre-placed powder showed the opposite phenomenon. Thus, the combination of 2.1 kW laser power, 3 mm/s scanning speed, and 0.8 mm pre-placed powder thickness was obtained to be more sensitive input parameters for width.
It can be noticed that the laser power sensitivity of the dilution rate was positive, while the scanning speed and thickness of the pre-placed powder were a negative sense of the dilution rate. As shown in Figure 8, the increase in laser power and decrease in pre-placed powder thickness can increase the dilution rate of coating; the scanning speed had no significant influence on the dilution rate. It is clearly found that the change in laser power and thickness of pre-placed powder were more sensitive to the dilution rate, while the change in scanning speed cannot be effectively utilized to adjust the dilution rate of the coating
According to Figure 8a,c, it can be noticed that the sensitivity of the dilution rate to laser power and thickness of the pre-placed powder had a similar tendency. The sensitivity of the dilution rate increased with the increase in laser power, and decreased with the increasing scanning speed and thickness of the pre-placed powder. Namely, a combination of higher laser power (2.1 kW), lower scanning speed (3 mm/s), and pre-placed thickness of powder (0.8 mm) can bring a maximum sensitivity of the dilution rate.
3.4. Microstructure and Properties Analysis
In order to further analyze the influence of parameters combination sensitivity to microstructure and properties, the microstructure and properties analysis of different coatings are discussed as follows (Table 6). The specimens were fabricated with processing parameters in Table 6, according to the sensitivity analysis of height, width, and dilution rate in Section 3.3.
Table 6.
Different specimens for analysis of microstructure and properties.
Figure 9 shows the microstructure of different coatings with different combination parameters, focusing on the effect of laser power and the thickness of pre-placed powder. Coatings obtained from different laser powers (Figure 9a vs. Figure 9c, Figure 9b vs. Figure 9d) exhibited a visible difference in hard phase morphology. The S1 coating showed fewer slender hard phase grains than that of S3 coating, and a similar influence can also be noticed from the comparison between the S2 and S4 coatings. The content of the hard phase can significantly enhance the microhardness of coating. On the one hand, a high laser power-induced high laser input energy absorbed by the molten pool, and an increased convection time of the molten pool accelerated the growth of hard phase grains, which resulted in the generation of slender hard phase grains in the coating (Figure 9c,d). According to the Hall–Petch theory, a higher hardness can be obtained by finer grains, also known as fine grain strengthening. On the other hand, the nucleated hard phase grains continued to grow until the end of the laser cladding process under the action of the remaining energy in the coating. As a result of the hard phase grains continuing to grow in a certain direction, multiple nucleation points staggered, formed slender hard phase particles, and decreased the density and properties of the coating.
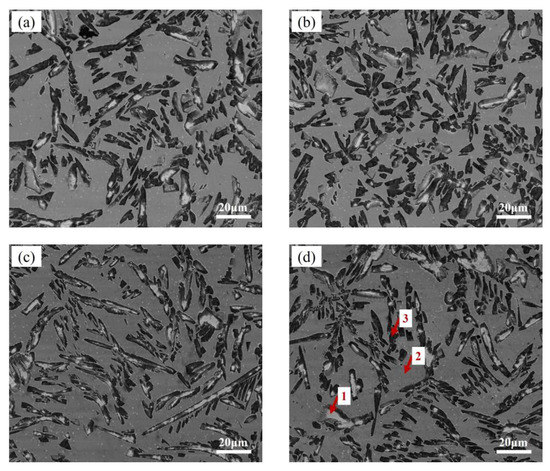
Figure 9.
The microstructure of different coatings: (a) S1; (b) S2; (c) S3; (d) S4.
However, coatings obtained with the same laser power and different thickness of pre-placed powder (Figure 9a vs. Figure 9b, Figure 9c vs. Figure 9d) showed a decrease in abnormally grown hard phase grains with increasing thickness of pre-placed powder. A large value of the pre-placed powder thickness can increase the amount of cladding powder and requires more energy to melt the powder and nucleate the Mo2FeB2 hard phase. Hence, the ability of laser energy to penetrate through the pre-placed powder decreased with a larger pre-placed powder thickness. The hard phase grains in the coating did not receive sufficient time to grow, decreasing the size of the Mo2FeB2 hard phase to improve the properties of the coating.
Table 7 shows the elemental distribution of different structures in Figure 9d. The bright white structure had a higher Mo content. Hence, it was mainly composed of Mo2FeB2 and traces of carbides. The gray structure had a higher Fe content; the primary phases were (Cr-Fe-Ni-C), (Fe, Cr), Fe3C, and Fe7Ni3. While the dark structure of point 3 had a higher C and Fe content, it was therefore composed of carbides and Mo2FeB2, where the Mo2FeB2 differed from the Mo2FeB2 phase of point 1. The element distribution in Figure 10 verified the results of Table 7.
Table 7.
EDS results of different points in Figure 9d (wt.%).
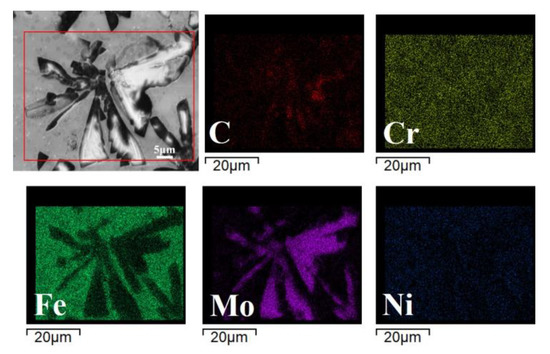
Figure 10.
Mapping results of elements of S4 coating.
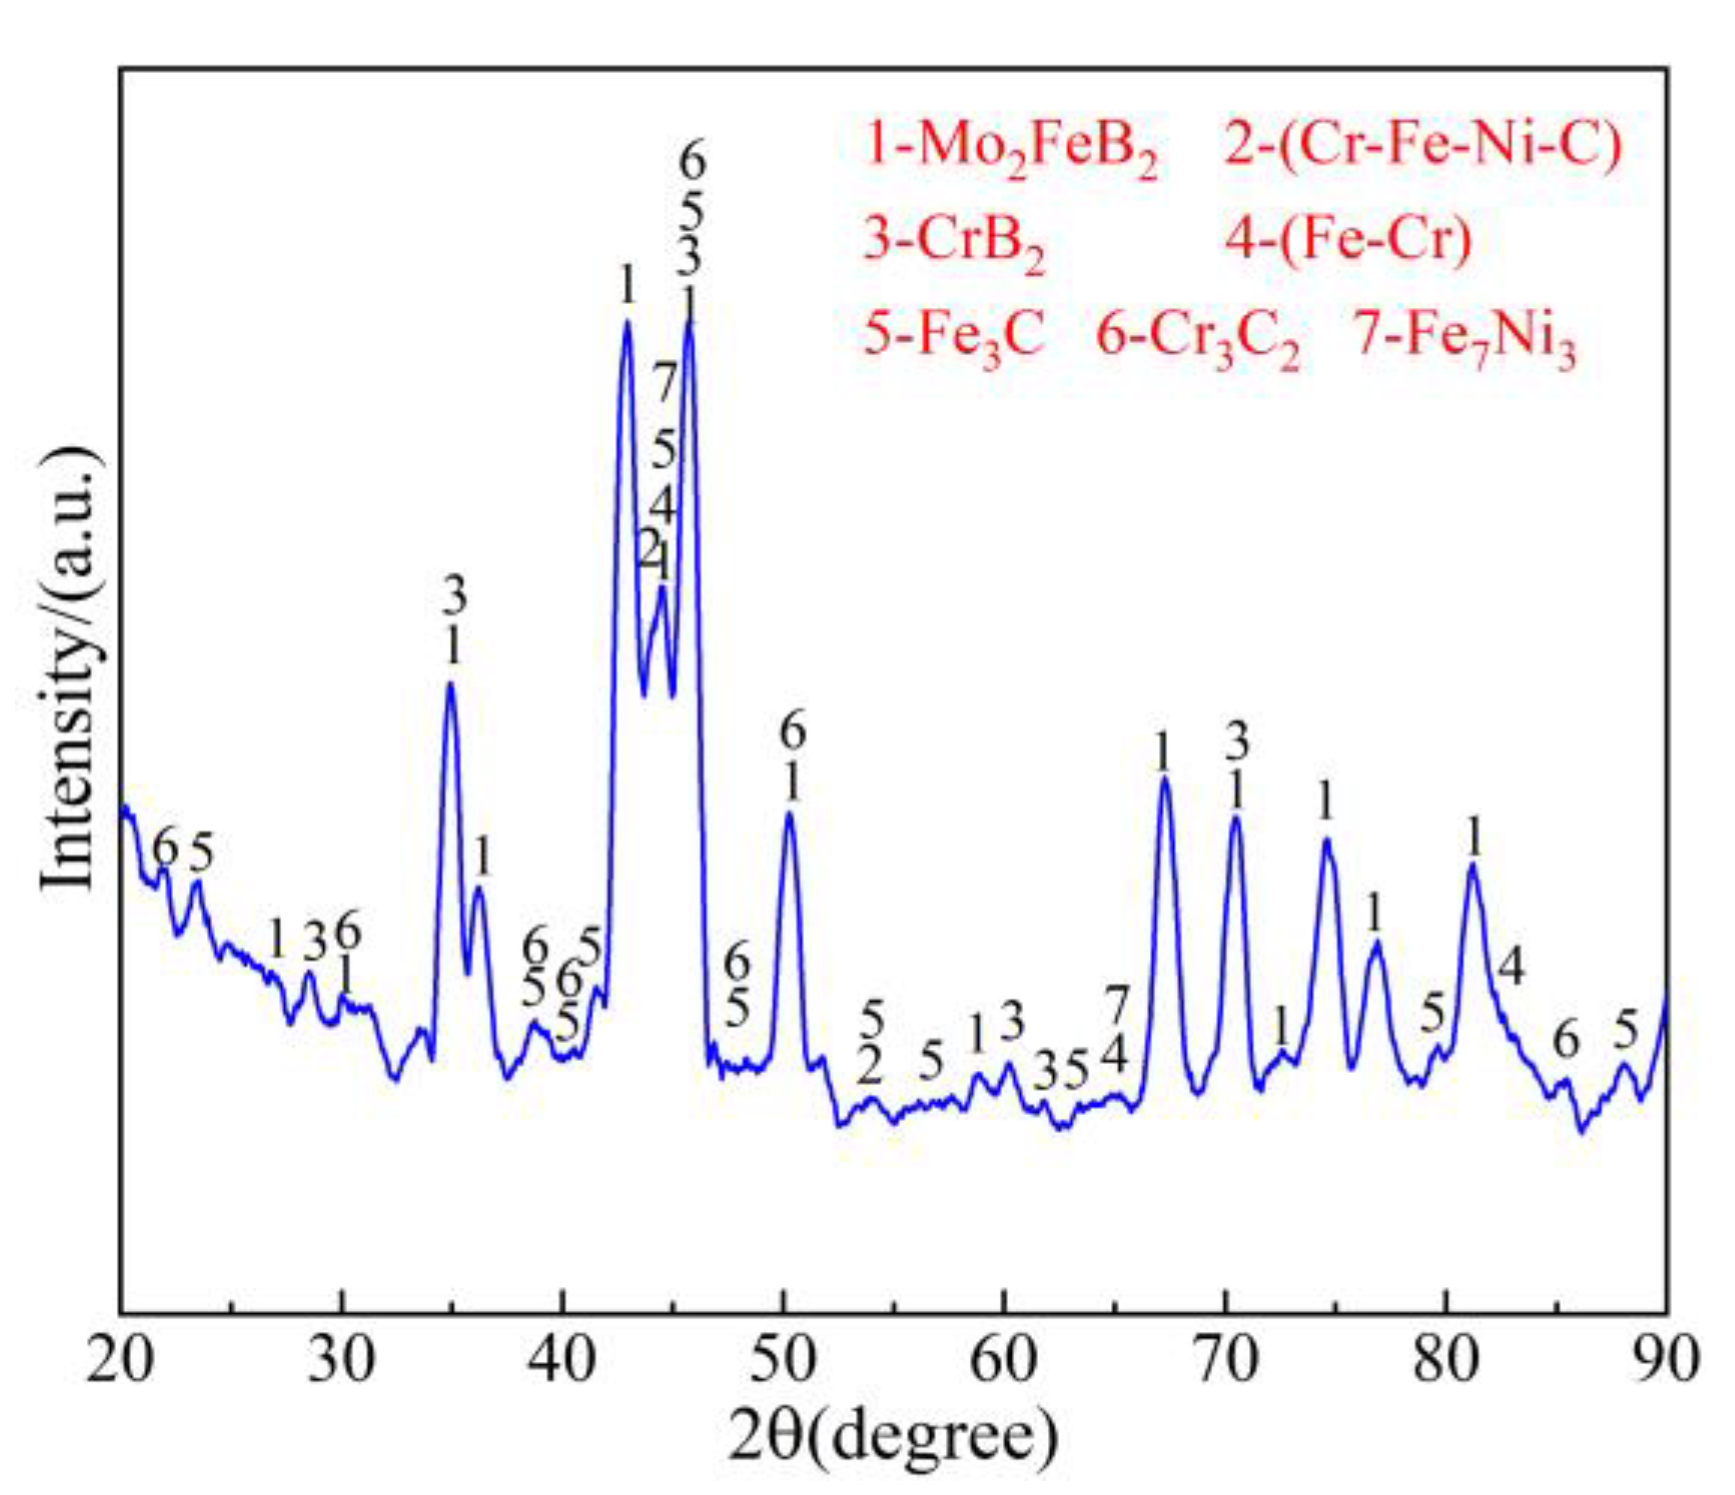
Figure 11 shows the XRD pattern of the Mo2FeB2 coating. It can be noticed that the coating was composed of hard phases of Mo2FeB2, CrB2, Fe3C, and Cr3C2. These hard phases can significantly improve the microhardness of the coating. Additionally, there were traces of solid solutions of (Cr-Fe-Ni-C) and (Fe, Cr), which could increase the microhardness of the coating by solid solution strengthening [4].
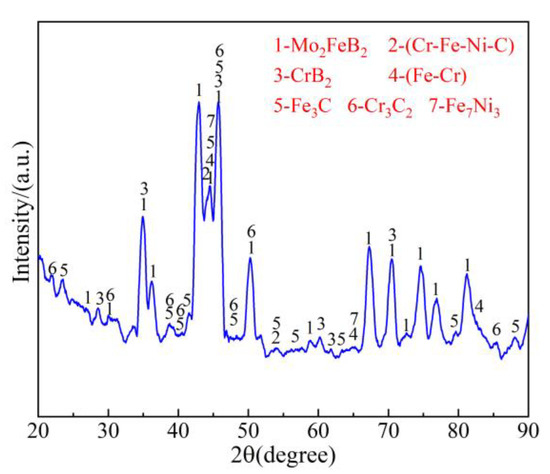
Figure 11.
XRD of the Mo2FeB2 coating.
Figure 12 shows the microhardness of different coatings and the substrate. It can be clearly noticed that the microhardness of all coatings was higher than that of the substrate (225.6 HV0.5), which implies that the Mo2FeB2 coating can significantly prolong the service time of substrate. S2 coating had the highest microhardness (1283.5 HV0.5) among all coatings, attributed to the fine grain strengthening. The nucleated grain could retain a fine size instead of keeping the growth under relatively low energy absorption, credited with both the lower laser power input and large thickness of the pre-placed powder, causing the reduction in convection time in the molten pool during the laser cladding process [4]. Hence, it can decrease the temperature gradient to inhibit the grain to grow up. The highest microhardness of the coating was 5.7 times that of the substrate.
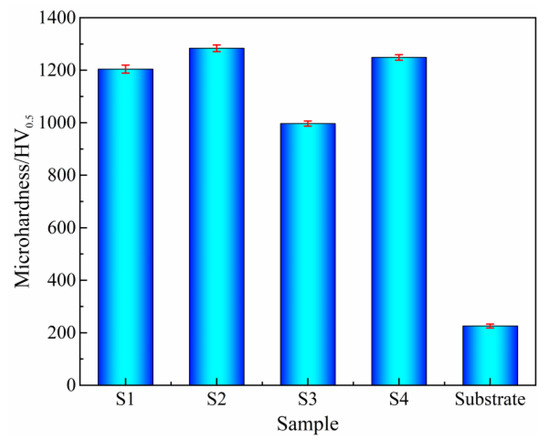
Figure 12.
Microhardness of different coatings and the substrate.
4. Conclusions
The empirical models of output responses (height, width, dilution rate) and input parameters (laser power, scanning speed, pre-placed thickness) were established, and the sensitivity of the output responses to input parameters was investigated in this research. The conclusions were summarized as follows.
(1) The established models have satisfactory fitting accuracy on the relationship between output responses and input parameters;
(2) According to the results of the established models, scanning speed has a negligible effect on the height and dilution rate. While the laser power has a positive effect on the width and dilution rate, and a negative effect on the height. The thickness of the pre-placed powder has a positive effect on the height, and a negative on the dilution rate;
(3) The results of the sensitivity analysis indicate that the height of the coating is more sensitive to the thickness of pre-placed powder than that of laser power and scanning speed. The width of the coating can be significantly controlled by the adjustment of laser power. Laser power and pre-place powder thickness are more sensitive to the dilution rate;
(4) The microhardness of the Mo2FeB2 coating with different parameters was 4–6 times that of the substrate. The Mo2FeB2 coating obtained with 1.5 kW laser power, 3 mm/s scanning speed, and 1.2 mm powder thickness from the sensitivity results had a highest microhardness of 1283.5 HV0.5.
Author Contributions
Methodology, H.Z.; formal analysis, H.Z., Y.P., Y.Z., G.L., Q.C., and J.Y.; investigation, H.Z., Q.C., and J.Y.; writing—original draft preparation, H.Z., Y.P., Y.Z., and G.L.; writing—review and editing, Y.P., Y.Z., and G.L.; supervision, Y.P.; funding acquisition, G.L. All authors have read and agreed to the published version of the manuscript.
Funding
This research was funded by the 2020 Major Project of Education and Teaching Reform in Undergraduate Colleges and Universities in Fujian Province, grant number FBJG20200042.
Institutional Review Board Statement
Not applicable.
Informed Consent Statement
Not applicable.
Data Availability Statement
Not applicable.
Conflicts of Interest
The authors declare no conflict of interest.
References
- Ding, H.; Mu, X.; Zhu, Y.; Yang, W.; Xiao, Q.; Wang, W.; Liu, Q.; Guo, J.; Zhou, Z. Effect of laser claddings of Fe-based alloy powder with different concentrations of WS2 on the mechanical and tribological properties of railway wheel. Wear 2022, 488, 204174. [Google Scholar] [CrossRef]
- Zou, Y.; Chai, Y.; Wang, D.; Li, Y. Measurement of elastic modulus of laser cladding coatings by laser ultrasonic method. Opt. Laser Technol. 2022, 146, 107567. [Google Scholar] [CrossRef]
- Yang, J.; Bai, B.; Ke, H.; Cui, Z.; Liu, Z.; Zhou, Z.; Xu, H.; Xiao, J.; Liu, Q.; Li, H. Effect of metallurgical behavior on microstructure and properties of FeCrMoMn coatings prepared by high-speed laser cladding. Opt. Laser Technol. 2021, 144, 107431. [Google Scholar] [CrossRef]
- Zhang, H.; Pan, Y.; Zhang, Y.; Lian, G.; Cao, Q.; Yang, J.; Ke, D. Effect of laser energy density on microstructure, wear resistance, and fracture toughness of laser cladded Mo2FeB2 coating. Ceram. Int. 2022, 48, 28163–28173. [Google Scholar] [CrossRef]
- Chai, Q.; Fang, C.; Qiu, X.; Xing, Y.; Sun, G. Modeling of temperature field and profile of Ni60AA formed on cylindrical 316 stainless steel by laser cladding. Surf. Coat. Technol. 2021, 428, 127865. [Google Scholar] [CrossRef]
- Liang, W.; Yang, Y.; Qi, K.; Jin, K.; Xiong, L. Quality evaluation of multi-path laser cladding coatings based on integrated fuzzy comprehensive evaluation and improved analytical hierarchy process method. Surf. Coat. Technol. 2021, 427, 127816. [Google Scholar] [CrossRef]
- Raahgini, C.; Verdi, D. Abrasive wear performance of laser cladded Inconel 625 based metal matrix composites: Effect of the vanadium carbide reinforcement phase content. Surf. Coat. Technol. 2022, 429, 127975. [Google Scholar] [CrossRef]
- Sun, Y.; Hao, M. Statistical analysis and optimization of process parameters in Ti6Al4V laser cladding using Nd:YAG laser. Opt. Lasers Eng. 2012, 50, 985–995. [Google Scholar] [CrossRef]
- Ansari, M.; Shoja Razavi, R.; Barekat, M. An empirical-statistical model for coaxial laser cladding of NiCrAlY powder on Inconel 738 superalloy. Opt. Laser Technol. 2016, 86, 136–144. [Google Scholar] [CrossRef]
- Erfanmanesh, M.; Abdollah-Pour, H.; Mohammadian-Semnani, H.; Shoja-Razavi, R. An empirical-statistical model for laser cladding of WC-12Co powder on AISI 321 stainless steel. Opt. Laser Technol. 2017, 97, 180–186. [Google Scholar] [CrossRef]
- Shi, Y.; Li, Y.; Liu, J.; Yuan, Z. Investigation on the parameter optimization and performance of laser cladding a gradient composite coating by a mixed powder of Co50 and Ni/WC on 20CrMnTi low carbon alloy steel. Opt. Laser Technol. 2018, 99, 256–270. [Google Scholar] [CrossRef]
- Nabhani, M.; Razavi, R.S.; Barekat, M. An empirical-statistical model for laser cladding of Ti-6Al-4V powder on Ti-6Al-4V substrate. Opt. Laser Technol. 2018, 100, 265–271. [Google Scholar] [CrossRef]
- Meng, G.; Zhu, L.; Zhang, J.; Yang, Z.; Xue, P. Statistical analysis and multi-objective process optimization of laser cladding TiC-Inconel718 composite coating. Optik 2021, 240, 166828. [Google Scholar] [CrossRef]
- Shayanfar, P.; Daneshmanesh, H.; Janghorban, K. Parameters Optimization for Laser Cladding of Inconel 625 on ASTM A592 Steel. J. Mater. Res. Technol. 2020, 9, 8258–8265. [Google Scholar] [CrossRef]
- Alizadeh-Sh, M.; Marashi, S.P.H.; Ranjbarnodeh, E.; Shoja-Razavi, R. Laser cladding of Inconel 718 powder on a non-weldable substrate: Clad bead geometry-solidification cracking relationship. J. Manuf. Processes 2020, 56, 54–62. [Google Scholar] [CrossRef]
- Yuan, C.; Yin, H.; Yang, G.; Yang, X.; Xu, B.; Deng, Z.; Liu, Y.; Li, W.; Zhang, C.; Zhang, R.; et al. Tracking the evolution of microstructure and phases of WCoB-Co cermets during sintering. Int. J. Refract. Met. Hard Mater. 2021, 98, 105550. [Google Scholar] [CrossRef]
- Vershinina, T.N.; Ivanov, M.B.; Rimsha, P.B. The effect of carbon on phase composition and microstructure of cermets based on Mo2NiB2 boride. Int. J. Refract. Met. Hard Mater. 2021, 100, 105650. [Google Scholar] [CrossRef]
- Zhang, L.; Huang, Z.F.; Shen, Y.P.; Li, K.M.; Cao, Z.; Jian, Y.X.; Ren, Z.J. High-temperature compressive properties and tribological behaviour of Mo2NiB2–Ni cermets. Ceram. Int. 2019, 45, 18413–18421. [Google Scholar] [CrossRef]
- Yang, G.; Yin, H.; Deng, Z.; Zhang, C.; Zhang, R.; Qu, X. Synthesis, microstructure evolution, and phase transformation of novel MoCoB–Co cermets. Ceram. Int. 2020, 46, 7541–7549. [Google Scholar] [CrossRef]
- Liu, X.; Wang, H.; Feng, H.; Hu, H.; Chen, J.; Zhao, Z.; Wu, G.; Liu, C.; Lu, H.; Song, X. On the enhanced wear resistance of ultra-coarse WC-Co cemented carbides by WCoB addition. J. Alloys Compd. 2022, 894, 162449. [Google Scholar] [CrossRef]
- Zhang, H.; Lian, G.; Zhang, Y.; Pan, Y.; Cao, Q.; Yang, J.; Ke, D. The influence of powder size on the microstructure and properties of Mo2FeB2 coating fabricated via laser cladding with pre-placed powder. Int. J. Adv. Manuf. Technol. 2022, 120, 6041–6052. [Google Scholar] [CrossRef]
- Zhang, H.; Zhang, Y.; Cao, Q.; Pan, Y.; Lian, G.; Que, L.; Zhu, X. A comparative investigation on microstructure evolution and wear resistance of in situ synthesized NbC, WC, TaC reinforced Mo2FeB2 coatings by laser cladding. Ceram. Int. 2022. [Google Scholar] [CrossRef]
- Yu, H.; Liu, W.; Zheng, Y. Effect of carbon content on the microstructure and mechanical properties of Mo2FeB2 based cermets. Int. J. Refract. Met. Hard Mater. 2011, 29, 724–728. [Google Scholar] [CrossRef]
- Yu, H.; Zheng, Y.; Liu, W.; Zheng, J.; Xiong, W. Effect of Mn content on the microstructure and mechanical properties of Mo2FeB2 based cermets. Int. J. Refract. Met. Hard Mater. 2010, 28, 286–290. [Google Scholar] [CrossRef]
- Takagi, K.-I. Development and application of high strength ternary boride base cermets. J. Solid State Chem. 2006, 179, 2809–2818. [Google Scholar] [CrossRef]
- Roy, N.; Pramanik, D.; Kuar, A.S. Comparative study on quality characteristic of pulsed laser beam cutting of Inconel 625 superalloy at different environment by sensitivity analysis. Optik 2021, 232, 166516. [Google Scholar] [CrossRef]
- Liu, H.; Qin, X.; Huang, S.; Hu, Z.; Ni, M. Geometry modeling of single track cladding deposited by high power diode laser with rectangular beam spot. Opt. Lasers Eng. 2018, 100, 38–46. [Google Scholar] [CrossRef]
- Palani, P.K.; Murugan, N. Sensitivity Analysis for Process Parameters in Cladding of Stainless Steel by Flux Cored Arc Welding. J. Manuf. Processes 2006, 8, 90–100. [Google Scholar] [CrossRef]
- Kim, I.S.; Son, K.J.; Yang, Y.S.; Yaragada, P.K.D.V. Sensitivity analysis for process parameters in GMA welding processes using a factorial design method. Int. J. Mach. Tools Manuf. 2003, 43, 763–769. [Google Scholar] [CrossRef]
- Karaoğlu, S.; Seçgin, A. Sensitivity analysis of submerged arc welding process parameters. J. Mater. Processing Technol. 2008, 202, 500–507. [Google Scholar] [CrossRef]


Publisher’s Note: MDPI stays neutral with regard to jurisdictional claims in published maps and institutional affiliations. |
© 2022 by the authors. Licensee MDPI, Basel, Switzerland. This article is an open access article distributed under the terms and conditions of the Creative Commons Attribution (CC BY) license (https://creativecommons.org/licenses/by/4.0/).