Article

Manufacture and Characterization of Geopolymer Coatings Deposited from Suspensions on Aluminium Substrates

1
Faculty of Mechanical Engineering, J. E. Purkyne University in Usti nad Labem, Pasteurova 3334/7, 40001 Usti nad Labem, Czech Republic
2
Faculty of Social and Economic Studies, J. E. Purkyne University in Usti nad Labem, Pasteurova 3334/7, 40001 Usti nad Labem, Czech Republic
*
Author to whom correspondence should be addressed.
Coatings 2022, 12(11), 1695; https://doi.org/10.3390/coatings12111695
Submission received: 13 October 2022 / Revised: 4 November 2022 / Accepted: 4 November 2022 / Published: 7 November 2022
(This article belongs to the Topic Corrosion and Protection of Metallic Materials)

Abstract

:
Geopolymers compete with a number of conventional coatings and a few of them have already been replaced. The aim of this work was the analysis of alkali-activated metakaolin-based geopolymers and their use as brush-applied coatings, which were chosen due to their simplicity and cost-effectiveness. Eight coatings were prepared and the AlMgSi aluminum alloy underlying the substrate was also studied. The main characterizations of the prepared coatings were the microscopy analysis, which showed that manual painting with a brush on the coatings we prepared could achieve a high-quality geopolymer layer, and that if microscopic cracks are visible on the surface, they are uniform and do not affect the resulting cohesiveness of the coating. The thicknesses of these coatings are different, ranging from 1.5 to 11 μm, with no visible anomalies. For the evaluation of the properties of the coatings, we determined the analysis of adhesion to the adjacent substrate, microhardness and thermal expansion determined using the so-called dilatometric analysis as important criteria. For these analyses, the results vary by geopolymer type and are discussed in the following chapters.

1. Introduction

Under the name geopolymers, we can imagine inorganic polymeric substances that belong to the group of alkali-activated materials. Geopolymer is a synthetic aluminosilicate material found between glass, ceramic materials and hydrated binders such as hydraulic lime and cement. Diverse classes of materials are referred to as geopolymers, which belong to a large group of inorganic materials prepared by the process of alkali-activated binders. There is a different binder phase from other alkaline-activated binders, which contains an alkaline aluminosilicate gel with cations of alkali metals of the first group of the periodic table. Geopolymers are inorganic polymers produced at low temperature, usually below 100 °C. They consist of chains or networks of mineral molecules linked by covalent bonds [1,2,3,4,5,6,7].
Geopolymers are closely related to natural zeolites. They have structures composed of Si-O-Al polymer networks that are similar to those found in zeolites. A striking difference is the radiomorphic character of geopolymers, as zeolites are crystalline. The exact nature of the amorphous character of geopolymers is still not completely clarified [8,9,10].
Geopolymers were first mentioned in 1978 by Professor Joseph Davidovits [11]. With the term “geopolymer”, he designated a class of solid bodies created by synthesizing aluminosilicate powder with an alkaline solution. Geopolymer suspensions were and are characterized by high heat resistance and resistance to direct contact with fire. It was for this reason that they were developed [12].
During the preparation of geopolymers, there are three basic processes that characterize their preparation. The first phase is dissolution, during which, the transition of Si and Al atoms from the input raw material to the solution occurs. Thanks to this transition, complexes with hydroxide ions are formed. In the second phase, mobile precursors move and condense into monomers with partial internal restructuring of the alkaline polysilicates. The last stage in the process of creating geopolymers is polycondensation, or the polymerization of monomers, during which, a polymer structure is formed and the whole system solidifies, resulting in an inorganic polymer structure. These three processes take place almost simultaneously, which complicates the analysis of individual processes [13,14].
Geopolymers have the potential to replace a number of conventional building materials, such as the commonly used Portland cement, where geopolymers can even overcome the limitations associated with its production. As Portland cement requires high temperatures for the calcination process, greenhouse gas CO2 is produced during its production. However, in the production of geopolymers, this does not occur; therefore, so from an environmental point of view, geopolymers appear to be a possible alternative [15].
Geopolymers can be produced from sources that are of geological origin, for example, from kaolinite or clays. However, it is also possible to produce geopolymers from industrial byproducts, such as fly ash, granulated blast furnace slag or waste paper sludge [16,17,18,19,20].
Geopolymers are also strong, insoluble in water and highly resistant to dilute acids and bases. They are also studied for their thermal properties. There are many factors that influence these properties. By selecting the input raw materials and changing the processing conditions, it is possible to achieve various adjustments to the properties of geopolymers and adapt them to the given requirements. However, until now, geopolymers have been mainly used for construction purposes as a matrix [21,22,23].
Due to their inorganic structure, geopolymers show an excellent thermal stability that far exceeds that of traditional cements [24]. In the case of metakaolin geopolymers, the Al/Si ratio and the choice of alkali have a significant effect on thermal expansion or shrinkage, where, for example, during dehydration, the greatest shrinkage was achieved using Na-based alkali and, on the contrary, the smallest shrinkage was achieved using K-based alkali, as is closer to [25]. The thermal expansion of geopolymers is isotropic due to their amorphous structure; however, uneven expansion may occur in areas of the sample due to inhomogeneity in the chemical composition or thickness of the coating, which cause thermal stresses leading to cracking or peeling of the coating [26].
One of the possibilities for applying geopolymers is in the form of coatings on a suitably chosen substrate. The main advantage of geopolymer coatings are their protection of the underlying material against corrosion. Geopolymers are a kind of material with the same mechanical properties as ceramics, and have a better ability to resist high temperatures and corrosion than most polymer materials [27]. The rate of corrosion is strongly dependent on the porosity and thickness of the applied coating [28].
Coatings can be applied using a wide variety of methods. It is easiest to apply coatings with a brush. It is not possible to accurately correct the thickness of the layer this way, but the method requires only minimal initial economic costs and it is possible to perform this method without any knowledge of demanding technologies. Airbrush spray is a widely used method for applying coatings due to its advantages, which include low cost, efficiency, good adhesion to substrates and the declared thickness of the applied layer. However, it can only be used if the geopolymer suspension is not very viscous [29].
Studying the properties of the underlying substrate is essential for its coating suitability. Aluminum alloy EN-AW 6060 is a thin plate made by the cold rolling process. This process introduces anisotropic properties by plastically deforming the processed material. This anisotropy significantly affects the mechanical properties of aluminum alloy sheets. Considering the anisotropy of the rolled material also affects the flatness of machined surfaces [30], as [31] describes, it was found that the aspect ratio of the roll bite during the cold rolling process is a main factor which affects the distribution of the residual stress in low friction. When the aspect ratio of the roll bite is low, the residual stress is compressive stress at the surface and tensile stress around the quarter. In cases in which the aspect ratio is high, tensile stress develops at the surface and compressive stress develops around the midplane. It is also found that the surface residual stress becomes more compressive with increasing friction coefficient.
The properties of the surface and the contact angle of the coating substrate have a significant effect on the adhesion properties, which are the keys to making geopolymer coatings adequately resistant to corrosion, to heat and to the reduction of thermal expansion of the underlying metal. Adhesion properties are described in [32]. Aluminum silica solution particles react strongly with the oxide layer by means of Al–O bonds on metal substrates. This affects the bonding of the geopolymer layer coating on the metal substrate [32]. Temujin et al. [33] discovered that the bonding interactions between the geopolymer and the metal substrate are more physical in nature than chemical in nature. This contrast arose from the expectation of the formation of Al–O–Fe bonds in the presence of a highly oxidized substrate surface [34]. The surface structure of the substrate is not the only factor affecting the adhesion of the coating, but also, the ratio of Si/Al particles in the geopolymer affects the adhesion to the substrate, precipitation or expansion of the coating [32,35]. The addition of water significantly affects the adhesion strength and thickness of the geopolymer layer on the substrate [34,35]. A high water content causes a poor curing process of the geopolymer both in volume and in adhesion on the surface [33]. Despite this disadvantage, a higher water content can affect adhesion, therefore, depending on the Si/Al ratio, it can improve the fire-resistant properties of the coating [33,34,36]. The thickness of the geopolymer coating plays a key role in determining the insulating capacity [34,35]. Geopolymer coatings with a high Si content showed better durability, depending on the greater thickness of the coating on the underlying material [33,37,38].
The aim of this work was the analysis of alkali-activated metakaolin-based geopolymers and their use as a brush-applied coating. This method was chosen for its simplicity and cost-effectiveness. Eight coatings were prepared and the AlMgSi aluminum alloy underlying substrate was also studied. The main characteristic was microscopy analysis to evaluate the integrity and uniformity of the prepared coatings. From the obtained results, it will be possible to observe very different structures of the coatings, depending on the different chemical composition or the formation of surface cracks and the segregation of particles. The thickness of the coatings ranged from 1.5 to 11 μm, with no visible anomalies. For the evaluation of the properties of the coatings, we determined the analysis of adhesion to the adjacent substrate, microhardness and thermal expansion, which was determined using the so-called dilatometric analysis as important criteria. For these analyses, the results vary by geopolymer type and are discussed in the following chapters.

2. Materials

Aluminum alloy EN-AW 6060 T66 [39] was chosen as the starting material (in the form of a sheet with width 50 mm, thickness of 3 mm and rods with a circular cross-section). EN-AW 6060 (AlMgSi0.5) is a medium-resistant heat-treatable alloy. The alloy belongs to the 6000 series—alloys with magnesium and silicon. For alloys of the 6000 series, the amount of MgSi intermetallic phase is important in terms of strength properties, which makes these alloys heat-treatable, and has a certain similarity to self-hardening steels. A characteristic feature is their excellent ability to form, weldability, resistance to corrosion and mechanical machinability with medium strength properties. The composition and basic properties of ENAW 6060 alloy are given in Table 1.

2.1. XRF Analisys of EN AW-6060

To determine and confirm the exact composition of the EN-AW 6060 aluminum alloy, XRF was performed using a WDXRF Rigaku ZSX Primus 4 instrument. The data was evaluated using a nonstandard method of fundamental parameters, which allows the determination of elements in the F–U range in concentrations from hundredths of ppm to 100%. The result of the XRF analysis can be seen in Table 2.

2.2. Roughness of EN AW-6060

When coating with conventional coatings (e.g., anti-corrosion) with either an organic or inorganic composition, the surface roughness of the underlying substrate has an effect on adhesion [41,42], and generally, when it comes to aluminum alloys, the adhesion to the surface is lower than, for example, with steels, and the application procedure states that the adhesion must be verified [43,44,45,46,47,48].
The roughness of the underlying substrate EN-AW 6060 was measured on a Hommel Tester t1000 roughness meter according to ISO 4287 with probe type T1E 2 μm/90°, compressive force 1.5 mN, traverse length 4.8 mm, traverse speed 0.5 mm/s and measurement range ±80 μm/0.01 μm. On Figure 1 in the detail of the underlying substrate, one-way oriented grooves in the direction of arrow A (blue) can be observed, which are caused by the production process during sheet rolling. Roughness was measured along the direction of rolling in the direction of arrow A (blue) and perpendicular to the direction of rolling in the direction of arrow B (red). The measured roughness values are given in Table 3.

3. Experimental Setup and Methods

Geopolymers can be applied to the surface of the material in many different ways, e.g., by painting, spraying or dipping [30,39,41,42]. In our case, the main criterion was riem, the simplest possible application, and at the same time, verifying whether, even with a simple application of geopolymers, the resulting quality of the coating will be of sufficient quality and will be able to influence the resulting analyzed properties. In view of the above, the application of geopolymer suspensions to the surface of the substrate by painting with a brush was chosen.

3.1. Preparation of Suspensions and Underlying Substrate

Geopolymer suspension is a mixture of several components with different states (liquid and solid). After mixing the components, it was necessary to homogenize the resulting mixture very well. This was accomplished by using a laboratory homogenizer AD300L-H, 10,000 RPM. After mixing, the geopolymer suspension is activated and geopolymerization begins to take place, which is dependent on temperature and accelerates with increasing temperature. The stability of suspensions depends on the composition. Some geopolymer slurries must be processed within a few hours of mixing. The suspensions used in this research have a stability of the order of several months to several years when the suspension does not change its properties before application (separated components can be homogenized), and above all, after application to the substrate. It follows from the above that the stability of the suspensions can be further extended by suitable storage at lower temperatures (4 °C) for several months.
The geopolymer suspension is applied to the underlying substrate made of aluminum alloy AlMgSi0.5 (see Section 2.1) in the form of a rolled sheet with a width of 50 mm, thickness of 3 mm and turning samples with a length of 21 mm and a diameter of 8 mm (dilatometric analysis). Before applying the suspensions, the surface of the substrate is cleaned and degreased with an organic solvent (acetone) without further pretreatment of the surface, and thus, the natural oxide layer is preserved, mainly for the sake of ensuring simplicity of application and analysis of the effect of the oxide layer on the resulting properties of the coating.

3.2. Application of Geopolymer Suspension

The suspensions were applied with a regular brush designed for water-based paints. It is necessary to apply a very small amount of suspension and spread it perfectly over the surface, thus creating a very thin layer of geopolymer, which is essential for the final quality of the geopolymer coating. If a large amount of slurry is applied and the layer formed is too thick, some geopolymer suspensions may occur during post-processing, thereby leading to the degradation or even destruction of the created layer, e.g., severe cracking, flaking or the formation of bubbles, and thus, to the loss of the useful properties of the created layer. A degraded coating due to the formation of cracks and bubbles due to improper application and non-compliance with the condition of the size of the layer thickness can be seen in Figure 2. Due to the very thin layer, the yield of the suspensions is very high (higher than, for example, conventional organic coatings).

3.3. Curing of Geopolymer Coatings

In order for geopolymer suspensions to acquire their final properties after application to the underlying substrate, chemical reactions, so-called geopolymerization, must occur in the mixture [13,14]. For the geopolymer mixtures from Table 4, geopolymerization occurs at elevated temperatures, in contrast to mixtures with a different composition, where geopolymerization can occur at lower temperature (e.g., to [13,14] 100 °C, possibly also at room temperature) water from the geopolymer mixture and other chemical reactions (settling). For the selected geopolymer mixtures, it is necessary to reach a certain minimum temperature, which was experimentally determined to be 170 °C. After applying emulsions to the surface of the substrate, the samples are placed in a dryer preheated to 30 °C. Subsequently, the temperature begins to rise to the resulting 170 °C. Another important parameter influencing the resulting quality of the layer is the rate of rise of the temperature to the geopolymerization temperature. If the temperature gradient is too high, rapid evaporation of water from the emulsion and degradation of the resulting layer will occur, similar to the application of a very thick layer of emulsion (see Section 4.1). Degradation due to rapid temperature rise is indicated mainly by foaming of the layer and the creation of bubbles (cracking and peeling may also occur at the same time). With a rapid high gradient of temperature increase, the water contained in the suspensions will quickly evaporate, resulting in the formation of water vapor and gas bubbles, which will degrade the resulting layer. It was found experimentally that the maximum possible increase of temperature for the given geopolymers, at which the destruction of the layer does not occur, is 10 °C/min (to obtain the best properties of the layers without visible degradation, it is advisable not to exceed 5 °C/min). It follows from the above that it is not advisable to put samples into a pre-heated dryer. To evaporate all the water, after reaching the set temperature, the samples are left at this temperature for 2 h. Subsequently, the samples can be taken out immediately or left to cool directly in the drying oven. The rate of temperature change no longer affects the geopolymer coatings at this stage, as shown in Figure 3.

3.4. Experimental Methods

All samples were prepared by manually painting the geopolymer suspensions onto the underlying substrate using a brush. The microstructure of the coatings was observed on an Olympus SZ61 optical microscope, then on a 3D laser confocal microscope LEXT OLS5000 SAF (CLSM) and on a Vega 3 scanning electron microscope (SEM) from Tescan company (Tescan, Vega 3, Brno, Czech Republic). The thickness of the coating was measured with a DeFelsko PosiTector 6000 portable coating thickness meter (DeFelsko, New York, NY, USA). Adhesion of the geopolymer to the chosen aluminum substrate was analyzed by the grid test method according to ISO 2409, specifically with the Elcometer 1542 grid test set. Microhardness was measured according to the CSN EN ISO 6507-1 standard on a Mitutoyo HM-220 microhardness tester (Mitutoyo, Neuss, Germany). Dilation was determined using a Linseis DIL L75 PT Vertical dilatometer (Linseis Messgeraete, Selb, Germany).

4. Results and Discussion

4.1. Microstructure Analysis of Geopolymer Coatings Using SEM and CLSM

To analyze the (macro)structure of the surface of geopolymeric coatings, an analysis was performed using a laser confocal microscope with 3D imaging of the surface to determine the state of the structure and possible defects (peeled layer, bubbles, etc.) of larger dimensions, and electron microscopy to analyze the microstructure of the surface, especially cracks in the coating layer. Microscopy of the surface of applied geopolymer suspensions G–H are shown in Figure 4.
  • Sample G: The surface shows no macroscopic defects or disorders. The surface is broken (rough), but even. Cracks are visible in the detail.
  • Sample H: As with sample G, the surface shows no flaws or defects. Here, too, it is segmented (coarse) and uniform. Cracks are visible in the detail.
  • Sample I: The surface is completely free of defects, with a very fine surface structure. Cracks are visible in the detail, but do not affect the adhesion of the coating to the substrate.
  • Sample J: A uniform very fine (smooth) surface, completely free of defects. There are no visible cracks in the coating, even in the detail.
  • Sample K: The coating does not contain major defects. Fine, evenly distributed cracks can be observed in the detail, without affecting the adhesion of the coating to the substrate. Furthermore, very small grains with a diameter <0.5 μm evenly distributed in the substrate can be seen here.
  • Sample L: The surface shows minor defects. It is evident from the 3D scan that the uniformity of the coating layer is worse than in previous samples. The coating is rough and cracks can be seen in the detail.
  • Sample M: As the only sample, it shows larger macroscopic defects on the surface, namely peeled off parts of the coating with a circular cross-section with a diameter of approx. 30–100 μm. These are burst bubbles that formed on the surface during curing. This coating does not appear to be entirely suitable for the curing procedure in question. In the detail, one can observe a greater fragmentation of the surface, mainly formed by particles with a size of approx. 30 μm (peeled coating), and at the same time, large uniform cracks in the entire surface of the coating.
  • Sample N: Isolated surface defects of approx. 20 μm size. In the detail, partial fragmentation (protrusions) can be observed. There are needle-like formations on the surface. The coating does not contain any visible cracks.
From the microscopic analyzes of the surface, it was found that it is possible to achieve very good results of the resulting surface layer, which is uniform without major defects (except for sample M), even during manual application by painting geopolymer suspensions on an aluminum substrate. Most of the samples show uniform cracks in the coating at the microscopic level, which, however, do not seem to affect the resulting cohesiveness of the coating (see further in Section 4.3). Samples J and N are completely free of cracks.

4.2. Thickness of Geopolymer Coatings

The thickness of the coating correlates with the resulting properties of the resulting coating. The requirements placed on the coating are different, e.g., protective function against corrosion, higher abrasion resistance, protection against high temperatures, etc. E.g. for anti-corrosion coatings, the thicker the protective layer, the higher the anti-corrosion protection [29]. With increasing thickness, some positive properties of the coating may increase, but at the same time, it can also have a negative effect, e.g., changing the dimensions of a machine part when a thick coating can affect the correct function, and, of course, there is also the economic side, when the consumption increases, and with it, the combined cost of the coating and its application. The thickness of the geopolymer liners was measured with a DeFelsko PosiTector 6000 portable coating thickness meter for metal substrates with an FNS type probe with a measurement range of 0–1500 μm accuracy ± (1 μm + 1%) for a coating thickness of 0–50 μm according to ISO 2360.
The thickness of each coating was measured at 20 different locations over the entire surface of the substrate, and the arithmetic mean of the coating thickness with standard deviation was then calculated from these values. The measured values of the thickness of the coatings are given in 
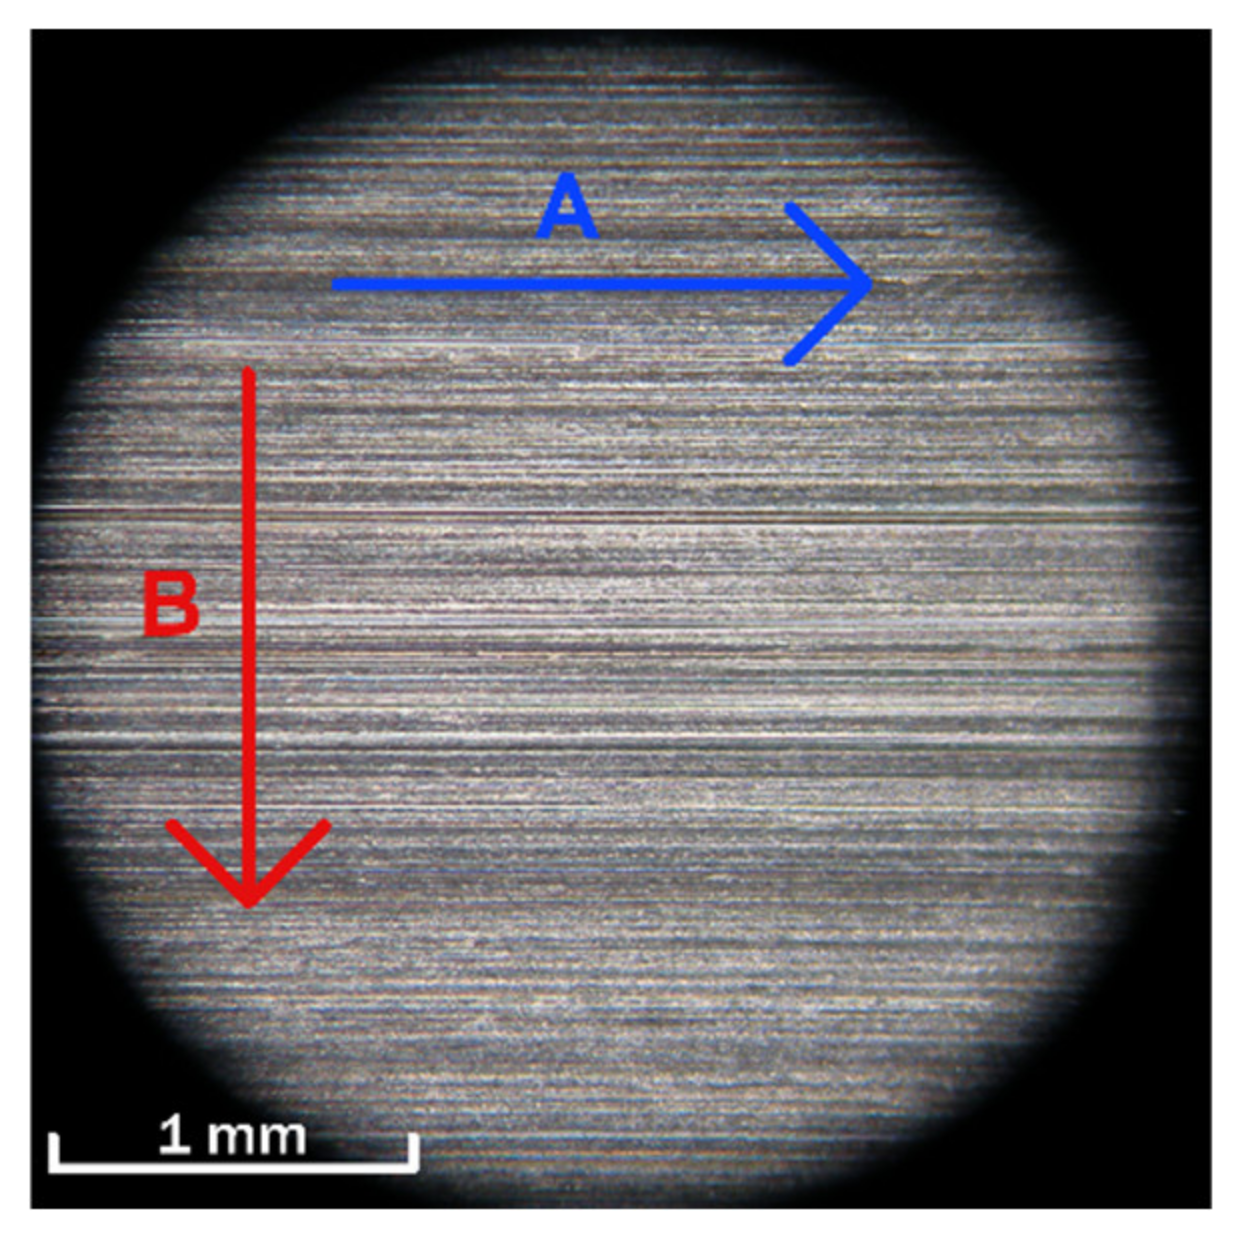
Table 5. The geopolymer suspension is applied in one layer and the table shows that the total thickness of the coatings is in the order of -m units. Samples H and M show a large spread of values. This is due to increased surface roughness in the case of sample H, and defects in the layer in the case of sample M, as shown in Figure 4. Sample H also reached the highest thickness of 11.1 ± 3.6 μm. Particularly interesting are samples I and J, which reached the lowest thickness and that 2.7 ± 0.7 μm of sample I and 1.5 ± 0.4 μm of sample J. In comparison, for example, to conventional organic anti-corrosion coatings for metal, which reach a thickness of approx. 50 μm more when applied manually with a brush (citation, for example some technical sheet) are very low values.

4.3. Analysis of the Adhesion of the Geopolymer Layer by Grid Test

The adhesion of geopolymer suspensions to the substrate was analyzed by the grid test method according to ISO 2409, specifically with the Elcometer 1542 grid test set. The knife used had a blade spacing of 1 mm for coatings, with a thickness of 0–60 μm. We can observe the result of the analysis at Figure 5 and the evaluation is conducted in Table 6. Except for suspension H, which achieved a rating of 2, all other suspensions were rated 1, i.e., very small separation of the coating along the sections with an area not exceeding 5% (on the details in Figure 5 is visible aluminum substrate extruded around the cuts). Sample H with a rating of 2 shows a larger area of detached coating by 5%–15%. The results show that the adhesion of the used geopolymer suspensions to the underlying aluminum alloy substrate is at a very high level.

4.4. Microhardness of Geopolymer Coatings

A very important criterion for evaluating the properties of a coating is its microhardness, which determines its use. In general, the effort is to create very hard coatings on the surface of components (e.g., mechanical components of machines, etc.), which extend the lifetime of the components and improve their mechanical properties [49]. The microhardness was measured on the underlying AlMgSi0.5 substrate and compared with the microhardness of geopolymer coatings G–N. The measurement was performed according to the CSN EN ISO 6507-1 standard on a Mitutoyo HM-220 microhardness tester. A four-sided diamond pyramid with an apex wall angle of 136° was used to measure hardness. The nominal load value was HV 0.1 (100 g, F = 0.981 N), which loaded the sample for 10 s.
The microhardness of the underlying substrate and each coating was measured at 20 different locations over the entire surface of the substrate, and the arithmetic mean of the microhardness with the standard deviation was calculated from these values. Table 7 shows the measured value of the microhardness of the G–N geopolymer coatings and the underlying substrate, which is graphically shown in Figure 6. The table also shows the percentage increase/decrease of the microhardness of the G–N geopolymer coatings compared to the underlying substrate, which is graphically shown in Figure 7.
Microhardness of underlying substrate was 93.6 HV 0.1. For geopolymer layers, almost the same hardness was measured for sample L, as in the case of the underlying substrate, increased by 4%. Sample H shows, as the only geopolymer, a high decrease of microhardness of 57.1 HV 0.1 (decrease −39%). Compound H has the same basic composition as compound G, which reaches a hardness of 115.1 HV 0.1 with an increase of 23%, but compound H additionally contains fine graphite, which does not reach high hardness [50] and, thus, causes a significant decrease of microhardness. The group of mixtures I, J and M reaches a hardness of 118.4–127.1 HV 0.1, i.e., an increase of 26%–36% compared to AlMgSi0.5. These mixtures contain AlOH3 and Al2O3 particles, where Al2O3, in particular, is a very hard material [51], causing this significant increase of the microhardness of the coating. Mixture K also contains Al2O3, only with a different composition of the base matrix compared to the previous suspensions, and reached a hardness of 153.8 HV 0.1, which is an increase of 64% compared to the underlying substrate. The highest measured hardness was achieved by the N suspension at 189.4 HV 0.1 with an increase of 102% compared to the underlying substrate. This mixture again has a different composition of the basic matrix, but as in the previous cases, it contains Al2O3.

4.5. Dilatometric Analysis of Geopolymer Coatings

A dilatometric analysis was performed to determine whether geopolymeric coatings affect the thermal expansion of the underlying material. This is an experimental method by means of which we study length changes of the material depending on the temperature, i.e., stretching or shrinking [8]. The analysis was performed on a Linseis DIL L75 PT Vertical dilatometer. The sample has the shape of a cylinder with a length of 21 mm and a diameter of 8 mm formed by the underlying substrate AlMgSi0.5, which was turned from a 10 mm diameter rod. The samples used the same procedure as in Section 3.2. Geopolymer suspensions G–N were applied, which were compared with a reference sample from the underlying substrate without a coating (further marked as sample R). The sample is placed in a tube with a holder where it is in contact with the end of the tube and a push rod that transmits the length changes of the sample with changing temperature, as shown in Figure 8 [52]. The push rod exerts a constant force on the sample during the measurement. Dilatometric analysis was performed in the temperature range −20–400 °C, when the sample was loaded with a force of 300 mN. The heating rate was 3 °C/min and air was chosen as the protective atmosphere.
The sample loading cycle consists of heating to a given temperature and cooling, which took place twice. The first phase of the cycle, i.e., heating from −20 to 400 °C, was evaluated, as well as the phase after two cycles to determine whether there was a significant change in thermal dilation, for example, by destruction of the coating. Laser microscopy was again used to analyze the surface of the coatings of geopolymeric suspensions after two cycles of loading at a temperature of 400 °C.
From the graph of sample elongation versus temperature in Figure 9, it follows that the coating on sample G has almost no effect on the change in thermal expansion. We can talk about almost the same course of the curve as for uncoated material. There were no changes or degradation of the coating on the surface of the sample.
The coating on sample H negatively affects the elongation, there is a greater elongation along the entire observed length of the curve. Thermal expansion has increased. If we compare the maximum elongation, it is significantly greater for the coated sample than for the reference sample at a temperature of 400 °C. The increase of elongation is already visible at the first marked point, when the uncoated sample reached an elongation of 105 µm at a temperature of 250 °C, and the coated sample reached this elongation value already at a temperature of 234.7 °C. The difference in elongation at 400 °C is almost 12 µm. The sample also shows cracking of the coating and thickening of the structure, but no visible peeling.
Additionally, sample I shown on Figure 10 has a negative effect on the elongation of the sample compared to the uncoated one. The maximum elongation of the coated sample occurred at a temperature of 400 °C, and the elongation of 181.91 µm, sample R (uncoated) acquired an elongation value of 180.65 µm at the same temperature. An interesting point is the area where the elongation of 105 µm to 135 µm occurred in both samples, where the shift is noticeable, i.e., the change in elongation at different temperatures. Microscopic analysis shows very strong cracking of the coating and its thickening, but without loss of adhesion. This relative damage does not appear to affect the resulting thermal expansion either negatively or positively.
From the Figure 10 of the dependence of sample elongation on temperature, it follows that the coating on sample J negatively affects the elongation, similarly to sample H (Figure 9). The course is linear, but the shift above the reference curve of sample R clearly proves that the coated sample acquires higher elongation values depending on temperature than the uncoated sample. This difference is best observed at the maximum temperature of 400 °C, where the elongation difference is 10.8 µm. Local cracks and local peeling of the coating occur in the surface of the coating.
When comparing sample K and reference sample R shown on Figure 11, it can be seen from the graph that the change in the coated sample occurs at temperatures of 355 °C, where the break in the curve occurs, and the effect of the coating on the sample, which is only minimal up to this temperature, begins to manifest itself markedly. The maximum elongation value at a temperature of 400 °C was 180.65 µm for the uncoated sample, and this value was reduced to 171.43 µm for the coated sample. The difference in elongation is, therefore, 9.22 µm at a temperature of 400 °C. However, at this temperature, there is severe damage to the coating, which is severely cracked, and there is loss of adhesion and peeling of the coating layer, as shown by microscopic analysis.
Sample L on Figure 11 has a positive effect on reducing the thermal expansion of the material. This property is manifested from a temperature of 135 °C. The linear course of the curve of the dependence of elongation on temperature is similar for both samples, but a decrease of the elongation value is noticeable for the coated sample. This is also proven by the maximum elongation, which reached a value of 176.80 µm for the coated sample at a temperature of 400 °C, while the uncoated reference sample reached a value of 180.65 µm. Here, too, cracking of the coating and its thickening is visible, but without a visible loss of adhesion to the substrate and its peeling.
Figure 12 shown then sample M, like sample G, has no positive or negative influence on the thermal expansion of the underlying substrate. From the microscopic analysis, it follows that there was a complete destruction of the coating, which is strongly cracked with extensive peeling surfaces, which indicates a loss of adhesion of the coating to the substrate, and therefore no influence of the reference sample is observable in the graph of the sample elongation on temperature.
If we compare sample N with the reference sample shown on Figure 12 and observe the change in elongation depending on temperature, we can say that this coating has a positive effect on thermal expansion. The course is similar to the course of the curve of sample L, but here, the difference is more marked and the break already occurs at a temperature of 100 °C. If we look at the temperature at which the coated sample reached an elongation of 128 µm, i.e., at 315.8 °C, we find that the uncoated sample already reached this elongation at a temperature of 290 °C. The positive effect is underlined by the maximum elongation at 400 °C, which is 180.65 µm for the uncoated sample and only 170.80 µm for the coated sample. The difference is, therefore, 9.84 µm. Strong cracking of the coating layer is also visible here.
For samples G, H, I, J and M, after cyclic loading for two cycles, there were no significant changes or deviations from the first cycle compared to the second cycle, and the curves are almost identical, so it can be said that there is no change in the temperature–temperature dependence of these suspensions’ expansion, either positive or negative, during the second cycle. For clarity, only the graph of the dependence of thermal expansion on temperature during cyclic loading for sample H is shown in Figure 13.
The first curve of subcooling and heating for sample K was already described in the initial graph, as shown in Figure 13, but the functionality of the coating during repeated loading is clearly evident from the cyclic thermal load. If we compare the curves with the reference sample without the coating, we see a drastic decrease of the elongation under repeated thermal stress. It is also important to mention the shrinkage value of the sample during subcooling, i.e., at a temperature of −20 °C. The sample with the coating achieved greater shrinkage during subcooling during the second cycle, and if we compare the maximum elongation at a temperature of 400 °C, there is also a noticeable effect of the coating during cyclic thermal loading; a reduction of elongation by almost 10 µm.
Comparison of the curves in the cyclic loading graph of the L sample with the uncoated sample shown on Figure 14 did not show any appreciable change in elongation. It can be said that the curves almost copy the continuous curves of the uncoated sample. A decrease of elongation, i.e., rather a greater shrinkage, is observable at negative temperatures. Comparison of elongation at 400 °C is of no great significance. However, we can claim, and the curves of the measured values confirm, that the coating caused a slight decrease of thermal expansion during cyclic thermal loading, as these curves move below the curves of the reference sample.
In terms of the increase of elongation depending on the increasing temperature, sample N shows the best values, which reach fascinating values, even during repeated thermal loading. Since there are no fluctuations in the waveforms, it is clear that cracking of the coating has no effect on the functionality of the coating. Practically the entire process shows a decrease of thermal expansion. The linear course, even in values below the reference sample, is very favorable. It is also important to notice what elongation values the sample acquired at a negative temperature of −20 °C. However, the benefit is rather the value of the increase at 400 °C, which is more than 10 µm smaller than that of the reference sample. According to the results, the coating improves its effect on the reduction of thermal expansion after repeated temperature loading, which is a very favorable finding for industrial use.

5. Conclusions

The basis of this work was the application of geopolymer coatings using a brush on an aluminum substrate in order to determine the quality of the applied layers using a cheap and inexpensive technique. A total of eight geopolymer suspensions with different chemical compositions were characterized and compared. The results show:
  • Except geopolymer coatings J and N, all others showed the presence of coating cracks of varying sizes. In addition, the J and N coatings had a very smooth surface structure. Suspension M contained the largest cracks, and bubbles were formed in the coating and the layer partially peeled off.
  • The thickness of the coatings varies in the order of units of µm, where the thinnest coating was achieved with suspension J, which was 1.5 µm. A thinner layer was achieved by sample H, which was 11.1 µm. The surface structure of the geopolymer layer affects the resulting thickness of the coating.
  • In the grid test of the adhesion of the layer to the underlying substrate, all geopolymers achieved a rating of 1, i.e., separation of the coating along the section with a total area of up to 5%, except suspension H, which was rated 2, where the area of the separated coating was 5%–15%.
  • The evaluation of the grid test shows that the adhesion of the selected geopolymer suspensions was at a very high level and the cracks observed in the coatings did not negatively affect the adhesion.
  • In the measurement of microhardness, suspension N reached the highest value of 189.4 HV 0.1, which is a 102% increase compared to the microhardness of the underlying AlMgSi0.5 substrate, which reached 93.6 HV 0.1. Except for suspension H (57.1 HV 0.1, a decrease of −39%), all suspensions achieved higher microhardness against the substrate.
  • Furthermore, it is evident from the microhardness measurement that the presence of Al2O3 nanoparticles positively affects the microhardness of the coatings. On the contrary, the presence of graphite in the mixture affects micro-hardness negatively.
  • The results from the dilatometric analysis were determined based on the comparison of the thermal expansion of the reference sample from the AlMgSi0.5 alloy without a coating with samples of this alloy with a geopolymer coating in the temperature range −20–400 °C in the first phase of the first cycle and after two full cycles.
  • After the first phase of the first cycle (−20–400 °C), suspensions G, I and M did not show a significant effect on thermal expansion and the curves copied the curve measured for the reference sample without coating.
  • Samples H and J increased thermal expansion. On the contrary, suspensions K, L and N showed a decrease of the thermal expansion of the sample, where the best result was achieved by suspension N, for which, after reaching 100 °C, there was a linear decrease of thermal expansion up to 400 °C.
  • For cyclic loading, samples G, H, I, J and M did not experience significant changes during the second cycle. On the contrary, with suspensions K, L and N, the functionality of the coating was positively reflected in the reduction of thermal expansion, even during repeated cyclic loading, when it further decreased.
  • In terms of the increase of elongation depending on the increasing temperature, sample N showed the best values, which achieved a reduction in thermal expansion by more than 10 µm when subjected to repeated thermal loading compared to the reference sample. Additionally, the highest increase of microhardness compared to the underlying substrate was recorded for this sample.
  • Microscopic analysis of the samples shows that at a temperature of 400 °C, large cracks already formed in the coating, which, except for sample M, did not affect the adhesion of the coating to the substrate.
  • The results show that even with very small thicknesses of geopolymer layers in the order of µm, these coatings are able to influence the resulting thermal expansion, either negatively or positively.
  • It seems that the state of the underlying substrate has no effect on the adhesion properties and general adhesion of the coated layer.

Author Contributions

Conceptualization, M.J. and F.M.; methodology, M.J., F.M. and J.M.; validation, J.N. and M.J.; formal analysis, F.M., J.M., R.H. and P.H.; investigation, M.J., F.M. and J.M.; resources, M.J., F.M. and J.M.; data curation, J.N. and M.J.; writing—original draft preparation, M.J., F.M. and J.M. writing—review and editing, J.N. and M.J.; visualization, F.M. and J.M.; supervision, J.N.; project administration, M.J. and F.M.; funding acquisition, J.N. and M.J. All authors have read and agreed to the published version of the manuscript.

Funding

This research was funded by Creation of micro and nanocomposites based on inorganic matrices—MSMT No. CZ.02.2.69/0.0/0.0/19_073/0016947.

Institutional Review Board Statement

Not applicable.

Informed Consent Statement

Not applicable.

Data Availability Statement

Data sharing is not applicable to this article.

Conflicts of Interest

The authors declare no conflict of interest.

References

  1. Kolek, T. Research on the Properties of Geopolymer Coatings Doped with Particles of Alloys and Metal Oxides. Master’s Thesis, Jan Evangelista Purkyně University in Ústí nad Labem, Faculty of Mechanical Engineering, Institute of Technology and Materials, Ústí nad Labem, Czech Republic, 2021. [Google Scholar]
  2. Matsimbe, J.; Dinka, M.; Olukanni, D.; Musonda, I. Geopolymer: A systematic review of methodologies. Materials 2022, 15, 6852. [Google Scholar] [CrossRef] [PubMed]
  3. Perna, I.; Hanzlicek, T.; Zaloudkova, M. Microscopic study of the concrete/geopolymer coating interface. Ceram. Silikáty 2020, 64, 68–74. [Google Scholar] [CrossRef]
  4. Azimi, E.A.; Al Bakri Abdullah, M.M.; Ming, L.Y.; Yong, H.C.; Hussin, K.; Aziz, I.H. Processing and properties of geopolymers as thermal insulating materials: A review. Rev. Adv. Mater. Sci. 2016, 44, 273–285. [Google Scholar]
  5. Barbosaa, V.F.; MacKenzieb, K.J.; Thaumaturgo, C. Synthesis and characterisation of materials based on inorganic polymers of alumina and silica: Sodium polysialate polymers. Int. J. Inorg. Mater. 2000, 2, 309–317. [Google Scholar] [CrossRef]
  6. Peng, H.; Cui, C.; Cai, C.S.; Liu, Y.; Liu, Z. Microstructure and microhardness property of the interface between a metakaolin/GGBFS-based geopolymer paste and granite aggregate. Constr. Build. Mater. 2019, 221, 263–273. [Google Scholar] [CrossRef]
  7. Jamaludin, L.; Razak, R.A.; Al Bakri Abdullah, M.M.; Kusbiantoro, A.; Yahya, Z.; Abdullah, A.; Sandu, A.V. Geopolymer coating paste on concrete for photocatalytic performance. AIP Conf. Proc. 2021, 2339, 020187. [Google Scholar]
  8. Horký, R. Analysis of the effect of geopolymer coatings on thermal dilatations of metal alloys. Master’s Thesis, Jan Evangelista Purkyně University in Ústí nad Labem, Faculty of Mechanical Engineering, Institute of Technology and Materials, Ústí nad Labem, Czech Republic, 2021. [Google Scholar]
  9. Weng, L.; Sagoe-Crentsil, K. Dissolution processes, hydrolysis and condensation reactions during geopolymer synthesis: Part I—Low Si/Al ratio systems. J. Mater. Sci. 2007, 42, 2997–3006. [Google Scholar] [CrossRef]
  10. Jamaludin, L.; Razak, R.A.; Al Bakri Abdullah, M.M.; Vizureanu, P.; Bras, A.; Imjai, T.; Sandu, A.V.; Rahim, S.Z.; Yong, H.C. The suitability of photocatalyst precursor materials in geopolymer coating applications: A review. Coatings 2022, 12, 1348. [Google Scholar] [CrossRef]
  11. Davidovits, R.; Pelegris, C.; Davidovits, J. Standardized method in testing commercial metakaolins for geopolymer formulations. Geopolym. Inst. Libr. 2019. [Google Scholar] [CrossRef]
  12. Erdman, V. Creating coatings based on geopolymer suspension. Bachelor’s Thesis, Jan Evangelista Purkyně University in Ústí nad Labem, Faculty of Mechanical Engineering, Institute of Technology and Materials, Ústí nad Labem, Czech Republic, 2020. [Google Scholar]
  13. Břešťan, T. Evaluation of the Possibility of Creating Building Materials Using Energy by-Products. Bachelor’s Thesis, Jan Evangelista Purkyně University in Ústí nad Labem, Faculty of Mechanical Engineering, Institute of Technology and Materials, Ústí nad Labem, Czech Republic, 2022. [Google Scholar]
  14. Vickers, L.; Riessen, v.A.; Rickard, W.D.A. Fire-Resistant Geopolymers Role of Fibres and Fillers to Enhance Thermal Properties; Springer: Berlin, Germany, 2015; pp. 10–14. [Google Scholar]
  15. Amritphale, S.S.; Bhardwaj, P.; Gupta, R. Advanced Geopolymerization Technology. In Geopolymers and Other Geosynthetics; IntechOpen: London, UK, 2020. [Google Scholar]
  16. Wang, A.; Fang, Y.; Zhou, Y.; Wang, C.; Dong, B.; Chen, C. Green Protective Geopolymer Coatings: Interface Characterization, Modification and Life-Cycle Analysis. Materials 2022, 15, 3767. [Google Scholar] [CrossRef]
  17. Cirstea, N.F.; Badanoiu, A.; Boscornea, A.C. Intumescent Silicate Coatings with the Addition of Alkali-Activated Materials. Polymers 2022, 14, 1937. [Google Scholar] [CrossRef]
  18. Akeed, M.H. Mine Tailings-based Geopolymers: Durability, Microstructure, Thermal and Leaching Properties; ScienceOpen Preprints: Sydney, Australia, 2022. [Google Scholar]
  19. Zhu, C.; Guo, Y.; Wen, Z.; Zhou, Y.; Zhang, L.; Wang, Z.; Fang, Y.; Long, W. Hydrophobic Modification of a Slag-based Geopolymer Coating. IOP Conf. Ser. Earth Environ. Sci. 2021, 783, 012015. [Google Scholar] [CrossRef]
  20. Gupta, R.; Tomar, A.S.; Mishra, D.; Sanghi, S.K. Multifaceted geopolymer coating: Material development, characterization and study of long term anti-corrosive properties. Microporous Mesoporous Mater. 2021, 317, 110995. [Google Scholar] [CrossRef]
  21. Machovský, T. Testing the Reactivity of Raw Materials for Geopolymerization. Master’s Thesis, Jan Evangelista Purkyně University in Ústí nad Labem, Faculty of Mechanical Engineering, Institute of Technology and Materials, Ústí nad Labem, Czech Republic, 2009. [Google Scholar]
  22. Temuujin, J.; Minjigmaa, A.; Rickard, W.; van Riessen, A. Thermal properties of spray-coated geopolymer-type compositions. J. Therm. Anal. Calorim. 2012, 107, 287–292. [Google Scholar] [CrossRef]
  23. Wahyuni, S.; Permatasari, A.D.; Irfanita, R.; Sudarman, S. Subaer The thermal properties of metakaolin geopolymer coated with MgO particles. AIP Conf. Proc. 2019, 2129, 020092. [Google Scholar]
  24. Barbosa, V.F.F.; MacKenzie, K.J.D. Thermal behaviour of inorganic geopolymers and composites derived from sodium polysialate. Mater. Res. Bull. 2003, 38, 319–331. [Google Scholar] [CrossRef]
  25. Duxson, P.; Lukey, G.C.; van Deventer, J.S.J. Thermal evolution of metakaolin geopolymers: Part 1—Physical evolution. J. Non-Cryst. Solids 2006, 352, 2186–2200. [Google Scholar] [CrossRef]
  26. Van Riessen, A.; Rickard, W.; Sanjayan, J. Thermal properties of geopolymers. Geopolymers 2009, 315–342. [Google Scholar] [CrossRef]
  27. Wang, Z.; Rong, X.; Zhao, L.; Xing, X.; Ma, H. Effects of Substrate Surface Characteristics on the Adhesion Properties of Geopolymer Coatings. ACS Omega 2022, 7, 11988–11994. [Google Scholar] [CrossRef]
  28. Shahedan, N.F.; Mustafa, M.; Al Bakri Abdullah, M.M.; Kamarudin, H.; Sandu, I.; Ruzaidi, C.M.; Ghazali, R.; Binhussain, M.; Yahya, Z.; Sandu, A.V. Characterization and Design of Alkali Activated Binder for Coating Application. Mater. Plast. 2014, 51, 258. [Google Scholar]
  29. Mao, Y.; Biasetto, L.; Colombo, P. Metakaolin-based geopolymer coatings on metals by airbrush spray deposition. J. Coat. Technol. Res. 2020, 17, 991–1002. [Google Scholar] [CrossRef]
  30. Chuchala, D.; Dobrzynski, M.; Pimenov, D.Y.; Orlowski, K.A.; Krolczyk, G.; Giasin, K. Surface Roughness Evaluation in Thin EN AW-6086-T6 Alloy Plates after Face Milling Process with Different Strategies. Materials 2021, 14, 3036. [Google Scholar] [CrossRef] [PubMed]
  31. Hattori, N.; Matsumoto, R.; Utsunomiya, H. Residual Stress Distribution through Thickness in Cold-Rolled Aluminum Sheet. Key Eng. Mater. 2014, 622–623, 1000–1007. [Google Scholar] [CrossRef]
  32. Yong, S.L.; Feng, D.W.; Lukey, G.C.; Van Deventer, J.S.J. Chemical characterisation of the steel-geopolymeric gel interface. Colloid Surfaces. Physicochem. Eng. Asp. 2007, 302, 411–423. [Google Scholar] [CrossRef]
  33. Temuujin, J.; Minjigmaa, A.; Rickard, W.; Lee, M.; Williams, I.; van Riessen, A. Fly ash based geopolymer thin coatings on metal substrates and its thermal evaluation. J. Hazard Mater. 2010, 180, 748–752. [Google Scholar] [CrossRef]
  34. Temuujin, J.; Minjigmaa, A.; Rickard, W.; Lee, M.; Williams, I.; van Riessen, A. Preparation of metakaolin based geopolymer coatings on metal substrates as thermal barriers. Appl. Clay Sci. 2009, 46, 265–270. [Google Scholar] [CrossRef]
  35. Norkhairunnisa, M.; Fariz, M.N. Geopolymer: A review on physical properties of inorganic aluminosilicate coating materials. Mater. Sci. Forum 2015, 803, 367–373. [Google Scholar] [CrossRef]
  36. Temuujin, J.; Rickard, W.; Lee, M.; van Riessen, A. Preparation and thermal properties of fire resistant metakaolin-based geopolymer-type coatings. J. Non-Cryst. Solids 2011, 357, 1399–1404. [Google Scholar] [CrossRef]
  37. Leiva, C.; Vilches, L.F.; Querol, X.; Vale, J.; Fernandez, C.P. Use of Zeolitised Fly Ashes in Fire Resistant Plates. In Proceedings of the World of Coal Ash: Science, Applications and Sustainability; World of Coal Ash: Covington, KY, USA, 2007. [Google Scholar]
  38. Vilches, L.F.; Pereira, C.F.; del Valle, J.O.; Piñero, M.R.; Vale, J. Development of new fire-proof products made from coal fly ash: The CEFYR project. J. Chem. Technol. Biot. 2002, 77, 361–366. [Google Scholar] [CrossRef]
  39. EN AW 6060; AlMgSi. Vydavatelství Úřadu pro Normalizaci a Měření: Prague, Czech Republic, 1978.
  40. Nedal Aluminium. Available online: https://www.nedal.com/wp-content/uploads/2019/07/NEDAL_Datasheet-6060.pdf (accessed on 25 October 2022).
  41. Kanaboyana, N.; Hanchate, S.R.; Ghorpade, V.G. Durability properties of geopolymer concrete produced with recycled coarse aggregates and quarry stone dust. Nat. Volatiles Essent. Oils 2021, 8, 10450–10459. [Google Scholar]
  42. Ruzaidi, C.M.; Al Bakri, A.M.; Binhusain, M.; Salwa, M.S.; Alida, A.; Faheem, M.T.; Azlin, S.S. Study on properties and morphology of kaolin based geopolymer coating on clay substrates. Key Eng. Mater. 2014, 594–595, 540–545. [Google Scholar] [CrossRef]
  43. Zainal, F.F.; Fazill, M.F.; Hussin, K.; Rahmat, A.; Al Bakri Abdullah, M.M.; Wazien, W. Effect of Geopolymer Coating on Mild Steel. Solid State Phenom. 2018, 273, 175–180. [Google Scholar] [CrossRef]
  44. Zhang, X.; Yao, A.; Chen, L. A Review on the Immobilization of Heavy Metals with Geopolymers. Adv. Mater. Res. 2013, 634–638, 173–177. [Google Scholar] [CrossRef]
  45. Lingyu, T.; Dongpo, H.; Jianing, Z.; Hongguang, W. Durability of geopolymers and geopolymers concretes: A review. Rev. Adv. Mater. Sci. 2021, 60, 1–14. [Google Scholar] [CrossRef]
  46. Bhardwaj, P.; Gupta, R.; Deshmukh, K.; Mishra, D. Optimization studies and characterization of advanced geopolymer coatings for the fabrication of mild steel substrate by spin coating technique. Indian J. Chem. Technol. 2021, 28, 59–67. [Google Scholar]
  47. Rong, X.; Wang, Z.; Xing, X.; Zhao, L. Review on the Adhesion of Geopolymer Coatings. ACS Omega 2021, 6, 5108–5112. [Google Scholar] [CrossRef]
  48. Jiang, C.; Wang, A.; Bao, X.; Chen, Z.; Ni, T.; Wang, Z. Protective Geopolymer Coatings Containing Multi-Componential Precursors: Preparation and Basic Properties Characterization. Materials 2020, 13, 3448. [Google Scholar] [CrossRef]
  49. Novotný, J.; Hren, I.; Michna, Š.; Legutko, S. Analysis of Composite Coating of Deep Drawing Tool. Coatings 2022, 12, 863. [Google Scholar] [CrossRef]
  50. Aksenov, V.V.; Vlasov, V.M.; Shnitko, G.N. Layered compounds of alkali metals in graphite in fine organic synthesis. Russ. Chem. Rev. 1990, 59, 738. [Google Scholar] [CrossRef]
  51. Lee, D.-W.; Kim, H.-J.; Kim, Y.-N.; Jeon, M.-S.; Nam, S.-M. Substrate hardness dependency on properties of Al2O3 thick films grown by aerosol deposition. Surf. Coat. Technol. 2012, 209, 160–168. [Google Scholar] [CrossRef]
  52. DIL L75 PT Vertical. Available online: https://www.linseis.com/en/products/dilatometer/dil-l75-pt-vertical/ (accessed on 30 September 2022).
Figure 1. Surface detail of the EN-AW 6060 underlying substrate with visible directional anisotropy and roughness measurement in direction of rolling A and perpendicular direction of rolling B.
Coatings 12 01695 g001
Figure 2. Detail of the degradation of sample K and M after application of a thick suspension layer.
Coatings 12 01695 g002
Figure 3. Temperature curve during the curing of geopolymer suspensions.
Coatings 12 01695 g003
Figure 4. SEM and CLSM analysis of the surface of G–N geopolymer suspensions.
Coatings 12 01695 g004aCoatings 12 01695 g004b
Figure 5. Lattice test of geopolymer suspensions G–N.
Coatings 12 01695 g005
Figure 6. HV 0.1 microhardness of underlying substrate AlMgSi0.5 and G–N geopolymer suspensions.
Coatings 12 01695 g006
Figure 7. Percentage increase of HV 0.1 microhardness of G–N geopolymer layers compared to the underlying substrate AlMgSi0.5.
Coatings 12 01695 g007
Figure 8. Schema of a dilatometer.
Coatings 12 01695 g008
Figure 9. Thermal expansion analysis and laser microscopy of sample G and H.
Coatings 12 01695 g009
Figure 10. Thermal expansion analysis and laser microscopy of sample I and J.
Coatings 12 01695 g010
Figure 11. Thermal expansion analysis and laser microscopy of sample K and L.
Coatings 12 01695 g011
Figure 12. Thermal expansion analysis and laser microscopy of sample M and N.
Coatings 12 01695 g012
Figure 13. Analysis of thermal expansion during cyclic loading of the sample H and K.
Coatings 12 01695 g013
Figure 14. Analysis of thermal expansion during cyclic loading of the sample L and N.
Coatings 12 01695 g014
Table 1. Composition and overview of the basic properties of EN-AW 6060 alloy [40].
Si, wt.%Fe, wt.%Cu, wt.%Mn, wt.%Mg, wt.%Cr, wt.%Zn, wt.%Others, wt.%Al
0.30–0.600.10–0.30Max. 0.10Max. 0.100.35–0.60Max. 0.05Max. 0.15Max. 0.15Remain
Rp0.2, MPa>215
Rm, Mpa>160
A5, %8
Melting range, °C585–650
HB70
Co-efficient of thermal expansion, 10−6·K−123.4
Rp0.2—yield strength; Rm—tensile strength; A5—elongation; Z—contraction; HB—Brinell hardness.
Table 2. XRF analysis of EN-AW 6060 alloy.
ComponentWt.%Detection Limit
Al98.7000.01020
Si0.4900.00152
Fe0.1970.00160
Cu0.0050.00094
Mn0.0370.00216
Mg0.4150.00472
Cr--
Zn0.0150.00079
Table 3. Surface roughness of the underlying substrate EN-AW 6060.
Measurement Direction
ABUnit
Ra0.2060.841μm
Rz1.1175.410μm
Rmax1.4886.710μm
Rt1.6036.958μm
Table 4. Marking and composition of geopolymer suspensions.
Designation of Geopolymer SuspensionAcronym of SuspensionsIngredients
GH+ matrix modified aluminosilicateH3PO4 with kaolin KDG in H2O
HH+ matrix modified aluminosilicateH3PO4 with kaolin KDG v H2O and iPrOH with soft graphite
IAl-modified H+ matrixH3PO4 with AlOH3 in iPrOH
JAl-modified H+ matrixH3PO4 with nano Al2O3 in iPrOH
KAl-modified acid matrixH3PO4 with nano Al2O3
LAl-modified H+ matrixH3PO4 with kaolin KDG in iPrOH
MAl-modified SiBP matrixSodium water glass modified B + P with nano Al2O3
NAl-modified SiP matrixSiP matrix with nano Al2O3
Table 5. Thickness of geopolymer coatings G–N.
Designation of Geopolymer Suspension
GHIJKLMNUnit
Thickness average6.211.12.71.57.67.85.84.3μm
Standard deviation1.43.60.70.41.10.73.51.1μm
Thickness maximum8.819.74.02.19.78.914.36.5μm
Thickness minimum4.36.81.30.75.66.41.32.9μm
Table 6. Grid test evaluation of G–N geopolymer coatings.
Designation of Geopolymer Suspension
GHIJKLMN
Rating12111111
Table 7. Microhardness HV 0.1 of the underlying substrate AlMgSi0.5 and geopolymer coatings G–N and percentage increase compared to the underlying substrate.
Designation of Geopolymer Suspension
AlMgSi0.5GHIJKLMN
HV 0.193.6115.157.1118.4127.1153.897.6117.2189.4
Standard deviation3.77.52.95.18.04.74.213.56.2
Percentage increase023−39263664425102
Publisher’s Note: MDPI stays neutral with regard to jurisdictional claims in published maps and institutional affiliations.

