
Effect of Ag Doping on Photobleaching in Ge28Sb12Se60 Chalcogenide Films

Abstract
:1. Introduction
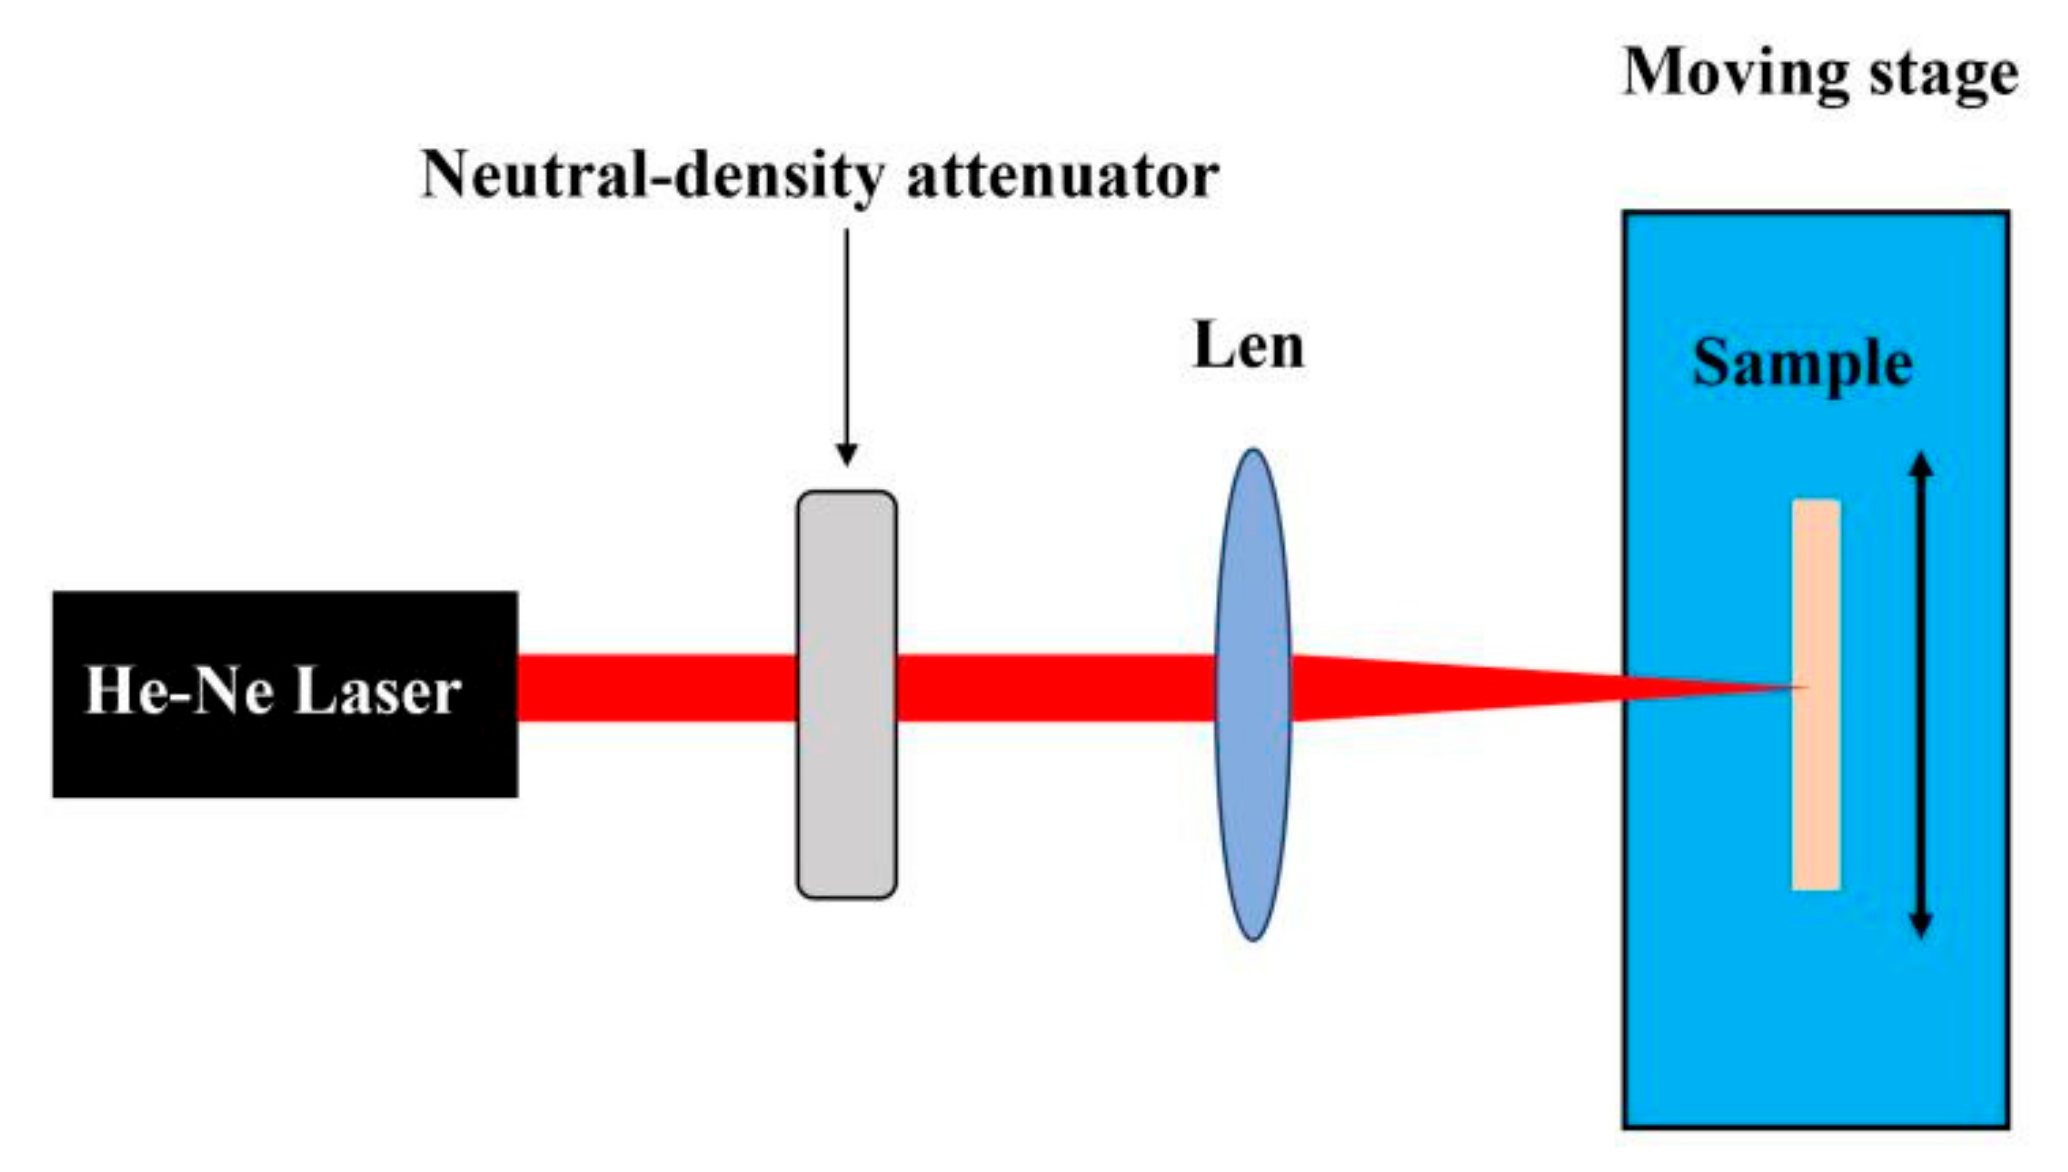
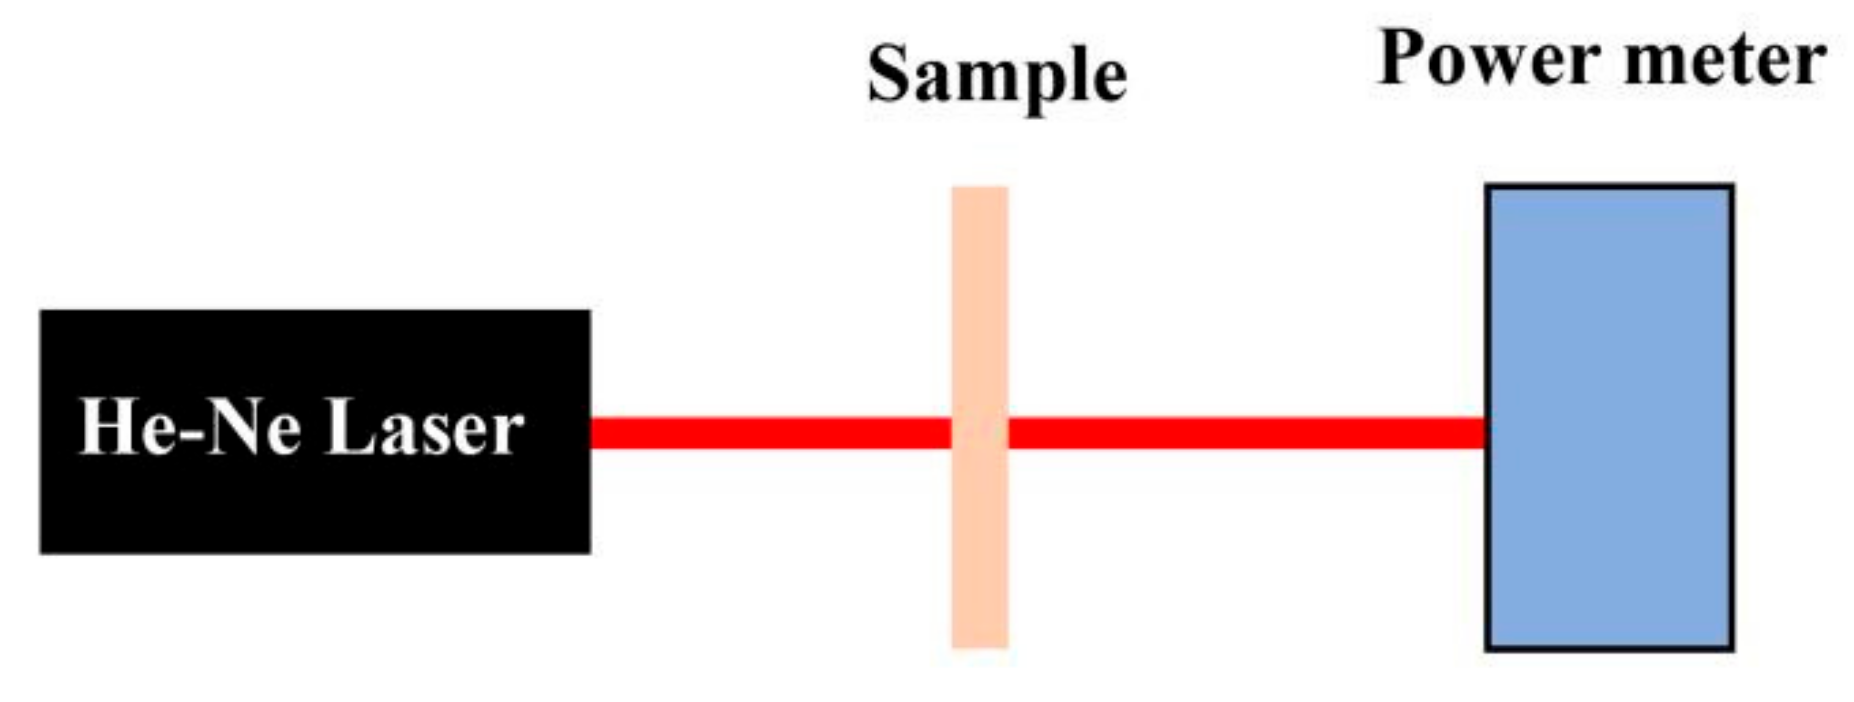
2. Experiments
3. Results and Discussion
3.1. Photobleaching in GSS Film
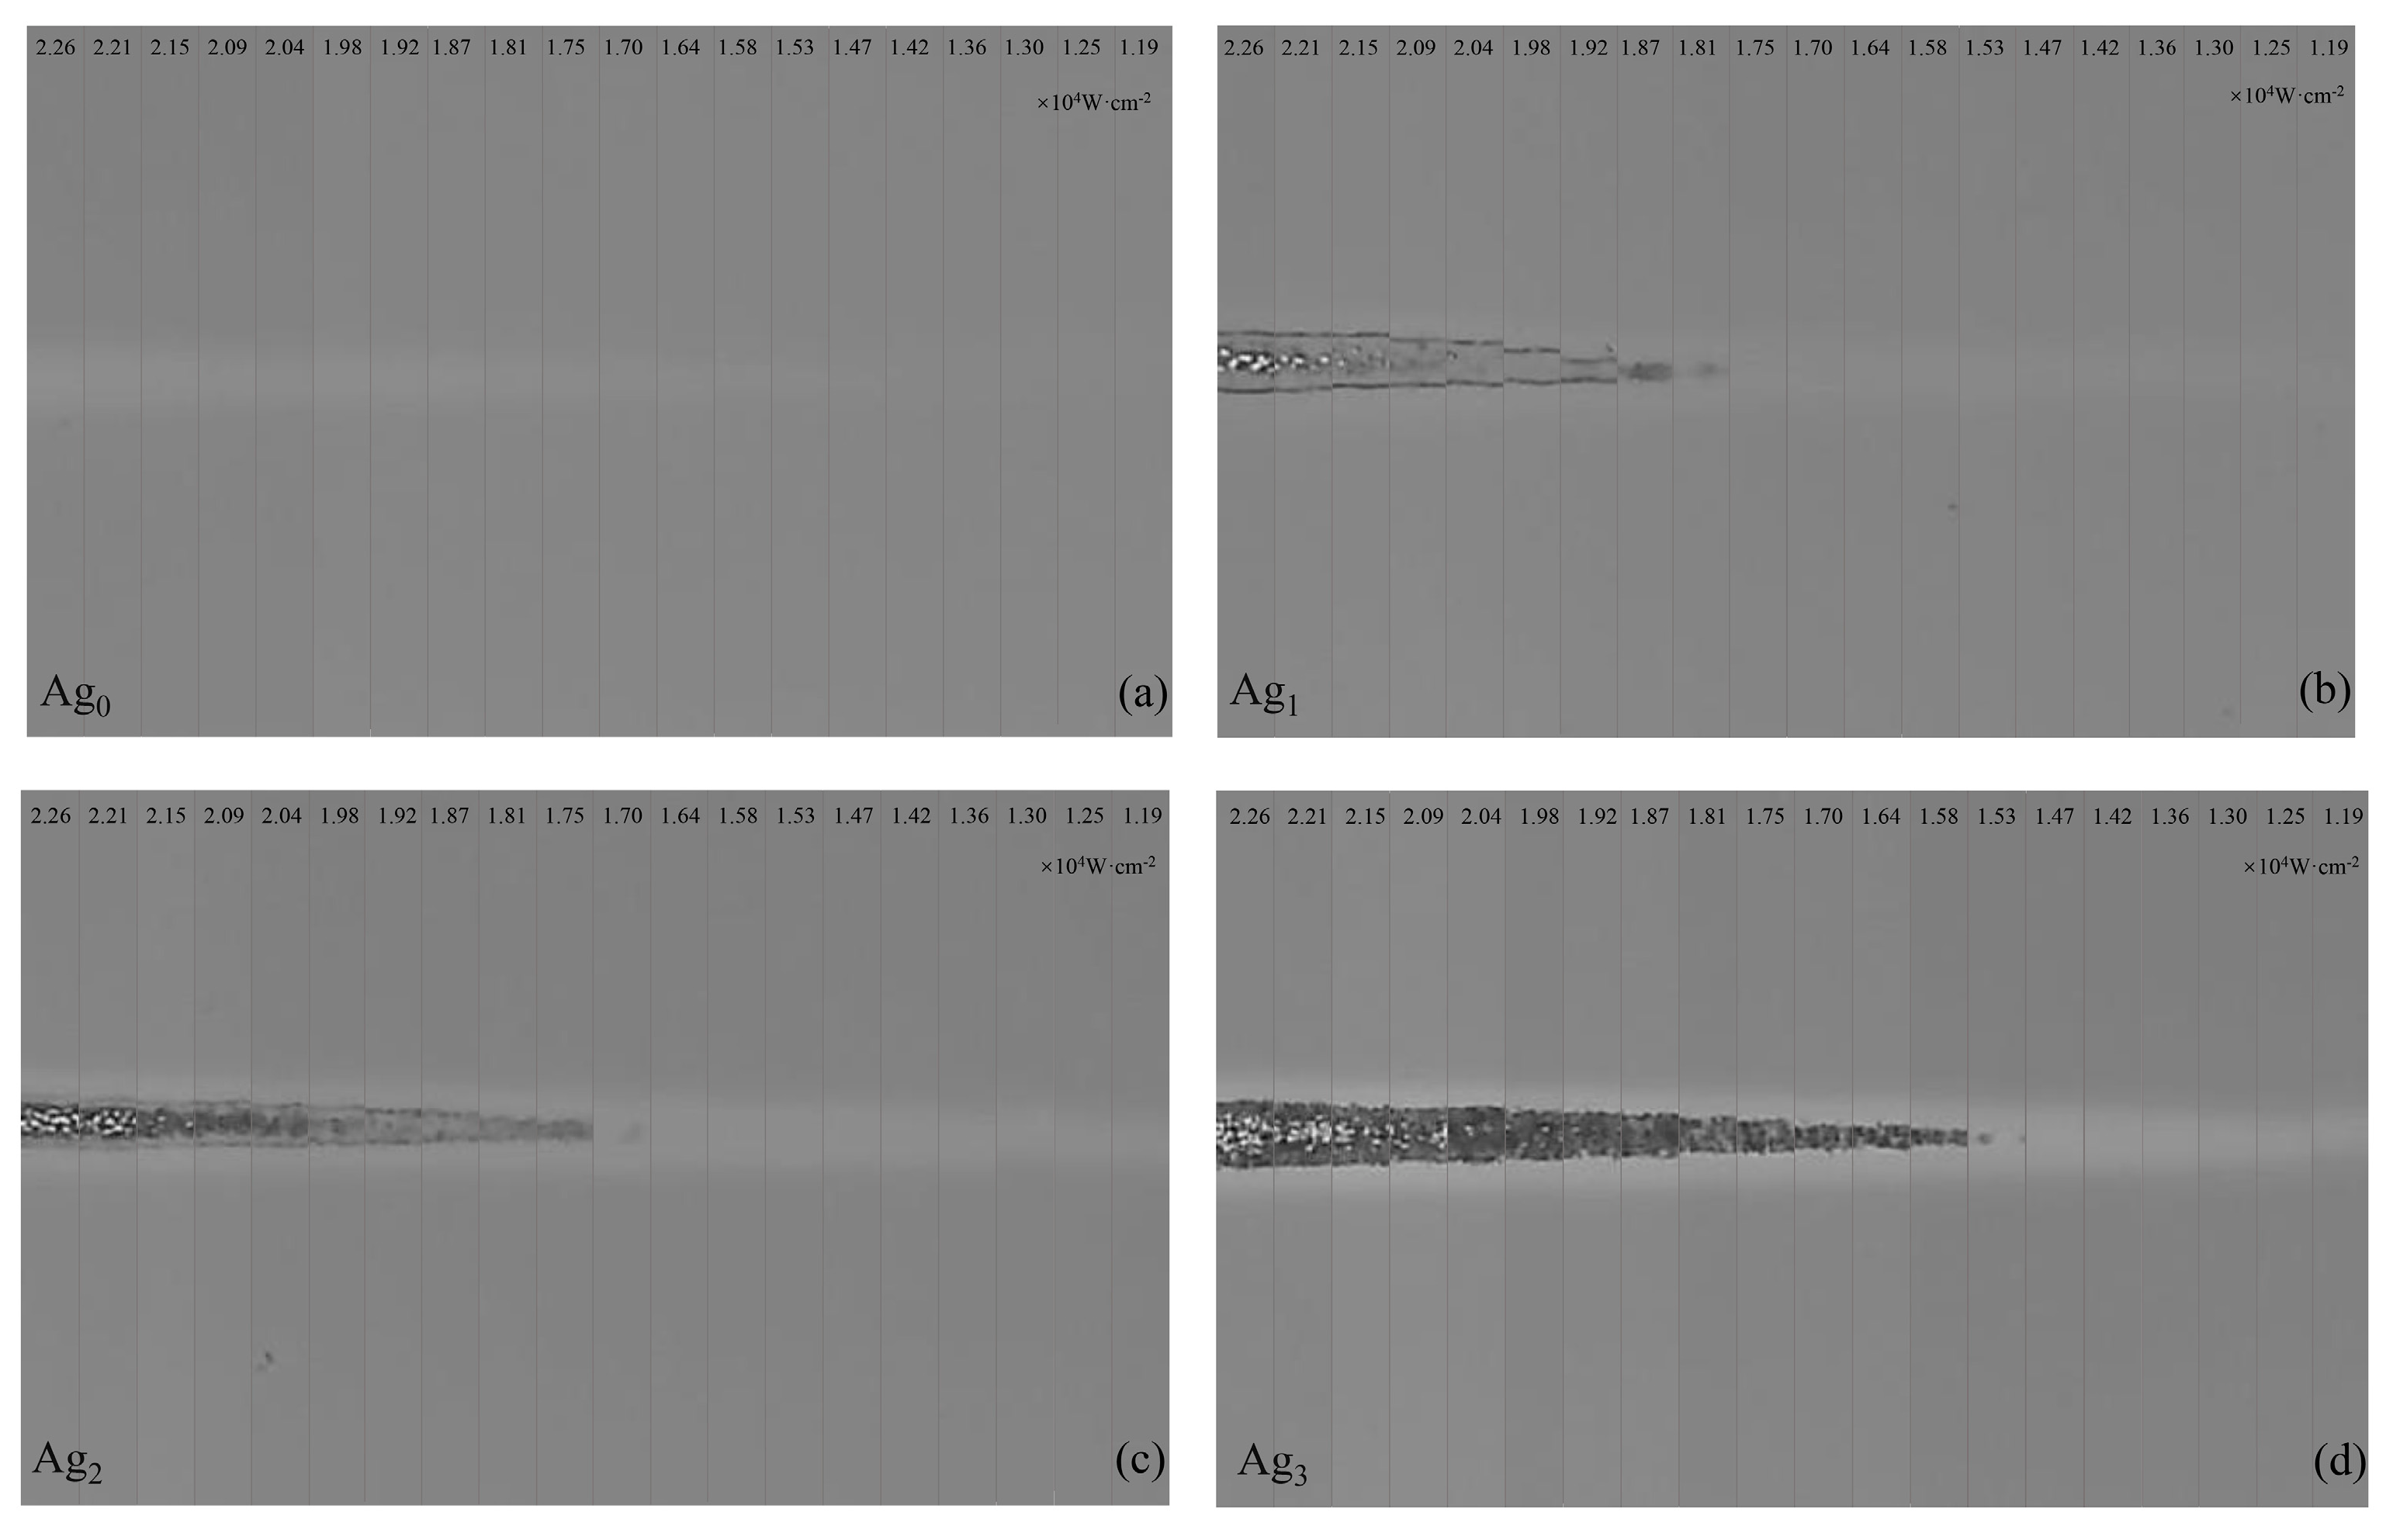
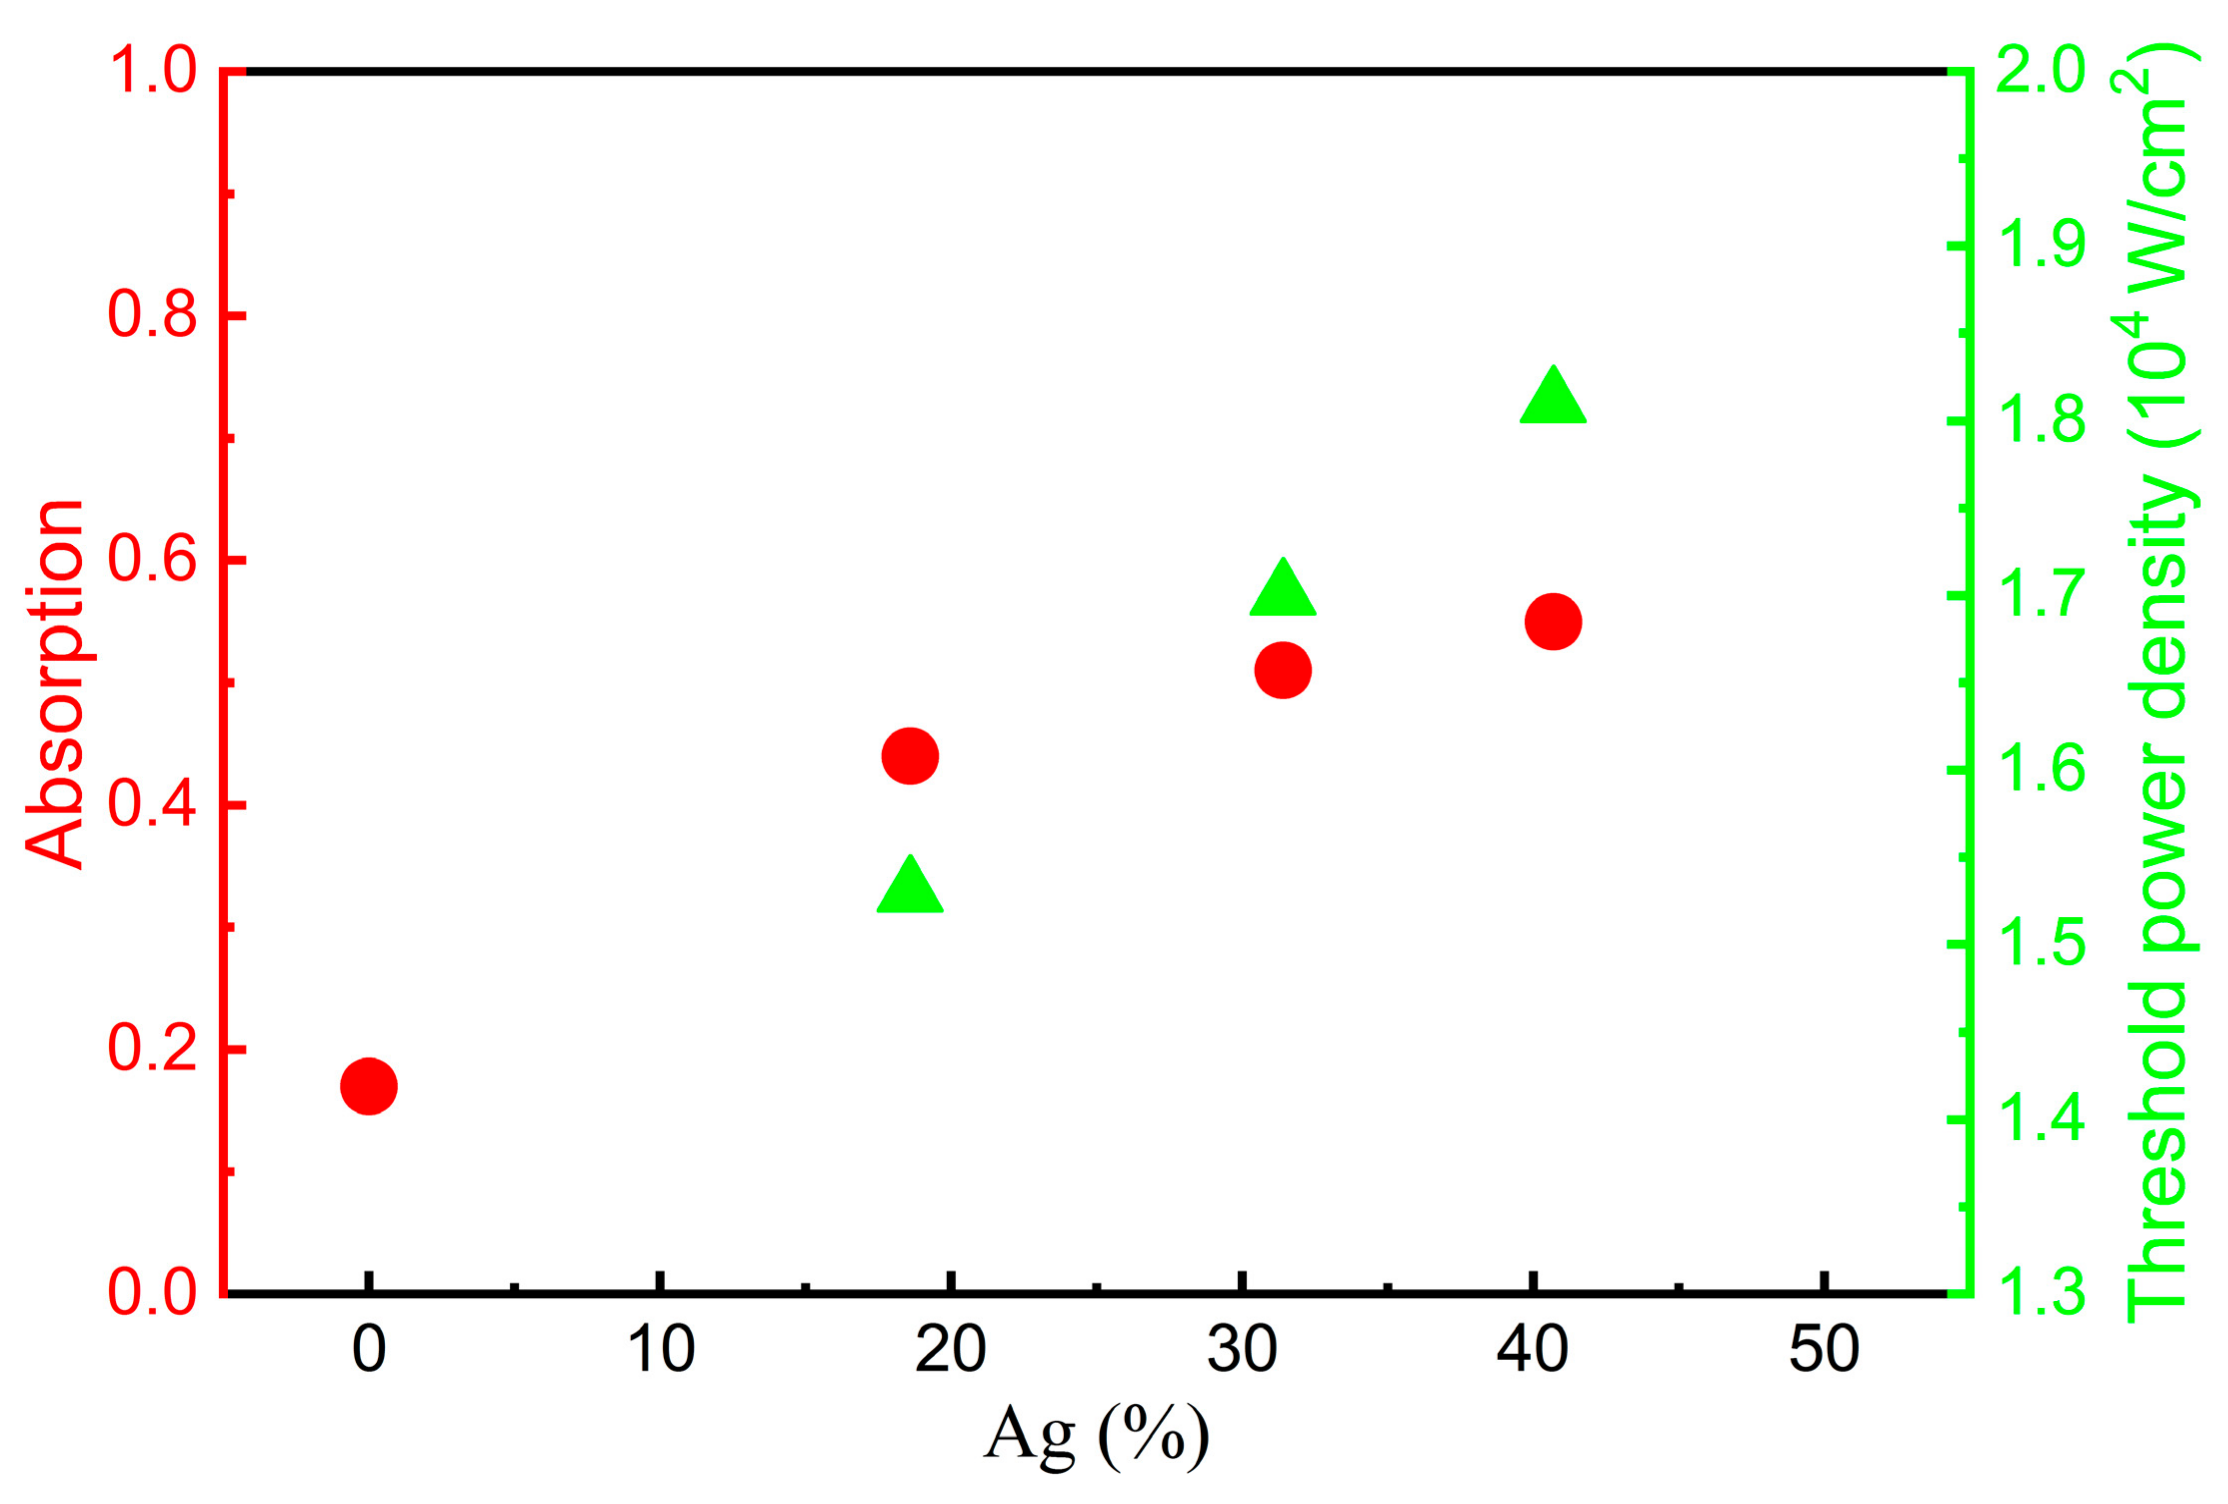
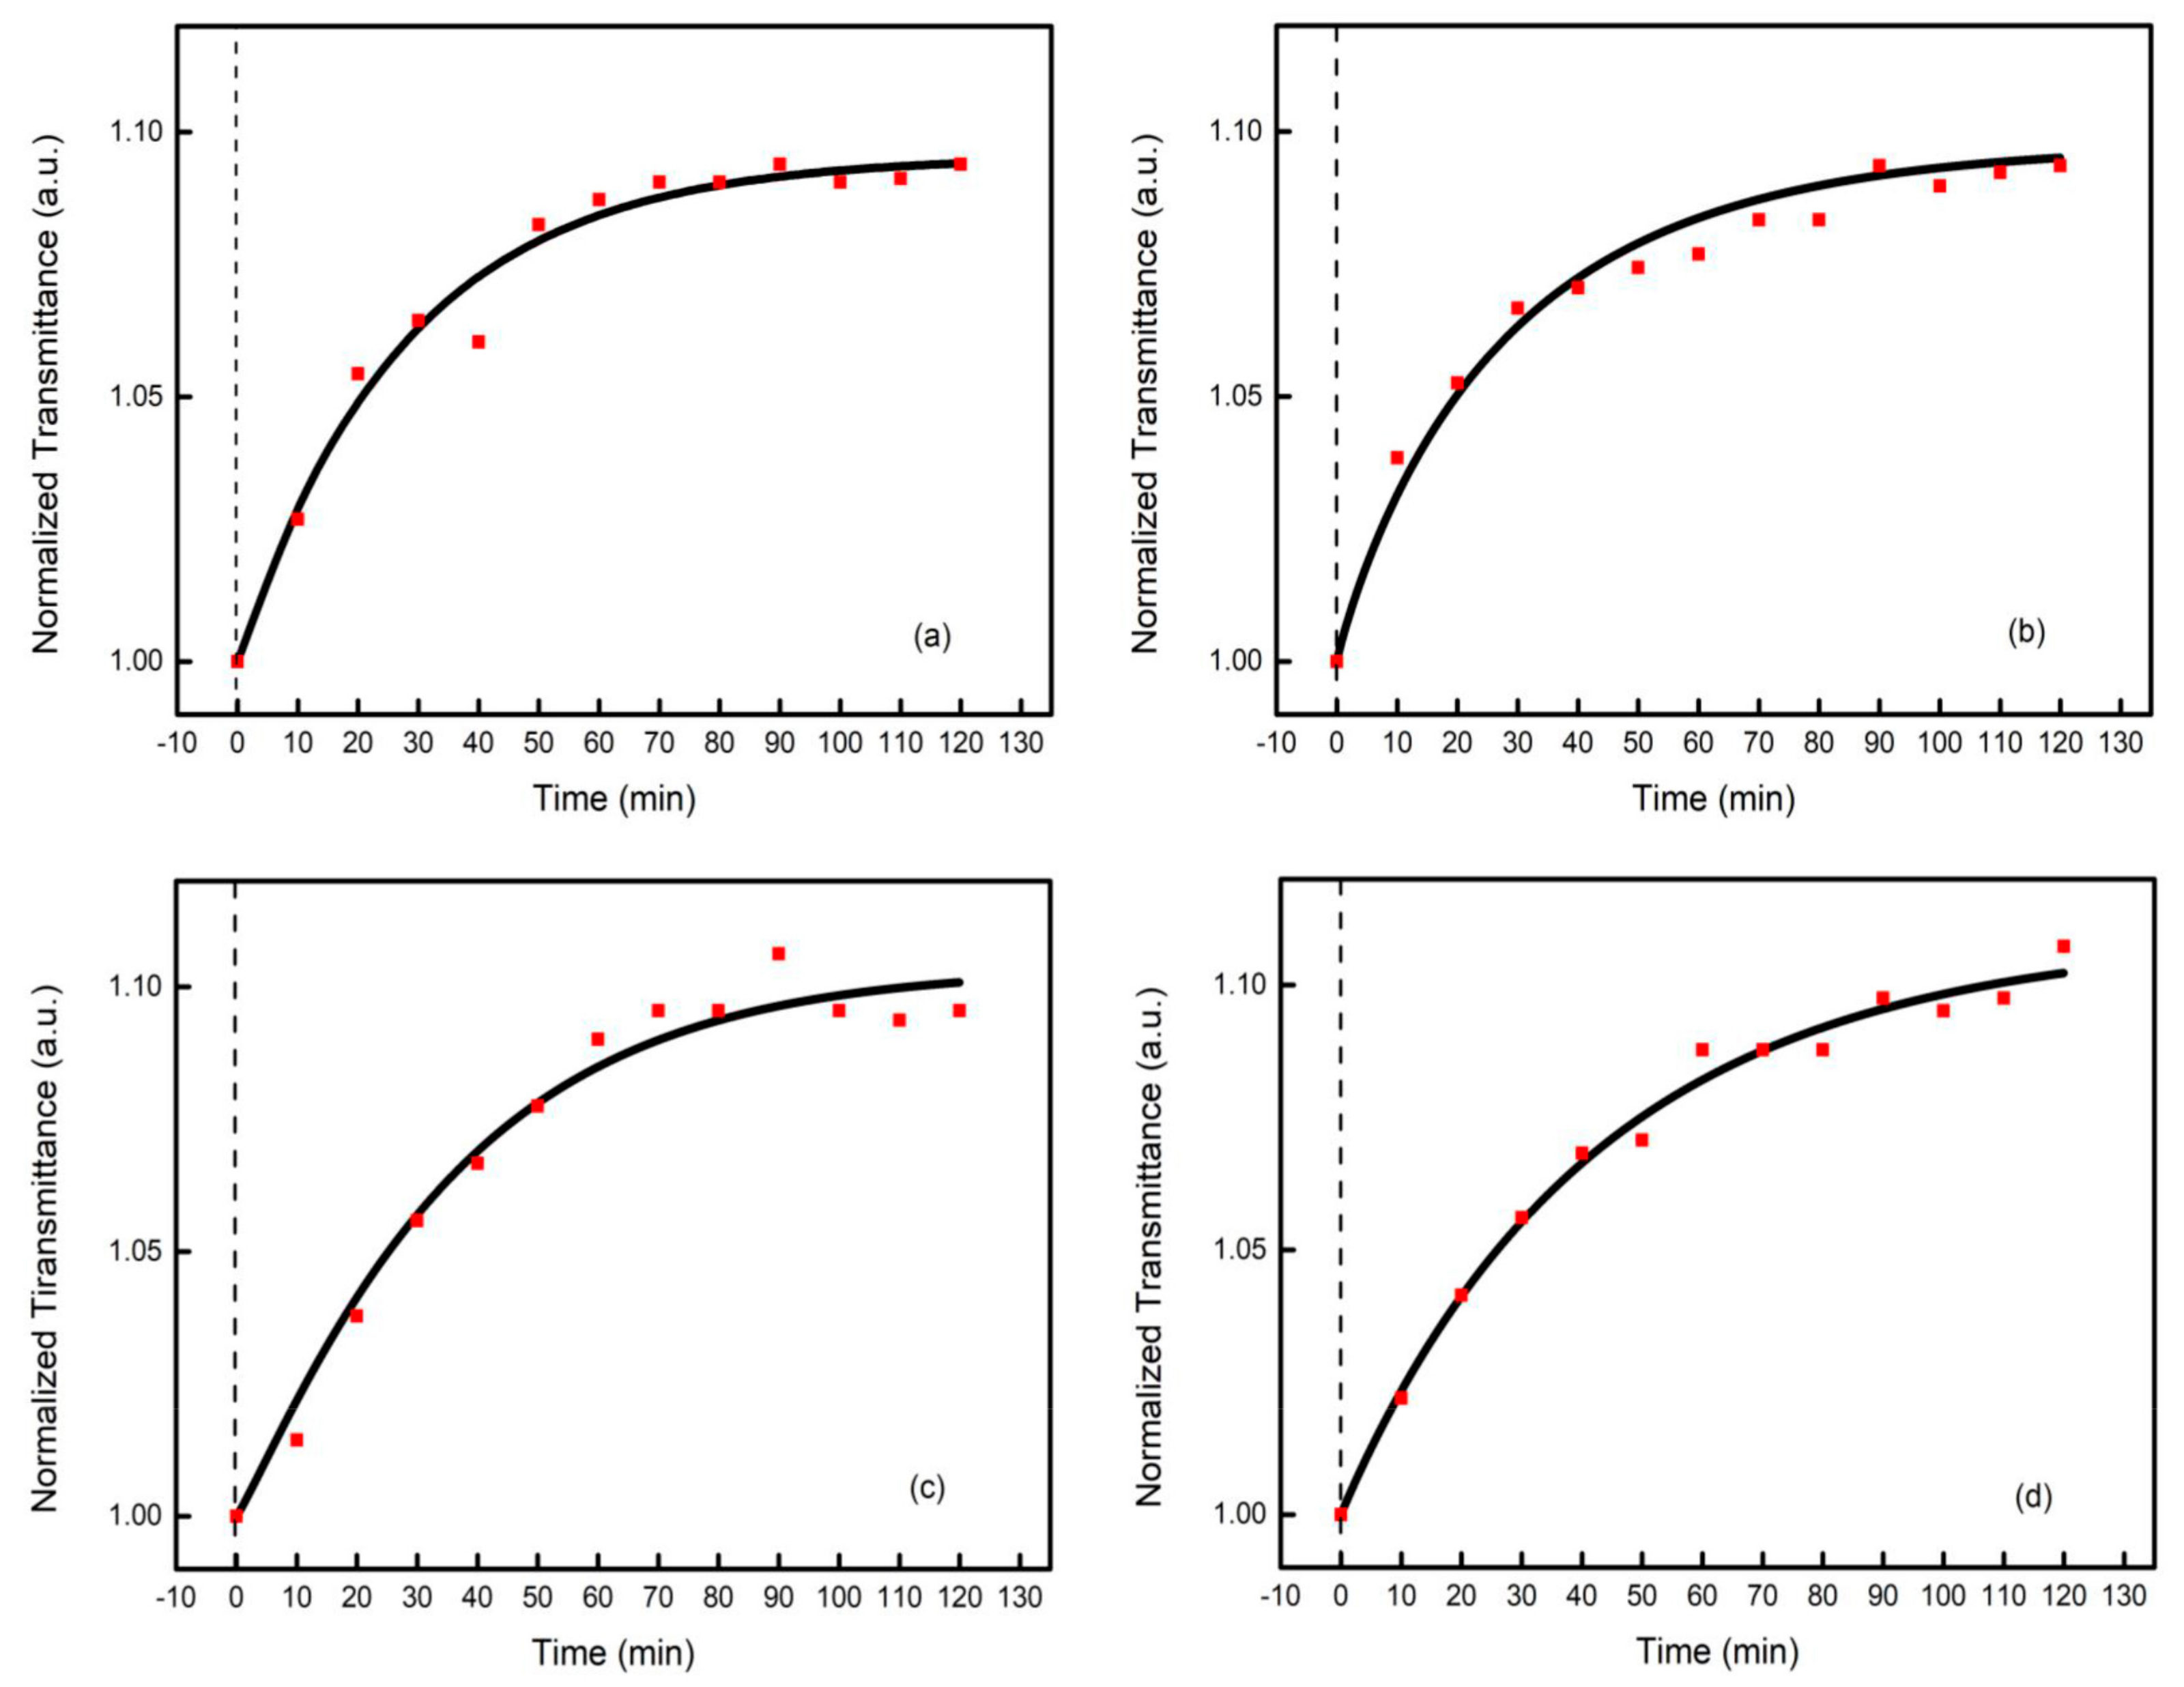
3.2. Photobleaching in GSS Films with Different Silver Concentrations
3.3. Laser-Induced Bleach Degree with Laser Power Density
3.4. Effects of the Laser Irradiation Time
4. Conclusions
Author Contributions
Funding
Conflicts of Interest
References
- Popescu, M.A. Non-Crystalline Chalcogenides; Kluwer: New York, NY, USA, 2000. [Google Scholar]
- Sharma, P.; Sharma, N.; Sharda, S.; Katyal, S.; Sharma, V. Recent developments on the optical properties of thin films of chalcogenide glasses. Prog. Solid State Chem. 2016, 44, 131–141. [Google Scholar] [CrossRef]
- Li, Q.; Wang, R.; Xu, F.; Wang, X.; Yang, Z.; Gai, X. Third-order nonlinear optical properties of Ge-As-Te chalcogenide glasses in mid-infrared. Opt. Mater. Express 2020, 10, 1413. [Google Scholar] [CrossRef]
- Ye, B.; Dai, S.; Wang, R.; Tao, G.; Zhang, P.; Wang, X.; Shen, X. Influence of the selenium content on thermo-mechanical and optical properties of Ge–Ga–Sb–S chalcogenide glasses. Infrared Phys. Technol. 2016, 77, 21–26. [Google Scholar] [CrossRef]
- Zhu, E.W.; Lin, C.G.; Jiao, Q. Effect of gallium addition on physical and structural properties of Ge–S chalcogenide glasses. Ceram. Int. 2017, 43, 12205. [Google Scholar] [CrossRef]
- Chen, F.; Qiao, B.; Dai, S.; Zhang, X.; Ji, W. Optical property of gold nanoparticle embedded chalcogenide glasses. Opt. Mater. Express 2018, 8, 3197–3207. [Google Scholar] [CrossRef]
- Yin, N.; Xu, J.; Chang, F.; Jian, Z.; Gao, C. Effect of Te proportion on the properties of Ge25Sb10Se65-Te chalcogenide glasses. Infrared Phys. Technol. 2019, 96, 361–365. [Google Scholar] [CrossRef]
- Shimakawa, K.; Kolobov, A.; Elliott, S. Photoinduced effects and metastability in amorphous semiconductors and insulators. Adv. Phys. 1995, 44, 475–588. [Google Scholar] [CrossRef]
- Fritzsche, H. Optical anisotropies in chalcogenide glasses induced by band-gap light. Phys. Rev. B 1995, 52, 15854–15861. [Google Scholar] [CrossRef]
- Tada, K.; Tanino, N.; Murai, T.; Liang, Y.; Furutani, K. Photodarkening effect in sputtered films of sulphur- and/or selenium-based chalcogenide glasses. Thin Solid Films 1983, 108, 293–299. [Google Scholar] [CrossRef]
- Frumar, M.; Frumarová, B.; Wágner, T.; Němec, P. Photo-Induced Phenomena in Amorphous and Glassy Chalcogenides. Photo-Induc. Metastability Amorph. Semicond. 2003, 2, 23–44. [Google Scholar] [CrossRef]
- Jánossy, I.; Jákli, A.; Hajtó, J. Photodarkening and light induced anisotropy in chalcogenide glasses. Solid State Commun. 1984, 51, 761–764. [Google Scholar] [CrossRef]
- Barik, A.R.; Naik, R.; Adarsh, K. Unusual observation of fast photodarkening and slow photobleaching in a-GeSe2 thin film. J. Non-Cryst. Solids 2013, 377, 179–181. [Google Scholar] [CrossRef]
- Naik, R.; Jena, S.; Ganesan, R.; Sahoo, N.K. Photo-induced optical bleaching in Ge12Sb25S63 amorphous chalcogenide thin films: Effect of 532 nm laser illumination. Laser Phys. 2015, 25, 036001. [Google Scholar] [CrossRef]
- Aparimita, A.; Naik, R.; Sripan, C.; Ganesan, R. Laser-induced optical photobleaching in Bi-doped Ge30Se70 amorphous thin films. Appl. Phys. A 2019, 126, 5. [Google Scholar] [CrossRef]
- Singh, P.; Sharma, P.; Sharma, V.; Thakur, A. Linear and non-linear optical properties of Ag-doped Ge2Sb2Te5thin films estimated by single transmission spectra. Semicond. Sci. Technol. 2017, 32, 045015. [Google Scholar] [CrossRef]
- Singh, P.; Singh, A.; Sharma, J.; Kumar, A.; Mishra, M.; Gupta, G.; Thakur, A. Reduction of Rocksalt Phase in Ag -Doped Ge2Sb2Te5: A Potential Material for Reversible Near-Infrared Window. Phys. Rev. Appl. 2018, 10, 054070. [Google Scholar] [CrossRef]
- Dahshan, A.; Hegazy, H.; Aly, K.; Sharma, P. Semiconducting Ge-Se-Sb-Ag chalcogenides as prospective materials for thermoelectric applications. Phys. B Condens. Matter 2017, 526, 117–121. [Google Scholar] [CrossRef]
- Čajko, K.O.; Sekulić, D.L.; Petrović, D.M.; Labaš, V.; Minárik, S.; Rakić, S.J.; Lukić-Petrović, S.R. Study of electrical and microstructural properties of Ag-doped As-S-Se chalcogenide glasses. J. Non-Cryst. Solids 2021, 571, 121056. [Google Scholar] [CrossRef]
- Jin, Y.; Song, B.; Jia, Z.; Zhang, Y.; Lin, C.; Wang, X.; Dai, S. Improvement of Swanepoel method for deriving the thickness and the optical properties of chalcogenide thin films. Opt. Express 2017, 25, 440–451. [Google Scholar] [CrossRef]
- Van Popta, A.C.; DeCorby, R.G.; Haugen, C.J.; Robinson, T.; McMullin, J.N.; Tonchev, D.; Kasap, S.O. Photoinduced refractive index change in As2Se3 by 633nm illumination. Opt. Express 2002, 10, 639–644. [Google Scholar] [CrossRef]
- Zoubir, A.; Richardson, M.; Rivero, C.; Schulte, A.; Lopez, C.; Richardson, K.; Hô, N.; Vallée, R. Direct femtosecond laser writing of waveguides in As2S3 thin films. Opt. Lett. 2004, 29, 748–750. [Google Scholar] [CrossRef] [PubMed] [Green Version]
- Gawelda, W.; Siegel, J.; Afonso, C.N.; Plausinaitiene, V.; Abrutis, A.; Wiemer, C. Dynamics of laser-induced phase switching in GeTe films. J. Appl. Phys. 2011, 109, 123102. [Google Scholar] [CrossRef] [Green Version]
- Fu, J.; Shen, X.; Xu, Y.; Wang, G.; Nie, Q.; Lin, C.; Dai, S.; Xu, T.; Wang, R. Structural evolution of Ge2Sb2Te5 films under the 488nm laser irradiation. Mater. Lett. 2012, 88, 148–151. [Google Scholar] [CrossRef]


| Codename | Evaporation Rate (Ǻ/s) | Composition (At%) | ||||
|---|---|---|---|---|---|---|
| Ag | Ge28Sb12Se60 | Ag | Ge | Sb | Se | |
| Ag0 | 0 | 0.2 | 0 | 28.1 | 12.5 | 59.4 |
| Ag1 | 0.02 | 0.2 | 18.6 | 22.9 | 10.1 | 48.4 |
| Ag2 | 0.04 | 0.2 | 31.4 | 19.3 | 8.5 | 40.8 |
| Ag3 | 0.06 | 0.2 | 40.7 | 16.7 | 7.3 | 35.3 |
| Codename | β | ||
|---|---|---|---|
| Ag0 | 27.86 | 0.9964 | 0.0954 |
| Ag1 | 28.57 | 0.9000 | 0.0976 |
| Ag2 | 36.69 | 1.1050 | 0.1034 |
| Ag3 | 42.82 | 0.9799 | 0.1093 |
Publisher’s Note: MDPI stays neutral with regard to jurisdictional claims in published maps and institutional affiliations. |
© 2022 by the authors. Licensee MDPI, Basel, Switzerland. This article is an open access article distributed under the terms and conditions of the Creative Commons Attribution (CC BY) license (https://creativecommons.org/licenses/by/4.0/).
Share and Cite
Cao, L.; Zhou, Y.; Zhao, J.; Song, H.; Zhou, J. Effect of Ag Doping on Photobleaching in Ge28Sb12Se60 Chalcogenide Films. Coatings 2022, 12, 1760. https://doi.org/10.3390/coatings12111760
Cao L, Zhou Y, Zhao J, Song H, Zhou J. Effect of Ag Doping on Photobleaching in Ge28Sb12Se60 Chalcogenide Films. Coatings. 2022; 12(11):1760. https://doi.org/10.3390/coatings12111760
Chicago/Turabian StyleCao, Lixiao, Yao Zhou, Jianxing Zhao, Hongfei Song, and Jianhong Zhou. 2022. "Effect of Ag Doping on Photobleaching in Ge28Sb12Se60 Chalcogenide Films" Coatings 12, no. 11: 1760. https://doi.org/10.3390/coatings12111760