Article

Urban Mid-Block Bicycle Crossings: The Effects of Red Colored Pavement and Portal Overhead Bicycle Crossing Sign

Department of Civil, Chemical, Environmental and Material Engineering (DICAM), University of Bologna, Viale Risorgimento 2, 40136 Bologna, Italy
*
Author to whom correspondence should be addressed.
Coatings 2022, 12(2), 150; https://doi.org/10.3390/coatings12020150
Submission received: 21 December 2021 / Revised: 17 January 2022 / Accepted: 23 January 2022 / Published: 26 January 2022
(This article belongs to the Special Issue Road Pavements for Reduction of Climate and Safety Risks)

Abstract

:
This paper aims to investigate the effectiveness of some mid-block bicycle crossing elements by analyzing the drivers’ behavior, when approaching the bicycle crossings in a real road experiments with 18 participants. The eye-tracking instrument has been used to monitor the driver’s visual behavior during the test in an instrumented vehicle with GPS (global positioning system) and an inertial measurement unit (IMU). In particular, the drivers’ gaze was investigated frame by frame while approaching the mid-block bicycle crossings. The results showed that the red colored pavement increased the visibility of the mid-block crossing zone to 65.3% with respect to zebra crossing 59.6%. The drivers’ visual field was also narrowed by the portal overhead bicycle crossing sign and, consequently, drivers reduced their velocity and looked more to the vertical signs by 28%. The drivers’ speed reduction helped drivers to see the mid-block crossing elements from a greater distance with a higher fixation duration.

1. Introduction

The growing problems of air pollution, carbon emission, and traffic congestion are encouraging elements for considering bicycles as a solution for sustainable urban mobility. Several countries have experienced a renaissance in cycling for recreation, health, and transportation in recent years. Cycling provides an opportunity for regular aerobic exercise, and many commuters have found cycling to be a permanent and economical option to save money, avoid traffic congestion and reduce parking difficulties [1].
Bicycles are widely accepted as a sustainable means of transport for medium and short distance journeys in urban areas and the growing number of cyclists entails the need for adequate bicycle-friendly infrastructures. Many cities have already invested in providing bicycle-friendly infrastructures, yet unsignalized mid-block crossings remain a highly dangerous area, which needs more attention when designing the bicycle path.
Cyclists form one of the most vulnerable groups of road users, along with pedestrians and motorcyclists; this is because they have much higher casualty rates per mile traveled than other road users. More often than not, accidents involving a bicycle are hazardous for cyclists since they are unprotected against the car’s mass. The mass of a typical car is at least an order of magnitude greater than a bicycle, and has top speeds that are considerably faster than bicycle speed, making the impact forces noticeably high during the accidents [2,3,4,5,6,7,8].
A majority of bicycle-motor vehicle collisions occur in urban areas, where the bicycle is used for daily trips, and approximately half of them take place at bicycle crossings [9,10,11,12,13,14]. The most frequent crossing path crashes are where a motorist failed to yield to a bicyclist, and bicyclist failed to yield at an intersection or mid-block [15,16,17,18,19].
That lack of hazard perception and the tendency to take the high risk of accidents, both by drivers and bicyclists, are influenced by factors such as experience, age, training, and gender [20,21,22]. The objective understanding of driver perception and driving behavior could play a crucial role to improve the safety of the bicycle infrastructure [23,24,25].

2. Bicycle Crossings and Driving Behavior

The bicycle crossings can be divided into two categories: signal-controlled crossing at high traffic locations and unsignalized crossing, usually recommended at low traffic zones. Generally, unsignalized crossings are designed with adequate signaling to warn the driver of the hazard and use traffic calming measures to reduce the passing vehicles’ speed. The bicycle crossings are usually placed in correspondence with the intersections (intersection crossing) or along the route (mid-block crossing).
Crossings in mid-block are higher-risk locations because they are usually located along a straight road section, in which drivers maintain high speeds and generally do not slow down sufficiently when they approach the crossing. Cyclists may put themselves in danger if they misjudge the speed of approaching vehicles and the time it takes to cross the street safely; drivers may be startled and confused by the cyclist crossing the street, causing a driver to slam on the brakes [26,27] and create a risk of incident for the passing traffic.
However, if, mid-block crossings must be provided, they should be highly visible and integrated with traffic calming measures. To enhance visibility, cities may use high-visibility crosswalk pavements or install supplementary signs and lighting devices.
Colored pavement is a widely practiced measure at the crossing to enhance the visibility of the crossing zone and improve both driver and cyclist behavior. The application of a colored pavement helps drivers to recognize the hazardous area faster.
In Sweden, 37 cyclo-pedestrian crossings were analysed in 1990 [28]. The author highlights the decreasing of accidents involving bicycles due to the change of color of these crossings from 126 to 119. A similar situation has occurred in Portland (OR, USA), where the performance of road users before and after the coloring of a crossing has increased from 72% to 92% [29] and the number of cyclist-motorist conflicts has fallen by about half. Between 1989 and 1994, a survey was also carried out on 47 Danish crossings where blue coloring reduced accidents by 31% [30]. Finally, Jensen (2008) conducted a similar study on 65 crossings, which, considering the blue color of the flooring, led to a 10% reduction in accidents [31].
Iasmin et al. (2016) found a significant increase in the level of safety in crossings made of different materials (bricks) or coloring (red) in terms of conflicts between vehicles and bike users [32].
The driver’s visual behavior may suggest useful dynamics for increasing road safety. The perception of road elements by drivers makes it possible to develop driving strategies and prevent accidents [33]. High fixation times of a given element may lead to a reconsideration of the infrastructure of the road, to modulate the focus on the driving scene [34].
According to several studies, by using the eye-tracking tool, it is possible to define the causes of visual inattention of drivers, which is one of the major causes of road accidents [35,36,37,38,39,40,41,42].
In these studies, the eye-tracking system provides measurements such as gaze position, fixation duration, pupil diameter, and blinking frequency that show driver attention, cognitive load, and reaction to the road environment.
This methodology is particularly interesting when analyzing cyclists’ respect for driver interaction at intersections. So far, this interesting methodology has covered only a few studies and has focused on the behavior of the cyclist within simulated environments [43,44,45,46]. The use of simulators, in fact, leads to significant simplifications compared to driving in real traffic environments, especially considering the visual stimuli [47].
In this regard, the present paper investigates the driver’s visual attention at two unsignalized mid-block crossings in a real road experiment with 18 participants. An eye-tracking instrument allowed the study of the visual driving behavior, to understand which elements of the crossing were more salient. In this way, it was possible to understand the driver perception mechanism and behavior.
This paper proceeds as follows: Section 3 explains the experimental protocol and the performed analysis, Section 4 shows the obtained results, and Section 5 presents the conclusions and the future work of the research.

3. Materials and Methods

3.1. The Experimental Protocol

Eighteen drivers, nine males and nine females (age = 28 years, SD = 10), were recruited and involved voluntarily in this study. They all had normal vision and none of them wore eyeglasses or lenses, to avoid artefacts in eye-movement monitoring. All participants had a Category-B driving license (for cars) and no prior driving experience on the road segment object of study, to control the effect of familiarization with the road environment.
The on-site test was carried out with an instrumented vehicle (Ford Fiesta, Bologna, Italy) with a diesel engine and manual gearbox. Following the Helsinki declarations (2000), each participant signed the informed consent and authorization to use the graphic video material.
The two mid-block crossings object of study was located in the urban area of Bologna, Italy, inside the residential zone. The mid-block crossings were placed along the Azzurra and Mainoldi streets, both single carriageway-two lanes roads with a width of about 7.00 m (two 3.50 m wide lanes) and a speed limit of 50 km/h (Figure 1).
The two mid-block crossings were characterized by white elephant feet road markings for bicycles and white zebra markings for pedestrians. The first was 0.40 m long and 0.50 m wide, while the second was 1.50 m long and 0.50 m wide. They were spaced 0.50 m from each other according to the Italian Highway Code [48] (Figure 2). These two mid-block crossings were characterized by different signaling systems:
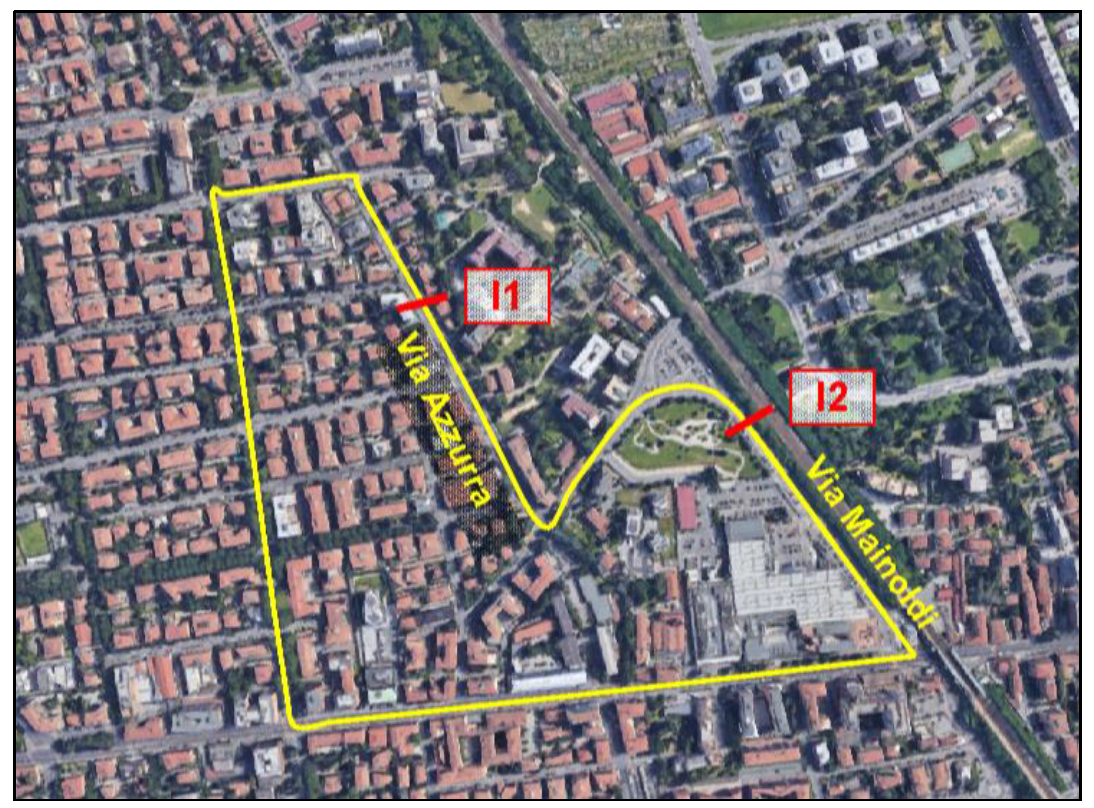
  • The Azzurra street (I1) was equipped with a portal overhead bicycle/pedestrian crossing sign and a red pavement in the crossing area;
  • The Mainoldi street (I2) was equipped with the standard vertical “Yield here to pedestrians and cyclists” signs, placed on the sidewalk of the road in proximity of the markings, without colored pavement at the crossing area.
The two mid-block crossings have been chosen because they are similar in terms of:
  • carriageway: both are located on a single carriageway-two lanes road with a width of approximately 7.00 m and a speed limit of 50 km/h;
  • traffic: both have a very similar traffic composition, volume and also the average daily traffic (TGM: 7400–7500 vehicles/day);
  • road environment: both are inside a residential area, with a similar population density;
  • number of accidents: according to the “Piano per la Sicurezza Stradale Urbana” (PSSU) both are critical points with several accidents with heavy injuries recorded in the last ten years.
The experiment was carried out on two separate days between 9:00 a.m. and 5:00 p.m. in the daytime, always in summer, in a period with low traffic and high visibility condition.
The subjects had to drive the car along a circuit with a total length of 7.5 km, designed to include the two mid-block crossings object of study (Figure 1). The task consisted of three laps along the circuit: the first one was aimed to allow the driver to take confidence with the road and the devices; in the other two laps the participant had passed two times from each studied bicycle crossing, once with and one without cyclist presence at the crossing, in a randomized order. In this study, the cyclist has been simulated by involving actors, and the cyclist has always appeared from the right side of the road, where the cyclist was completely visible to the driver. The participants did not know about the possible presence of cyclists (Figure 3).
Before the experiment, the participant received a briefing and was equipped with an ASL (Applied Science Laboratories) mobile Eye Tracking device, while the vehicle was instrumented with a Video VBOX (Racelogic Ltd., Buckingham, UK).
The ASL Mobile Eye-XG (ET) is a system consisting of two cameras mounted on special glasses characterized by a lens that can reflect infrared light. The left camera records the movements of the pupil, while the second camera the external scene.
The pupil position is detected using the eye-tracking technique known as Pupil to Corneal reflection tracing and using the matrix of calibration; it locates the pupil position in the images from the word camera. As already tested in Costa et al. (2014), the sampling rate for the eye-movement recording was 30 Hz (33 ms time resolution) with an accuracy of 0.5°–1° (approximating the angular width of the fovea) [49]. The eye tracker must be calibrated for each driver before the start of the experiment. In this phase, the driver had to sit without head movement in the driving seat and look at the object in the scene that the operator asked the driver to look at.
The Video VBOX (Racelogic Ltd., Buckingham, UK) is a tool that records the kinematic data of the vehicle while driving. The system, integrated with GPS and video data from four high-resolution cameras, is positioned in the barycenter of the car and can record speed (0.1 km/h ac-curacy), acceleration (1% precision) and video from the front screen of the vehicle with HD 1080 quality (30 frames per second). In this experiment, two additional modules of the inertial measurement unit (IMU) and onboard diagnosis port (OBD2) recorded the data using 32 channels. These real-time vehicle data during the experiment were registered from the central cabin computer and provided information such as engine rpm, wheel rotation, gas pedal, and engine temperature. The Inertial measurement unit was also used to measure the acceleration and rotation of the vehicle in three directions. Subsequently, the accelerations were used to estimate the exact point of braking of the drivers.
The ET and Video VBOX HD2 (Racelogic Ltd., Buckingham, UK) devices were monitored by one of the researchers in the rear seats, who provided only information concerning the test circuit.

3.2. Data Analysis

The data analysis aimed to evaluate the effect on safety and visibility of the studied mid-block crossings produced by the introduction of red pavement inside the crossing area and portal overhead bicycle/pedestrian crossing sign. To shed light on this, vehicle speed and drivers’ eye movements approaching crosswalks were examined.
The video analysis started by synchronizing the eye-tracking videos from the ASL mobile eye tracker with the VBOX videos, which allows associating the drivers’ visual gaze behavior with the driver’s speed. The eye-tracking video for each participant is a video from the scene showing the eye fixation position with a red cross. This video allowed us to study drivers’ gaze points and fixations (Figure 4).
For each eye tracking video, the frame-by-frame analysis was made to verify the target fixed by participants 150 m before the crossing. All the glanced elements were considered in the analysis: the portal overhead bicycle/pedestrian crossing sign (only for “I1” along Azzurra street), “Yield here to pedestrians and cyclists” vertical sign (only for “I2” along Mainoldi street), pavement crossing area, cyclist waiting to cross, traffic, vehicle interior, and environment.
For each target, the number of fixations and the duration of fixation were computed, multiplying by 33 ms the number of frames in which a single target object was fixated. A fixation was assumed for a minimum duration of two frames (66 ms), to avoid the inclusion of saccadic movements. The cases of one-frame glances to the area of interests (AOI) that were discarded were 4.53%. The threshold of 66 ms, which is lower in comparison to common filtering of 100 ms or higher as usually found in other eye-tracking studies, was dictated by the specific setting.
In real-world driving situations, where traffic patterns change in a highly dynamic way, quick fixations may occur, as in the case of this study [50,51,52,53,54,55,56].
By analysing the first fixation distances, it was possible to compare the operative stopping distance, starting from the vehicle speed at the first-fixation position, taking into account the available road friction co-efficient and the average longitudinal gradient of the road (4%) [48]. In order to increase road safety, avoiding conflicts between vehicles and cyclists/pedestrians, it has been found that the first mounting distance should be longer than the operational stopping distance so that the driver has sufficient space for rapid failure.
The ET and speed data were also used to evaluate the drivers’ reaction time (RT) for each mid-block crossing object of study. The RT was defined as the difference between the time of the first visualization of the cyclist on the right side of the crossing (TC) and the initial time of braking (TB). The time of application of the brake of the driver was found by using the speed profile and verified with the longitudinal acceleration measured by the IMU (Figure 5). The RT is commonly used to evaluate the safety of a cyclist/pedestrian crossing. It depends on task demands, motivation, cognitive workload, and even fatigue. The driver reaction process consists of perception, recognition, decision, and physical response [57,58]. To avoid accidents, the RT should be shorter so that the driver was able to stop the vehicle safely before the crossing.

4. Results

Through an in-depth analysis of the ET and the Video VBOX HD2 videos, the effect on safety and visibility of the studied crossings produced by the introduction of red pavement and portal overhead bicycle/pedestrian crossing sign have been evaluated.
Table 1 shows the row data recorded during the on-site test where, for each user, there is a definite number of fixations.
Figure 6 shows the results in terms of the percentage of drivers that looked (fixation) at crossing area and vertical signs at the two bike crossings object of study. The statistical analysis underlines a significant increase in drivers who looked at the portal overhead bicycle/pedestrian crossing sign (+28%, χ2 = 6.05, p = 0.002) and at red colored pavement (+4%, χ2 = 3.25, p = 0.002) of the “I1” crossing. The results were determined by 72 observations (18 participants—2 crosswalks—2 sides).
To test the difference in median fixation duration of each crossing element (Figure 7), the Univariate ANOVAs was used. The difference was significant for vertical sign (F(1, 32) = 3.92, p = 0.02, χ2 = 0.12) and the average fixation time was 316 ms (SD = 109) for portal overhead bicycle/pedestrian crossing sign of “I1” and 233 ms (SD = 102) for “Yield here to pedestrians and cyclists” vertical sign of “I2”.
For crossing the road area, the results are also significant: F(1, 34) = 7.17, p = 0.002, χ2 = 0.12. With the red pavement, the median fixation increased from 416 ms (SD = 157) to 473 ms (SD = 127).
Using the synchronization of the drivers’ position and the eye tracker data, the distance where the driver saw each AOI for the first time (First Fixation) for each mid-block crossing was evaluated. The univariate ANOVAs were applied to evaluate the distance of first fixation of the two crossings. The mean distance increased from 70.05 m of “I2” (SD = 14.23, N = 36) to 79.5 m of “I1” (SD = 17.66, N = 36), showing a significant difference: F(1, 72) = 88.59, p < 0.001, χ2 = 0.37.
The mean distance of the first fixation of the portal overhead bicycle/pedestrian crossing sign was 80.1 m (SD = 35.4, N = 36), while in “I2” the participants looked at the “Yield here to pedestrians and cyclists” vertical sign at 71.2 m (SD = 36.8, N = 36). The mean distance of the first fixation of the road marking and red pavement was 65.3 m (SD = 15.7, N = 36), while for white road marking in “I2” was 59.6 m (SD = 28.4, N = 36).
The operative stopping distance at each single crossing and for each participant was tested using ANOVA. The average operative stopping distance was 75.32 m for “I2” (SD = 19.31) and 72.42 m for “I1” (SD = 13.47), with a significant difference: F(1, 72) = 3.29, p = 0.02, χ2 = 0.04.
Obtained values showed that, for the “I2” crossing, 19.6% of the cases were “unsafe”, with operative stopping distances exceeding the distance of first-fixation. For “I1” crossing, the “unsafe” cases decreased to 5.1%. With the portal overhead bicycle/pedestrian crossing sign and the red pavement, the crossing’s conspicuity and visibility increased, and the drivers’ first-fixation was at a distance that allowed a safe stop in case of cyclists\pedestrians entering the crossing area.
At the moment of first fixation of the crossings, the drivers’ average speed was 45.5 km/h (SD = 10.2, N = 36) and 49.9 km/h (SD = 8.3, N = 36), respectively, at “I1” and “I2”. The effect of driving speed on first-fixation distance was tested with a linear regression considering operating speed as the independent variable and distance as the dependent variable. The regression value was significant: t = 2.103, p < 0.001, R2 = 0.91, showing that the lower speed helped the drivers to see the mid-block crossing from a longer distance.
The mean distance that drivers first looked at the cyclist approaching to the mid-block crossing was 25.4 m (SD = 12.7, N = 18) at “I1” and 23.2 m (SD = 12.1, N = 18) at the “I2” intersection. At the moment of first fixation of the cyclist, the average operative stopping distance was 24.36 m for “I1” (SD = 18.31, N = 18) and 22.5 m for “I2” (SD = 14.57, N = 18), with a indicative difference: F(1, 72) = 2.21, p = 0.02, χ2 = 0.041. When the distance of the first fixation is longer than the operating stopping distance, the driver has enough time and space to stop the vehicle from avoiding the crash.
The driver’s braking reaction time confirms this trend, because it was lower in the “I1” intersection with a median value of 0.86 sec (SD = 0.11, N = 18) compared to the one in “I2” intersection of 1.05 sec (SD = 0.62, N = 18).
For the two crossings object of study the drivers had stopped the car and let the cyclist cross only in 36% of the passages.

5. Conclusions

The present paper has evaluated the effect on safety and visibility of a mid-block crossing produced by the introduction of red pavement and a portal overhead bicycle/pedestrian crossing sign inside the bicycle crossing area. The safety evaluation was performed by a comparison between two crossings, very similar in terms of geometry and road environment. Speed and drivers’ visual behavior approaching the crossings were analysed in a real road experiment. All obtained results confirmed that adopted measures increased conspicuity and safety at cyclist crossings.
Statistical analysis of the number and duration of fixations confirmed a significant increase in drivers that looked at portal overhead bicycle/pedestrian crossing signs compared to “Yield here to pedestrians and cyclists” vertical sign by 28%. The portal overhead bicycle average fixation was 316 ms to 233 for the road side “Yield here to pedestrians”, which was significantly improved at the 150 m before the crossing.
The mid-block red colored pavement also showed a net increase in drivers’ visual fixation with a median fixation of 473 ms compared to the traditional white zebra markings with 416 ms. Although this design feature seems effective for the drivers, more caution should be taken when using the colored pavement, since they might increase the risky behavior of the cyclists.
The elements near the center of the road were fixated longer than the vertical sign, probably because of their position and their angular distance from the line straight ahead of the driver. These findings confirm previous studies that found that subjects directed a high percentage of their fixations onto objects that were pertinent or task relevant to the street crossing. According to recent studies [59,60,61,62,63], drivers spend the majority of their time looking center of the carriageway, because this represents the direction of travel and the danger zone. Roadside vertical signs instead fall outside the driver’s foveal visual field and require a saccadic movements or peripheral vision to be seen. The more the angular distance increased, the poorer was the visibility, since the sign was seen at a shorter distance.
With the installation of the portal overhead bicycle/pedestrian crossing sign and the red pavement, the drivers detected the crossing in advance. The mean distance of the first fixation of the crossing increased with the improvement of the drivers’ hazard anticipation and detection. Drivers were able to see the crossing at a longer distance (79.5 m) and they continued to glance at it while approaching them, enhancing their visual attention, and adjusting speed and slowing down their velocity in case of an approaching cyclist.
It was observed that the longer the distance of the first fixation of crossing elements, the longer the operative stopping distance of the drivers were observed. With the installation of the portal overhead bicycle/pedestrian crossing sign and the red pavement, a reduction of 14.5% of the “unsafe” cases were obtained. With these measures, the drivers were detected before the cyclist waiting to cross. Therefore, they had enough distance to stop the vehicle.
The drivers’ visual field has been narrowed by the portal overhead bicycle/pedestrian crossing sign, and consequently, drivers have reduced their operating velocity. The results are very interesting considering that participants had never driven the study route before, therefore, did not expect the cyclist presence. Several previous studies have found that familiarity with the driving situation has a great influence on the increase in the driving speed and that the reaction time increases when the driver encounters an unusual circumstance, such as a pedestrian or cyclist crossing the road in the near distance [64,65,66,67].
The analysis of the drivers’ eye movements has been found effective to evaluate the visibility of mid-block crossings as well as to study the drivers’ behavior. These objective measures can help to improve the design of the crossing elements, for example, with the addition of a sign informing drivers that pedestrians may enter the intersection.
The comparison between the two crossings, where the variations in the drivers’ behavior recorded were particularly remarkable in terms of crosswalk visibility and conspicuity, is a relevant starting point for future studies that will test the effects of a similar intervention on other critical crossings considered danger for bike users.

Author Contributions

N.G.: investigation, writing—original draft; C.L.: conceptualization, methodology, investigation; V.V.: conceptualization, methodology, investigation, writing—review and editing; A.S.: Investigation, Data curation; E.M.A.: investigation, data curation; F.R.: investigation, data curation. All authors have read and agreed to the published version of the manuscript.

Funding

This research received no external funding.

Institutional Review Board Statement

Not applicable.

Informed Consent Statement

Not applicable.

Data Availability Statement

Data sharing is not applicable to this article.

Acknowledgments

The authors would like to thank Fabrizio Balzaretti, Michele Carpinone, Mauro Gambino and Mattia Strangi for their support and contribution. We would like to thank the municipality of Bologna (Comune di Bologna) and Davide Parmeggiani for participating in the research.

Conflicts of Interest

The authors declare no conflict of interest.

References

  1. Nabors, D.; Goughnour, E.; Thomas, L.; de Santis, W.; Sawyer, M. Bicycle Road Safety Audit Guidelines and Prompt Lists; Report No. FHWA-SA-12-018; Federal Highway Administration: Springfield, VA, USA, 2012. [Google Scholar]
  2. Rasanen, M.; Summala, H. Attention and expectation problems in bicycle-car collisions: An in-depth study. Accid. Anal. Prev. 1998, 30, 657–666. [Google Scholar] [CrossRef]
  3. Kim, J.K.; Kim, S.; Ulfarsson, G.F.; Porrello, L.A. Bicyclist injury severities in bicycle-motor vehicle accidents. Accid. Anal. Prev. 2007, 39, 238–251. [Google Scholar] [CrossRef]
  4. Shoman, M.; Imine, H. Modelling and Simulation of Bicycle Dynamics. In Proceedings of the Modeling and Simulation of Bicycle dynamics, TRA 2020, Transportation Research Arena, TRA, Helsinki, Finland, 27–30 April 2020; pp. 1–10. [Google Scholar]
  5. Reynolds, C.; Harris, M.A.; Teschke, K.; Cripton, P.A.; Winters, M. The impact of transportation infrastructure on bicycling injuries and crashes: A review of the literature. Environ. Health 2009, 8, 47. [Google Scholar] [CrossRef] [Green Version]
  6. Beck, B.; Stevenson, M.; Newstead, S.; Cameron, P.; Judson, R.; Edwards, E.R.; Bucknill, A.; Johnson, M.; Gabbe, M. Bicycling crash characteristics: An in-depth crash investigation study. Accid. Anal. Prev. 2016, 96, 219–227. [Google Scholar] [CrossRef]
  7. European Commission. Pedestrians and Cyclists; European Road Safety Observatory: Bruxelles, Belgium, 2018. [Google Scholar]
  8. Kaplan, S.; Luria, R.; Prato, C.G. The relation between cyclists’ perceptions of drivers, self-concepts and their willingness to cycle in mixed traffic. Transp. Res. Part F 2019, 62, 45–57. [Google Scholar] [CrossRef]
  9. European Road Safety Observatory. Traffic Safety Basic Facts 2015. Available online: https://ec.europa.eu/transport/road_safety/index_en (accessed on 20 December 2021).
  10. Kaplan, S.; Prato, C. A spatial analysis of land use and network effects on frequency and severity of cyclist-motorist crashes in the Copenhagen region. Traffic Inj. Prev. 2015, 16, 724–731. [Google Scholar] [CrossRef]
  11. Stone, M.; Broughton, J. Getting off your bike: Cycling accidents in Great Britain in 1990–1999. Accid. Anal. Prev. 2003, 35, 549–556. [Google Scholar] [CrossRef]
  12. Prati, G.; de Angelis, M.; Marin Puchades, V.; Fraboni, F.; Pietrantoni, L. Characteristics of cyclist crashes in Italy using latent class analysis and association rule mining. PLoS ONE 2017, 12, e0171484. [Google Scholar] [CrossRef]
  13. Garder, P.; Leden, L.; Thedeen, T. Safety implications of bicycle paths at signalized intersections. Accid. Anal. Prev. 1994, 26, 429–439. [Google Scholar] [CrossRef]
  14. Rupi, F.; Krizek, K.J. Visual Eye Gaze While Cycling: Analyzing Eye Tracking at Signalized Intersections in Urban Conditions. Sustainability 2019, 11, 6089. [Google Scholar] [CrossRef] [Green Version]
  15. Gårder, P.; Leden, L.; Pulkkinen, U. Measuring the safety effect of raised bicycle crossings using a new research methodology. Transp. Res. Rec. 1998, 1636, 64–70. [Google Scholar] [CrossRef] [Green Version]
  16. OECD. Safety of Vulnerable Road Users; Organisation for Economic Co-Operation and Development OECD: Paris, France, 2018. [Google Scholar]
  17. Federal Highway Administration. Mid-Block Crossings. 2018. Available online: https://sustainablecitycode.org/brief/mid-block-pedestrian-crossings-2/ (accessed on 20 December 2021).
  18. Federal Highway Administration. Pedestrian and Bicycle Crash Types. 2019. Available online: https://safety.fhwa.dot.gov/PED_BIKE/univcourse/pdf/swless04.pdf (accessed on 20 December 2021).
  19. Meuleners, L.B.; Stevenson, M.; Fraser, M.; Oxley, J.; Rosed, G.; Johnson, M. Safer cycling and the urban road environment: A case control study. Accid. Anal. Prev. 2019, 129, 342–349. [Google Scholar] [CrossRef]
  20. Phillips, R.O.; Bjørnskau, T.; Hagman, R.; Sagberg, F. Reduction in car-bicycle conflict at a road- cycle path intersection: Evidence of road user adaptation? Transp. Res. Part F 2011, 14, 87–95. [Google Scholar] [CrossRef]
  21. Costa, M.; Bonetti, L.; Bellelli, M.; Lantieri, C.; Vignali, V.; Simone, A. Reflective tape applied to bicycle frame and conspicuity enhancement at night. Hum. Factors 2017, 59, 485–500. [Google Scholar] [CrossRef]
  22. Mantuano, A.; Bernardi, S.; Rupi, F. Cyclist gaze behavior in urban space: An eye-tracking experiment on the bicycle network of Bologna. Case Stud. Transp. Policy 2017, 5, 408–416. [Google Scholar] [CrossRef]
  23. Dondi, G.; Simone, A.; Lantieri, C.; Vignali, V. Bike lane design: The Context Sensitive Approach. Procedia Eng. 2011, 21, 897–906. [Google Scholar] [CrossRef] [Green Version]
  24. Bucchi, A.; Sangiorgi, C.; Vignali, V. Traffic psychology and driver behaviour. Procedia-Soc. Behav. Sci. 2012, 53, 973–980. [Google Scholar] [CrossRef] [Green Version]
  25. Singh, S. Critical reasons for crashes investigated in the national motor vehicle crash causation survey. In Proceedings of the 13th International IEEE Conference on Intelligent Transportation Systems, Madeira, Portugal, 19–22 September 2010. [Google Scholar]
  26. Nicaj, L.; Stayton, C.; Mandel-Ricci, J.; Mccarthy, P.; Grasso, K.; Woloch, D.; Kerker, B. Bicyclist fatalities in New York City: 1996–2005. Traffic Inj. Prev. 2009, 10, 157–161. [Google Scholar] [CrossRef]
  27. Kaplan, S.; Vavatsoulas, K.; Prato, C.G. Aggravating and mitigating factors associated with cyclist injury severity in Denmark. J. Saf. Res. 2014, 50, 75–82. [Google Scholar] [CrossRef]
  28. Nettelblad, P. Resultat af blåmaling av cykelöverfart i Malmö; Gatukontoret: Malmo Kommun, Sweden, 1990. [Google Scholar]
  29. Hunter, W.W.; Harkey, D.L.; Stewart, J.R.; Birk, M.L. Evaluation of Blue Bike-Lane Treatment in Portland, Oregon. Transp. Res. Rec. 2000, 1705, 107–115. [Google Scholar] [CrossRef] [Green Version]
  30. Jensen, S.U.; Nielsen, M.A. Cykelfelter—Sikkerhedsmæssig Effekt i Signalregulerede Kryds; Report 51; Road Directorate: København, Denmark, 1996. [Google Scholar]
  31. Jensen, S. Safety effects of blue cycle crossings: A before-after study. Accid. Anal. Prev. 2008, 40, 742–750. [Google Scholar] [CrossRef] [PubMed]
  32. Iasmin, H.; Aya, K.; Hisashi, K. Safety effectiveness of pavement design treatment at intersections: Left turning vehicles and pedestrians on crosswalks. IATSS Res. 2016, 40, 47–55. [Google Scholar] [CrossRef] [Green Version]
  33. Vignali, V.; Cuppi, F.; Acerra, E.; Bichicchi, A.; Lantieri, C.; Simone, A.; Costa, M. Effects of median refuge island and flashing vertical sign on conspicuity and safety of unsignalized crosswalks. Transp. Res. Part F Traffic Psychol. Behav. 2019, 60, 427–439. [Google Scholar] [CrossRef]
  34. Frings, D.; Parkin, J.; Ridley, A.M. The effects of cycle lanes, vehicle to kerb distance and vehicle type on cyclists’ attention allocation during junction negotiation. Accid. Anal. Prev. 2014, 72, 411–421. [Google Scholar] [CrossRef] [PubMed]
  35. Williams, A.M.; Ward, P.; Knowles, J.M.; Smeeton, N.J. Anticipation skill in a real-world task: Measurement, training, and transfer in tennis. J. Exp. Psychol. 2002, 8, 259–270. [Google Scholar] [CrossRef]
  36. Twisk, D.A.M.; de Hair–Buijssen, S.; Otte, D. Improving cyclist safety through scientific research. Accid. Anal. Prev. 2017, 105, 1–3. [Google Scholar] [CrossRef] [Green Version]
  37. Acerra, E.; Pazzini, M.; Ghasemi, N.; Vignali, V.; Lantieri, C.; Simone, A.; di Flumeri, G.; Aricò, P.; Borghini, G.; Sciaraffa, N.; et al. EEG-Based Mental Workload and Perception-Reaction Time of the Drivers While Using Adaptive Cruise Control. Commun. Comput. Inf. Sci. 2019, 1107, 226–239. [Google Scholar]
  38. Di Flumeri, G.; Borghini, G.; Aricò, P.; Sciaraffa, N.; Lanzi, P.; Pozzi, S.; Vignali, V.; Lantieri, C.; Bichicchi, A.; Simone, A.; et al. EEG-based mental workload neurometric to evaluate the impact of different traffic and road conditions in real driving settings. Front. Hum. Neurosci. 2018, 12, 69–86. [Google Scholar] [CrossRef] [Green Version]
  39. Bichicchi, A.; Mazzotta, F.; Lantieri, C.; Vignali, V.; Simone, A.; Dondi, G.; Costa, M. The influence of pedestrian crossings features on driving behavior and road safety. In Proceedings of the AIIT International Congress TIS Rome 2017, Rome, Italy, 10–12 April 2017. [Google Scholar]
  40. Carter, B.T.; Luke, S.G. Best practices in eye tracking research. Int. J. Psychophysiol. 2020, 155, 49–62. [Google Scholar] [CrossRef]
  41. Ghasemi, N.; Acerra, E.; Vignali, V.; Lantieri, C.; Simone, A.; Imine, H. Road safety review update by using innovative technologies to investigate driver behaviour. Transp. Res. Procedia 2020, 45, 368–375. [Google Scholar] [CrossRef]
  42. Vetturi, D.; Tiboni, M.; Maternini, G.; Bonera, M. Use of eye tracking device to evaluate the driver’s behaviour and the infrastructures quality in relation to road safety. Transp. Res. Procedia 2020, 45, 587–595. [Google Scholar] [CrossRef]
  43. Vansteenkiste, P.; Cardon, G.; D’Hondt, E.; Philippaerts, R.; Lenoir, M. The visual control of bicycle steering: The effects of speed and path width. Accid. Anal. Prev. 2013, 51, 222–227. [Google Scholar] [CrossRef] [PubMed] [Green Version]
  44. Zeuwts, L.; Vansteenkiste, P.; Deconinck, F.; van Maarseveen, M.; Savelsbergh, G.; Cardon, G.; Lenoir, M. Is gaze behaviour in a laboratory context similar to that in real-life? A study in bicyclists. Transp. Res. Part F 2016, 43, 131–140. [Google Scholar] [CrossRef]
  45. Kircher, K.; Ahlström, C. Attentional requirements on cyclists and drivers in urban intersections. Transp. Res. Part F 2020, 68, 105–117. [Google Scholar] [CrossRef]
  46. Krizek, K.; Otten, B.; Rupi, F. Urban experience and design: Contemporary perspectives on improving the public realm. In Urban Experience and Design: Contemporary Perspectives on Improving the Public Realm; Taylor and Francis: London, UK, 2021; pp. 140–145. [Google Scholar]
  47. Ghasemi, N.; Imine, H.; Simone, A.; Lantieri, C.; Vignali, V.; Finamore, K. Longitudinal motion cueing effects on driver behaviour: A driving simulator study. Adv. Transp. Stud. 2019, 49, 91–102. [Google Scholar]
  48. Ministry of Infrastructures and Transports. Decreto Ministeriale del 5/11/2001 Norme Funzionali e Geometriche per la Costruzione delle Strade; Ministry of Infrastructures and Transports: Rome, Italy, 2001. (In Italian)
  49. Costa, M.; Simone, A.; Vignali, V.; Lantieri, C.; Bucchi, A.; Dondi, G. Looking behavior for vertical road signs. Transp. Res. Part F: Traffic Psychol. Behav. 2014, 23, 147–155. [Google Scholar] [CrossRef]
  50. Velichkovsky, B.; Domhoefer, S.M.; Pannasch, S.; Unema, J.A. Visual fixations and level of attentional processing. In Proceedings of the Eye Tracking Research & Application Symposium, ETRA 2000, Palm Beach Gardens, FL, USA, 6–8 November 2000. [Google Scholar]
  51. Sodhi, M.; Reimer, B.; Cohen, J.L.; Vastenburg, E.; Kaars, R.; Kirschenbaum, S. On-road driver eye movement tracking using head-mounted devices. In Proceedings of the 2002 Symposium on Eye Tracking Research & Applications, New Orleans, LA, USA, 25–27 March 2002. [Google Scholar]
  52. Lantieri, C.; Lamperti, R.; Simone, A.; Costa, M.; Vignali, V.; Sangiorgi, C.; Dondi, G. Gateway design assessment in the transition from high to low speed areas. Transp. Res. Part F 2015, 34, 41–53. [Google Scholar] [CrossRef]
  53. Costa, M.; Bonetti, L.; Vignali, V.; Bichicchi, A.; Lantieri, C.; Simone, A. Driver’s visual attention to different categories of roadside advertising signs. Appl. Ergon. 2015, 78, 127–136. [Google Scholar] [CrossRef]
  54. Costa, M.; Bonetti, L.; Vignali, V.; Lantieri, C.; Simone, A. The role of peripheral vision in vertical road sign identification and discrimination. Ergonomics 2018, 61, 1619–1634. [Google Scholar] [CrossRef]
  55. Lantieri, C.; Costa, M.; Vignali, V.; Acerra, E.M.; Marchetti, P.; Simone, A. Flashing in-curb LEDs and beacons at unsignalized crosswalks and driver’s visual attention to pedestrians during nighttime. Ergonomics 2020, 64, 330–341. [Google Scholar] [CrossRef]
  56. Armour, M. The Reactions of Drivers to Roadside Objects; Report No. AIR217-2; Australian Road Research Board: Melbourne, Australia, 1976. [Google Scholar]
  57. Summala, H. Brake Reaction Times and Driver Behavior Analysis. Transp. Hum. Factors 2020, 2, 217–226. [Google Scholar] [CrossRef]
  58. Bichicchi, A.; Belaroussi, R.; Simone, A.; Vignali, V.; Lantieri, C.; Li, X. Analysis of road-user interaction by extraction of driver behavior features using Deep Learning. IEEE Access 2020, 8, 19638–19645. [Google Scholar] [CrossRef]
  59. Costa, M.; Bichicchi, A.; Nese, M.; Lantieri, C.; Vignali, V.; Simone, A. T-junction priority scheme and road user’s yielding behavior. Transp. Res. Part F 2019, 60, 770–782. [Google Scholar] [CrossRef]
  60. Costa, M.; Lantieri, C.; Vignali, V.; Ghasemi, N.; Simone, A. Evaluation of an integrated lighting-warning system on motorists’ yielding at unsignalized crosswalks during nighttime. Transp. Res. Part F Traffic Psychol. Behav. 2020, 68, 132–143. [Google Scholar] [CrossRef]
  61. Costa, M.; Simone, A.; Vignali, V.; Lantieri, C.; Palena, N. Fixation distance and fixation duration to vertical road signs. Appl. Ergon. 2018, 69, 48–57. [Google Scholar] [CrossRef]
  62. Vignali, V.; Bichicchi, A.; Simone ALantieri, C.; Dondi, G.; Costa, M. Road sign vision and driver behavior in work zones. Transp. Res. Part F 2019, 60, 474–484. [Google Scholar] [CrossRef]
  63. Miura, T. What is the narrowing of visual field with the increase of speed? In Proceedings of the 10th Congress of the International Association for Accident and Traffic Medicine, Tokyo, Japan, 27–31 May 1985. [Google Scholar]
  64. Miura, T. Behavior orientation vision: Functional field of view and processing resources. In Eye Movements: From Physiology to Cognition; Reagan, J.K.O., Le’vy-Schoen, A., Eds.; Elsevier Publishers: Amsterdam, The Netherlands, 1987. [Google Scholar]
  65. Kayser, H.J.; Hess, M. The dependency of drivers viewing behaviour on speed and street environment structure. In Vision in Vehicles III; Gale, A.G., Ed.; Elsevier Publishers: Amsterdam, The Netherlands, 1991. [Google Scholar]
  66. Spijkers, W. Distribution of eye-fixations during driving. IATSS Res. 1992, 16, 27–34. [Google Scholar]
  67. Rogé, J.; Pébayle, T.; Lambilliotte, E.; Spitzenstetter, F.; Giselbrecht, D.; Muzet, A. Influence of age, speed and duration of monotonous driving task in traffic on the drivers useful visual field. Vis. Res. 2004, 44, 2737–2744. [Google Scholar] [CrossRef] [Green Version]
Figure 1. Outline of the experimental route. In red are the two analyzed mid-block crossings.
Coatings 12 00150 g001
Figure 2. Crossing “I1” along Azzurra street (on the left) and crossing “I2” along Mainoldi street (on the right).
Coatings 12 00150 g002
Figure 3. Overview of the experimental protocol, consisting of two main driving tasks, different in terms of cyclist presence and performed in a randomized order.
Coatings 12 00150 g003
Figure 4. Synchronization of the eye-tracking mobile video output with the Video VBOX video output. (a) Video of the ME with the point of fixation (red cross), (b) Video of Video VBOX.
Coatings 12 00150 g004
Figure 5. Evaluation of the Reaction Time (RT).
Coatings 12 00150 g005
Figure 6. Percentage of drivers that looked at crossing road area (pavement) and at vertical signs (portal overhead bicycle/pedestrian crossing sign for “I1” and “Yield here to pedestrians and cyclists” vertical sign for “I2”).
Coatings 12 00150 g006
Figure 7. Median fixation duration at crossing road area (pavement) and at vertical signs (portal overhead bicycle/pedestrian crossing sign for “I1” and “Yield here to pedestrians and cyclists” vertical sign for “I2”) (standard deviation and number of observations are reported in brackets).
Coatings 12 00150 g007
Table 1. Number of fixations for each user.
USERl1l2
LAP 2LAP 3LAP 2LAP 3
Crossing Road Area [ms]Vertical Sign [ms]Crossing Road Area [ms]Vertical Sign [ms]Crossing Road Area [ms]Vertical Sign [ms]Crossing Road Area [ms]Vertical Sign [ms]
1401300472350450104501408
2451350444344551325429147
3499-496322558103147402
4---356210-294352
5541502874102403299564134
6498548471134356229701184
7486306402123317301357228
8471316397287643116349234
9452-409107504107501289
10573-571-227-457374
11725397-305128-128345
12513363108321499227197133
13400305473298471385116149
14741412478147304321548305
15582388450156285311178201
16468450480316349105573233
17432306351300467209-102
18602412490316511407416312
Publisher’s Note: MDPI stays neutral with regard to jurisdictional claims in published maps and institutional affiliations.

