Article

Surface Conductivity and Preferred Orientation of TiN Film for Ti Bipolar Plate

1
College of Materials Science and Engineering, Sichuan University, Chengdu 610065, China
2
Institute of New Energy and Low-Carbon Technology, Sichuan University, Chengdu 610207, China
3
School of Chemical Engineering, Sichuan University, Chengdu 610065, China
4
Engineering Research Center of Alternative Energy Materials and Devices, Ministry of Education, Beijing 100816, China
*
Authors to whom correspondence should be addressed.
Coatings 2022, 12(4), 454; https://doi.org/10.3390/coatings12040454
Submission received: 18 February 2022 / Revised: 18 March 2022 / Accepted: 24 March 2022 / Published: 27 March 2022

Abstract

:
The properties of thin films are often influenced by the crystal’s preferred orientation. In the present study, we report the strong dependence of surface conductivity on the preferred orientation of TiN film that acts as the coating material for Ti bipolar plate. The preferred orientation of TiN film is successfully controlled along the (111) or (200) planes by adjusting the N2 flow rate or Ti substrate temperature during the deposition process via DC (direct current) reactive magnetron sputtering. Small N2 flow rate of 3 to 6 sccm or low substrate temperature (e.g., 25 °C) facilitates the growth of TiN films along the (111). The (111) preferred orientated TiN films show much lower interfacial contact resistance (ICR) than the (200) preferred orientated films. A considerably low ICR value of 1.9 mΩ·cm2 at 140 N/cm2 is achieved at the N2 flow of 4 sccm and the substrate temperature of 25 °C.

Graphical Abstract

1. Introduction

Recently, the proton exchange membrane fuel cell (PEMFC) has been widely considered as one of the most promising power sources for vehicles, stationary power generators and other portable applications due to its advantages of highly efficient energy conversion, low operating temperature, zero emission, and rapid start-up [1,2]. Bipolar plate (BPP) is one of the crucial components accounting largely for the total weight and cost of the PEMFC stack and playing a key role in collecting current, separating reaction gas, connecting monomer modules, and removing residual water [3,4]. Graphite has been developed as the first-generation bipolar plate owing to the excellent electrical conductivity and corrosion resistance. Nevertheless, the high brittleness of graphite leads to poor machining properties and high cost [5,6]. Metallic bipolar plates are attracting wide attention because of their superior mechanical properties and manufacturability, which is conducive to their cost-effective mass production [7,8,9,10]. Among these metal materials, Ti, with a low density of 4.50 g/cm3, superior mechanical properties, and high electric conductivity of 2.34 × 10⁶ S/m, can greatly improve the power density of PEMFC stack [11]. However, in the harsh acidic working environment of PEMFC, the passive oxide film formed on the Ti surface will increase the interfacial contact resistance (ICR) value between BPP and gas diffusion layer (GDL), which seriously deteriorates the cell performance [12,13,14]. Therefore, it is highly necessary to improve the Ti corrosion resistance using coating materials with high electronic conductivity.
The protective coating materials mainly include noble metals such as Au [15], metal nitrides, including TiN [11,16] and TiZrN [17], carbon-based materials such as TiC [18], NbC [13], ZrCN [19], and some composites such as carbon/PTFE/TiN composites [20], Ni-P/TiN/PTFE composites [21], N/Ta-co-doped TiO2 [22], etc. Among them, TiN is a widely used coating material owing to its low cost, high hardness, and good corrosion resistance. The excellent electrical conductivity of 4.55 × 10⁶ S/m and slight difference of 0.63% in thermal expansion coefficient with Ti substrate could be the advantages needed for TiN to be utilized as the coating material for metallic Ti BPP.
The properties of TiN thin films are largely dependent on the crystal orientation. Considerable efforts have been devoted to improving the hardness [23,24,25], infrared emissivity [26], anti-impact performance [27], and optical transmission [28] of TiN films through the adjustment of crystal orientation. However, controversial results have been reported on the impact of crystal orientation on the resistivity of TiN. The resistivity of TiN film was reported to decrease as the preferred orientation changes from (111) to (200) in some research [29,30], while the (111) preferred orientated TiN films were found to exhibit lower resistivity in other studies [26,31]. Therefore, it is of great significance to unveil the impact of preferred orientation on the surface conductivity of TiN films, especially in the scenario of acting as the coating material for Ti BPPs.
In the present study, the TiN films were deposited on Ti substrates via DC reactive magnetron sputtering. The ICR values of TiN films show strong dependence on the preferred orientation, which can be tuned by adjusting the N2 flow rate and substrate temperature. By controlling the growth of TiN film along the (111) plane, a low ICR of 1.9 mΩ·cm2 at 140 N/cm2 is successfully achieved. The origination of surface conductivity dependence on preferred orientation are investigated by Density Functional Theory (DFT)calculation, and the influence of surface roughness and N and O concentrations on surface conductivity is also discussed.

2. Materials and Methods

2.1. Deposition of TiN Films

The TiN films were deposited on Ti substrates by DC reactive magnetron sputtering method (CJC450) using a Ti target in the mixture of Ar and N2. To remove impurities and oil from the surface, the Ti substrates prior to deposition were ultrasonically cleaned in deionized water, acetone, and ethanol for 30 min, respectively. The Ti substrates were fixed on the substrate holder with a distance of 5 cm from the target. Before deposition, the chamber was evacuated to below 0.0008 Pa. Subsequently, the surfaces of Ti substrates were bombarded by Ar+ ion for 10 min with high voltage of 2500 V and Ar pressure of 2 Pa. TiN was deposited by sputtering reaction between Ti target and N2 for 20 min with DC power of 300 W, working pressure of 0.62 Pa, a substrate bias voltage of 70 V and a constant Ar flow rate at 90 sccm. Two parameters were investigated including N2 flow rate varying from 3 to 12 sccm and substrate temperature from 25 to 150 °C.

2.2. Characterization of TiN Films

The phase structures of the films were analyzed by X-ray diffraction (XRD) using Oxford Xcalibur E diffractometer (Liaoning, China) with Cu Kα radiation source (λ = 1.5418 Å). The surface and cross-section morphologies were observed by Hitachi (REGULUS8230, Tokyo, Japan) scanning electron microscope (SEM). The surface roughness (Ra) was measured by Surface Roughmeter with a scanning length of 4 mm (Dongyang Instruments, TR210, Beijing, China). The Ti/N ratio of the surface were determined by X-ray photoelectron spectroscopy (XPS, Thermo Scientific K-Alpha+, Waltham, MA, USA).

2.3. Measurement of Interfacial Contact Resistance

The ICR values were measured in a sandwich structure using DC Low Resistance Tester (Changzhou Tonghui Electronics Co., Ltd., TH2512, Changzhou, China) under different compaction forces of 20 to 160 N/cm2 according to the method reported in our previous study [16].

2.4. Electrochemical Measurement

The corrosion properties were evaluated by potentiodynamic polarization carried on an electrochemical workstation (DongHua Instruments Inc., DH7000, Jiangsu, China) in a 0.05 M H2SO4 + 2 ppm HF solution at 80 °C, where air was pumped to simulate the cathode working environment of PEMFC. A conventional three-electrode system was used in the test with a platinum sheet, a saturated Hg/Hg2SO4 electrode, the coated or uncoated sample as the counter electrode, reference electrode and working electrode, respectively. During the electrochemical measurement, all the samples were stabilized at an open circuit potential (OCP) for 60 min followed by potentiodynamic polarization tests at a scanning rate of 0.3 mV·s−1.

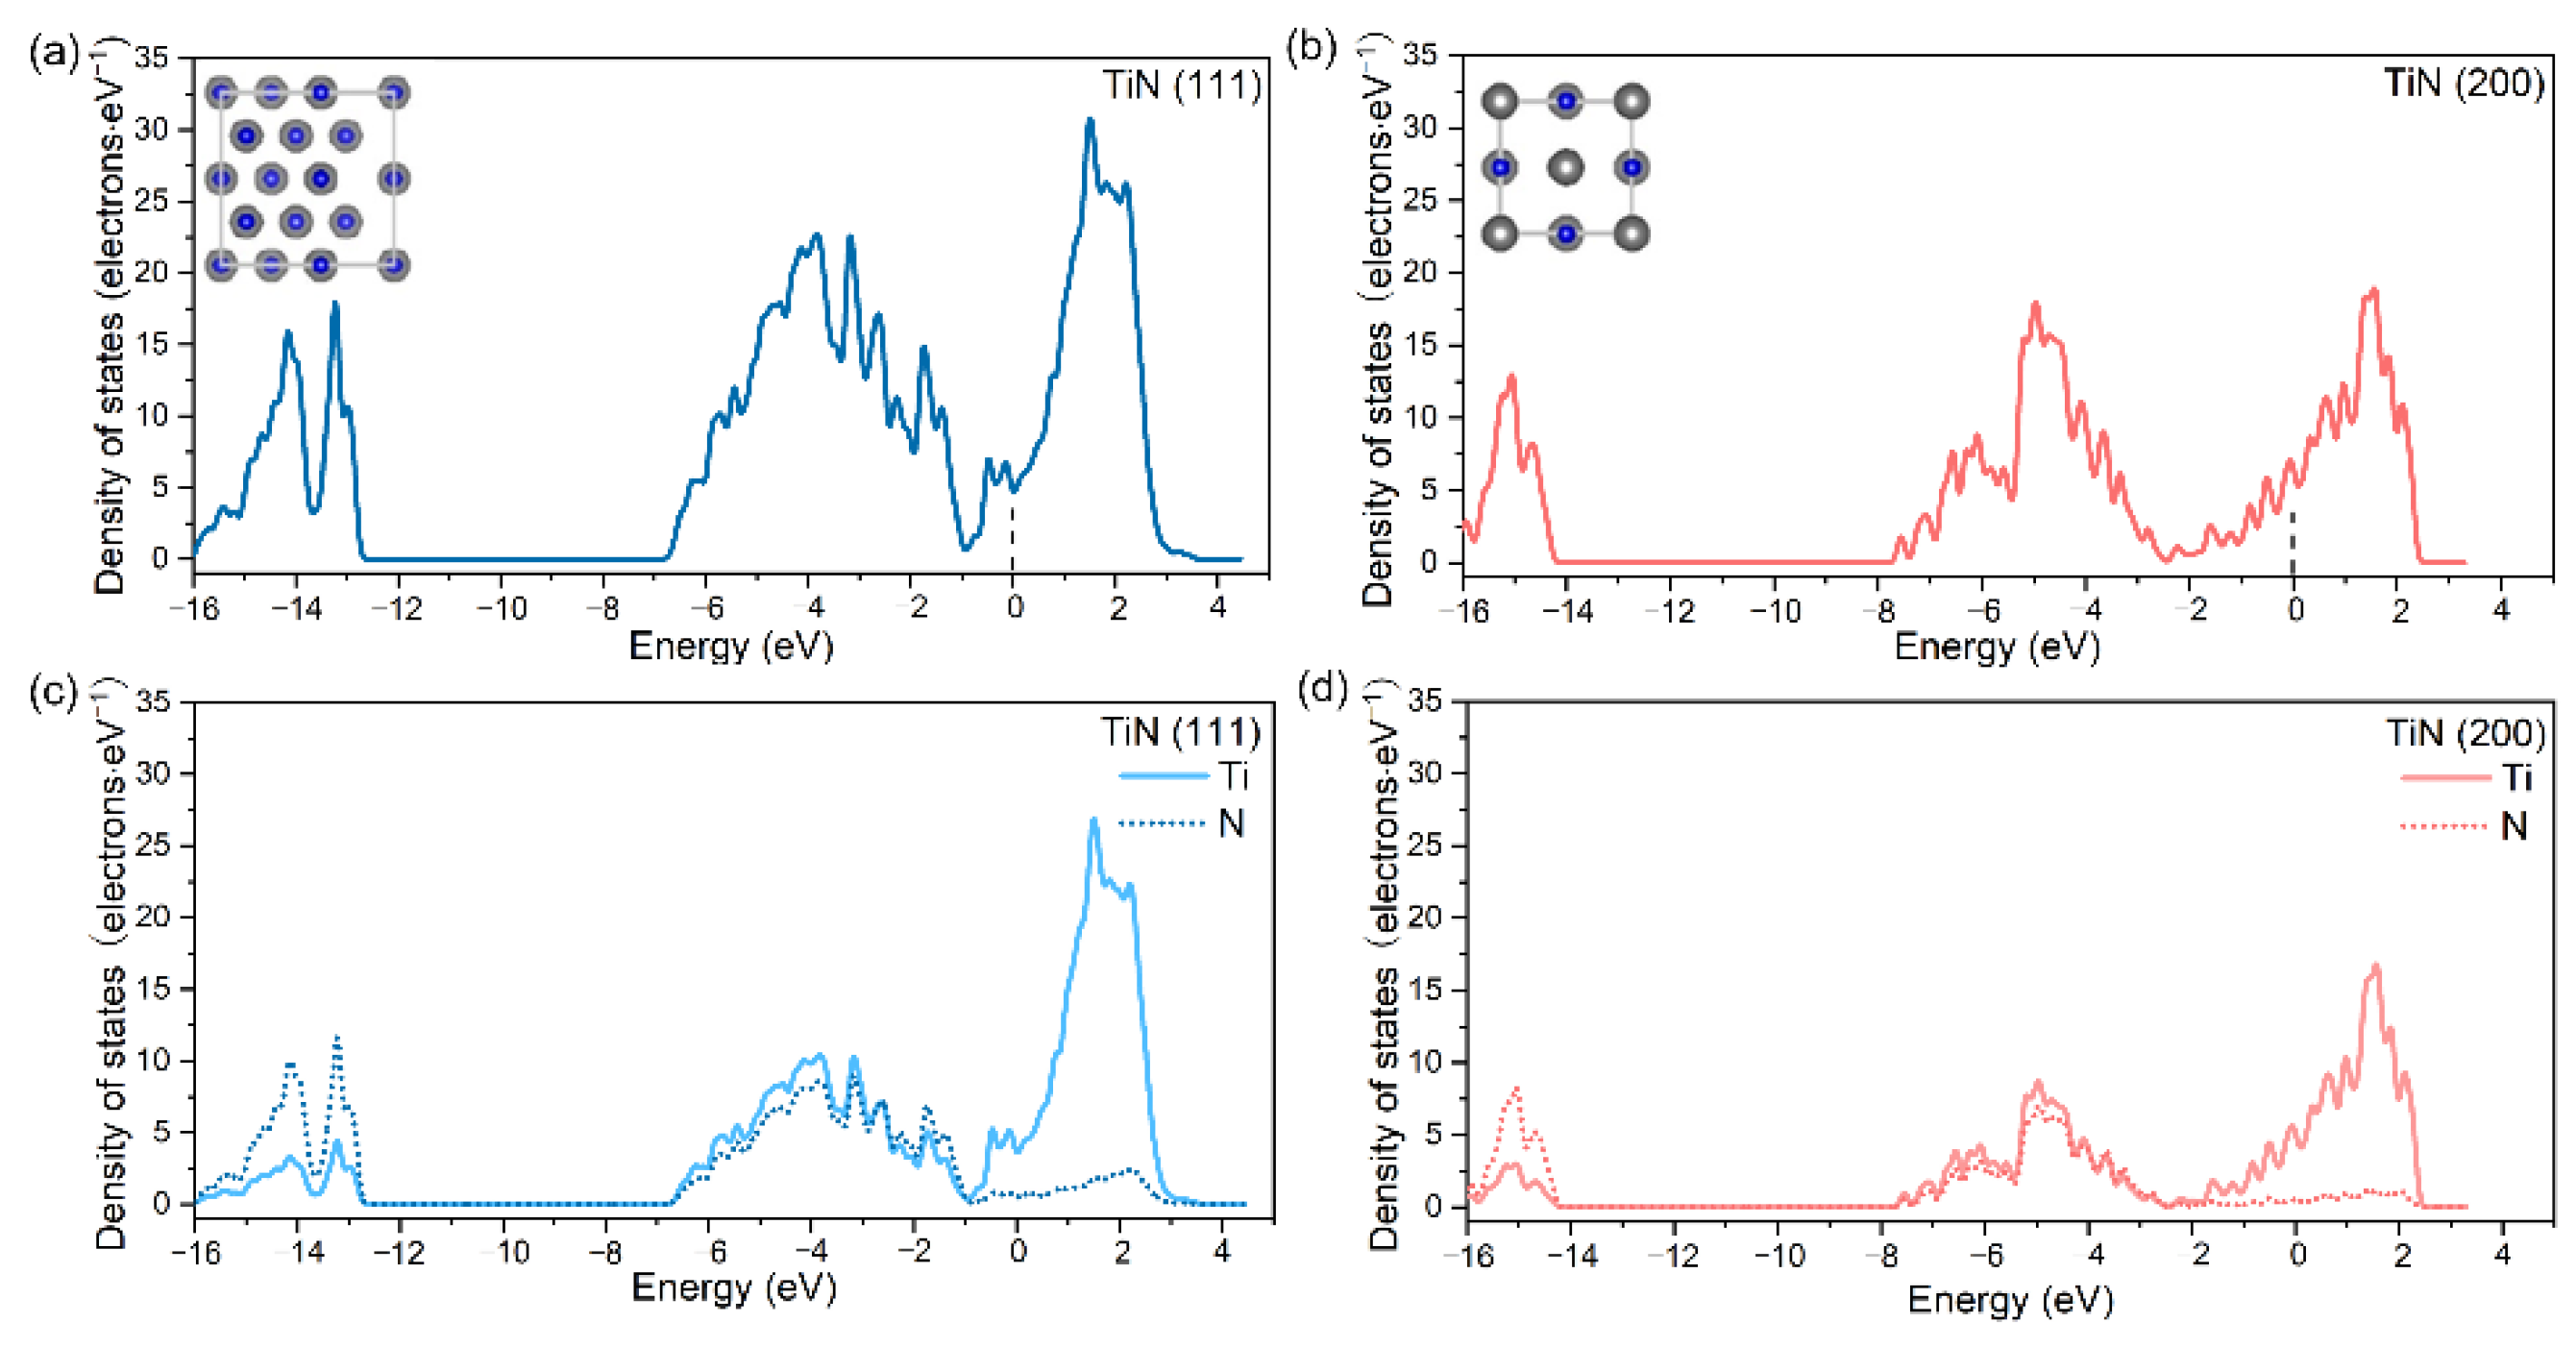
2.5. Computational Method

The density functional theory (DFT) calculations were performed with Vienna Ab-initio Simulation Package (VASP) 5.4 using PBE as exchange-correlation functional. The wave functions were expanded in plane waves with a kinetic energy cutoff of 400 eV, and the interaction between the ions and electrons was described by projector augmented wave (PAW) potentials. The periodically repeated simulation cells of TiN (200) included slabs of 6 substrate layers and 11 layers for TiN (111), with the vacuum between the slabs of 15 Å. The unit cell was (1 × 1) repetition. Monkhorst–Pack grid sampling of the Brillouin zone (BZ) was used with 7 × 7 × 1 k-points for DOS calculation. Specifically, atomic positions were relaxed until forces on each atom were less than 0.5 meV/atom.

3. Results and Discussion

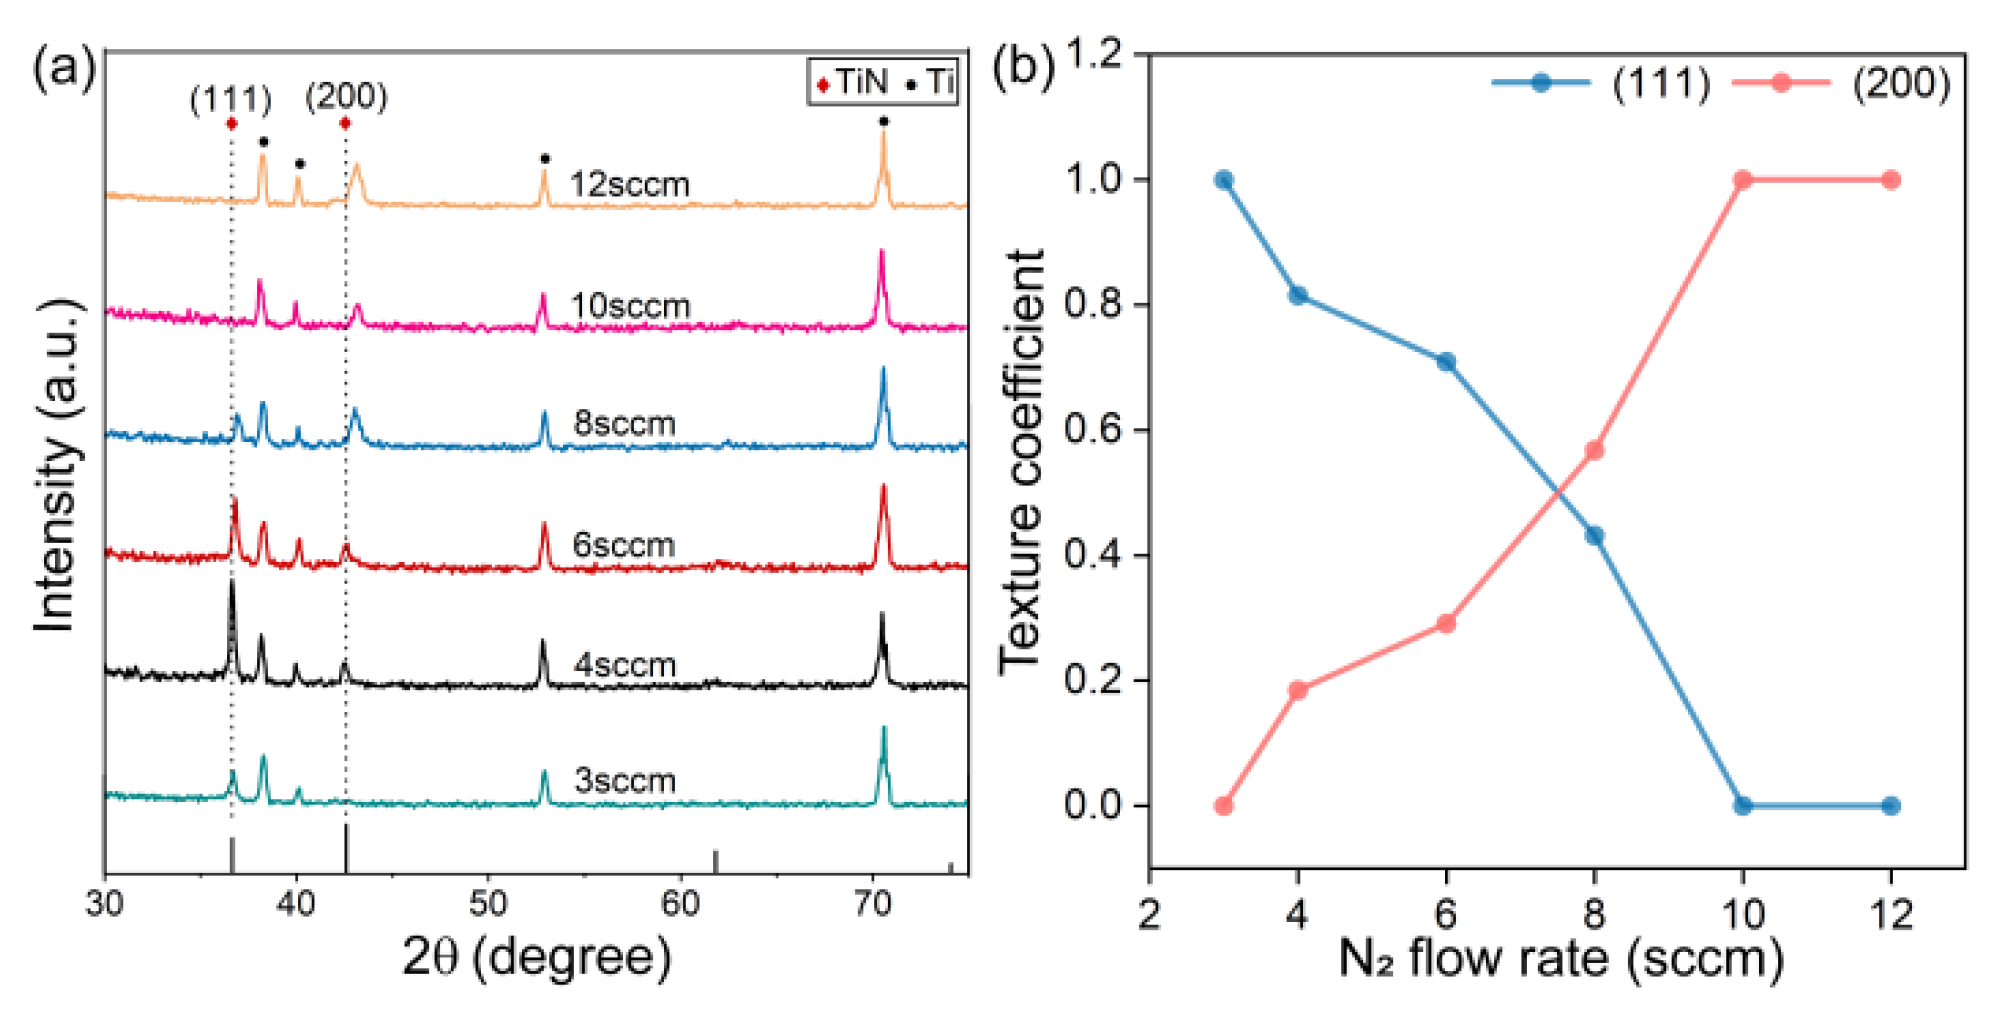
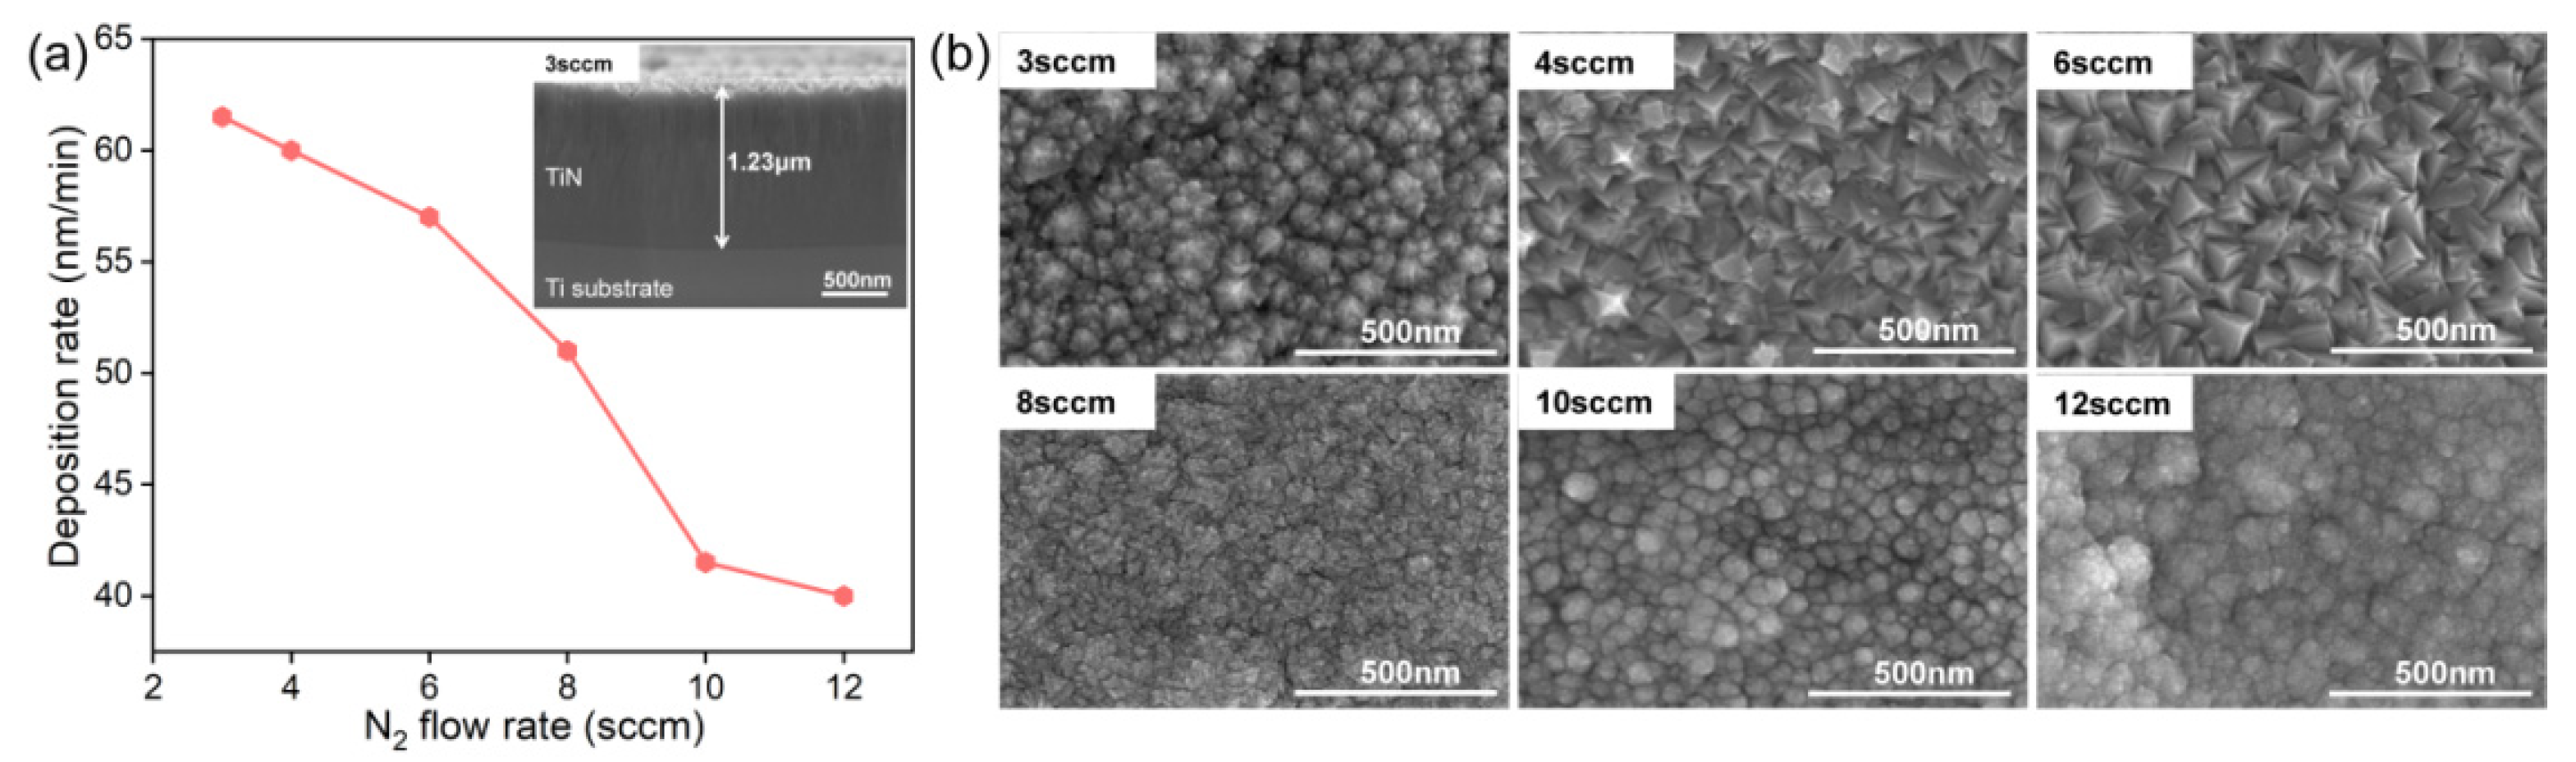
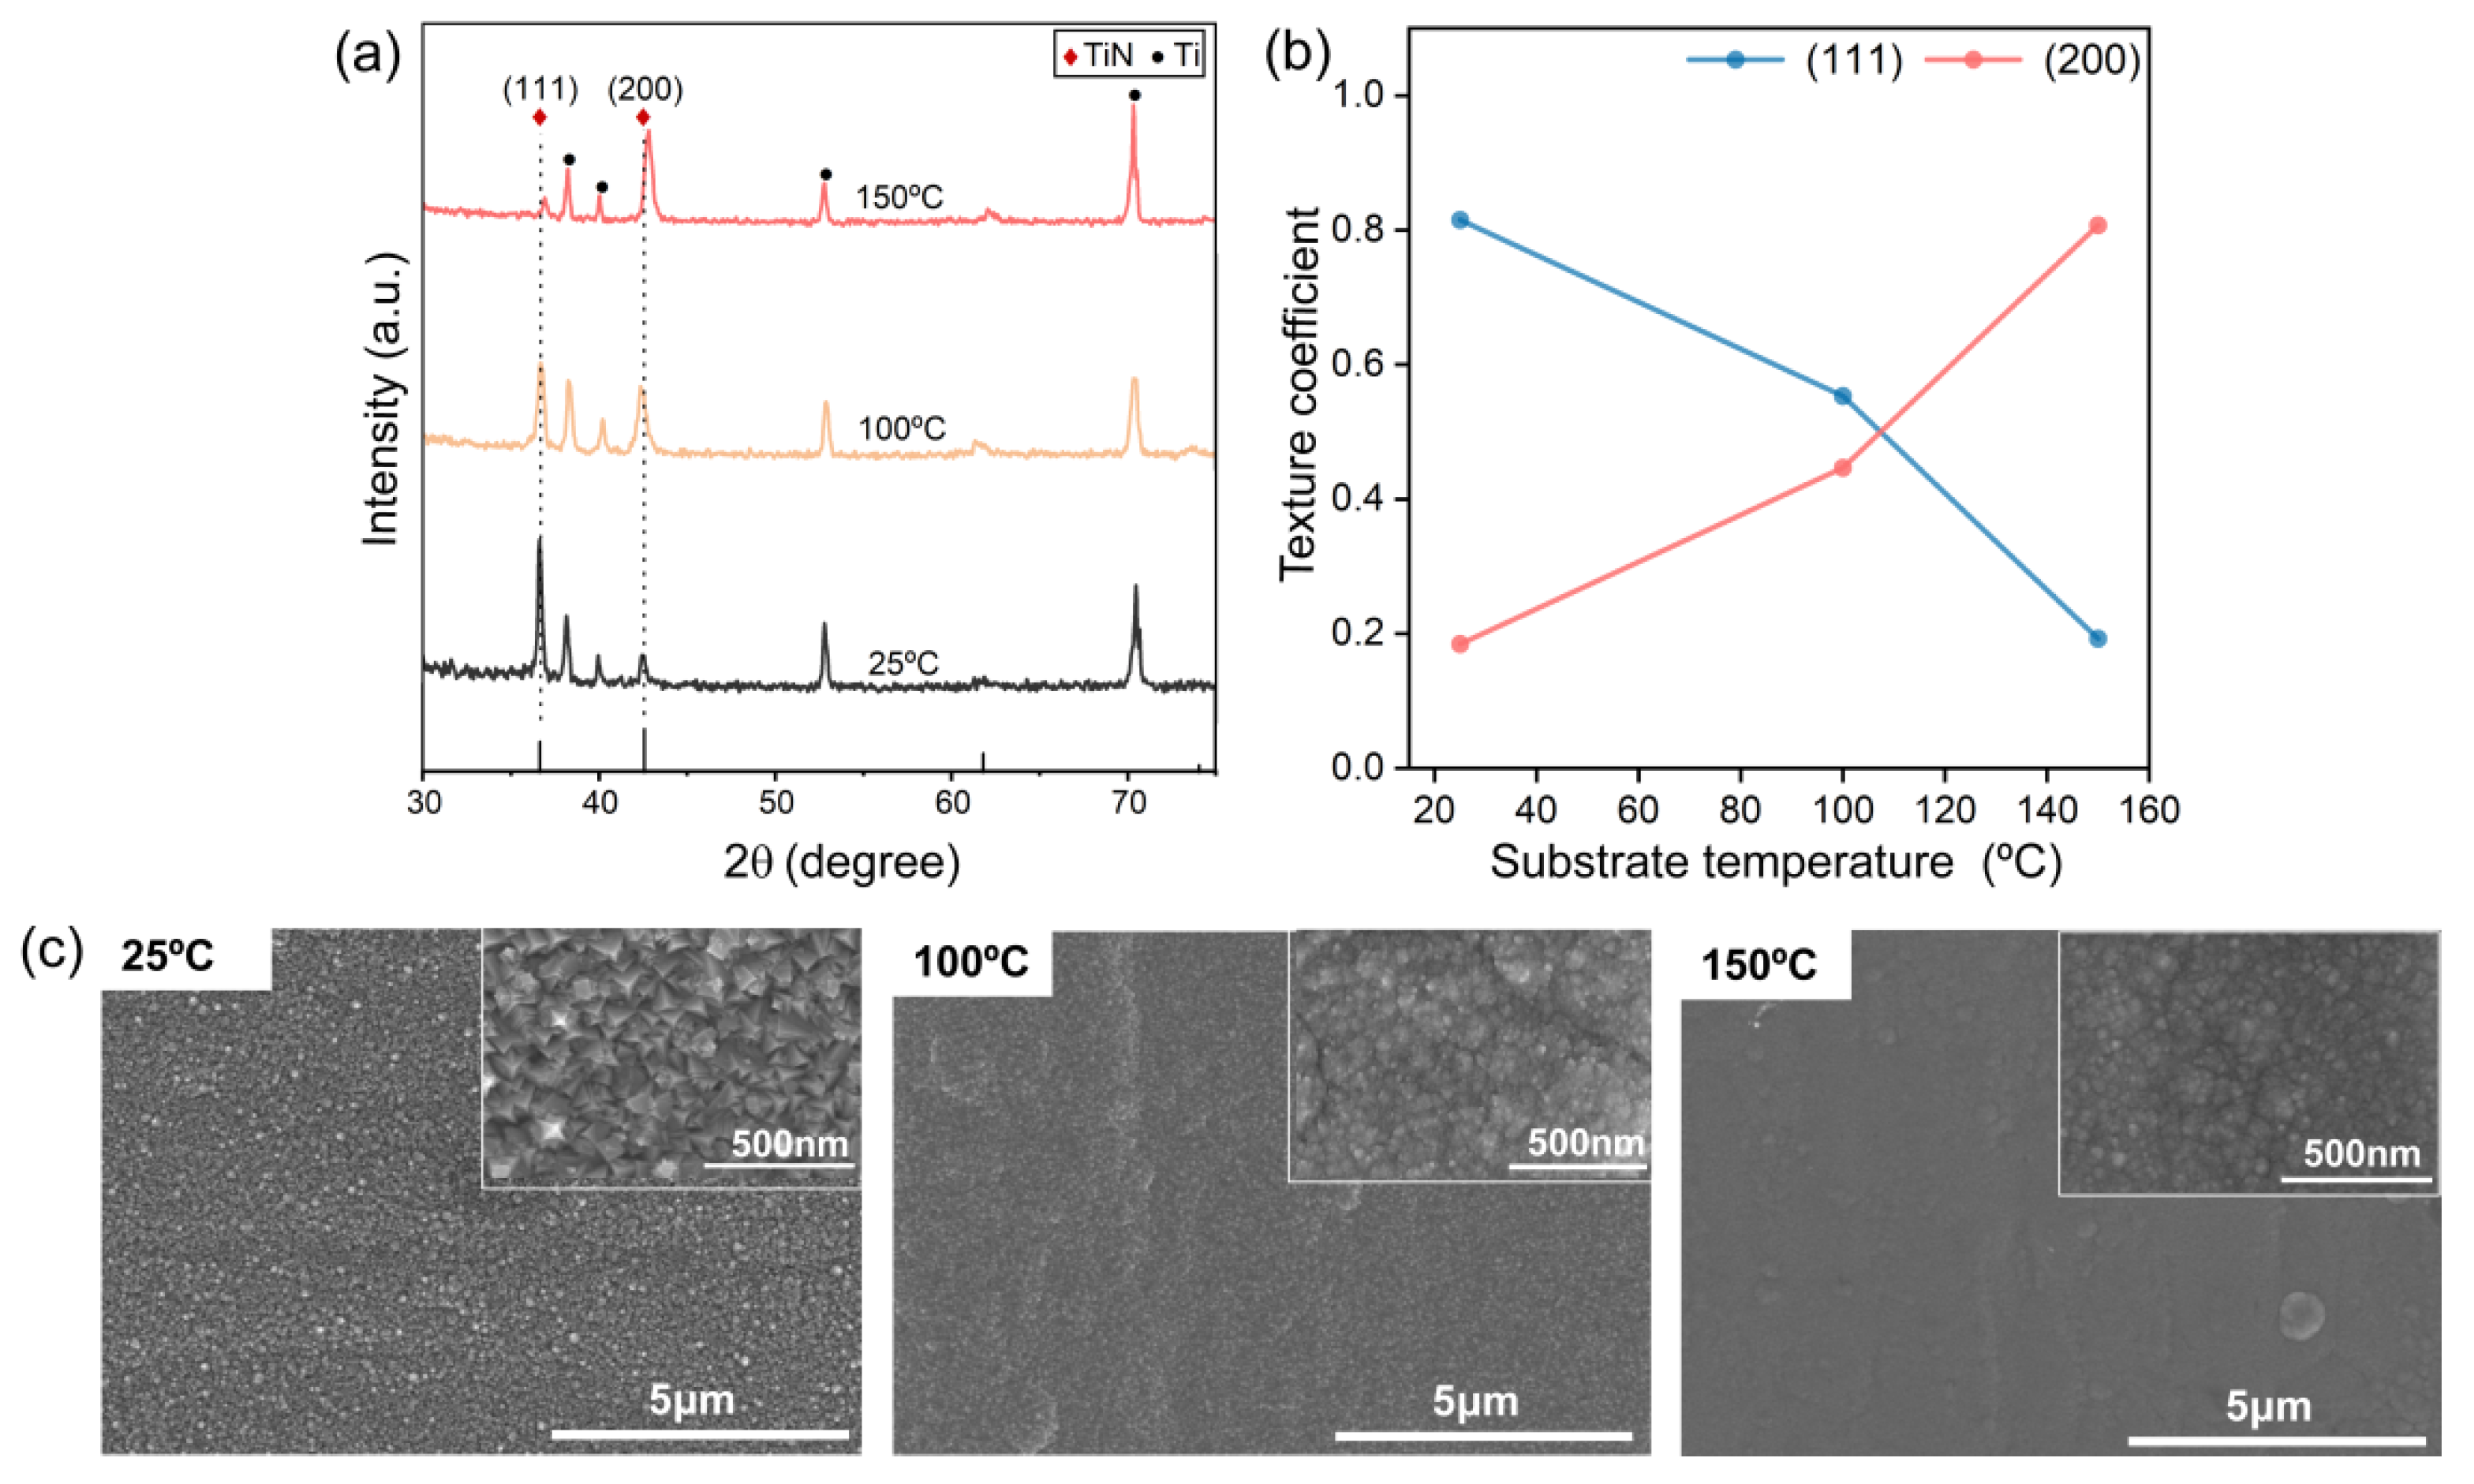
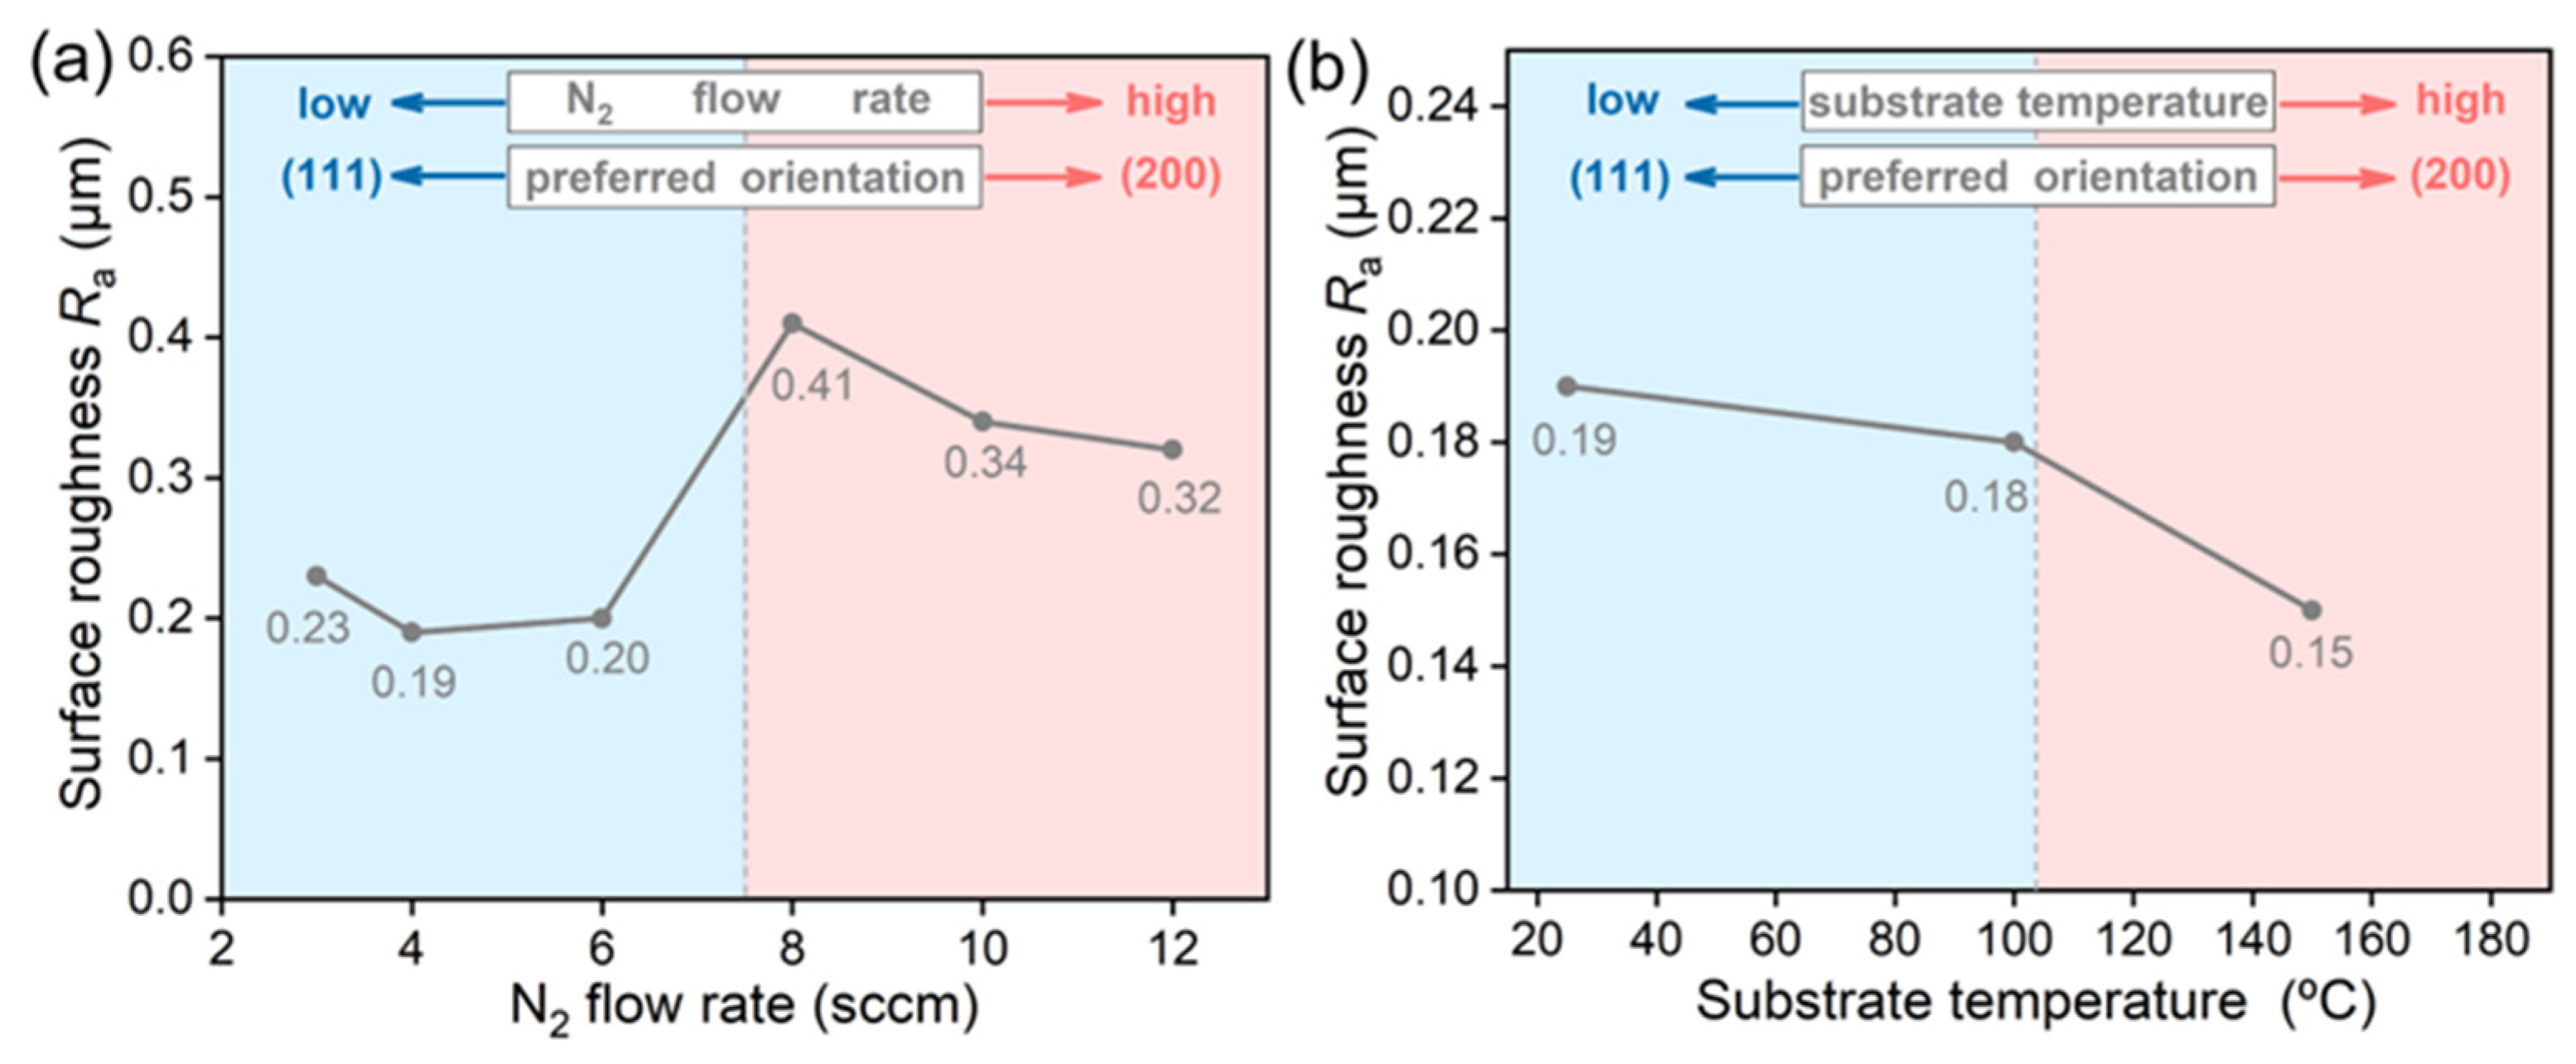
3.1. Characterization of TiN Films
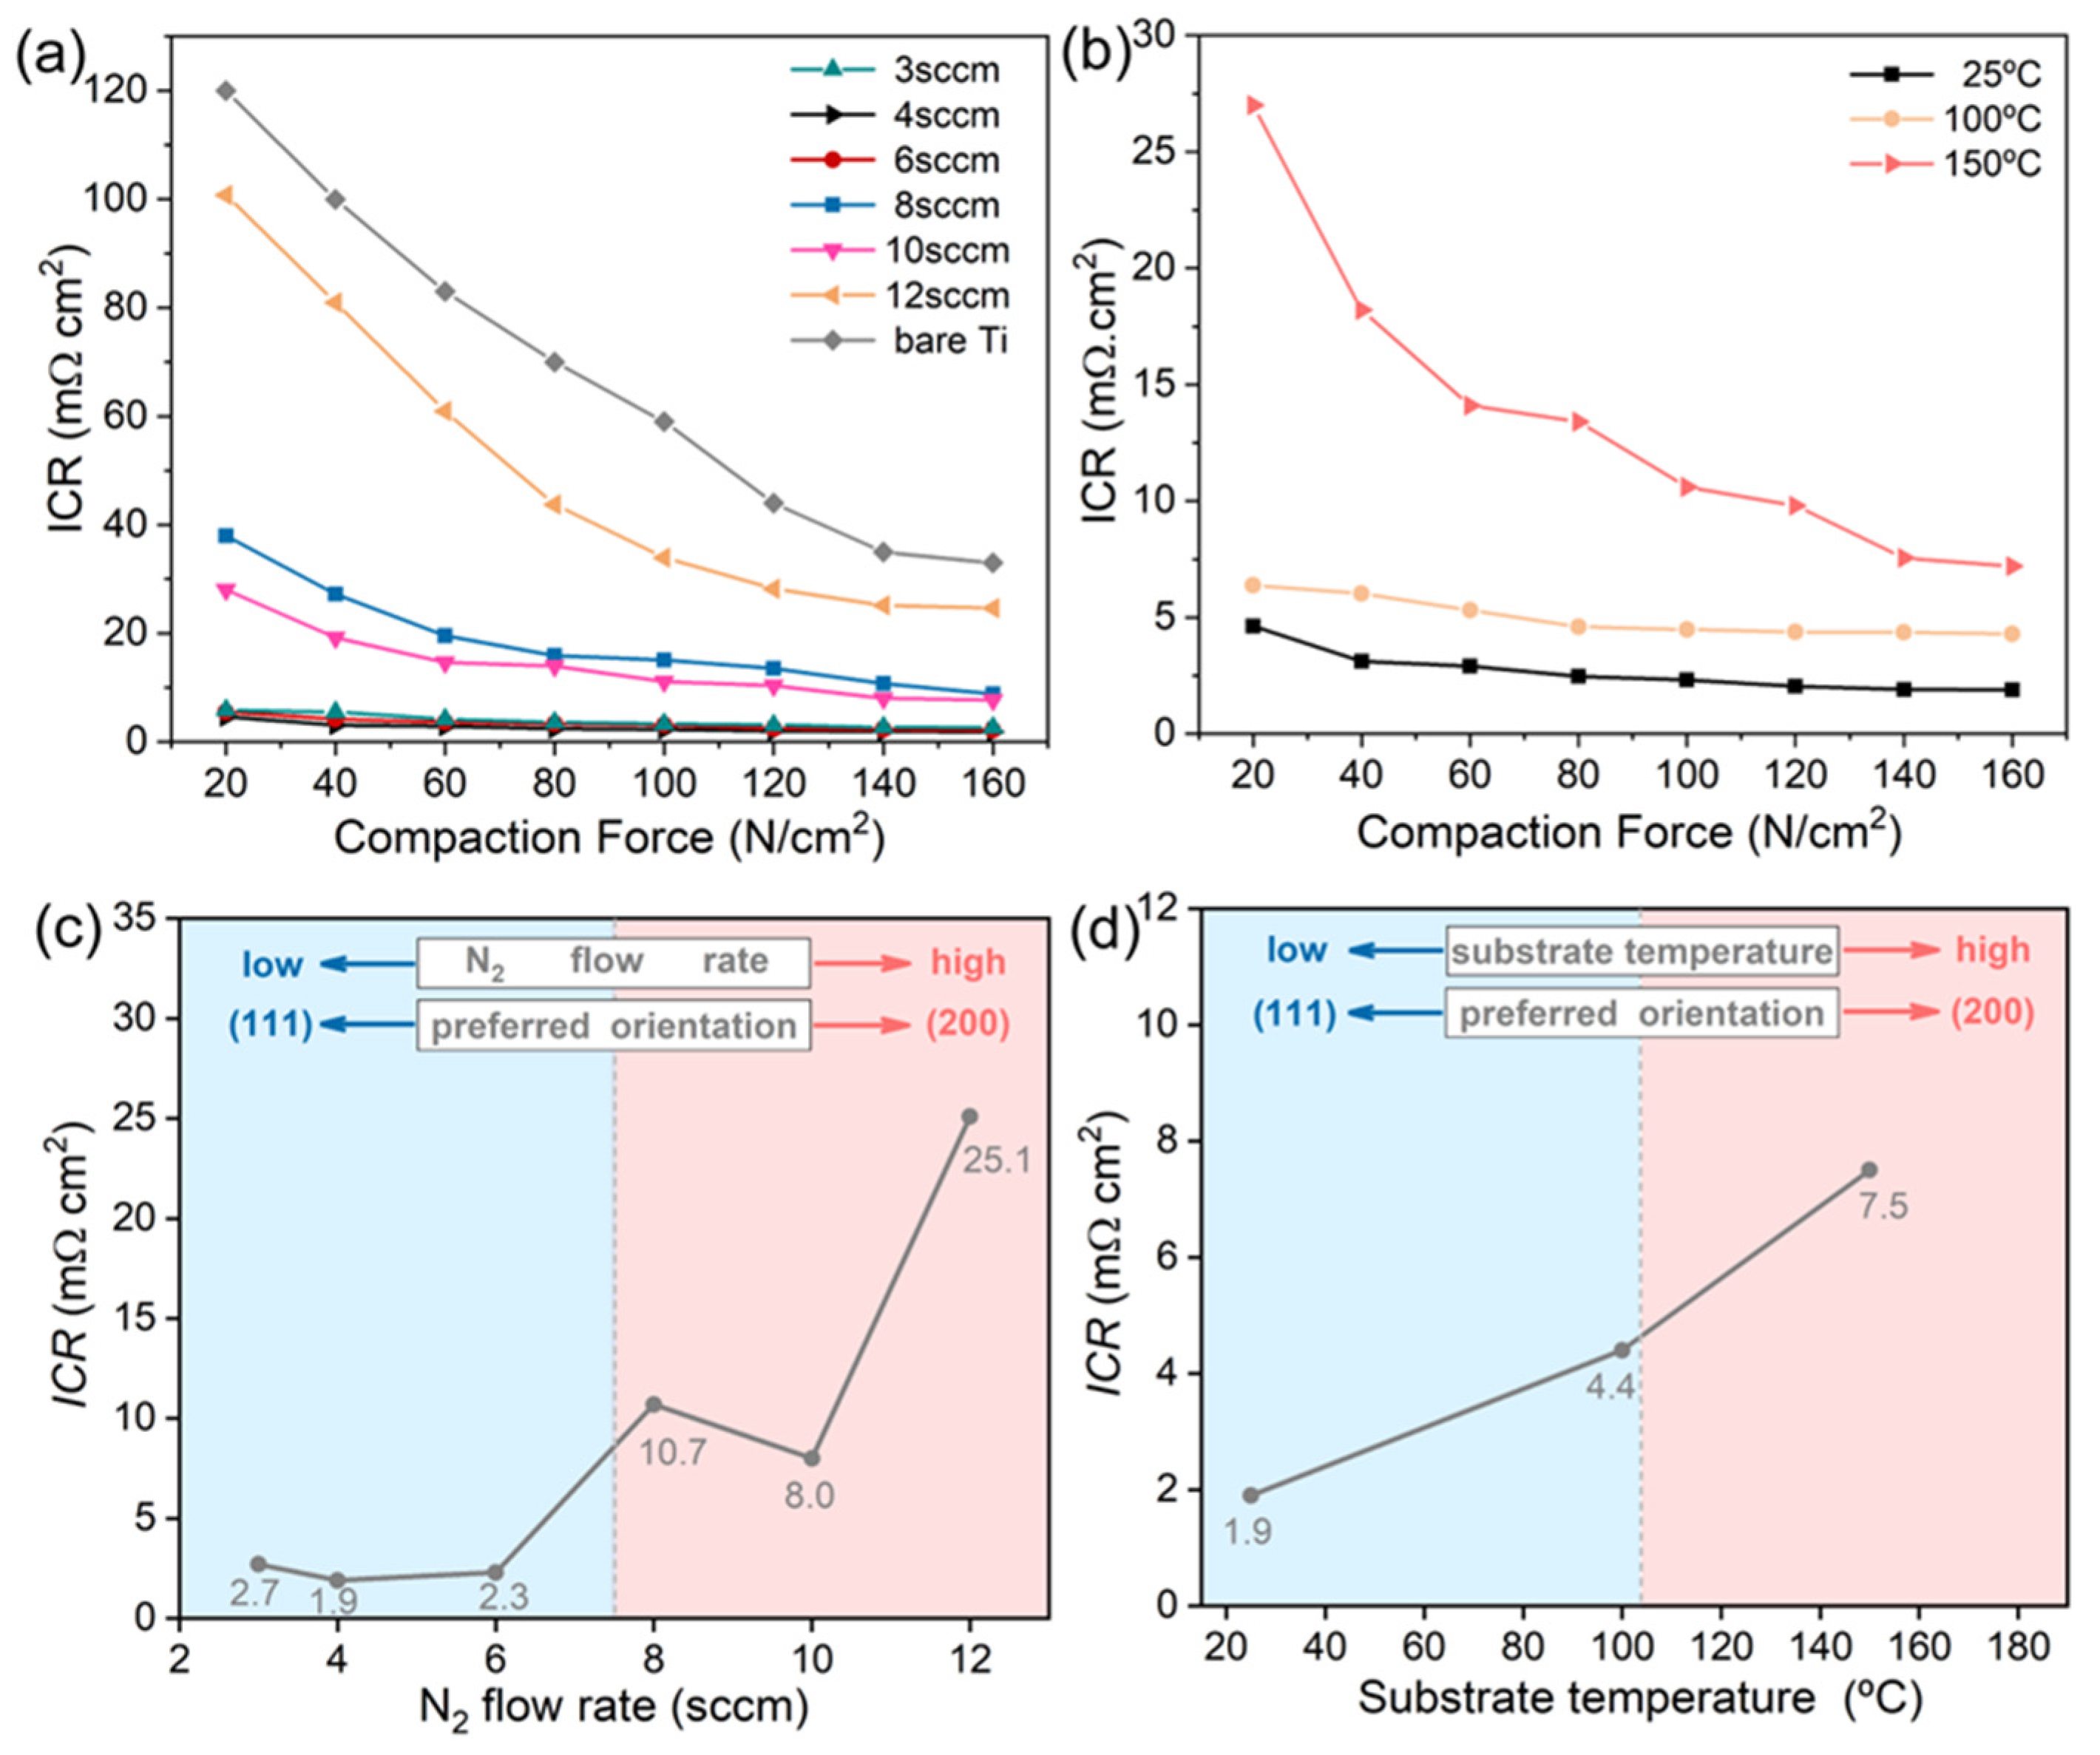
Figure 1a shows the XRD patterns of TiN films prepared at different N2 flow rates when the Ti substrate temperature was fixed at 25 °C. Besides the reflection peaks of Ti substrate (PDF#44-1294), the (111) and/or (200) crystal planes of FCC TiN (PDF#38-1420) can be observed in the series of coated samples. The TiN films show strong preferred orientation along the (111) plane when N2 flow is ≤6 sccm and along (200) plane when N2 flow is ≥8 sccm. Furthermore, the (200) reflection is fully suppressed at the low N2 flow of 3 sccm and the (111) reflection disappears at the high N2 flow of 10 and 12 sccm. Additionally, the peaks of the (111) and (200) shift to higher diffraction angles at higher N2 flow rate, which could be explained by the formation of severely nitrogen-deficient film (Table S1) [27,32,33], as evidenced by XPS measurement (Figure S1). Note that, as the N2 flow increases, the full width at half maximum (FWHM) of the (111) and (200) reflections become smaller (Table S2) suggesting the declining crystallinity, which may lead to high resistivity [34].
The composition of TiN films is estimated by XPS measurement (Table S1). With the increase of N2 flow rate, the N concentration in TiN films grows slightly and reaches the maximum of 40.61 mol%, which decreases slightly to ≤36.72 mol% as the N2 flow rate further increases ≥8 sccm. However, higher N2 flows leading to the more frequent collisions could reduce the energy used for the dissociation of nitrogen molecules [29]. Thus, the N atom concentration near the substrate may decrease when high N2 flow rises up to ≥8 sccm, resulting in lower N content in the TiN film.
The degree of the preferred orientation is also determined using the texture coefficient (Tc) according to Equation (1) [35],
T c ( hkl ) = I m ( hkl ) / I 0 ( hkl ) 1 n [ I m ( hkl ) / I 0 ( hkl ) ]
where Im(hkl) and I0(hkl) represent the measured relative intensity of the (hkl) plane and the same plane in a standard reference sample, and n is the total number of reflection peaks from the coated sample. The relationship between the Tc values of the (111) and (200) planes and the N2 flow rate is exhibited in Figure 1b. The preferred orientation of the film growth changes from (111) to (200) plane with the increase of N2 flow rate. Impressively, TiN film becomes fully (111) orientated at the N2 flow of 3 sccm and converts to full (200) orientation at the N2 flow of 10 and 12 sccm.
The TiN films are tightly bound to Ti substrates as shown in the inset of Figure 2a and Figure S2. The thickness of TiN films lies between 0.80~1.23 μm. Thus, the deposition rate is calculated based on the thickness and deposition time, which slows down as the N2 flow rate rises (Figure 2a). The surface morphologies of TiN films also show strong dependence on the N2 flow rates (Figure 2b). At the low N2 flow rates of 3 to 6 sccm, the TiN films with the (111) plane preferred orientation are composed of regular and sharp polyhedral particles evenly distributing on the surface. At the moderate N2 flow rate of 8 sccm, the polyhedron structure disappears when the preferred orientation of TiN film transfers from the (111) to the (200) plane. At the higher N2 flow rates of 10 and 12 sccm, the surfaces of TiN films are fully covered by spheres when TiN films grow completely along the (200) plane.
The change of preferred orientation of TiN film could be attributed to the competition between surface energy and strain energy. For FCC TiN crystals, the (111) plane shows the lowest strain energy due to the anisotropy in Young’s modulus, while the (200) plane shows the lowest surface energy [36,37]. At higher deposition rates, many nuclei in a state of high energy are condensed at the same time, leading to a relatively large internal stress in the film. Accordingly, TiN preferably grows along the direction of the (111) plane to relieve strain energy and minimize the overall energy of the films at low N2 flow rates. On the contrary, the surface energy dominates the competition with strain energy at low deposition rates and hence, the (200) plane with the lowest surface energy becomes preferred at high N2 flow rates.
The preferred orientation of TiN film is also influenced by substrate temperature. Figure 3 shows the XRD patterns of TiN films prepared at different substrate temperatures with the N2 flow fixed at 4 sccm. The (111) plane is dominant at the substrate temperature of 25 °C, while the (200) plane becomes dominant as the substrate temperature rises up to 150 °C. Moreover, the surface morphology changes from sharp polyhedral particles for the film prepared at the substrate temperature of 25 °C to spheres for the film prepared at the substrate temperature of 150 °C (Figure 3c). Apparently, the surface of TiN films becomes more compact and smoother when the substrate temperature is increased up to 150 °C. The thickness of TiN film slightly decreases from 1.20 μm for the film prepared at the substrate temperature of 25 °C to 1.06 μm for the film prepared at the substrate temperature of 150 °C, as shown in Figure S3.

3.2. ICR Test

Figure 4a,b show the ICR values of TiN films at different compaction forces, and Figure 4c,d summarize the interfacial contact resistance (ICR) at 140 N/cm2 as a function of the N2 flow rate and substrate temperature. The ICR values decrease rapidly with the increase of the testing compaction pressure due to the increase of actual contact area. In Figure 4c, TiN films show small ICR values of 1.9~2.3 mΩ·cm2 at N2 flow ≤ 6 sccm, which jumps to 8.0~25.1 mΩ·cm2 at the N2 flow ≥ 8 sccm. In Figure 4d, the ICR value increases from 1.9 mΩ·cm2 at the substrate temperature of 25 °C to 7.5 mΩ·cm2 at the substrate temperature of 150 °C. The smallest ICR of 1.9 mΩ·cm2 is achieved at the N2 flow of 4 sccm and substrate temperature of 25 °C, which surpasses remarkably the DOE 2020 target of 10 mΩ·cm2. Compared to the (111) preferred orientation, the (200) preferred orientation contributes significantly to the higher ICR values ≥ 8 mΩ·cm2. The distinctly different ICR values between TiN films regarding different N2 flow rates and substrate temperatures can be majorly attributed to the different preferred orientation, as illustrated in Figure 4c,d.
To further understand how different preferred orientation influences the surface electronic conductivity of TiN, the local density of states (LDOS) of the (111) and (200) surface facets using the optimized surface structures are calculated, as shown in Figure 5. Due to the continuous energy band, both the (111) and (200) surface facets are favorable for electron conduction (Figure 5a,b), in which the main contribution of conduction band comes from Ti atoms rather than N atoms (Figure 5c,d). However, for the unoccupied states above the Fermi level (0 eV), the (111) surface facet shows a much stronger peak area than the (200) surface facet (Figure 5a,b), indicating the presence of more free electrons in the (111) plane. Consequently, higher surface conductivity and low ICR values are achieved in TiN films with the (111) preferred orientation.
The influence of surface roughness (Ra) on surface conductivity was also investigated. As shown in Figure 6a, small Ra values of 0.19~0.23 μm are observed at the low N2 flow rate of 3 to 6 sccm, while TiN films show also small ICR values of 1.9~2.3 mΩ·cm2. At the high N2 flow rate of 8 to 12 sccm, the Ra value rises up from 0.32 to 0.41 μm, while TiN films show also high ICR values of 8.0~25.1 mΩ·cm2. On the other hand, the Ra value decreases from 0.19 to 0.15 μm when the substrate temperature increases from 25 to 150 °C (Figure 6b), due to the formation of more compact and smoother surfaces at higher temperatures (Figure 3c). However, the smaller Ra values at the higher temperatures of 100 and 150 °C do not contribute to the smaller ICR values (Figure 4b), indicating that surface roughness is not the major factor determining surface conductivity.
In addition, the N and O concentrations in TiN would influence surface conductivity. As reported in [32,38], higher N and lower O concentrations contribute to higher electrical conductivity. For the TiN films prepared at 25 °C, it is also observed that at N2 flow ≤ 6 sccm, TiN films shows slightly higher N and lower O concentrations, and lower ICR values than the films prepared at N2 flow ≥ 8 sccm (Table S1). Compared to the other TiN films with the (111) preferred orientation (Figure 4c), the TiN film prepared at N2 flow of 3 sccm shows the lower N concentration of 38.24 mol% and higher O concentration of 15.06 mol% (Table S1) and hence, a relatively higher ICR value of 2.3 mΩ·cm2 is measured for this film, although it is fully (111) orientated (Figure 1).

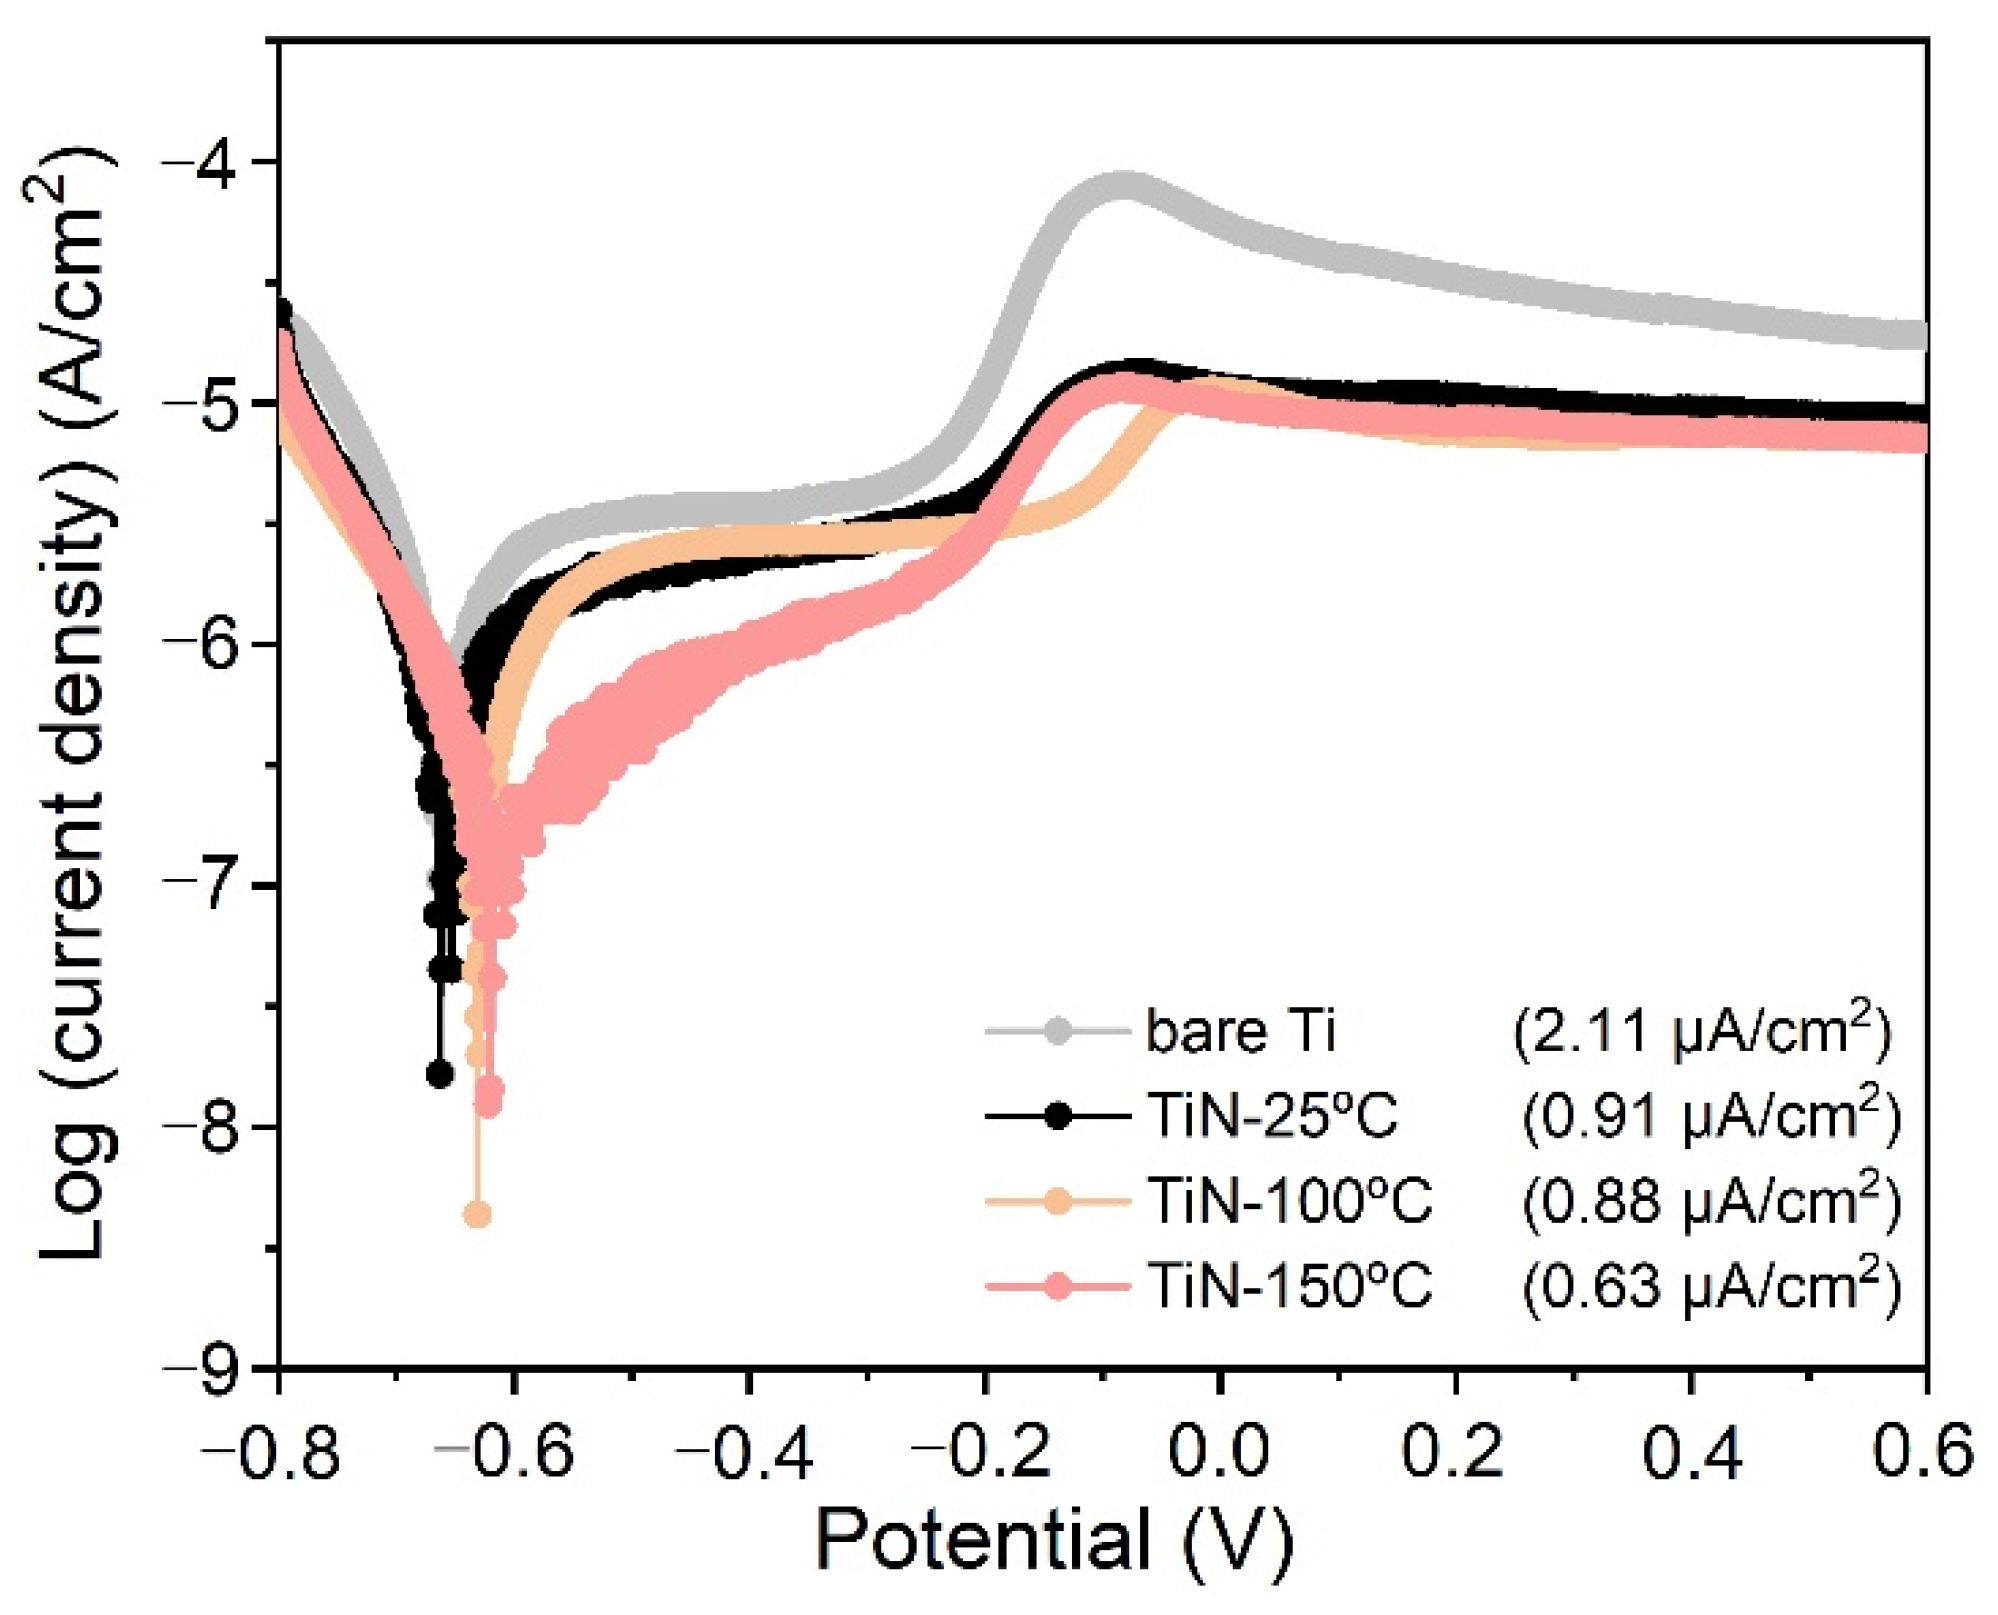
3.3. Electrochemical Analysis

The corrosion resistance of TiN films is evaluated by potentiodynamic polarization measurements in the acid solution (0.05 M H2SO4 + 2 ppm HF) bubbling with air at 80 °C (shown in Figure 7). The corrosion current densities (Icorr) of all coated or uncoated samples are deduced from the above-mentioned polarization curves by Tafel extrapolation method [39]. The TiN film prepared at N2 flow of 4 sccm and substrate temperature of 25 °C exhibits a low Icorr of 0.91 μA/cm2, which meets the DOE 2020 target of 1 μA/cm2 on corrosion resistance requirement for BPP. Icorr is further reduced to 0.63 μA/cm2 in the TiN film prepared at the substrate temperature of 150 °C, possibly owing to the improvement in surface compactness (shown in Figure 3c).

4. Conclusions

In summary, we demonstrate the strong dependence of surface conductivity on preferred orientation of TiN film, which is successfully controlled along the (111) or (200) planes by adjusting the N2 flow rate or Ti substrate temperature during the preparation process. The results indicate that the (111) preferred orientated TiN films show much lower ICR values than the (200) preferred orientated films. The TiN film prepared at the N2 flow of 4 sccm and the substrate temperature of 25 °C exhibits a low ICR value of 1.9 mΩ·cm2 at 140 N/cm2 and a low Icorr of 0.91 μA/cm2 (0.05 M H2SO4 + 2 ppm HF solution at 80 °C), which surpass both of the DOE 2020 targets on surface conductivity and corrosion resistance for bipolar plates.

Supplementary Materials

The following supporting information can be downloaded at: https://www.mdpi.com/article/10.3390/coatings12040454/s1, Figure S1: (a) XPS survey spectra and (b) deconvoluted XPS spectra of Ti 2p of TiN films prepared at different N2 flow rates with the substrate temperature fixed at 25 °C.; Figure S2: SEM cross-section images of TiN-Ti prepared at different N2 flow rates with the substrate temperature fixed at 25 °C; Figure S3: SEM cross-section images of TiN films prepared at different substrate temperatures with N2 flow fixed at 4 sccm. Table S1: The compositions and ICR values of TiN films, derived from the XPS survey spectra in Figure S1; Table S2: The full width at half maximum of (111) and (200) peaks derived from the XRD patterns of TiN films in Figure 1a.

Author Contributions

Experimental design, Y.Y. and Y.C.; Experiment conduction, Z.Y. and T.L.; Literature search, Z.Y. and T.L.; Data analysis, Z.Y., Y.W., C.W., Y.Y. and Y.C.; Theoretical calculation, Q.W. and H.L.; Manuscript writing, Z.Y., Y.Y. and Y.C. All authors have read and agreed to the published version of the manuscript.

Funding

This work was supported by the Sichuan Science and Technology Program (2021JDJQ0020) and the Fundamental Research Funds for the Central Universities (No. 1082204112219).

Institutional Review Board Statement

Not applicable.

Informed Consent Statement

Not applicable.

Data Availability Statement

Not applicable.

Conflicts of Interest

The authors declare no conflict of interest.

References

  1. Chandan, A.; Hattenberger, M.; El-kharouf, A.; Du, S.; Dhir, A.; Self, V.; Pollet, B.G.; Ingram, A.; Bujalski, W. High temperature (HT) polymer electrolyte membrane fuel cells (PEMFC)—A review. J. Power Sour. 2013, 231, 264–278. [Google Scholar] [CrossRef]
  2. Liu, Y.; Yu, Z.; Chen, J.; Li, C.; Zhang, Z.; Yan, X.; Liu, X.; Yang, S. Recent development and progress of structural energy devices. Chin. Chem. Lett. 2021; in press. [Google Scholar] [CrossRef]
  3. Xiong, K.; Wu, W.; Wang, S.; Zhang, L. Modeling, design, materials and fabrication of bipolar plates for proton exchange membrane fuel cell: A review. Appl. Energy 2021, 301, 117443. [Google Scholar] [CrossRef]
  4. Song, Y.; Zhang, C.; Ling, C.-Y.; Han, M.; Yong, R.-Y.; Sun, D.; Chen, J. Review on current research of materials, fabrication and application for bipolar plate in proton exchange membrane fuel cell. Int. J. Hydrog. Energy 2020, 45, 29832–29847. [Google Scholar] [CrossRef]
  5. Singh, R.S.; Gautam, A.; Rai, V. Graphene-based bipolar plates for polymer electrolyte membrane fuel cells. Front. Mater. Sci. 2019, 13, 217–241. [Google Scholar] [CrossRef]
  6. Iqbal, M.Z.; Rehman, A.-U.; Siddique, S. Prospects and challenges of graphene based fuel cells. J. Energ. Chem. 2019, 39, 217–234. [Google Scholar] [CrossRef] [Green Version]
  7. Brady, M.P.; Weisbrod, K.; Paulauskas, I.; Buchanan, R.A.; More, K.L.; Wang, H.; Wilson, M.; Garzon, F.; Walker, L.R. Preferential thermal nitridation to form pin-hole free Cr-nitrides to protect proton exchange membrane fuel cell metallic bipolar plates. Scr. Mater. 2004, 50, 1017–1022. [Google Scholar] [CrossRef]
  8. Taherian, R. A review of composite and metallic bipolar plates in proton exchange membrane fuel cell: Materials, fabrication, and material selection. J. Power Sour. 2014, 265, 370–390. [Google Scholar] [CrossRef]
  9. He, R.Y.; Jiang, J.; Wang, R.F.; Yue, Y.; Chen, Y.; Pan, T.J. Anti-corrosion and conductivity of titanium diboride coating on metallic bipolar plates. Corros. Sci. 2020, 170, 108646. [Google Scholar] [CrossRef]
  10. Wu, S.; Yang, W.; Yan, H.; Zuo, X.; Cao, Z.; Li, H.; Shi, M.; Chen, H. A review of modified metal bipolar plates for proton exchange membrane fuel cells. Int. J. Hydrog. Energy 2021, 46, 8672–8701. [Google Scholar] [CrossRef]
  11. Wang, S.-H.; Peng, J.; Lui, W.-B. Surface modification and development of titanium bipolar plates for PEM fuel cells. J. Power Sour. 2006, 160, 485–489. [Google Scholar] [CrossRef]
  12. Jin, J.; He, Z.; Zhao, X. Formation of a protective TiN layer by liquid phase plasma electrolytic nitridation on Ti–6Al–4V bipolar plates for PEMFC. Int. J. Hydrog. Energy 2020, 45, 12489–12500. [Google Scholar] [CrossRef]
  13. Zhang, P.; Hao, C.; Han, Y.; Du, F.; Wang, H.; Wang, X.; Sun, J. Electrochemical behavior and surface conductivity of NbC modified Ti bipolar plate for proton exchange membrane fuel cell. Surf. Coat. Technol. 2020, 397, 126064. [Google Scholar] [CrossRef]
  14. Yi, P.; Dong, C.; Zhang, T.; Xiao, K.; Ji, Y.; Wu, J.; Li, X. Effect of plasma electrolytic nitriding on the corrosion behavior and interfacial contact resistance of titanium in the cathode environment of proton-exchange membrane fuel cells. J. Power Sour. 2019, 418, 42–49. [Google Scholar] [CrossRef]
  15. Wang, S.-H.; Peng, J.; Lui, W.-B.; Zhang, J.-S. Performance of the gold-plated titanium bipolar plates for the light weight PEM fuel cells. J. Power Sour. 2006, 162, 486–491. [Google Scholar] [CrossRef]
  16. Li, T.; Yan, Z.; Liu, Z.; Yan, Y.; Chen, Y. Surface microstructure and performance of TiN monolayer film on titanium bipolar plate for PEMFC. Int. J. Hydrog. Energy 2021, 46, 31382–31390. [Google Scholar] [CrossRef]
  17. Lin, M.-T.; Wan, C.-H.; Wu, W. Comparison of corrosion behaviors between SS304 and Ti substrate coated with (Ti,Zr)N thin films as Metal bipolar plate for unitized regenerative fuel cell. Thin Solid Films 2013, 544, 162–169. [Google Scholar] [CrossRef]
  18. Shi, J.; Zhang, P.; Han, Y.; Wang, H.; Wang, X.; Yu, Y.; Sun, J. Investigation on electrochemical behavior and surface conductivity of titanium carbide modified Ti bipolar plate of PEMFC. Int. J. Hydrog. Energy 2020, 45, 10050–10058. [Google Scholar] [CrossRef]
  19. Xu, J.; Huang, H.J.; Li, Z.; Xu, S.; Tao, H.; Munroe, P.; Xie, Z.-H. Corrosion behavior of a ZrCN coated Ti alloy with potential application as a bipolar plate for proton exchange membrane fuel cell. J. Alloys Compd. 2016, 663, 718–730. [Google Scholar] [CrossRef] [Green Version]
  20. Gao, P.; Xie, Z.; Wu, X.; Ouyang, C.; Lei, T.; Yang, P.; Liu, C.; Wang, J.; Ouyang, T.; Huang, Q. Development of Ti bipolar plates with carbon/PTFE/TiN composites coating for PEMFCs. Int. J. Hydrog. Energy 2018, 43, 20947–20958. [Google Scholar] [CrossRef]
  21. Gao, P.; Xie, Z.; Ouyang, C.; Tao, T.; Wu, X.; Huang, Q. Electrochemical characteristics and interfacial contact resistance of Ni-P/TiN/PTFE coatings on Ti bipolar plates. J. Solid State Electr. 2018, 22, 1971–1981. [Google Scholar] [CrossRef]
  22. Wang, Y.; Tan, Q.; Huang, B. Synthesis and properties of novel N/Ta-co-doped TiO2 coating on titanium in simulated PEMFC environment. J. Alloys Compd. 2021, 879, 160470. [Google Scholar] [CrossRef]
  23. Chou, W.J.; Yu, G.P.; Huang, J.H. Deposition of TiN thin films on Si 100 by HCD ion plating. Surf. Coat. Technol. 2001, 140, 206–214. [Google Scholar] [CrossRef]
  24. Nakamori, Y.; Miwa, K.; Ninomiya, A.; Li, H.W.; Ohba, N.; Towata, S.I.; Zuttel, A.; Orimo, S.I. Correlation between thermodynamical stabilities of metal borohydrides and cation electronegativites: First-principles calculations and experiments. Phys. Rev. B 2006, 74, 045126. [Google Scholar] [CrossRef] [Green Version]
  25. Yang, C.H.Q.; Zhao, L.R.; Immarigeon, J.-P. Preferred orientation and hardness enhancement of TiN/CrN superlattice coatings deposited by reactive magnetron sputtering. Scr. Mater. 2002, 46, 293–297. [Google Scholar] [CrossRef]
  26. Lu, L.; Luo, F.; Huang, Z.; Zhou, W.; Zhu, D. Influence of the nitrogen flow rate on the infrared emissivity of TiNx films. Infrared Phys Techn. 2018, 88, 144–148. [Google Scholar] [CrossRef]
  27. Zhang, H.; Li, Z.; He, W.; Ma, C.; Liao, B.; Li, Y. Mechanical modification and damage mechanism evolution of TiN films subjected to cyclic nano-impact by adjusting N/Ti ratios. J. Alloys Compd. 2019, 809, 151816. [Google Scholar] [CrossRef]
  28. Jeyachandran, Y.L.; Narayandass, S.K.; Mangalaraj, D.; Areva, S.; Mielczarski, J.A. Properties of titanium nitride films prepared by direct current magnetron sputtering. Mater. Sci. Eng. A 2007, 445, 223–236. [Google Scholar] [CrossRef]
  29. Arshi, N.; Lu, J.; Joo, Y.K.; Lee, C.G.; Yoon, J.H.; Ahmed, F. Influence of nitrogen gas flow rate on the structural, morphological and electrical properties of sputtered TiN films. J. Mater. Sci. Mater. Electron. 2012, 24, 1194–1202. [Google Scholar] [CrossRef]
  30. Huang, J.-H.; Lau, K.-W.; Yu, G.-P. Effect of nitrogen flow rate on structure and properties of nanocrystalline TiN thin films produced by unbalanced magnetron sputtering. Surf. Coat. Technol. 2005, 191, 17–24. [Google Scholar] [CrossRef]
  31. Kim, H.T.; Park, J.Y.; Park, C. Effects of nitrogen flow rate on titanium nitride films deposition by DC facing target sputtering method. Korean J. Chem. Eng. 2012, 29, 676–679. [Google Scholar] [CrossRef]
  32. Montes de Oca Valero, J.A.; Le Petitcorps, Y.; Manaud, J.P.; Chollon, G.; Carrillo Romo, F.J.; López, A.M. Low temperature, fast deposition of metallic titanium nitride films using plasma activated reactive evaporation. J. Vac. Sci. Technol. A 2005, 23, 394–400. [Google Scholar] [CrossRef]
  33. Huang, H.H.; Hon, M.H. Effect of N2 addition on growth and properties of titanium nitride films obtained by atmospheric pressure chemical vapor deposition. Thin Solid Films 2002, 416, 54–61. [Google Scholar] [CrossRef]
  34. Lee, W.J.; Yun, E.Y.; Hong, S.W.; Kwon, S.H. Ultrathin effective tin protective films prepared by plasma-enhanced atomic layer deposition for high performance metallic bipolar plates of polymer electrolyte membrane fuel cells. Appl. Surf. Sci. 2020, 519, 146215. [Google Scholar] [CrossRef]
  35. Jones, M.I.; McColl, I.R.; Grant, D.M. Effect of substrate preparation and deposition conditions on the preferred orientation of TiN coatings deposited by RF reactive sputtering. Surf. Coat. Technol. 2000, 132, 143–151. [Google Scholar] [CrossRef]
  36. Li, H.W.; Kikuchi, K.; Sato, T.; Nakamori, Y.; Ohba, N.; Aoki, M.; Miwa, K.; Towata, S.; Orimo, S. Synthesis and Hydrogen Storage Properties of a Single-Phase Magnesium Borohydride Mg(BH4)(2). Mater. Trans. 2008, 49, 2224–2228. [Google Scholar] [CrossRef] [Green Version]
  37. Li, H.W.; Kikuchi, K.; Nakamori, Y.; Ohba, N.; Miwa, K.; Towata, S.; Orimo, S. Dehydriding and rehydriding processes of well-crystallized Mg(BH(4))(2) accompanying with formation of intermediate compounds. Acta Mater. 2008, 56, 1342–1347. [Google Scholar] [CrossRef]
  38. Lengauer, W. Properties of bulk δ-TiN1-x prepared by nitrogen diffusion into titanium metal. J. Alloys Compd. 1992, 186, 293–307. [Google Scholar] [CrossRef]
  39. Amin, M.A.; Khaled, K.F.; Fadl-Allah, S.A. Testing validity of the Tafel extrapolation method for monitoring corrosion of cold rolled steel in HCl solutions—Experimental and theoretical studies. Corros. Sci. 2010, 52, 140–151. [Google Scholar] [CrossRef]
Figure 1. (a) XRD patterns of TiN films prepared at different N2 flow rates and the substrate temperature of 25 °C, and (b) the texture coefficients of individual reflections of the (111) and (200) planes.
Coatings 12 00454 g001
Figure 2. (a) The deposition rates and (b) SEM images of TiN films prepared at different N2 flow rates with the substrate temperature fixed at 25 °C.
Coatings 12 00454 g002
Figure 3. (a) XRD patterns of TiN films prepared at different substrate temperatures with N2 flow fixed at 4 sccm, and (b) the texture coefficients of individual reflections of the (111) and (200) plane, and (c) SEM images of TiN films prepared at different substrate temperatures.
Coatings 12 00454 g003
Figure 4. ICR values of TiN films prepared at different (a) N2 flow rates and (b) substrate temperatures at different compaction forces, and ICR values at 140 N/cm2 as the function of (c) N2 flow rate and (d) substrate temperature.
Coatings 12 00454 g004
Figure 5. LDOS of (a) TiN (111) surfaces and (b) N-terminated TiN (200) surfaces; inset showing top views of N-terminated TiN (111) and TiN (200) surfaces (the gray and blue spheres represent Ti and N atoms, respectively), and representative contribution of Ti and N atoms on (c) (111) and (d) (200) planes.
Coatings 12 00454 g005
Figure 6. Surface roughness as the function of (a) N2 flow rate and (b) substrate temperature.
Coatings 12 00454 g006
Figure 7. Potentiodynamic polarization curves of bare Ti and TiN films prepared at different substrate temperatures with N2 flow fixed at 4 sccm.
Coatings 12 00454 g007
Publisher’s Note: MDPI stays neutral with regard to jurisdictional claims in published maps and institutional affiliations.

