1. Introduction
Corrosion problems are expensive and potentially dangerous in many industries [
1,
2,
3,
4]. The proper operation of industrial devices in harsh, specifically corrosive, environments requires the application of coating systems characterized by long-term substrate protection. Hence, the correct selection of coating system is one of the important steps in the protection of new structures and the maintenance of old ones.
Each plant has specific exposure conditions that may not exist in other places. Moreover, in the same plant, different conditions apply in different locations. It is about parameters such as humidity, temperature, the chemical composition of the atmosphere, pollution, and mechanical (e.g., vibration) or physical (e.g., abrasion) impact. This affects the behavior of the coating system. Additional requirements are another obstacle to the optimal selection of the coating protection. Surface preparation procedures are often the limiting factor. Abrasive blasting may not always be used due to the operating installations or machines. The conditions for applying the coatings and their drying can be unfavorable or restrictive. Generally, the plant area is dirty and it is very difficult, if even impossible, to achieve the clean surface required by the standards. Furthermore, this has an impact on the effectiveness of protection. Often, the information from the manufacturer is not complete or insufficient. The paint manufacturer specifies the properties of the coating when the substrate is prepared following these standards. How will it behave if it fails to meet these conditions?
There are many manufacturers of protective coating systems on the market. How can we choose the product showing the best protective properties in specific industrial conditions when limited performance data is available?
The methods used so far (accelerated test chambers, natural exposure) do not meet the current requirements. In both cases, visual inspection is the primary method of evaluation [
5]. It is a largely subjective method that requires macroscopic signs of degradation, e.g., substrate corrosion products. However, current painting products are becoming more and more effective. Accordingly, the waiting time for visually discernible macroscopic signs of degradation increases significantly, especially for natural exposure. To improve the description of coating systems, a quantitative evaluation method is necessary for the detection of the earlier stages of degradation that are not macroscopically visible. It seems justified to claim that changes at the microscopic level occur much earlier and their detection would allow for the shortening of the waiting time for the differentiation of the tested samples. Electrochemical impedance spectroscopy (EIS) is a quantitative method that may be used to evaluate the protective performance of coatings [
6,
7,
8,
9,
10,
11,
12,
13,
14,
15,
16]. Amirudin and Thierry investigated the degradation phenomena of coatings on metals using EIS [
6]. Bierwagen et al. used EIS to test coated samples exposed in accelerated cabinets [
7]. On the other hand, Shreepathi et al. have focused on the relation between EIS results and the service-life predictions of organic coatings [
8]. Various variants of the analysis of impedance spectra were investigated in order to simplify their interpretation [
9,
10,
11]. Miszczyk and Darowicki proposed a multivariate approach using PCA for the analysis of impedance data [
12,
13,
14]. Margarit-Mattos et al. tested the possibility of using EIS to evaluate coating performance in very aggressive conditions [
15]. Xia et al. summarized the current state of electrochemical measurements in the field with a particular focus on EIS [
16].
Additionally, the corrosion chambers do not reproduce real environments and fail to reliably predict coating performance [
7,
11,
15]. This applies especially to industrial environments characterized by the specific chemical composition of the environment and often other types of exposure, e.g., vibration and/or abrasion. Mechanical influences in industrial conditions affect the protective properties of the coatings [
17]. These complex conditions cannot be simulated in corrosion test chambers.
This situation calls for a different approach to problem solving. Modern techniques of machine learning, data mining, and big data analysis provide novel strategies to solve different problems [
18,
19,
20]. The use of advanced multivariate data analysis algorithms in these techniques allows for the extraction of useful information from larger amounts of data.
As mentioned, different places, even in the same industrial hall, may have many different conditions. The analysis of the behavior of the coating in various conditions will allow us to better optimize the selection of the most advantageous solutions using a quantitative approach.
According to the theoretical and practical knowledge, the durability of the coating protection depends on the general conditions, which can be formulated in the form of three points [
5,
21,
22]:
- (1)
Selection of an appropriate paint system for the conditions of target users;
- (2)
Proper preparation of the surface of the substrate before painting;
- (3)
Applying paint in appropriate conditions (temperature, humidity, no rainfall, etc.).
The selection of the appropriate paint system is of key importance here, because it determines, while meeting the requirements of the following points, the durability of the protection. This procedure is difficult to carry out if there are no proper tools for the purpose.
In this paper, we proposed a new, innovative way to evaluate and choose the best systems in specific corrosive industrial environments in a reasonable time. This has been proven in the conditions of a mining and processing company at the division of copper ore enrichment in the Polish company KGHM Polska Miedz S.A., using the example of a ball mill for grinding copper ore. Coating system samples of various manufacturers were exposed to the natural conditions of flotation and the ore enrichment facility for one year and were assessed using EIS and the most frequently used chemometric tool, which is the principal components method (PCA).
2. Materials and Methods
A set of 21 paint systems from nine manufacturers (P1, …, P9) was collected (
Table 1), intended for the renovation of steel surfaces in difficult atmospheric and industrial conditions without the possibility of careful preparation of the surface before painting. The use of abrasive blasting for cleaning the surface of the substrate was not possible due to the presence of electrical devices (motors) operating continuously in the hall. The dust generated during such cleaning could cause the engines to seize and the flotation bath to be contaminated.
The systems were applied with a brush in two layers. Before the coating was applied, the surface was cleaned with a wire brush, washed with tap water, dried, and degreased with acetone. As can be seen from the results of thickness measurements (
Table 1), there is a noticeable spread of thickness. It results from the use of a brush to apply coatings and the specific properties of each paint.
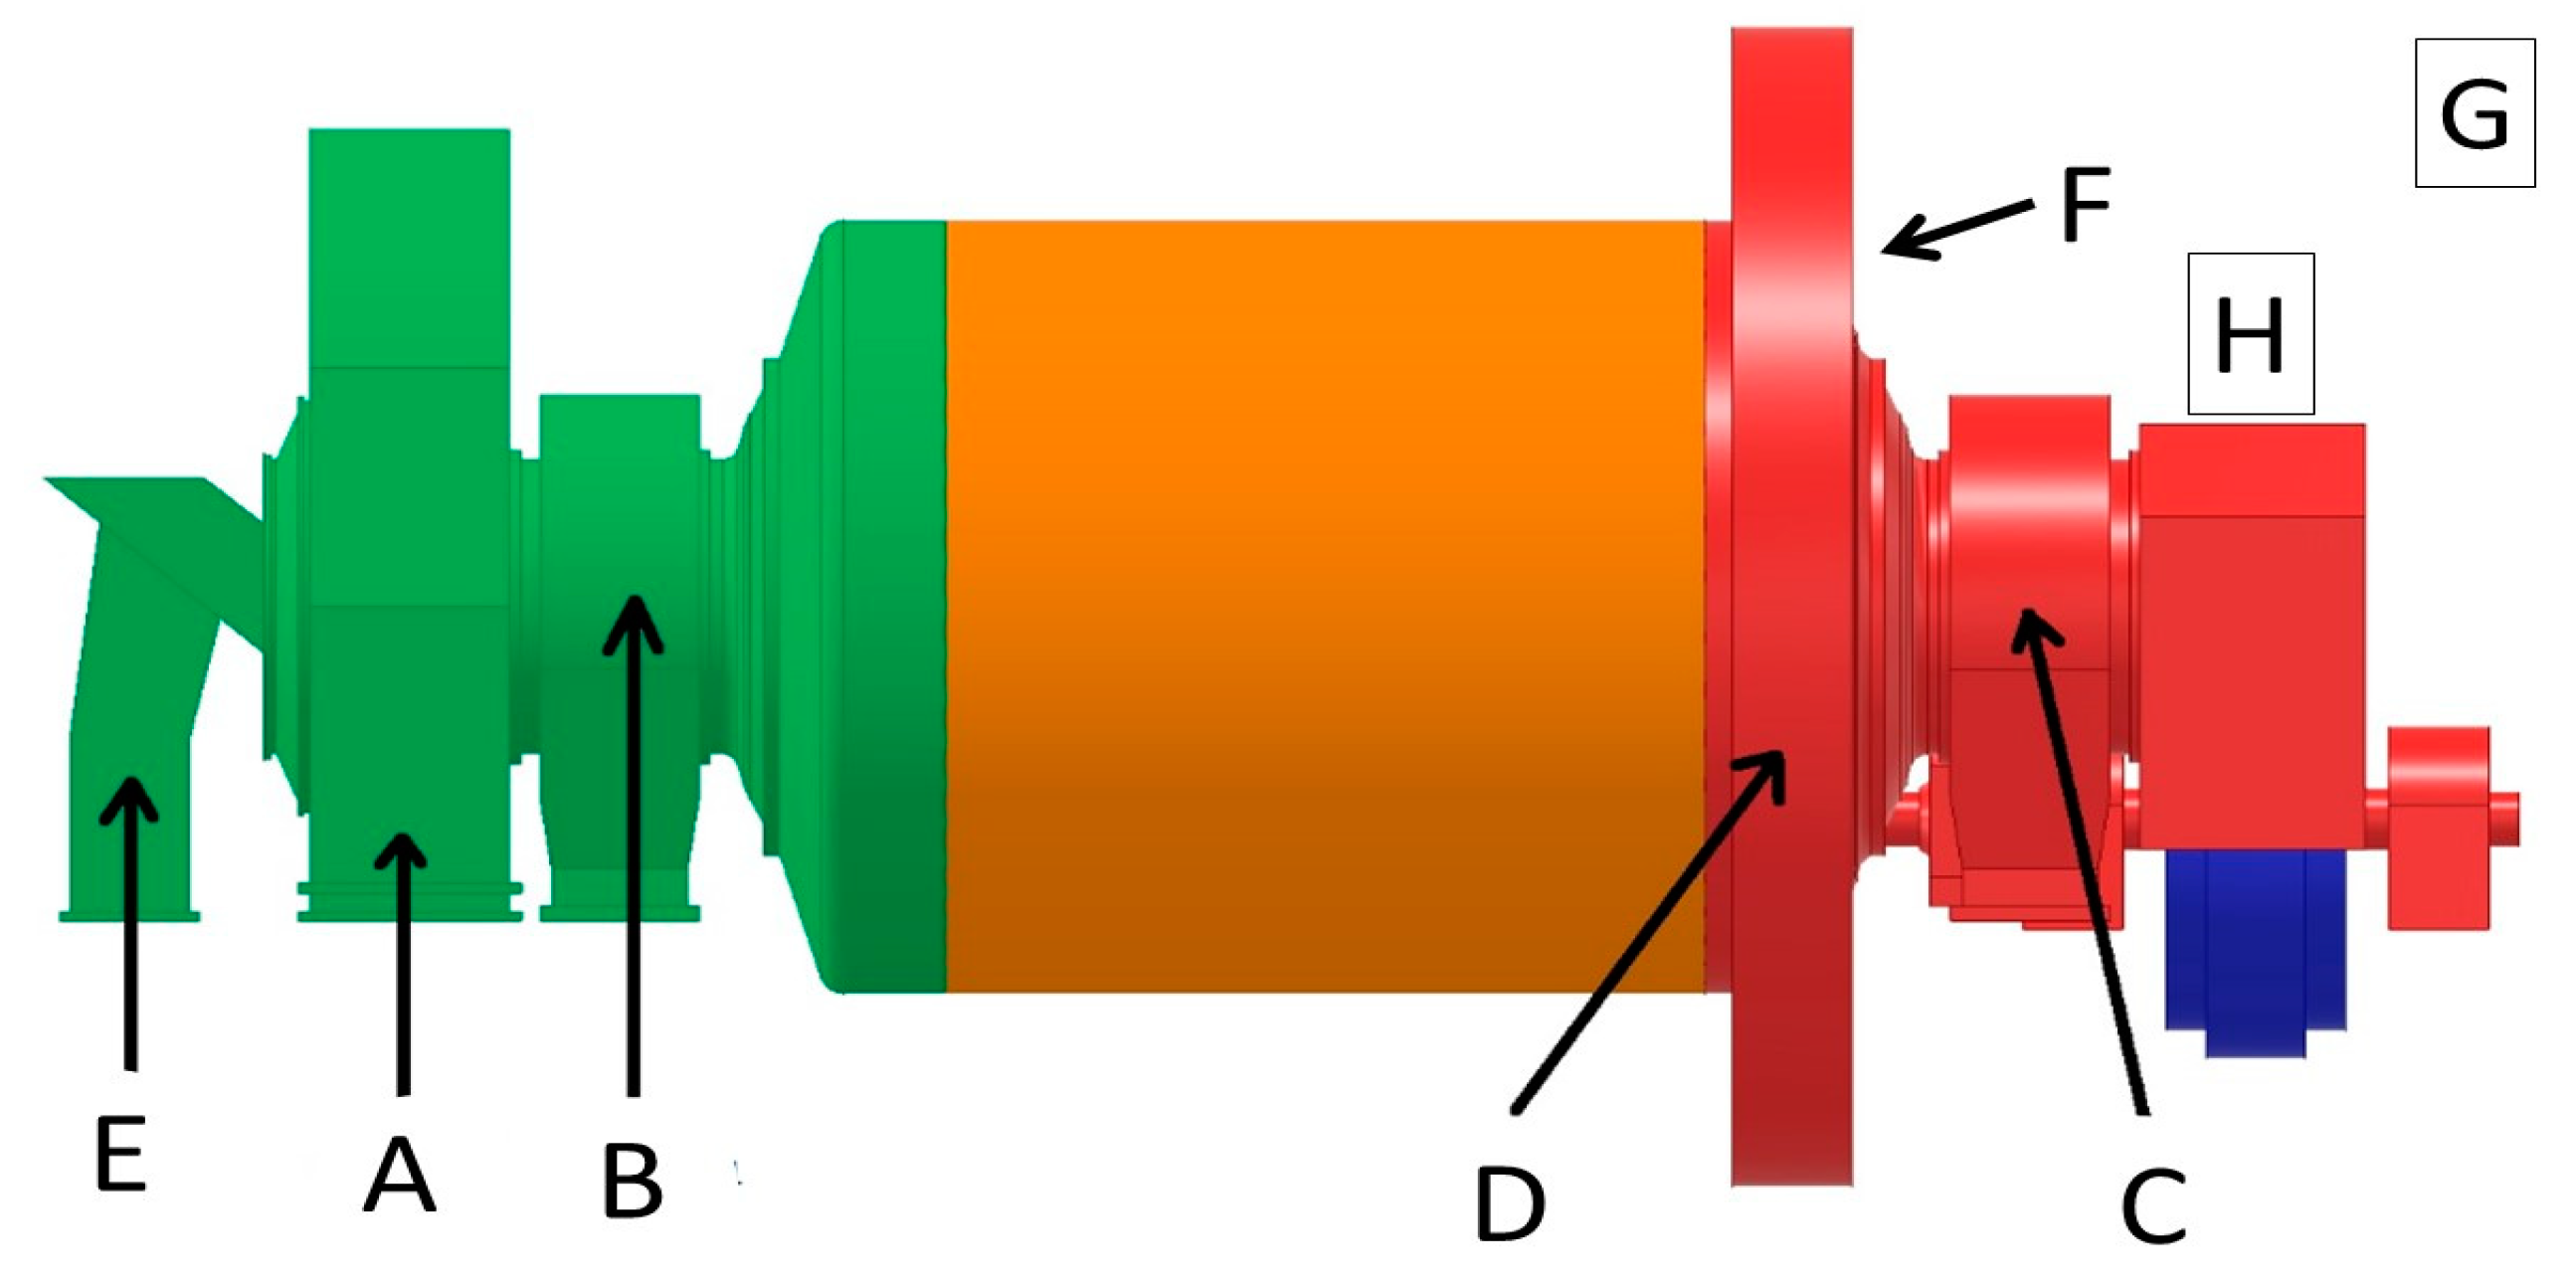
Paintings were made on the casing of the ball mill in six places characterized by different vibration parameters (A, B, C, D, E, F;
Figure 1 and
Figure 2). Additionally, a set of 15 cm × 8 cm × 0.3 cm test coating samples (G, H;
Figure 1,
Figure 3,
Figure 4 and
Figure 5) was attached to the body of the mill (
Figure 4) and near the mill, but without the presence of vibrations (
Figure 5). As the samples were prepared outside the hall, albeit similarly, it was easier to obtain better substrate preparation (e.g., by lower atmospheric humidity and less possibility of contamination of the substrate in the period between cleaning the surface and applying the coating).
The hall has a stable, elevated temperature concerning the ambient temperature; the relative air humidity is about 90%. Most of the surface is wetted with mine water containing 30 to 120 g/dm
3 of salt, mainly chlorides and sulphates, and dump copper ore dust. Additionally, there are present compounds added to the feed to facilitate the flotation process (collectors: ethyl and iso-butyl xanthates; frothers: a mixture of polyglycols and polyglycol ethers) [
23]. Most of the devices used in the hall are subject to vibration and abrasion [
24]. Earlier, the corrosivity of the atmosphere was examined by measuring the rate of corrosion loss of carbon steel plates in accordance with the EN ISO 12944-2 (2018) standard (European standard, EN ISO 12944-2
Paints and varnishes—Corrosion protection of steel structures by protective paint systems—Part 2: Classification of environments). The steel corrosion rate in these conditions was in the range of 39–222 µm/year. The range of medium to extreme corrosivity categories according to EN ISO 12944-2 occurs in the hall where the tests were carried out.
The flotation process itself is associated with the need to enrich the ore (usually containing 1.5% to 2% of copper) to the amount of 20–30%, which is required for metallurgical processes [
23]. The applied technologies for processing include such operations as crushing, screening, milling, classification, flotation, thickening, filtration, and drying of the concentrate. For enrichment, pneumatic–mechanical flotation machines requiring compressed air supply are used [
23]. They generate an aerosol containing chlorides and sulfates in the hall.
The samples and paintings on the mill casting were exposed in the hall for 1 year.
After this period, the samples were tested by employing impedance spectroscopy (to obtain coating resistance). Impedance tests were performed on the coating samples and paintings on the mill casting. The measuring cells (
Figure 2 and
Figure 3) were glued to the surface and filled with a 3% NaCl solution and after about 24 h immersion (to stabilize the condition of the coatings) impedance tests were performed.
Figure 6 shows a schematic view of the measuring cell glued to the coated surface. The transparent cell wall is used to check the electrolyte level in the measuring cell.
The coatings on the mill body were tested with the impedance method using a PalmSens4 mobile impedance meter (PalmSens BV, Houten, the Netherlands) in the frequency range from 1 MHz to 0.1 Hz, and the collected samples were tested in the laboratory using a system consisting of a transmittance analyzer Schlumberger 1255 (Solartron Instruments, Farnborough, UK) and Buffer Atlas 8991 (Atlas-Sollich, Gdansk, Poland) in the frequency range from 1 MHz to 0.1 Hz. In both cases, the voltage amplitude of the perturbation signal in the range of 20–60 mV was used. The exposed area was 12 cm2. During the measurements, in both cases, Faraday cages were used to eliminate external electromagnetic disturbances.
The barrier aspect of the system was examined—in this case, the value of the impedance modulus for frequency of 0.1 Hz.
All statistical calculations were conducted using the software PAST (version 3.24) [
25].
3. Results and Discussion
The samples rigidly attached to the mill body were compared with the samples suspended near the mill but without the presence of vibrations. In this way, it was assessed whether the vibrations of the mill during its operation affected the protective properties of the tested coatings.
Figure 7 shows examples of the impedance spectra of the selected coatings, and
Figure 8 summarizes the results for all the coating systems in the form of a log impedance modulus at a frequency of 0.1 Hz, log|Z|
@0.1Hz.
As can be seen from
Figure 8, most of the samples show much lower values in the presence of vibrations, and some of the samples have similar values (
Figure 9). This means that in the first case we observe the most likely destructive effect of vibrations causing the reduction of the barrier properties, and in the second case, the vibrations do not cause significant changes. Insofar as these values are within the range considered adequate for protection, such coatings can be considered suitable for painting components subject to vibration and aggressive environments.
Paintings made directly on the mill housing in various places were also examined using impedance spectroscopy.
Similarly, for each painting on the mill body, the impedance spectrum was measured and the logarithm of the impedance module was determined at a frequency of 0.1 Hz. The obtained data were compiled in the form of a matrix in such a way that each column refers to a different exposure site (A, B, C, D, E, F—directly on the mill housing, G—samples exposed in the hall without vibration, H—samples attached to the mill housing;
Figure 1), and each row contains information about the same coating system.
It was decided to use the data mining method to analyze the obtained data collected in the form of a matrix. Principal component analysis (PCA) is one of the most widely used techniques in multivariate analysis and is used to reduce the dimensionality of large data sets by transforming a large set of variables into a smaller one that contains most of the information included in the large set [
26,
27]. In the case under consideration, we have an eight-dimensional space of results, which, due to a large number of results, is difficult to analyze visually because human eyesight is adapted to analyzing two- or three-dimensional charts. On the other hand, we suppose that the obtained results are mutually correlated, as they refer to the same coatings. Moreover, in this situation, PCA helps by finding a two- or three-dimensional subspace, which, in the new coordinate system determined by the principal components, will contain a significant part of the information contained in the original set. Additionally, and advantageously, this method partially eliminated random errors by transferring them to the dimensions that are rejected. This type of approach is used in many research areas, including the science of corrosion and the research of protective coatings [
12,
13,
14,
28,
29]. More information about PCA can be found in the literature [
26,
27].
To “calibrate” the points in the new space, two virtual coatings with the most favorable and the least favorable parameters were added. They were constructed this way: the coating with the most favorable properties had parameters that are the set of the best results in a given column, while the worst coating had the lowest parameters in each column. In the new space, the geometric distance of a point representing a given coating and the virtual coatings will allow the evaluation of the tested coatings.
PCA was applied and eight principal components (PCs) were extracted. The percentages of the variances explained by each PC were 49.021%, 18.921%, 14.27%, 7.617%, 5.048%, 3.299%, 1.263%, and 0.560%, respectively.
Figure 10 shows the cumulative variance of the eight principal components. Clearly, the percentage of the first two PCs describe 67.942% and the first three as being 82.212% of the total information reflected by the eight parameters. If applying the Kaiser criterion (a single component should be greater than one [
30]), the first four components should be retained.
As a result of the PCA operation, we obtain the so-called score plot.
Figure 11 shows a score plot for the first two principal components, PC1 and PC2. Each point in the plane represents a coating system. The figure also shows virtual coating systems with the best (23) and worst (22) barrier properties.
The (Euclidean) distances between the points characterize the similarity between the samples. The smaller the distances, the more similar the compared samples are in terms of protective properties. By creating two virtual coatings with the best and worst protective parameters, it is possible to assess which of the tested coatings are closest to the best virtual coating and which are closest to the worst virtual coating.
The distances of each point representing the sample to the point (23) (
Figure 12a) were determined. In this way, a ranking of the tested coatings was created in terms of their protective properties (
Figure 12b).
As a result of the analysis, the best coating systems are:
Paint no. 18 (polyurethane);
Paint no. 5 (polyurethane);
Paint no. 19 (epoxy primer + polyurethane).
It is noticeable that, in principle, polyurethane products perform best when used to protect a ball mill in hall conditions. PCA extracts the orthogonal directions with the greatest variance. In contrast to the original features, the principal components will be uncorrelated. This suggests that the relevant principal components represent independent exposures. To test this assumption, it is possible to check which component is responsible for the vibration.
To identify the impact of vibrations on the protective properties of the coatings, loadings were analyzed to find those in which the vibrated and non-vibrated samples would differ in opposite directions (
Figure 13). We find this for PC4. Hence, it can be estimated that under the tested conditions, the contribution of vibrations to the degradation of coatings can be estimated to be at 8% (
Figure 10). Earlier loadings most likely relate to the parameters of the chemical composition and the physical parameters of the environment (probably PC1 and PC2), and the abrasive effect of the copper ore on the coating (probably PC3).
4. Conclusions
This study proposes a method of selecting coating systems with the best protective properties for specific and unusual industrial conditions with high aggressiveness using a multivariate approach and electrochemical impedance spectroscopy.
Characteristic features of the presented approach are that quantitative data from many points of natural exposure are analyzed based on micro symptoms of coating degradation, which allows for a faster evaluation. The score plot obtained from the proposed principal component analysis (PCA) procedure indicates the rankings of the tested coatings visually and quantitatively and shows that the principal components (PCs) are representative of the specified exposure types.
The 21 tested two-layer coating systems from different manufacturers were ranked according to their protective properties in specific industrial conditions. Among the tested samples, the best protective properties were shown by coating systems marked as 18 (polyurethane system), 5 (polyurethane system), and 19 (epoxy primer + polyurethane top layer). The analysis of the loadings determined by the PCA allows us to estimate the contribution of the identified destructive factors to the degradation of the coating systems.
While this study focused on an industrial ball mill in the copper ore enrichment department, the same concepts could be adapted and applied to other conditions and industrial facilities.


