Article

Effect of Particle Trap on Motion Characteristics of Metal Particles in AC GILs and Parameter Optimization

State Key Laboratory of Alternate Electrical Power System with Renewable Energy Sources, North China Electric Power University, Changping, Beijing 102206, China
*
Author to whom correspondence should be addressed.
Coatings 2022, 12(7), 981; https://doi.org/10.3390/coatings12070981
Submission received: 25 May 2022 / Revised: 19 June 2022 / Accepted: 7 July 2022 / Published: 11 July 2022
(This article belongs to the Special Issue Advances in Dielectric Coatings)

Abstract

:
Metal particle contamination is an important reason for insulation failure of gas-insulated transmission lines (GILs). Particle trap is the common method for particle suppression. At present, research on the motion characteristics of metal particles near a particle trap and the optimization of trap parameters under AC voltage is insufficient. Based on that, firstly, a dynamic model of metal particles under AC voltage was established, and the motion characteristics of particles in front of the trap were studied, combined with experiments. Then, the influence of trap parameters on the capture effect was analyzed, and the optimization of the trap was realized by simulation. The results showed that, under AC voltage, the randomness of metal particle movement was strong, and the activity was low. The particles mainly moved away from the trap. Among the particles moving towards the trap, some stayed in front of the trap, and some fell into the trap from above. The thickness and height of the trap were the key parameters affecting the capture effect, and with the increase in height and thickness, the capture rate showed a trend of increasing first and then decreasing. The above conclusions can provide a reference for the optimization of a metal particle trap under AC voltage in engineering.

1. Introduction

Gas-insulated transmission lines (GITLs or GILs) are a kind of high-voltage and high-current-power transmission equipment with gas insulation and a coaxial chamber [1]. Compared with electric cables, GILs have significant advantages, such as large transmission capacity, small heat and electric energy loss, no environmental impact, high operation reliability, land saving, and long service life. Therefore, they have been widely used in harsh natural environments and cross-terrain power transmission [2,3]. According to statistics, the rate of insulation faults can reach up to 73.3% in GIL faults, of which 38% are caused by metal particle contamination [4,5]. In addition, as the greatest potential alternative gas to SF6, in C4F7N/CO2, metal particles have a more serious impact on the insulation performance [6,7]. Therefore, the suppression of metal particles in GILs is very important for their safety and stable operation.
A large number of scholars have carried out research on metal particle contamination. GILs inevitably produce metal particles in the process of production, transportation, assembly, and operation due to machine cutting, friction, and vibration during operation [8,9,10]. Li pointed out that the movement of particles in the air gap leads to the enhancement of the local electric field, which leads to the phenomenon of partial discharge and affects the gas insulation system [11]. Therefore, in order to better suppress metal particles, scholars have carried out research on the motion characteristics of metal particles in recent years. Under direct current (DC) voltage, the direction of the electric field is constant, and the activity of metal particle movement is strong. Usually, when the particles are lifted, they can penetrate the gap [12]. In the early stage, under a plate electrode, Sun et al. studied the collision characteristics between particles and electrodes and established a motion model of metal particles between plate electrodes. The results showed that the larger the size of the metal particles and the smaller the recovery coefficient, the lower the collision frequency between metal particles and electrodes [13]. In order to simulate the influence of insulators on an electric field in the vicinity, researchers used a wedge-shaped plate electrode to study the motion characteristics of metal particles. The results showed that metal particles under the wedge-shaped electrode moved towards the side with the strong electric field, which meant that the metal particles on the acute angle side of the insulator moved towards the insulator [14]. For alternating current voltage (AC), researchers believe that the particle movement is different from that under DC voltage and that, generally, there is no penetrating movement after the first lifting [15]. As for the suppression of metal particles, the main methods include particle traps, electrode surface coatings, and embedded electrodes [16]. Particle traps are the most widely used in engineering at present. Grid and strip traps have been studied by the majority of researchers, and built-in detachable particle traps have been widely used because they do not need to change the structure of a GIL, so they are easy to realize [17]. J.G. Trump put forward two layout modes, full-type and lifting-type, and pointed out that grid traps had a better particle capture effect than hole traps [18,19]. Recently, research has mainly focused on the optimization of particle trap parameters to improve the capture effect. Wang et al. studied the influence of the slot width and thickness ratio on the capture effect through an electric field analysis and tests. The results showed that, when the ratio was equal to 0.8, the capture effect was the best [20]. Lv et al. studied the capture mechanism of a particle trap and established an optimization model of particle trap parameters in DC GILs. The results showed that the electric field strength at the bottom of the trap was affected by the slot width and thickness. In addition, with the increase in thickness, the axial electric field at the front of the trap increased, which was conducive to the capture of metal particles [21].
To sum up, at present, the research on metal particle contamination is mainly focused on DC voltage, while research on the motion characteristics of particles in front of traps under AC voltage is scarce. In addition, the parameters of particle traps have been optimized mainly through tests. Due to the high cost and time-consuming nature of tests, it is impossible to comprehensively consider multiple parameters. Therefore, it is necessary to study the parameter optimization method of particle traps based on simulation. Based on the above analysis, firstly, the motion characteristics of metal particles in front of a trap under AC voltage are studied. A dynamic model of particle motion is established, the effects of the initial phase and the randomness of collision on particle motion characteristics are analyzed, and movement tests are carried out. Further, aiming at the trap capture rate, an optimization model of AC trap parameters is established, optimal trap parameters are obtained, and the feasibility of the optimization is verified by tests.

2. Materials and Methods: Motion Characteristics of Metal Particles in Front of Trap
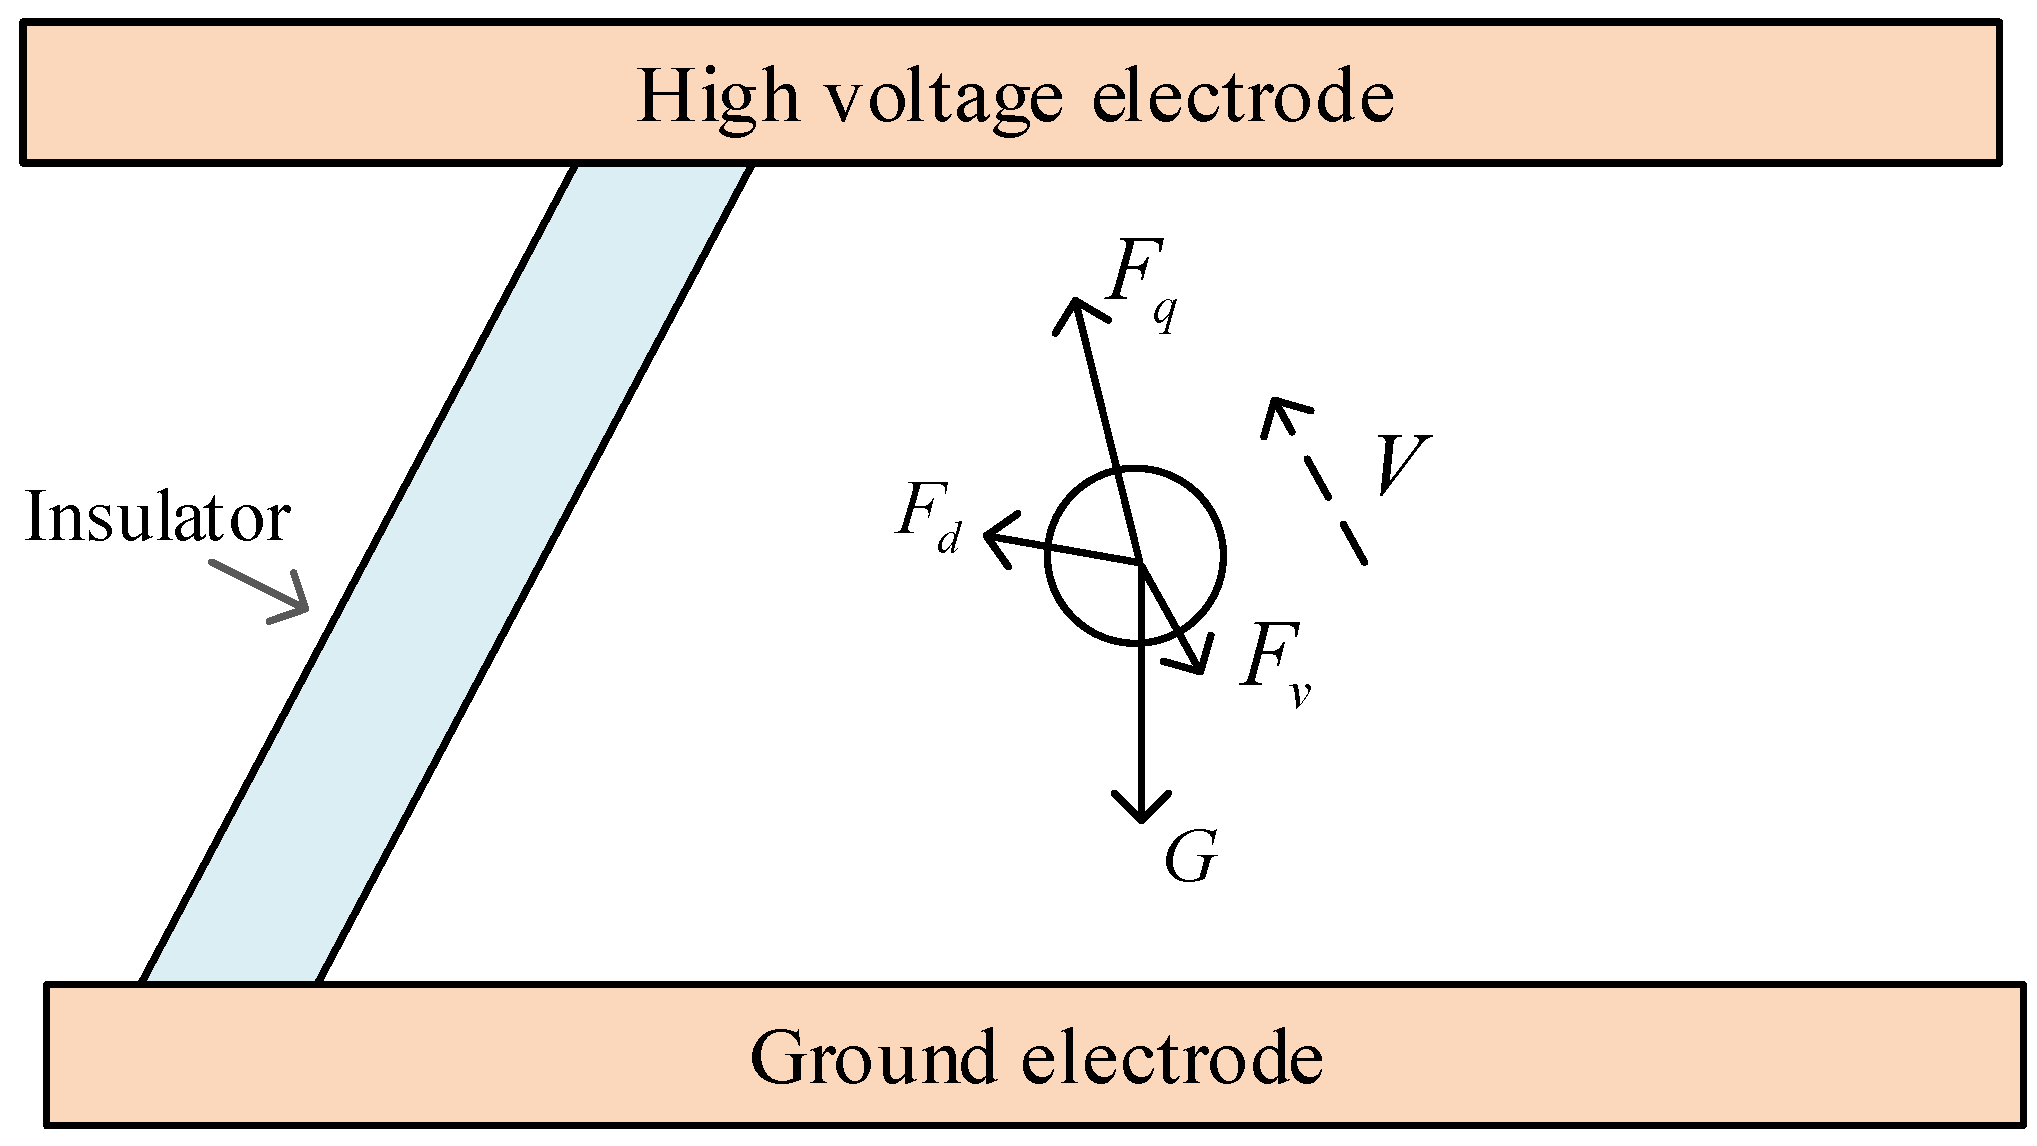
2.1. Motion Model

In order to study the motion characteristics of particles in front of the trap, this section takes a single metal particle as the research object and obtains the motion trajectory of the particle by establishing the motion model. The metal particle was simplified as a sphere, and the main charging directions in the GIL were charged by contact with the electrode and partial discharge at the particle tip [22]. When the metal particles were in contact with the ground electrode, it was mainly charged by conducting. Therefore, the amount of charge carried by a spherical metal particle was as follows [23]:
q b = 2 3 π 3 ε 0 ε 1 r 2 E ,
where ε0 and ε1 are the dielectric constant and the relative dielectric constant in vacuum equal to 8.854 × 10⁻¹² F/m and 1 F/m, respectively, and r is the radius of the metal particle. E is the electric field strength at the location of the particle. As shown in Figure 1, since the structure of a GIL is symmetrical around the xz plane, theoretically, the value of forces on the y-axis are equal to 0, which can be ignored. The forces of the particle are shown in Figure 2, and the equations are shown in Table 1.
When kr is the electrostatic correction coefficient, it is equal to 0.832 when the particles are in contact with electrodes; otherwise it is equal to 1 [24]. q is the charge of the particle, which is calculated with Equation (1). Re is the Reynolds coefficient, and it is given by the following:
Re = 2 ρ g a s v r μ g a s ,
where μ g a s is the gas viscosity coefficient, which equals 1.377 × 10⁻⁵ Pa·s, and v is the relative velocity between the particles and the gas flow. Since the gas velocity is far less than the particle motion velocity, the gas velocity can be ignored, that is, v is the particle motion velocity [25]. r and rgas are the density of the metal particle and gas, respectively, and g is the acceleration of gravity, with a value of 9.8 m/s2. The motion equation of the particle is given by the following:
{ m d 2 X x d t 2 = F x m d 2 X z d t 2 = F z ,
where m is the mass of the particle, and Fx and Fz are the sum of the forces on the x and z axes, respectively. In the process of particle movement, when a metal particle collides with the electrodes, the velocity change caused by the collision is given by the following:
{ v 2 n = h n v 1 n v 2 t = h t v 1 t ,
where v1n and v2n are the normal velocities before and after the collision, respectively; v1t and v2t are the tangential velocities before and after the collision, respectively; and hn and ht are the recovery coefficients of normal and tangential velocities, respectively. In this paper, they were equal to 0.57 and 0.8, respectively [14]. Due to the roughness of electrodes, the randomness of collision was considered. Based on Equation (4), the random angle was defined to reflect the random change in velocity. The velocity of particles after collision with electrodes is given by the following:
{ v r n = v 2 n cos ( a n g l e ) v r t = v 2 t sin ( a n g l e ) ,
where vrn and vrt are the normal velocity and tangential velocity after collision, respectively. The angle is the random angle, which is generated by a random number. As shown in Figure 3, its maximum value was β.

2.2. Simulation Analysis of Motion Characteristics

Combined with the motion model in Section 2.1, the simulation flow in this paper is shown in Figure 4. When the particle entered the trap area on the x-axis, it was considered that the particle was captured. In the simulation, the particle radius was 0.25 mm, and the starting position of the particle motion was 2 cm in front of the trap. The structural parameters of the GIL are shown in Table 2. The simulation step was 0.002 s, and the simulation time was 2 s. The effective value of the voltage was 40 kV.
When the initial phase of the voltage was 0 and the random rebound during collision with the electrodes was not considered, the simulation results are shown in Figure 5. It can be seen that, when the metal particle was lifted, it showed an up–downward fluctuating trend. Under the combined action of electric field force and other forces, the particles moved closer to the trap, and the lifting height decreased gradually with the decrease in the distance from the trap. Figure 6 shows the electric field distribution near the particle trap. It can be seen that there was a low-electric-field area in front of the trap due to the influence of the particle trap. Therefore, when the particles approached the trap, the lifting height was reduced. In addition, the maximum lifting height under AC voltage was low. It can be seen from Figure 5 that, in the model studied in this paper, the maximum lifting height was about 15 mm, there was no penetrating movement of the gap, and the movement direction reversed during lifting, which was caused by the alternating of the voltage.
Under AC voltage, the initial phase was different, and the force of particle motion was different, which further led to the change in particle trajectory. Therefore, based on the simulation with the initial phase of 0°, the other parameters remained unchanged, and the particle motion simulations were carried out after the initial phase was increased by 10° step-by-step. The simulation results showed that the particle trajectory had randomness due to different initial phases, and the typical trajectories are shown in Figure 7. When the initial phase was 20°, the particle moved towards the trap, and after entering the low-field-strength area, it began to move away from the trap and finally stopped at 1 mm away from the trap. When the initial phase was 40°, the particle motion approximately presented periodic oscillation, and a similar phenomenon occurred when the initial phase was 120°. When the initial phase was 160°, the particle moved towards the trap and entered the low-field-strength area near the trap, so the lifting height was significantly reduced (lower than the trap height). According to the movement trend of the particle, it finally entered the capture area from the bottom of the trap. When the initial phase was 180°, the particle motion trajectory was the same as that when the initial phase was 0°, which was caused by the periodicity of AC voltage. Meanwhile, it meant that the positive and negative polarities had no effect on the particle motion.
When the initial phase was 0°, the influence of the angle on particle motion characteristics was explored. β was set to 10°. The number of simulations was 50. The typical motion trajectories are shown in Figure 8. In Figure 8a, the particle moved to the low-field-strength area in front of the trap and entered the capture area from the bottom of the trap. In Figure 8b, the particle fell from the top of the trap to the bottom and was captured. As shown in Figure 8c,d, when the particle moved close to the trap, the movement direction of the particle changed due to the change in the electric field. Then, it moved away from the trap. This kind of movement accounted for the vast majority of particles.
Seen through the above analysis compared with the movement of metal particles under DC voltage, the particle trap under AC voltage could also inhibit the movement of particles and protect insulators, but the ability to capture metal particles was relatively poor.

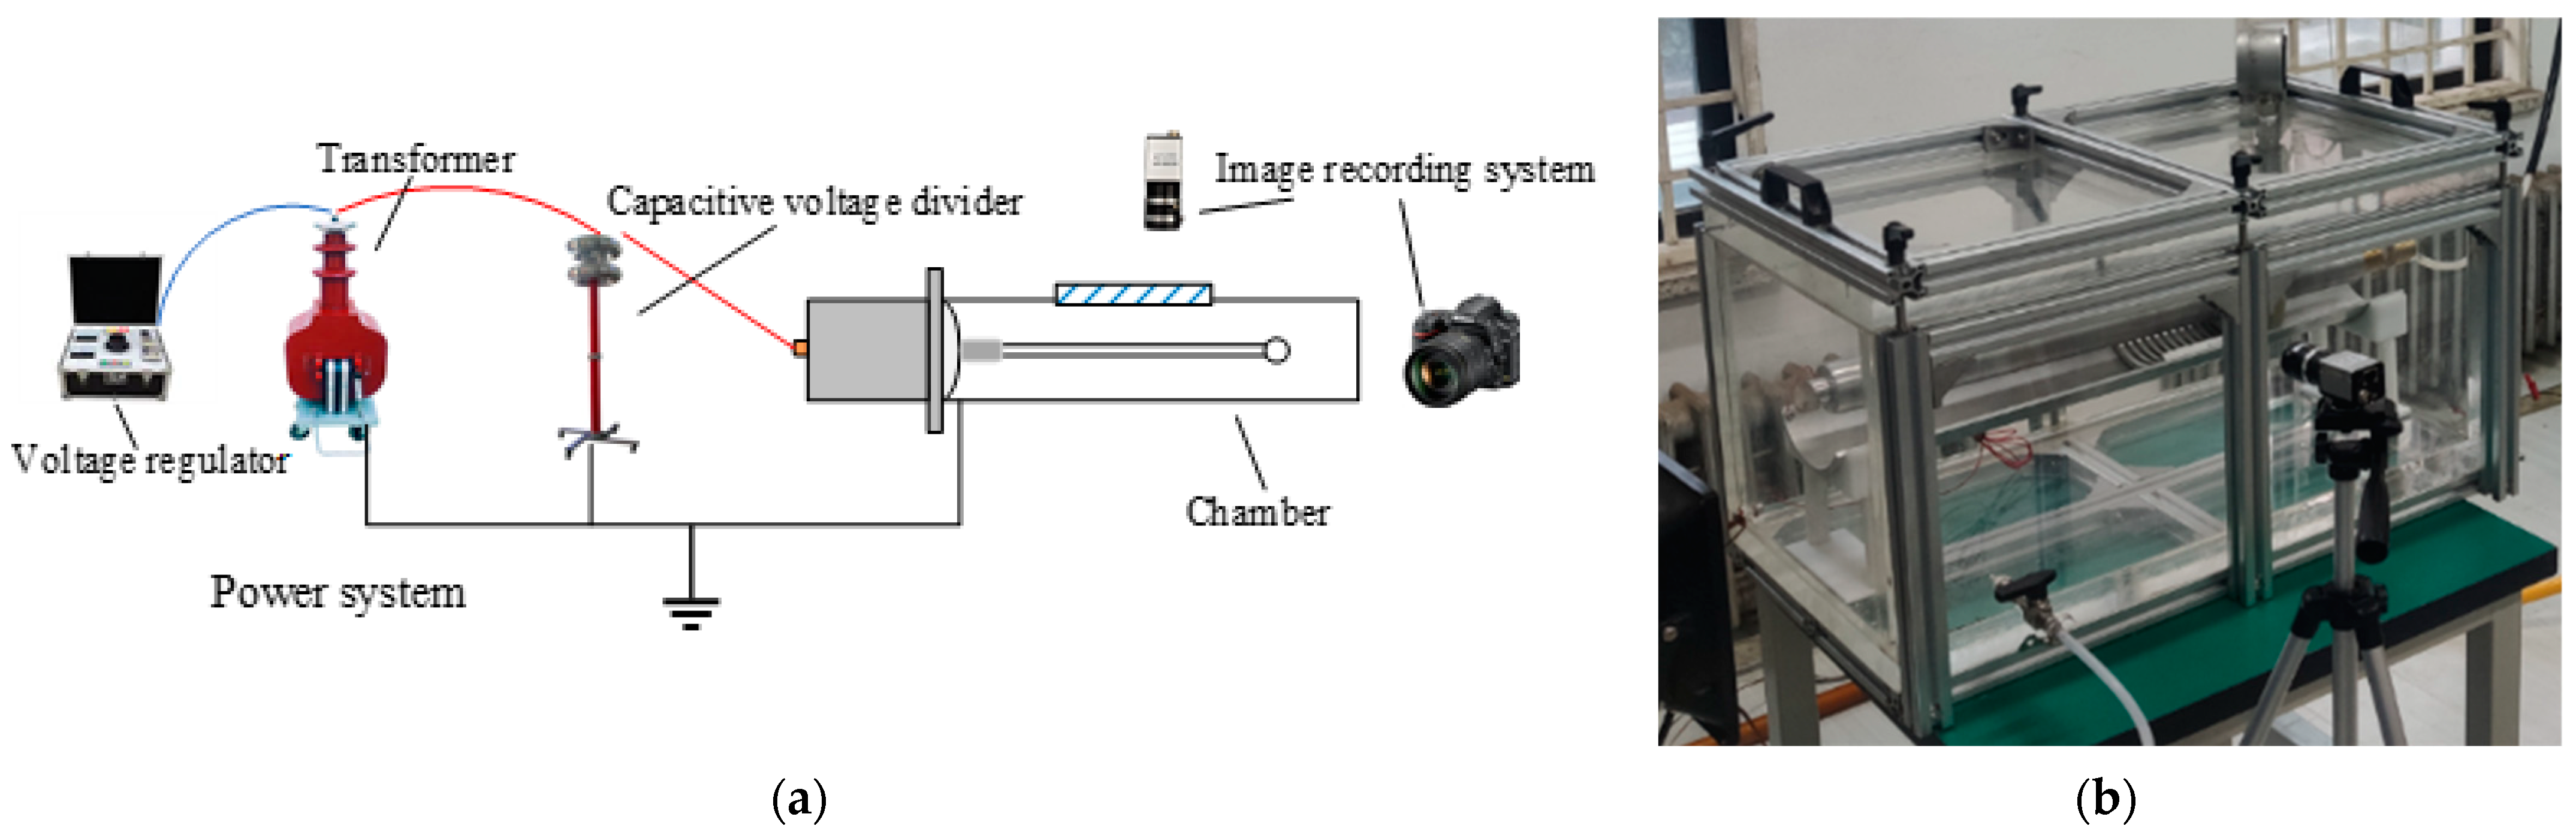
2.3. Tests of Motion Characteristics

As shown in Figure 9, a test platform consistent with the parameters of the simulation model was built. The power system was composed of an AC test transformer (NRIGTB-5/50, Zhongjie, Yangzhou, China) and a capacitor voltage divider (NRIRCF-50 kV, Zhongjie, Yangzhou, China). On the side of the test chamber, the trajectory of the metal particle was captured with a high-speed industrial camera (WP-GE230 model, Huagudongli, Shenzhen, China). At the same time, the movement of the metal particle was photographed with a camera (SONY HDR-CX405, Sony, Shanghai, China) on the front of the chamber.
During the test, an aluminum particle with a radius of 0.25 mm was placed 2 cm away from the particle trap. The voltage increased gradually. When the particle was lifted, the lifting voltage was recorded, and the voltage was kept for 1 min. Then, we recorded the movement of the particle. In the tests, the lifting voltage of the particle was about 45.3 kV. The motion trajectory of the particle could be obtained by superimposing the motion trajectory captured with the industrial camera through placing the pictures over the same picture. The test results are shown in Figure 10. Four motion trajectories were drawn in this paper. In the blue trajectory, the metal particle collided with the ground electrode twice and then fell from the top to the bottom of the trap. In the other three trajectories, the metal particles finally escaped from the trap. In the red trajectory, the metal particle always moved away from the trap, while in the yellow and green trajectories, the ‘turn around’ behavior of the metal particle in the air gap could be clearly observed. The above movement phenomena were consistent with the results of the simulation.

3. Parameter Optimization of Particle Trap

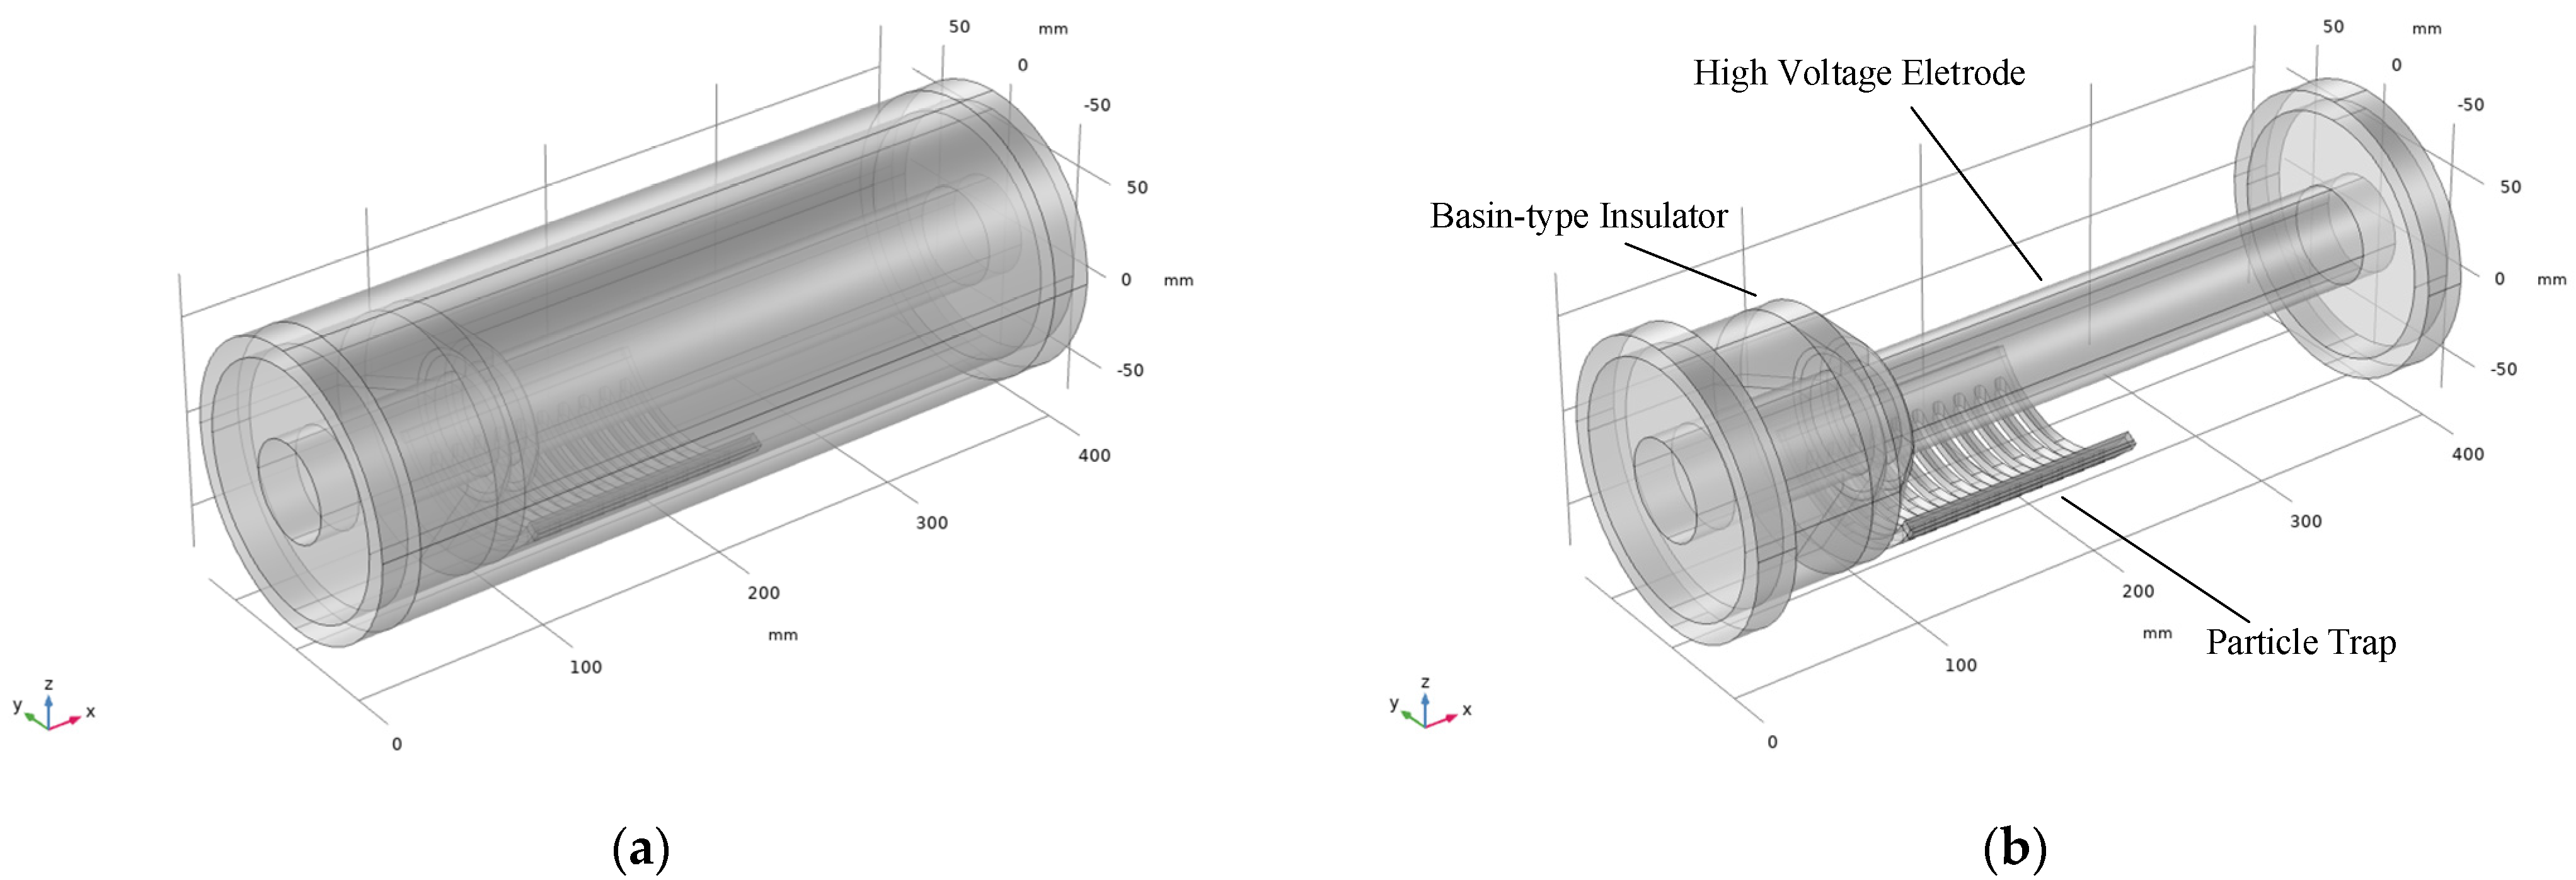
3.1. Simulation Model of Trap Optimization

In order to optimize the capture effect of a metal particle trap under AC, the capture rate of the trap was defined as the proportion of the captured particle mass to the total mass. In this section, the capture rate is used as the objective function to establish a simulation model of trap parameter optimization. According to the above simulation results, it can be seen that, under AC voltage, the activity of particle motion was low, but the randomness of motion was high. The slot width and distance of the trap had little influence on the electric field [21], that is, they had little influence on the motion of particles in front of the trap. Therefore, this paper mainly studied the influence of the trap thickness and height on the motion characteristics of particles in front of it and the trapping effect.
On the basis of the simulation model in Section 2.2, the initial phases of the voltage were set as 0°, 45°, 90°, and 135°. At 2~12 cm ahead of the trap, 1000 particles (radius of 50 μm each) were evenly placed. Considering the randomness of the ground electrode collision, the particle-to-particle collision, and the particle-to-ground electrode collision (β = 10°), the multiparticle motion was simulated. For a single particle, the sign of the end of the simulation was set as: (1) entering the bottom of the trap from the front, (2) entering the capture area of the trap from the top, or (3) moving away from the trap. Finally, the end of the particle was classified for statistics, and the capture rate of the trap was obtained. According to the above analysis, the simulation flow chart is shown in Figure 11.
In this paper, the value range of the trap height was 1–5 mm, and the value range of the trap thickness was 1~10 mm. Traps with different parameters were simulated, and the influence of thickness and height on the capture rate was obtained, as shown in Figure 12. It can be seen that the influence of thickness and height on the capture rate increased first and then decreased. When the trap thickness increased, the shielding effect of the trap on the front region was stronger, so the probability of the particle falling into the front low-electric-field region and being captured increased [21]. At the same time, due to the low lifting height of the particle under AC voltage, the larger the thickness, the greater the probability of collision between the particle and the trap, so it was not conducive to the capture of the particle. When the height of the trap increased, the probability of particles entering the trap capture area from the bottom of the trap increased, but the shielding effect of the trap in the front area was weakened, which was not conducive to the capture of particles. In summary, with the increase in trap height and thickness, the trap capture rate first increased and then decrease. The influence of trap height and thickness on the capture rate was complementary. It was concluded that the capture rate was the highest when the thickness was 6 mm and the height was 4 mm, which reached about 50.8%, better than existing research results [26].

3.2. Experimental Verification of Trap Optimization

In order to compare the trapping effects of different particle traps, 50 mesh aluminum powder with lower lifting voltage was selected as the research object [26]. On the test platform shown in Figure 9, the capture rates of different particle traps were obtained through experiments to verify the simulation results. The parameters of the test traps are shown in Table 3.
Before the tests, SF6 was filled in the cavity, and 0.2 g aluminum powder was evenly dispersed at 2~5 cm in the front of the particle trap. The movement of particles was observed with a camera. During the test, when the particles were lifted up, the voltage was kept, and we continued to apply the voltage for 1 min. After the test, the distribution of the particles was photographed. Starting from the front of the trap, the captured particles inside and outside the trap were weighed every 5 mm to obtain a mass distribution diagram of the captured particles.
Figure 13 is the distribution of the metal particles after the test. It can be seen from the diagram that the metal particles were mainly distributed in two regions after the applied voltage, and there was an obvious boundary. Most of the trapped particles were located in the low-electric-field area ahead of the trap, while other particles fell into the trap from the top of the trap.
The mass distribution of the particles is shown in Figure 14. The capture rates of the four kinds of particle traps were 0.36, 0.51, 0.49, and 0.45, respectively. It can be seen that the capture rate of Trap 2 was the highest, which was consistent with the simulation conclusion. Therefore, the optimal particle trap parameters were a thickness of 6 and a height of 4, giving a high capture rate, which could play a certain protective role.

4. Conclusions

In this paper, a motion model of particles under AC voltage was established, and the motion characteristics of particles in front of the trap were studied. Then, the effects of different initial voltage phases and the internal roughness of a GIL chamber on particle motion were analyzed. Finally, the influence of trap parameters on the capture rate of the particle trap was studied by simulation, and the optimization of the particle trap was realized. The feasibility of the optimization scheme was verified through comparison experiments. The main conclusions included:
-
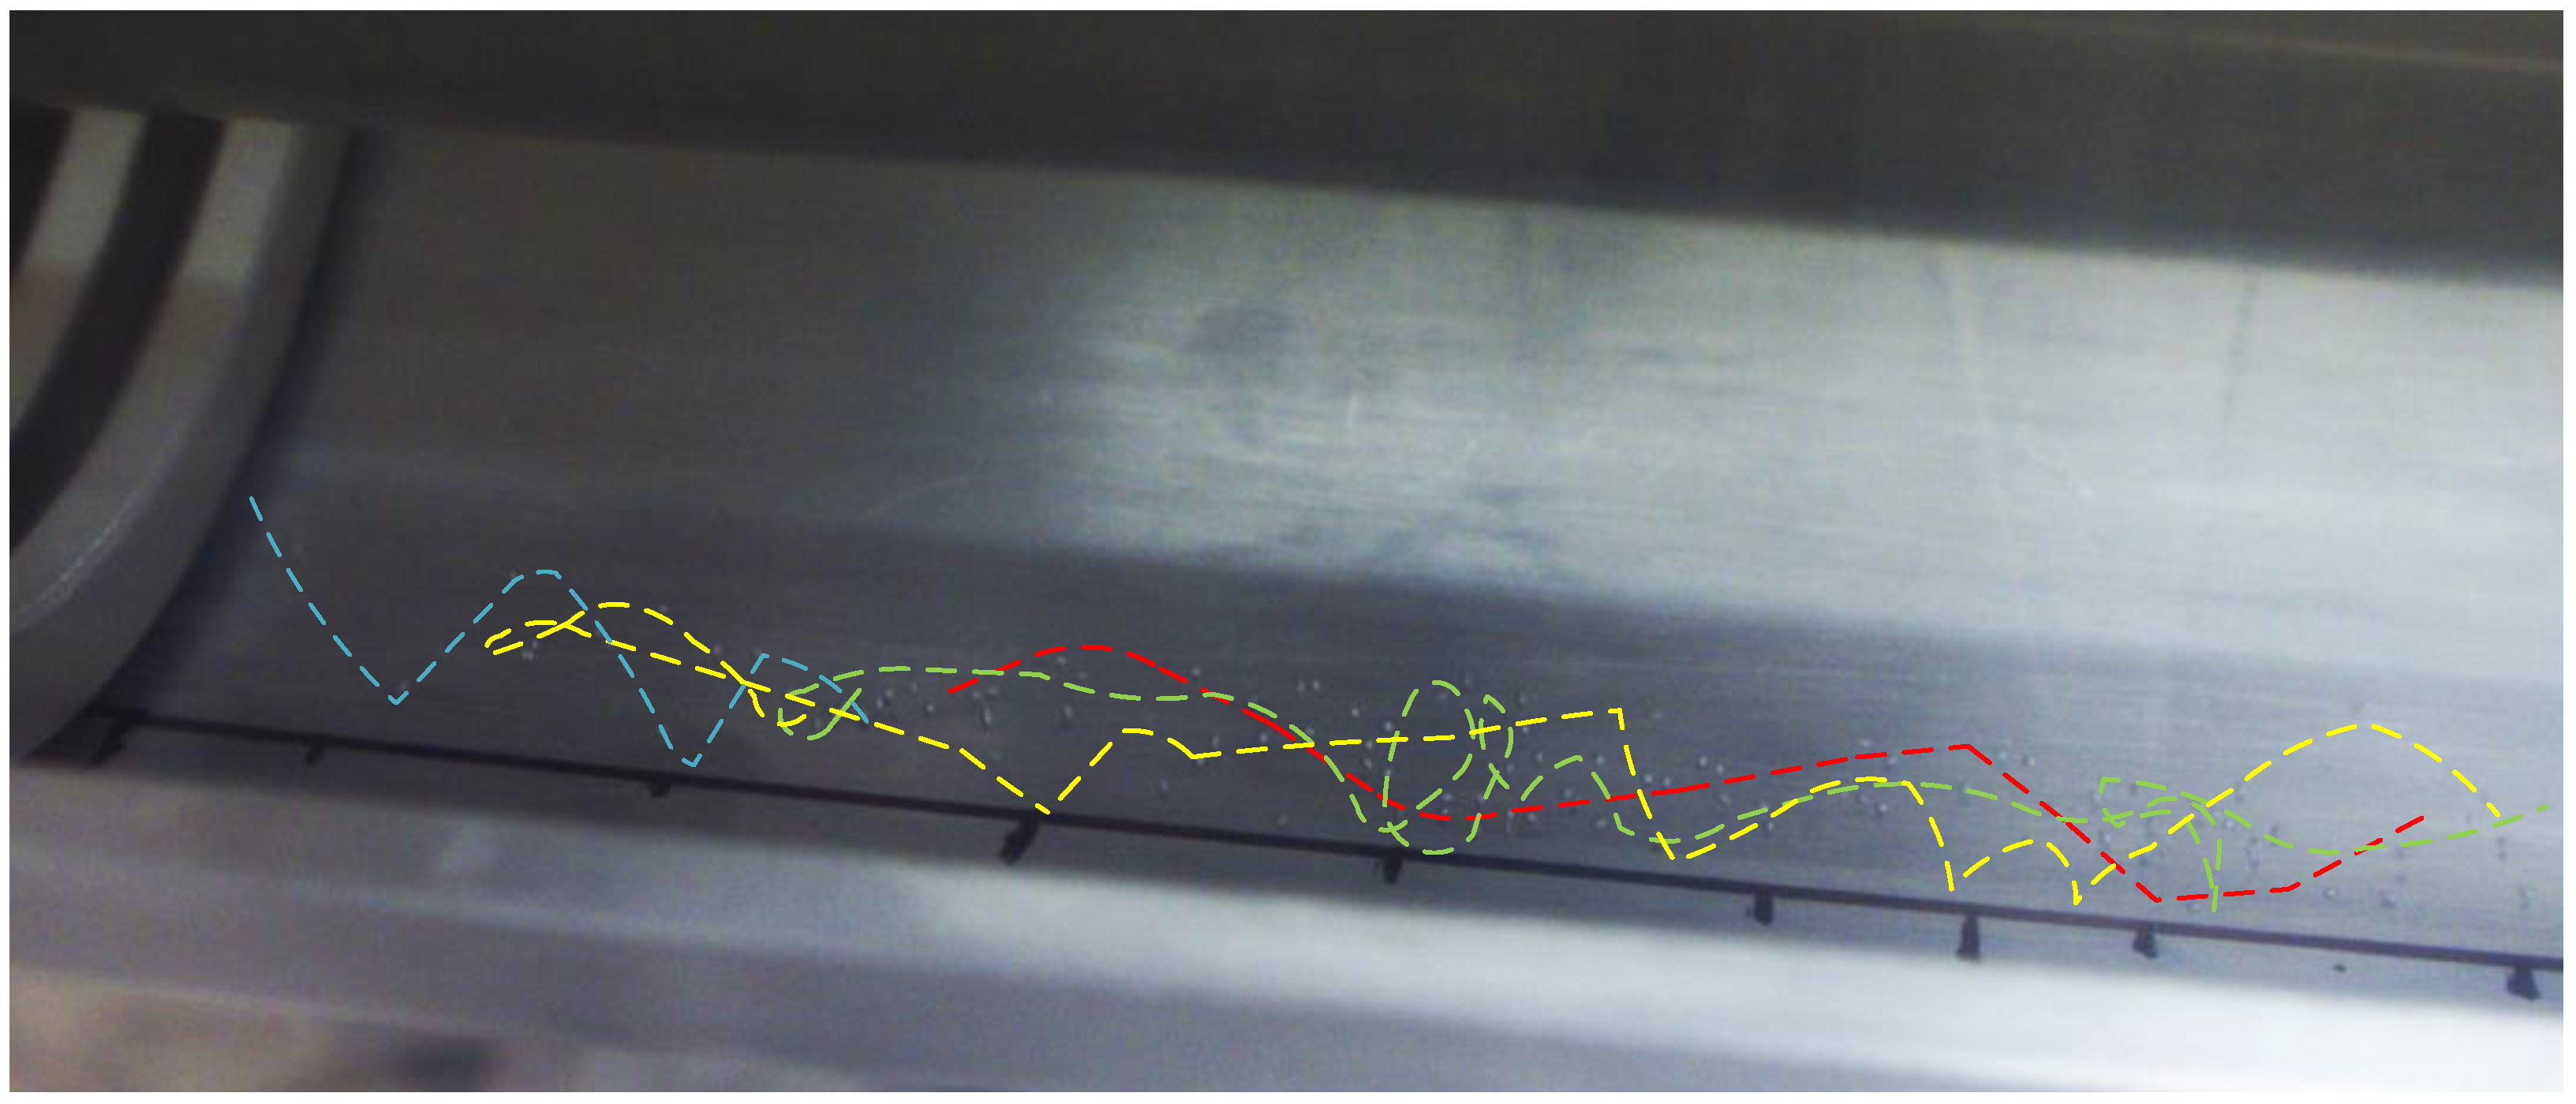
Under AC voltage, the motion activity of metal particles was low and, when affected by alternating current voltage and collision randomness, the motion randomness of metal particles was strong.
-
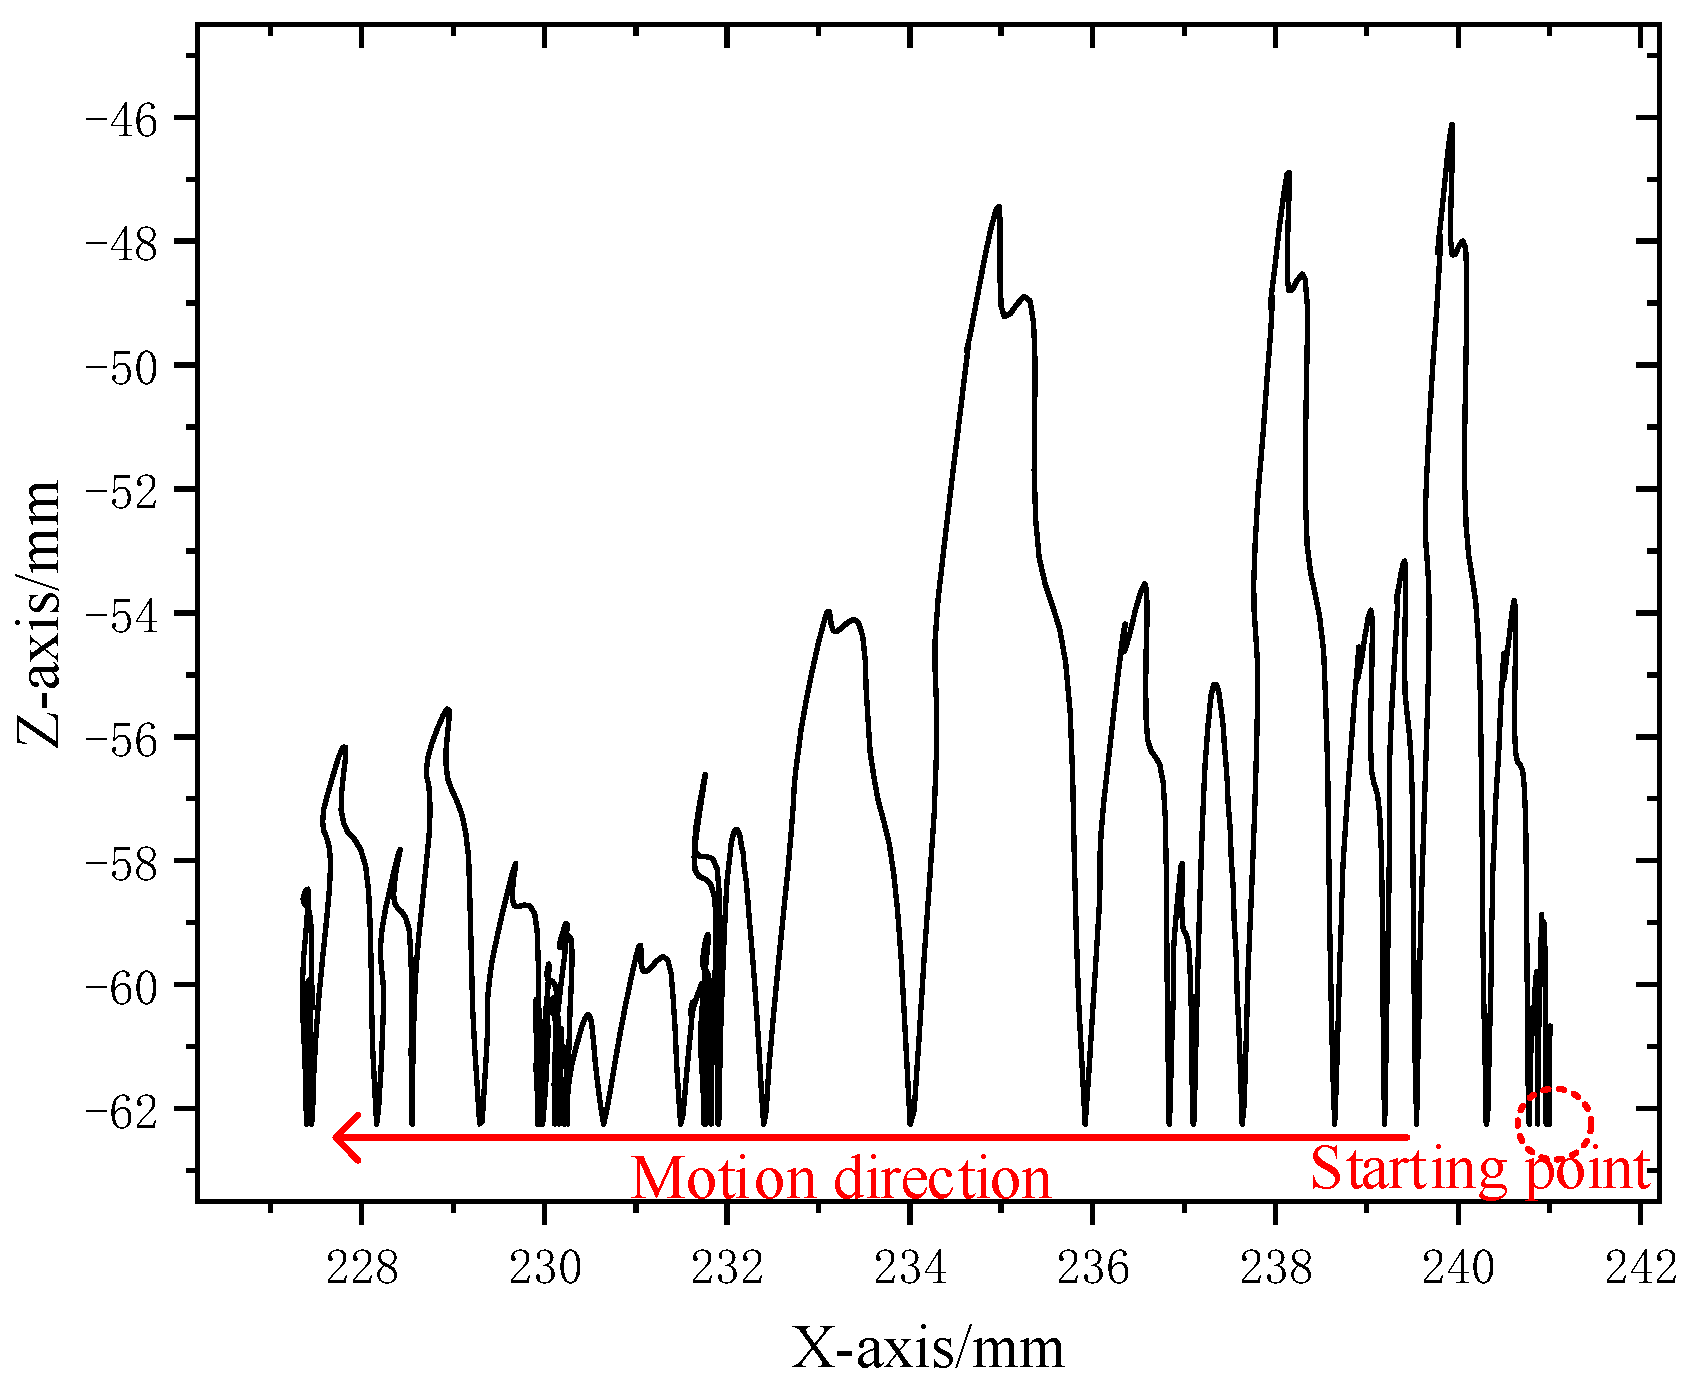
The metal particles located in front of the trap were mainly far away from the trap in a fluctuating up–down movement trend. In other particles moving towards the trap, some particles were affected by the low-electric-field area in front of the trap and stayed in front of the trap, while some particles fell from the top of the trap into the trap and were captured by the particle trap.
-
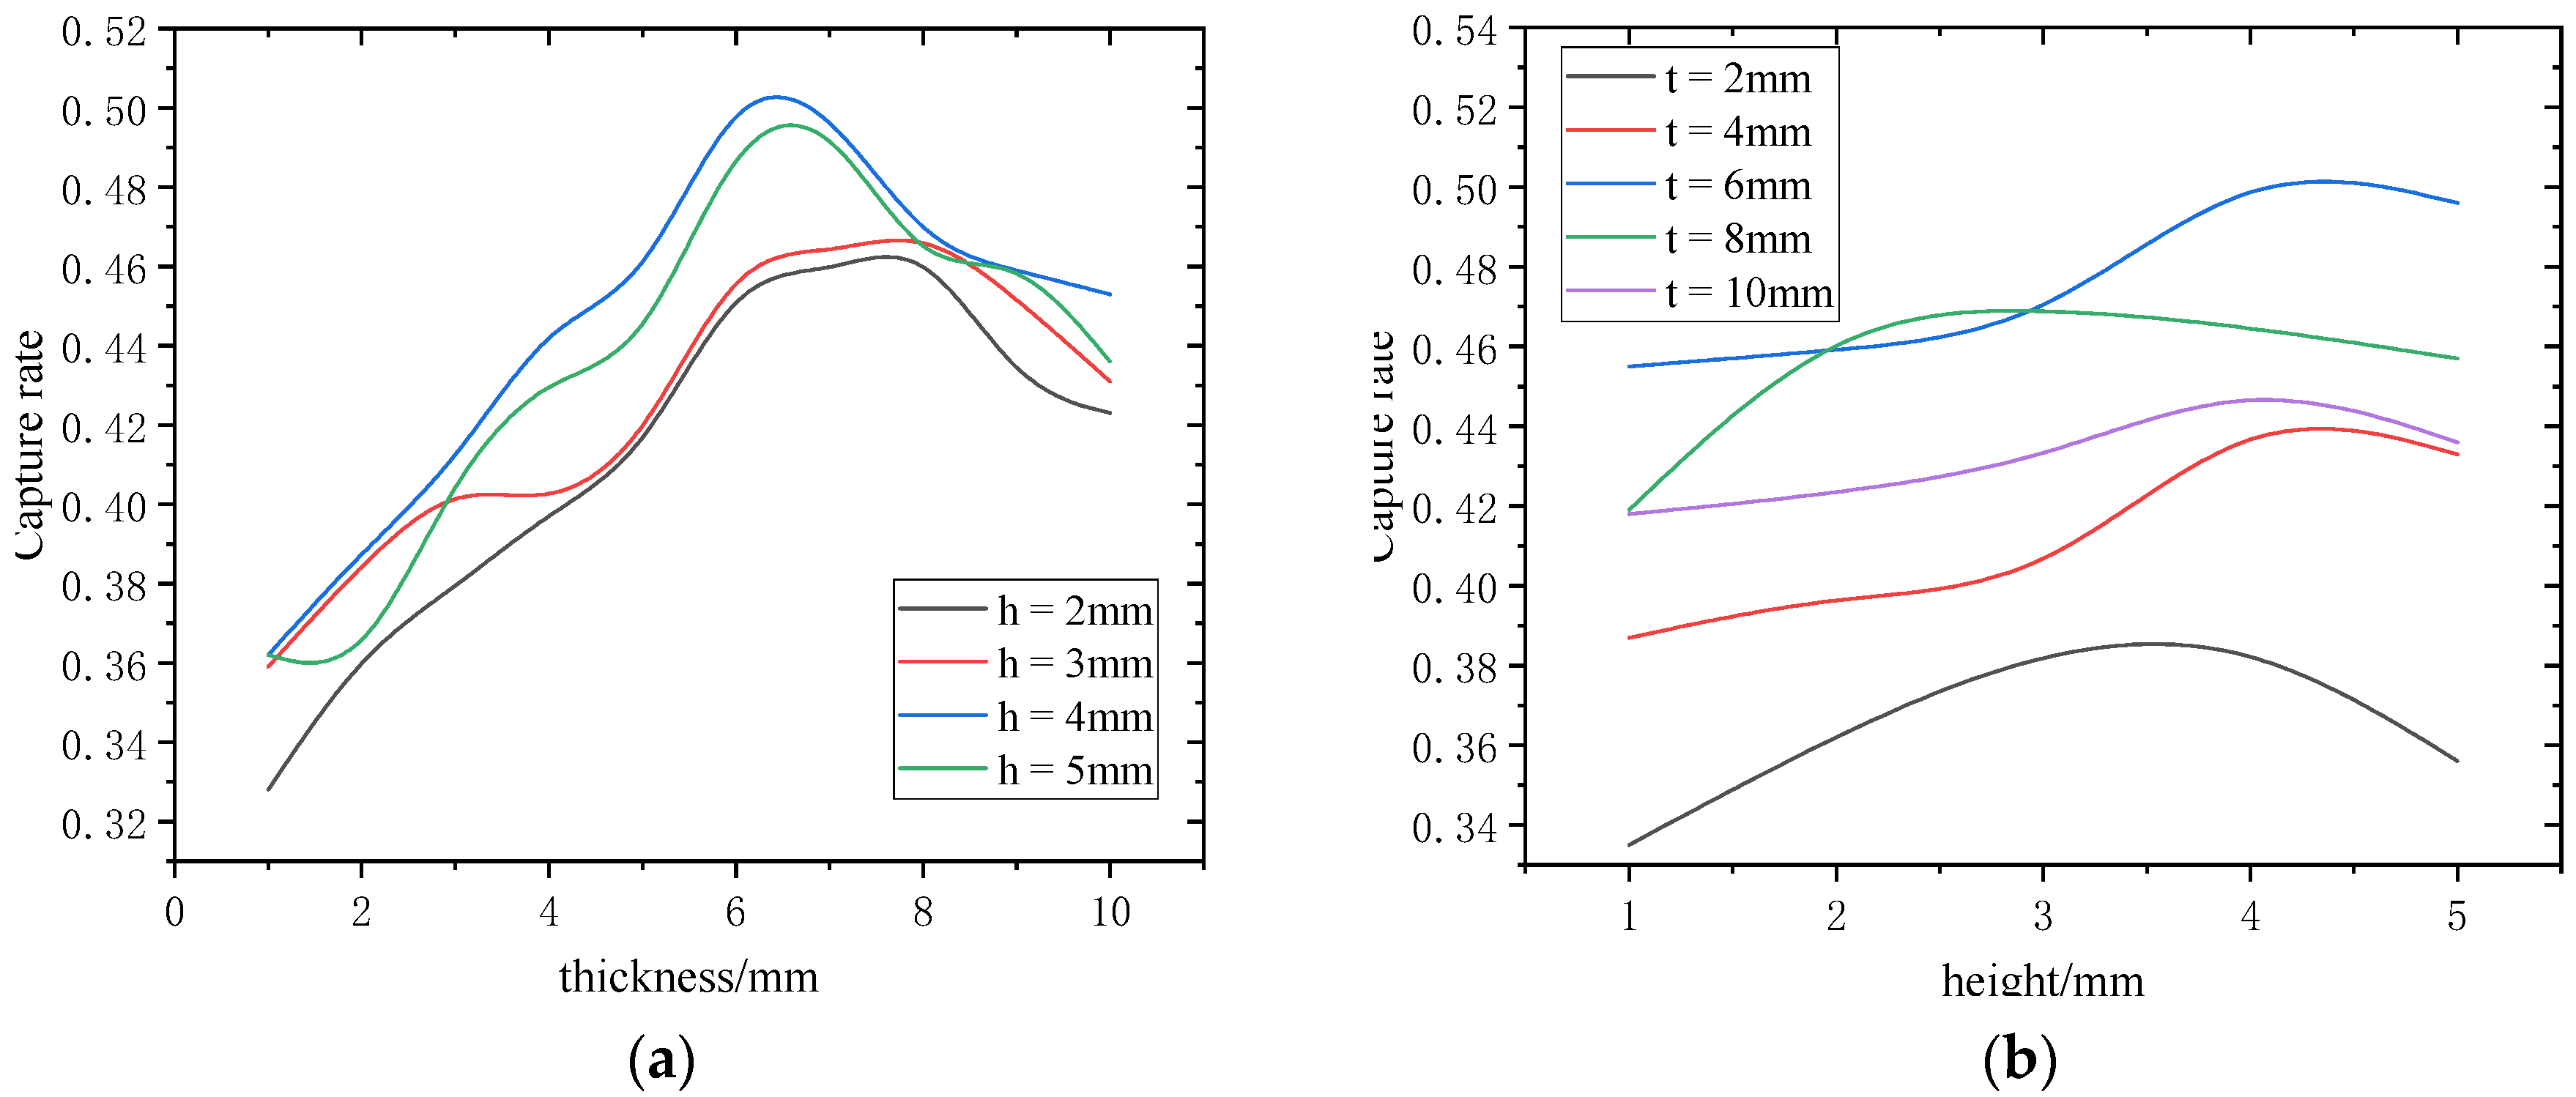
The effect of trap thickness and height on the capture rate showed a trend of first increasing and then decreasing. Within the scope of this study, the maximum capture rate could reach about 50.8% when the trap thickness was 6 mm and the trap height was 4 mm.

Author Contributions

S.W. designed the research, wrote and revised the manuscript, and conducted data analysis and details of the work. H.L. and K.M. designed the research experiment. Q.O. and H.G. collected the data and conducted the analysis. F.L. designed the research experiment and guided the direction of the work. All authors have read and agreed to the published version of the manuscript.

Funding

This research was funded by the Key R & D project of Hebei Province under grant number 19212109D.

Institutional Review Board Statement

Not applicable.

Informed Consent Statement

Not applicable.

Data Availability Statement

Not applicable.

Conflicts of Interest

The authors declare no conflict of interest.

References

  1. Xiao, D.; Yan, J. Application and Development of Gas Insulated Transmission Line (GIL). High Volt. Eng. 2017, 43, 699–707. [Google Scholar] [CrossRef]
  2. Koch, H. Gas-Insulated Transmission Line (GIL); John Wiley & Sons: Hoboken, NJ, USA, 2011; pp. 1–5. [Google Scholar]
  3. Li, P.; Yan, X.; Wang, H.; Zhang, Q.; Jin, G.; Gao, Y. Research and Application of UHVAC Gas-Insulated Transmission Line. Power Syst. Technol. 2017, 41, 3161–6167. [Google Scholar] [CrossRef]
  4. Du, B.; Du, Q.; Li, J.; Li, A.; Fu, M.; Xiao, W. Surface Charge Dynamic Behaviors of Epoxy/BN Composite with High Thermal Conductivity for Gas Insulated Transmission Pipeline. High Volt. Eng. 2018, 44, 2646–2653. [Google Scholar] [CrossRef]
  5. Ran, Z.; Du, B.; Li, J.; Li, Z.; Fu, M.; Luo, B. Research Status of Fluorination Modification of Epoxy Resin Insulators in Transmission Pipelines. Guangdong Electr. Power 2018, 31, 18–26. [Google Scholar]
  6. Gao, K.; Yan, X.; Wang, H.; He, J.; Li, Z.; Bai, C.; Liu, Y.; Huang, H. Progress in Environment-friendly Gas-insulated Transmission Line (GIL). High Volt. Eng. 2018, 44, 3105–3113. [Google Scholar] [CrossRef]
  7. Wang, L.; Zhou, W.; Zhang, T.; Liu, W.; Hu, S.; Yu, J. Power Frequency Insulation Performance of C4F7N/CO2 Mixture Under Uniform and Extremely Non-uniform Electric Field. High Volt. Eng. 2019, 45, 1101–1107. [Google Scholar] [CrossRef]
  8. Morcos, M.; Ward, S.; Anis, H.; Srivastava, K.; Gubanski, S. Insulation integrity of GIS/GITL systems and management of particle contamination. IEEE Electr. Insul. Mag. 2000, 16, 25–37. [Google Scholar] [CrossRef]
  9. Li, J.; Li, X.; Lv, Y.; Sun, H.; Gao, G.; Zhang, Q. Study on the Charge Characteristics and Movement Pattern of Lamellar Particles Under Power Frequency Voltage. Proc. CSEE 2021, 41, 1166–1175. [Google Scholar] [CrossRef]
  10. Asano, K.; Hishinuma, R.; Yatsuzuka, Y. Bipolar DC corona discharge from a floating filamentary metal particle. IEEE Trans. Ind. Appl. 2002, 38, 57–63. [Google Scholar] [CrossRef]
  11. Li, Q.; Wang, J.; Li, B.; Liu, S.; Chen, C.; Li, C. Review on Metal Particle Contamination in GIS/GIL. High Volt. Eng. 2016, 42, 849–860. [Google Scholar] [CrossRef]
  12. Negara, Y.; Yaji, K.; Imasaka, K.; Hayashi, N.; Hara, M. AC particle-triggered corona discharge in low pressure SF6 gas. IEEE Trans. Dielectr. Electr. Insul. 2007, 14, 91–100. [Google Scholar] [CrossRef]
  13. Sun, J.; Chen, W.; Li, Z.; Yan, X.; Yang, P.; Liu, H. Charge Estimation and Impact Analysis of Moving Metal Particle Under DC Electric Field. High Volt. Eng. 2018, 44, 779–786. [Google Scholar] [CrossRef]
  14. Lv, F.; Liui, H.; Yin, K.; Li, Z.; Dong, M.; Cao, D.; Xie, Q. Numerical Simulation and Discharge Characteristic Analysis of Metallic Particle Motion in Non-uniform Electric Field of DC GIL. Proc. CSEE 2017, 37, 2798–2806. [Google Scholar] [CrossRef]
  15. Sakai, K.I.; Abella, D.; Khan, Y.; Suehiro, J.; Hara, M. Experimental studies of free conducting wire particle behavior between nonparallel plane electrodes with AC voltages in air. IEEE Trans. Dielectr. Electr. Insul. 2003, 10, 418–424. [Google Scholar] [CrossRef]
  16. Khan, Y.; Sakai, K.; Lee, E.; Suehiro, J.; Hara, M. Motion behavior and deactivation method of free-conducting particle around spacer between diverging conducting plates under DC voltage in atmospheric air. IEEE Trans. Dielectr. Electr. Insul. 2003, 10, 444–457. [Google Scholar] [CrossRef]
  17. Lv, F.; Zhao, Z.; Zhan, Z.; Ma, K. Research Development of Treatment Method for Metal Particles in GIL. Guangdong Electr. Power 2020, 33, 94–109. [Google Scholar]
  18. Westinghouse Electric Corporation. Particle Trap in Gas Insulated Transmission Line. U.S. Patent 2,087,634, 27 April 1982.
  19. Trump, J.G. Dust Precipitator. U.S. Patent 3,515,939, 2 July 1970. [Google Scholar]
  20. Wang, J.; Ni, X.; Wang, Z.; Li, Q.; Li, C. Trapping Probability and Designing Optimization of Particle Trap in DC GIL. High Volt. Eng. 2018, 44, 4090–4097. [Google Scholar] [CrossRef]
  21. Lv, F.; Ma, K.; Liu, H.; Wang, S.; Zhan, Z. Capture Mechanism Analysis and Optimization Design of DC GIL Particle Trap. Proc. CSEE 2021, 1–15. [Google Scholar]
  22. Jia, J.; Chen, S.; Yang, L.; Zhang, Q. Study of Deactivation of Free Conducting Particle near Spacer in GIS. High Volt. Appar. 2004, 40, 370–372. [Google Scholar]
  23. Sakai, K.; Abella, D.; Suehiro, J.; Hara, M. Charging and behavior of a spherically conducting particle on a dielectrically coated electrode in the presence of electrical gradient force in atmospheric air. IEEE Trans. Dielectr. Electr. Insul. 2002, 9, 577–588. [Google Scholar] [CrossRef]
  24. Ma, K.; Liu, H.; Wang, Q.; Wang, S.; Lv, F. Study on Movement and Distribution Characteristics of Metal Particle Dust in DC GIL. IEEE Trans. Dielectr. Electr. Insul. 2022, 29, 1208–1217. [Google Scholar] [CrossRef]
  25. Wang, J. Research on the Moving Mechanisms of Charged Metal Particles in DC GIL and Suppressing Methods. Ph.D. Thesis, North China Electric Power University, Beijing, China, 2017. [Google Scholar]
  26. Zhan, Z.; Song, M.; Lv, F.; Li, Z.; Liu, Y.; Liu, W.; Xie, Q. Study on Particle Movement and Trap Suppression in AC Environmentally Friendly GIL. Proc. CSEE 2019, 39, 278–286. [Google Scholar] [CrossRef]
Figure 1. Structure diagram of GIL: (a) outside and (b) inside.
Coatings 12 00981 g001
Figure 2. Force analysis diagram of particle.
Coatings 12 00981 g002
Figure 3. Schematic diagram of collision random angle.
Coatings 12 00981 g003
Figure 4. Simulation flow chart.
Coatings 12 00981 g004
Figure 5. Particle trajectory.
Coatings 12 00981 g005
Figure 6. Electric field distribution.
Coatings 12 00981 g006
Figure 7. Particle trajectories under different initial phases: (a) 20°, (b) 40°, (c) 160°, and (d) 180°.
Coatings 12 00981 g007
Figure 8. Particle trajectories considering angle: (a) case 1, (b) case 2, (c) case 3, and (d) case 4.
Coatings 12 00981 g008
Figure 9. Test platform: (a) schematic diagram and (b) test chamber.
Coatings 12 00981 g009
Figure 10. Particle trajectories in tests.
Coatings 12 00981 g010
Figure 11. Flow chart of trap optimization simulation.
Coatings 12 00981 g011
Figure 12. Influence of trap parameters on capture rate: (a) effect of thickness and (b) effect of height.
Coatings 12 00981 g012
Figure 13. Particle distribution diagram: (a) Trap 1, (b) Trap 2, (c) Trap 3, and (d) Trap 4.
Coatings 12 00981 g013
Figure 14. Mass distribution diagram: (a) Trap 1, (b) Trap 2, (c) Trap 3, and (d) Trap 4.
Coatings 12 00981 g014
Table 1. Equations of force.
TypeEquation
Electric field force F q = k r q E (2)
Dielectrophoretic (DEP) force F d = 2 π r 3 ε 0 ε 1 E 2 (3)
Drag force F v = ( 24 Re + 6 1 + Re + 0.4 ) π r 2 ρ g a s v 2 2 (4)
Gravity (without buoyancy) G = 4 3 π r 3 ( ρ ρ g a s ) g (5)
Table 2. Structural parameters.
ItemValueItemValue
Diameter of high-voltage electrode50 mmTrap slot width5 mm
Inner diameter of chamber125 mmThickness of trap5 mm
Inclination angle of insulator45°Number of slots10
Trap slot distance5 mmHeight of trap3 mm
Table 3. Structural parameters.
NumberThickness/mmHeight/mm
124
264
365
4104
Publisher’s Note: MDPI stays neutral with regard to jurisdictional claims in published maps and institutional affiliations.

