Article

Friction Coefficient Dynamics of Tribological Coatings from Engine Lubricants: Analysis and Interpretation

by
Saúl Domínguez García
1,*,
Luis Béjar Gómez
1,
Rafael Maya Yescas
2,
Javier Lara Romero
2,
Baltazar Castro Cedeño
2 and
Marco Antonio Espinosa Medina
1
1
Facultad de Ingeniería Mecánica, Universidad Michoacana de San Nicolás de Hidalgo, Morelia 58030, Mexico
2
Facultad de Ingeniería Química, Universidad Michoacana de San Nicolás de Hidalgo, Morelia 58030, Mexico
*
Author to whom correspondence should be addressed.
Coatings 2023, 13(10), 1753; https://doi.org/10.3390/coatings13101753
Submission received: 25 August 2023 / Revised: 30 September 2023 / Accepted: 2 October 2023 / Published: 11 October 2023
(This article belongs to the Special Issue Surface Engineering, Coatings and Tribology)

Abstract

:
Even today, there is no full understanding of the relationship between the physical, chemical, and mechanical properties and the behavior of the lubricating films formed in tribological systems. Most of the published scientific research measures and reports the overall values of friction and wear, but the information given via statistical signals in the tribological tests is, in general, dismissed, leaving a hole in the study of the dynamics of tribological systems. In this work, an experimental study of statistical friction data, coating characteristics, and tribological performance is carried out using a pin-on-disk tribometer to test some metallic samples coated with lubricant films under several experimental conditions. The results indicate that long deposition times at high deposition temperatures of coatings from engine oil develop low-friction intervals, which fall until 20% of the uncoated coefficient friction. However, an unexpected and unfavorable behavior of the coatings was observed for the short deposition times and high temperature. In these conditions, the developed friction profiles reached a maximum level of friction that was 20% more than the uncoated coefficient friction. Moreover, it was found that the proper analysis and interpretation of the statistical data, in combination with the characterization of the coatings, describes the dynamics of the interactions between the bodies in contact and reveals the transitions of the surfaces with non-homogeneous properties throughout their depth.

1. Introduction

In a highly industrialized modern society, manufacturing, energy generation, and transportation are essential industrial operations. They involve using all types of machinery and mechanical systems that include numerous moving components and, therefore, interacting surfaces to move both people and all kinds of materials in many different forms. The efficiency in managing the friction and wear between the multiple interacting surfaces of these devices is critical to ensuring their long-lasting, reliable, and smooth operation [1].
The significant economic costs of wear failure and energy waste are the primary motivations for friction and wear phenomenon mitigation. In industrialized countries, the economic loss of machines caused by friction and wear is estimated to be as high as 6% of GDP [2]. Additionally, it is estimated that almost a third of the energy that a human uses every day is wasted and consumed by friction on the moving elements of machines. Therefore, for more than 50 years, considerable efforts have been made and will continue to be made in attempting to decrease friction dissipation via the development of new lubricating materials [3].
The development of proper lubricant technology is essential for the protection of machinery from frictional wear and the consequent energy loss. Lubricants are highly functionalized products that concurrently fulfill many requirements. At present, they satisfy strict technical requirements, but in the future, non-technical standards like sustainability and eco-toxicological characteristics will be included on top of the already strict standards [4].
For instance, studies aiming to develop new lubricant formulations that could be more efficient and environmentally friendly include biolubricants [5], which use nanoparticles to enhance the performance of existing lubricants [6]. Single- and multi-walled carbon nanotubes are used as additives for oil and water lubrication [7], and ionic liquids are used as clean lubricants [8], to mention a few examples.
When addressing the issue of friction and wear, it is crucial to consider more than just research and the advances in lubricant technology. Lubrication systems and the lubrication process itself must also be considered. The lubrication process that takes place inside the lubrication systems of engines is highly complex. Even today, there is not a complete understanding of the phenomena that occur during the operation of these lubrication systems from mechanical and physicochemical perspectives. Additionally, a multidisciplinary research perspective is required due to the diversity in the nature of the phenomena produced in the lubricating process [9].
One of the numerous phenomena that take place as part of the lubrication process is the formation of a protective film that prevents the deterioration of mechanical components. Commonly known as tribofilm, it is initially a product of the reaction of lubricant precursors. Tribofilm thickness is controlled via several mechanical and chemical variables; hence, when properly describing lubrication systems, both types of variables must be taken into consideration [10].
However, it has been demonstrated that after wear occurs, waste material products of chemical degradation and debris accumulate in the mixture with the lubricant [11,12]; unfortunately, these degradation products do not protect the interacting surfaces [13,14].
The dynamics of lubrication are described in the scientific literature, and there are many lubrication models reported. Some studies focus on the modeling and simulation of the lubricant phenomena from the plastic–mechanical perspective. To mention a few, Zhao et al. (2016) [15] developed a lubrication model for the surface wear of piston cylinders in internal combustion engines that takes into consideration the deformation of protecting the film and crank angles. Akchurin, Bosman, and Lugt (2017) [16] developed a model to simulate the formation of wear particles in mixed lubricated sliding contacts. The resulting model can be used to determine the size of the particles generated under different conditions and was validated using the experimental measurements of the initial and run-in coefficient of friction in a mixed lubricated contact. Azam et al. (2019) [17] developed a model to incorporate elastoplastic behavior into a deterministic unified mixed lubrication framework. The model is capable of successfully producing all the essential components of the plasto-elastohydrodynamic lubrication (PEHL) interaction. It should be noted that none of the works mentioned above take into account the chemical degradation of the lubricant and its effects on the formation of tribofilm.
One of the first scientific studies to consider the chemical degradation of lubricants was the research of Ghanbarzadeh et al. (2016) [18], who developed a tribochemical model based on the thermodynamics of the interfaces and the kinetics of tribochemical reactions. Later, Azam et al. (2019) [19] implemented a lubrication model that took into consideration most of the mechanical lubrication models and tribochemistry. This study considered the variable hardness of tribofilm and enabled the study of lubrication and tribochemistry as well as their mutual interaction. Dominguez-Garcia et al. (2022) [20] analyzed the lubricant life cycle in a conventional lubrication system for internal combustion engines by simulating the mass balances of the protective tribofilm generated inside the engine.
Recently, Agocs et al. [21] studied the deterioration of the friction and wear properties of SEA 5W-30 engine oil during its service life (20,000 km, a typical oil change interval) and the differences in the tribofilms formed by different oil conditions. Results revealed that friction and wear increases in the used oil compared to the fresh oil by 9% and over 420%, respectively. This study also concluded that the observed tribofilms changed significantly depending on additive degradation, changing the composition of the tribofilm of a model test. Iron concentration in the tribofilms increased during the service life of the engine oil, while calcium, phosphorous, and zinc concentrations decreased, which can be correlated with additive depletion.
In the context of the work presented in this paper, it is worth mentioning that most of the published research that addresses tribological systems has focused on the measurement and/or prediction of the thickness of tribofilms, the coefficient of friction, wear, and film characterization. Nevertheless, the information given by the variability of the measurements is, in general, dismissed.
Measurements of film thickness are commonly carried out by spacer layer interferometry and electrical contact resistance methods for in situ measurements, and atomic force microscopy, scanning electron microscopy, and transmission electron microscopy for ex situ measurements [18,22,23]. The predictions of the lubricating film thickness are developed from tribochemical models of film growth, experimental parameters of film removal, elastoplastic models of viscous films over rough surfaces, the Reynolds equation, and mass balance models [9,10,17,20,24,25]; the measurements of the coefficient of friction are in general carried out from tribological devices that measure friction force [6,13,22,26,27,28,29]. Friction coefficient predictions are developed from multi-scale roughness and linear models of friction as a function of coated surfaces [2,29,30]. Measurements of wear are carried out by chemical oil analysis techniques and computations from wear traces [6,8,18,22,29,31,32,33,34,35,36,37,38,39]. Finally, wear predictions are always performed following Archard’s law in combination with tribochemical models of film growth, experimental parameters of film removal, elastoplastic models of viscous films over rough surfaces, the Reynolds equation, and mass balance models [10,18,40,41,42,43].
Although the techniques listed above enable the analysis of tribological systems, the in situ monitoring of the roughness evolution during tribological experiments is still very complicated; however, statistical friction data analysis may give extra information that, in combination with some of the other available experimental tools and mathematical methods, could track the changes on the contacting surfaces and their relationship with the friction and wear dynamics.
It is important to mention that none of the previous studies have considered studying the statistical friction of experimental data, the coating characteristics, or their correlation with tribological performance. Even to this day, the relationship between the physical, chemical, and mechanical characteristics, as well as the tribological behavior of the films formed from engine oil, is not completely understood. In scientific research, every element of tribofilms is studied separately from the others. Therefore, it is necessary to generate more knowledge of this phenomenon. In this work, the study of statistical friction data, coating characteristics, and tribological performance are addressed.

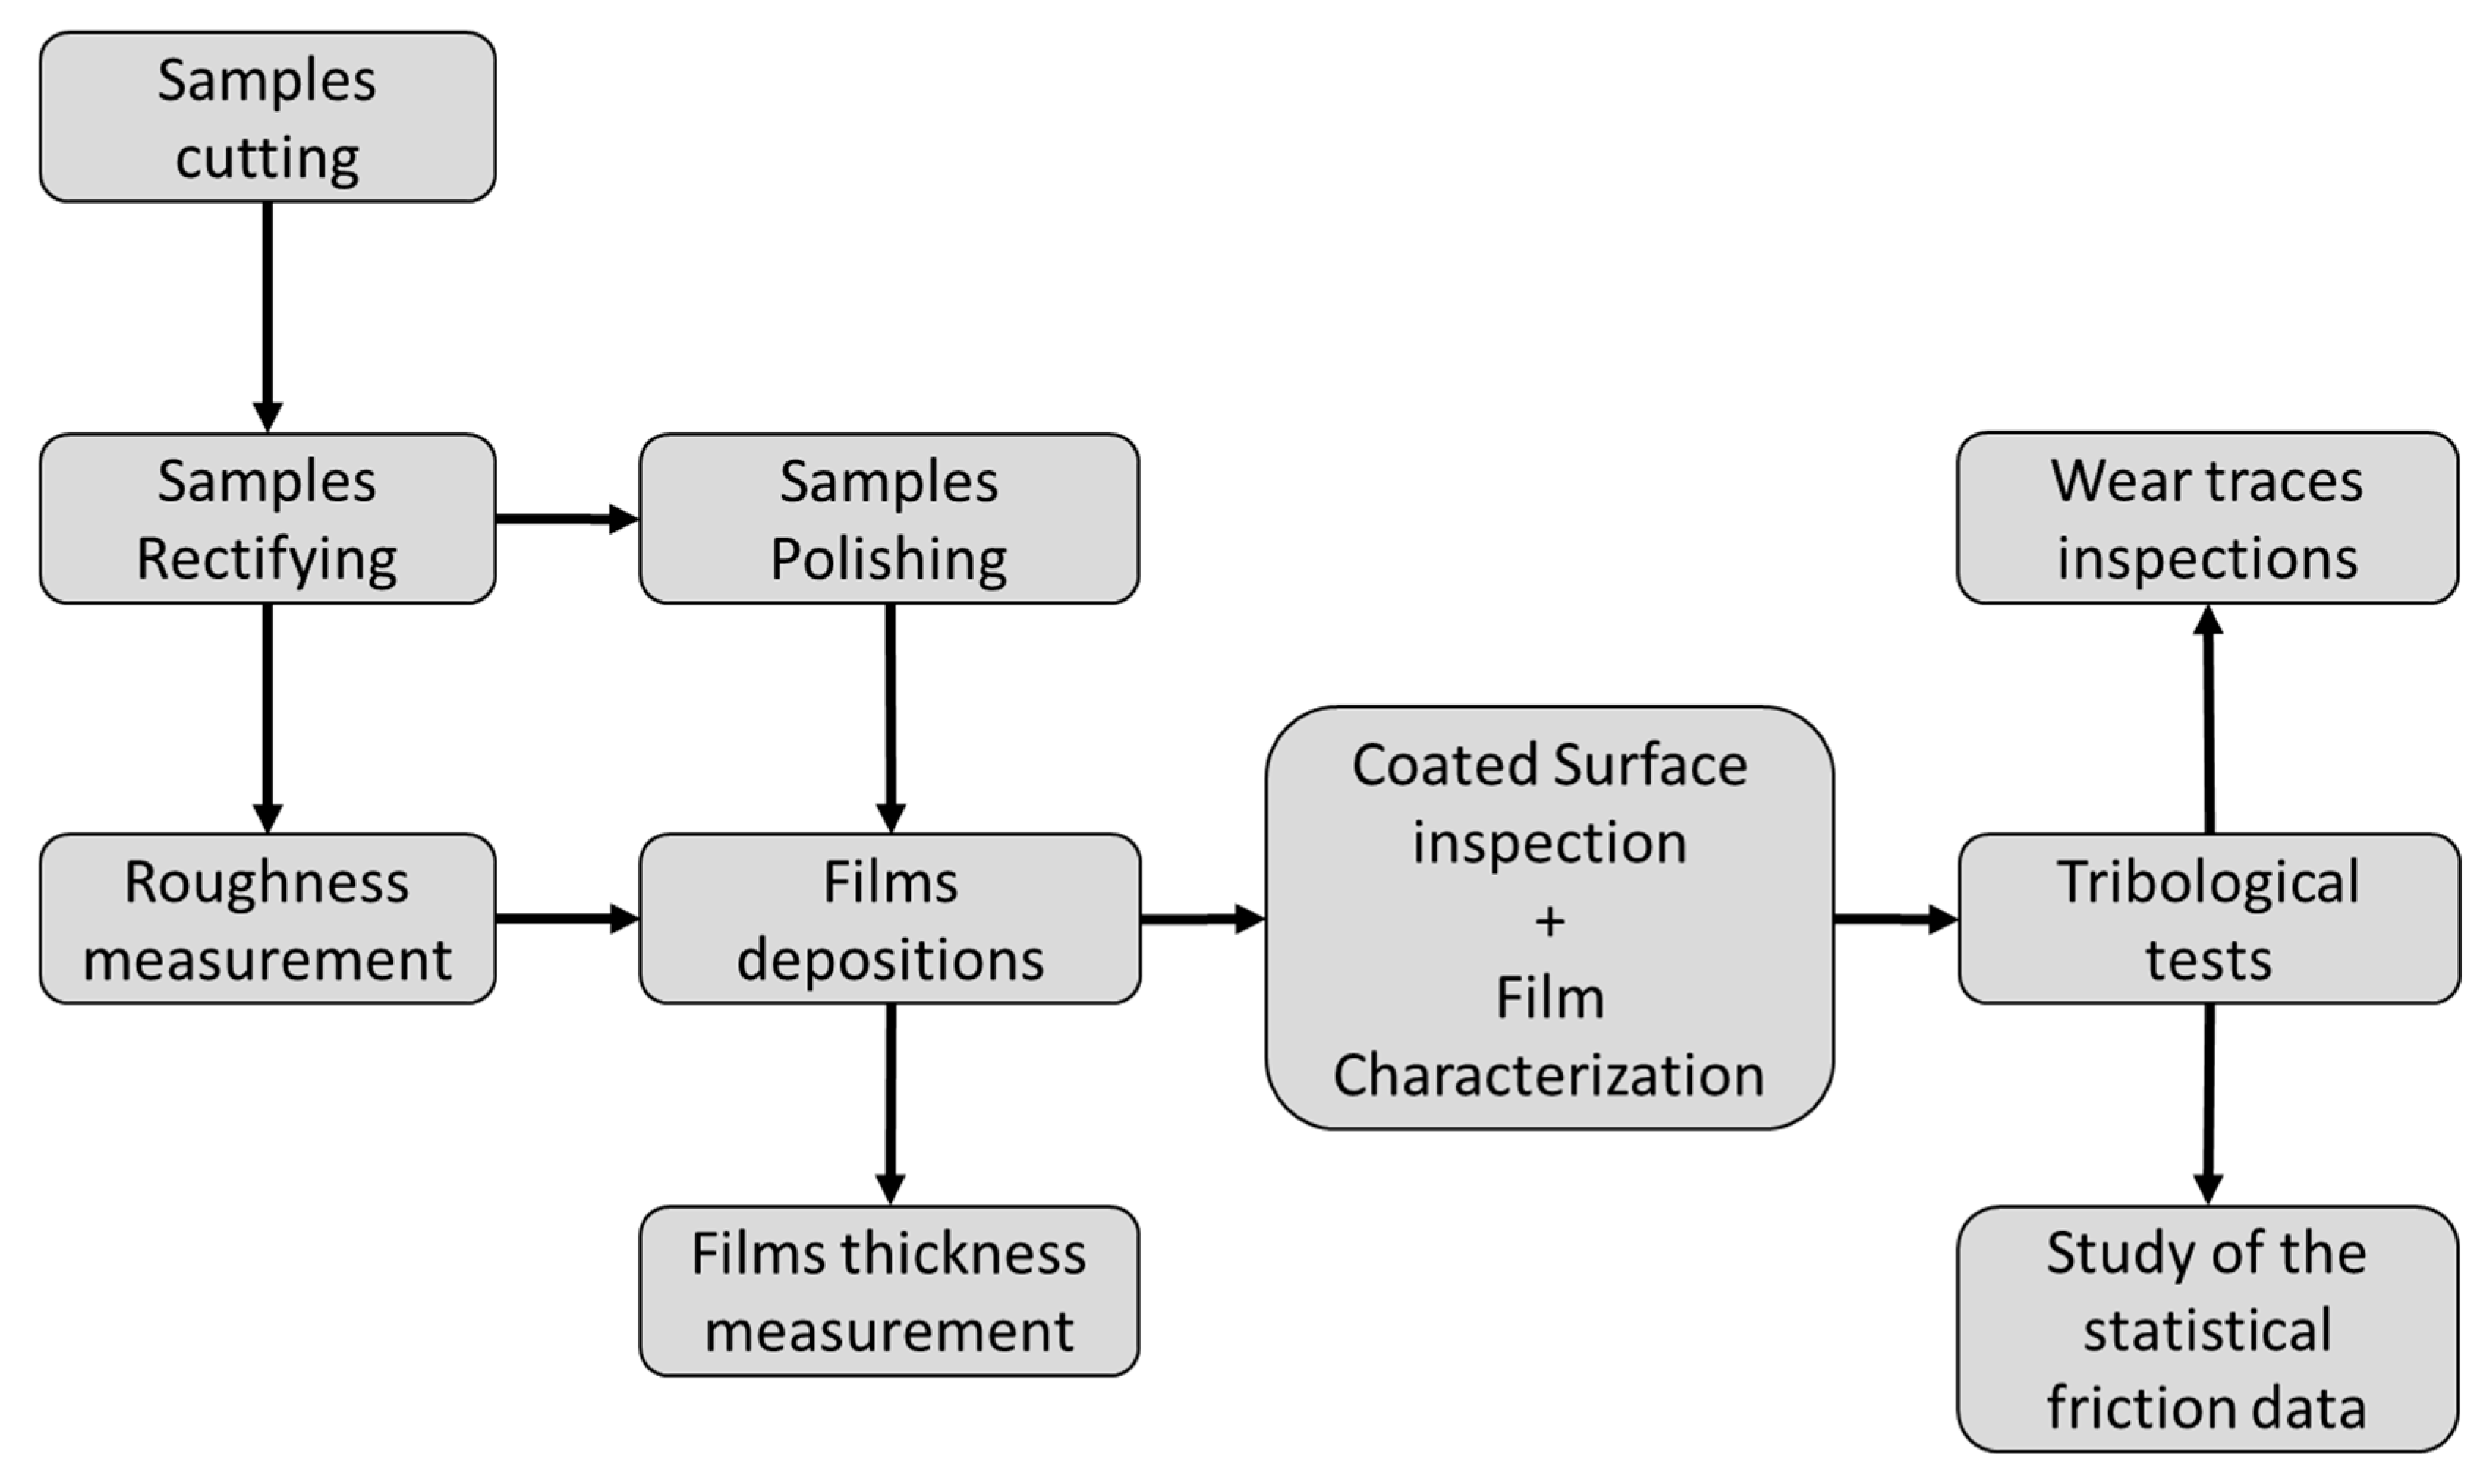
2. Materials and Methods

An overall explanation of the methodology for studying statistical friction data, coating characteristics, and tribological performance is presented in Figure 1. It is worth mentioning that, in this work, the study of the characteristics of the coatings comprises film thickness, coated surface inspection, and the elemental composition of the films. The study of statistical friction data comprises the mobile average of the friction coefficient and the mobile standard deviation of the friction coefficient. The study of tribological performance comprises the analysis of all three measurements, the characteristics of the coatings, the friction data, and the inspection of wear traces.
This procedure began by cutting square samples of structural steel, which were rectified to obtain flatter surfaces. Then, their roughness was measured. From rectified samples, one set of specimens was polished to give them a mirror finish. Then, all samples were coated with lubricating films except for one sample, which was used as a comparison standard. The set of polished and coated samples was used to measure the film thickness, and the other samples were used first to inspect and characterize their coated surface and then to carry out tribological tests to obtain the statistical friction data. Finally, after tribological tests were performed, the wear traces were inspected to estimate the accumulated wear.

2.1. Preparation of the Metallic Samples

In this work, ASTM A-36 steel was chosen to provide the samples due to the fact that it is probably the most commercial steel used in the world, is easy to obtain, and its mechanical properties pair well with the tribometer used in these experiments. To carry out the experiments, all samples were cut into square plates of 2.5 cm × 2.5 cm × 0.3 cm. For the tribological tests, 12 plates were rectified to give them a flat finish. Two surface roughnesses were obtained—one measured in the direction of the pattern of straight, parallel grooves produced from the mechanical treatment of the surface with an average roughness of 0.26 µm, and the other measured against the pattern with an average roughness of 0.5 µm. For the measurements of the film thickness, 7 plates were polished to a mirror finish to facilitate the perpendicular measurement of the film thickness (Figure 2).
Please note that the preparation of the samples for the measurement of film thickness was carried out following the standard guide for preparing metallographic specimens given in ASTM E3-11 [44] (reapproved 2017).

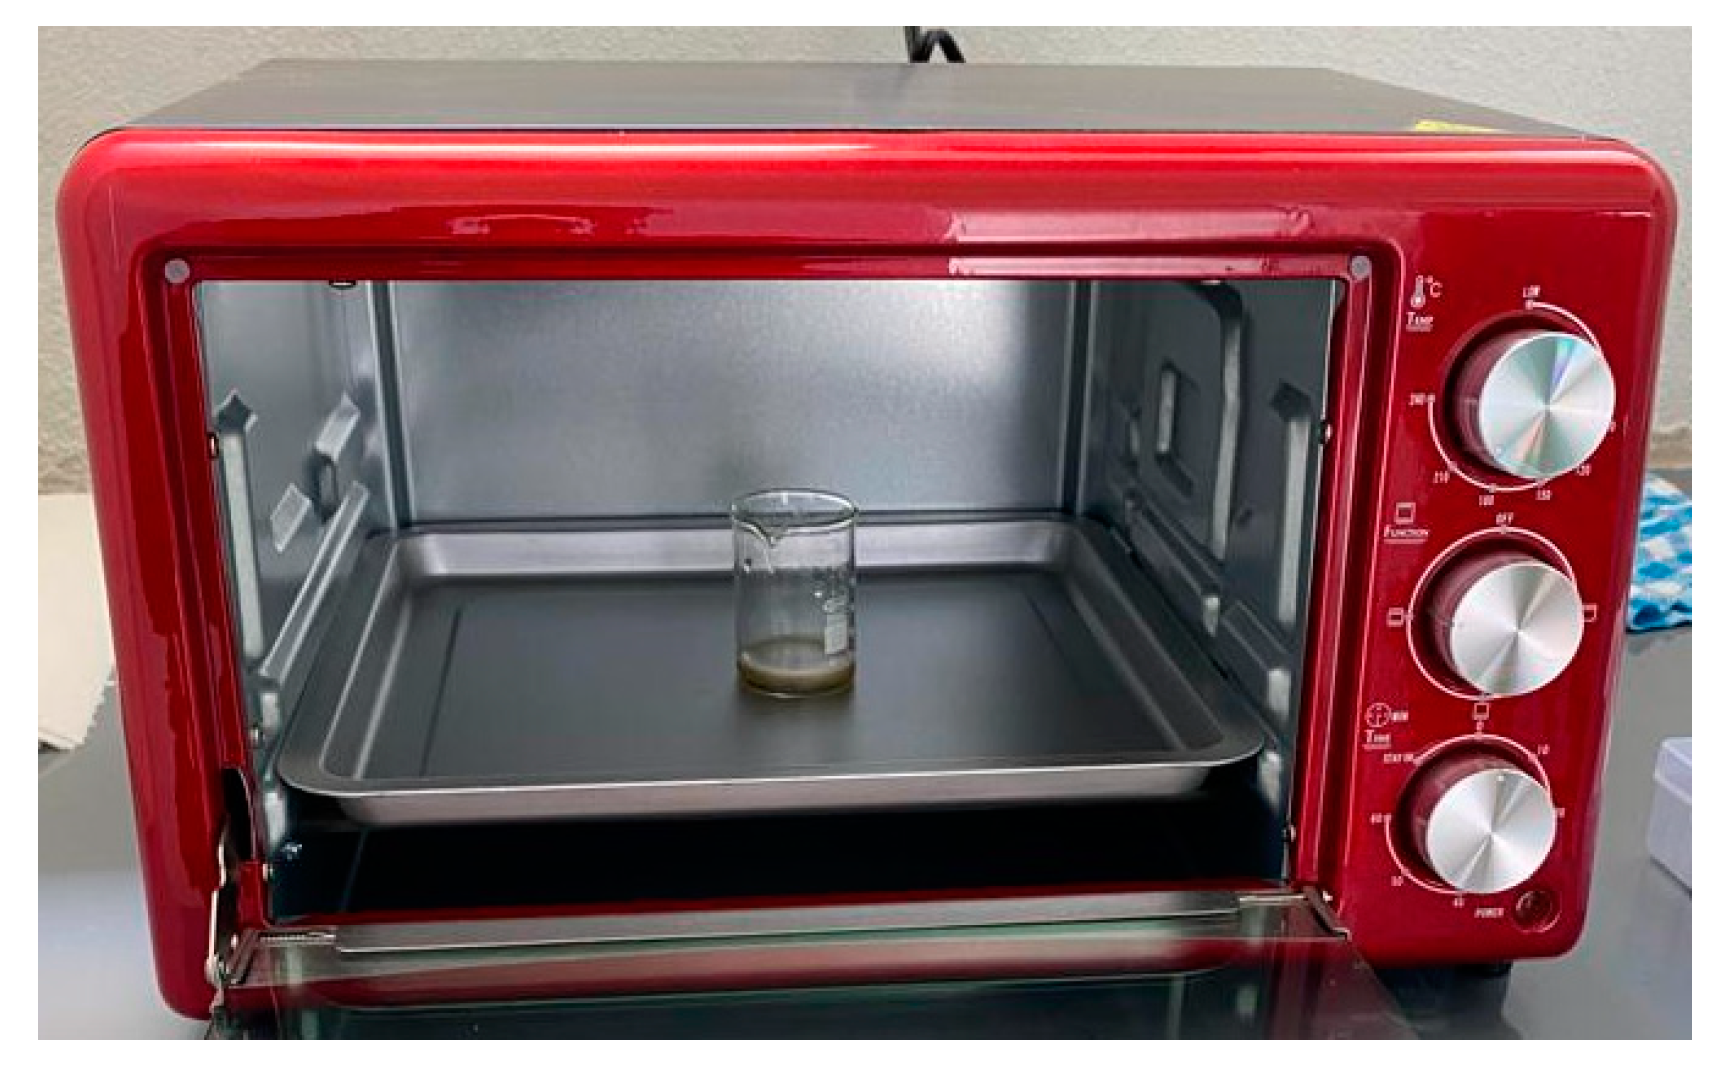
2.2. Deposition of Films

The ASTM A-36 steel samples were coated by submersion in 5 mL of heated oil in an electric oven at the corresponding temperature and deposition time. The lubricant used was SAE 15W40 engine oil since it is one of the most used lubricants in conventional cars and for personal uses. According to the datasheet of the lubricant’s manufacturer, the degradation temperature of the carrier oil contained by this lubricant blend is 200 °C. Therefore, the chosen coating temperatures for the tribological performance tests of films deposited from this lubricant were 90, 150, and 210 °C to determine the performance with and without oil degradation. The deposition times were chosen from previous calibration experiments.
From the rectified sample set, 1 sample was left uncoated to compare its properties and behavior against the coated samples, 3 samples were used as central repetitions, and the others were coated at experimental conditions presented in Table 1. It should be highlighted that this part of the work follows an experimental design based on a 3k model with 2 extra central repetitions plus 1 reference experiment, where k is the number of variables, the deposition time and temperature, accounting is set at 2, and 3 is the levels of these 2 variables. This corresponds to a total of 12 experiments. Central repetitions were used instead of repeating the entire experiment to provide an observation of the experimental error, therefore reducing cost and time.
The 7 samples from the polished set were coated at the experimental conditions presented in Table 2. It should be noted that, after observing the good repeatability of the experiments in the film thickness analysis, the number of experiments was reduced to show the significant and illustrative effects of the experimental conditions on the characteristics of the analyzed coatings, therefore saving cost and time.
To produce the film deposits, an oven (Holstein, 9 L capacity) was preheated for 5 min at the corresponding temperature, then the steel samples were submerged in the lubricant and introduced into the oven. The temperature of the sample was verified with an infrared thermometer. Once the corresponding temperature of the lubricant was reached, the samples were kept there for the corresponding time. Figure 3 is a picture of the experimental setup. Please note that each sample was coated separately, all depositions were carried out by the same experimenter, and all experiments were randomized to reduce experimental errors. The oven heats from top to bottom, providing a better temperature distribution.

2.3. Morphology and Characterization of the Coated Samples

After the film deposition, the rectified samples were analyzed by scanning electron microscopy and by energy dispersive X-ray spectroscopy to quantify the weight percentage of the elements present in the films.
These analyses were carried out in a JEOL JSM 7600F scanning microscope equipped with a field emission gun and an EDS elemental analysis system (Manufactured by JOEL company and sourced from JEOL USA, Inc., Peabody, MA, USA.), whose technical characteristics reach a secondary electron resolution of 1.0 nm at 15 kV, 15 nm at 1 kV in GB mode, and 2.5 nm in SEM mode.

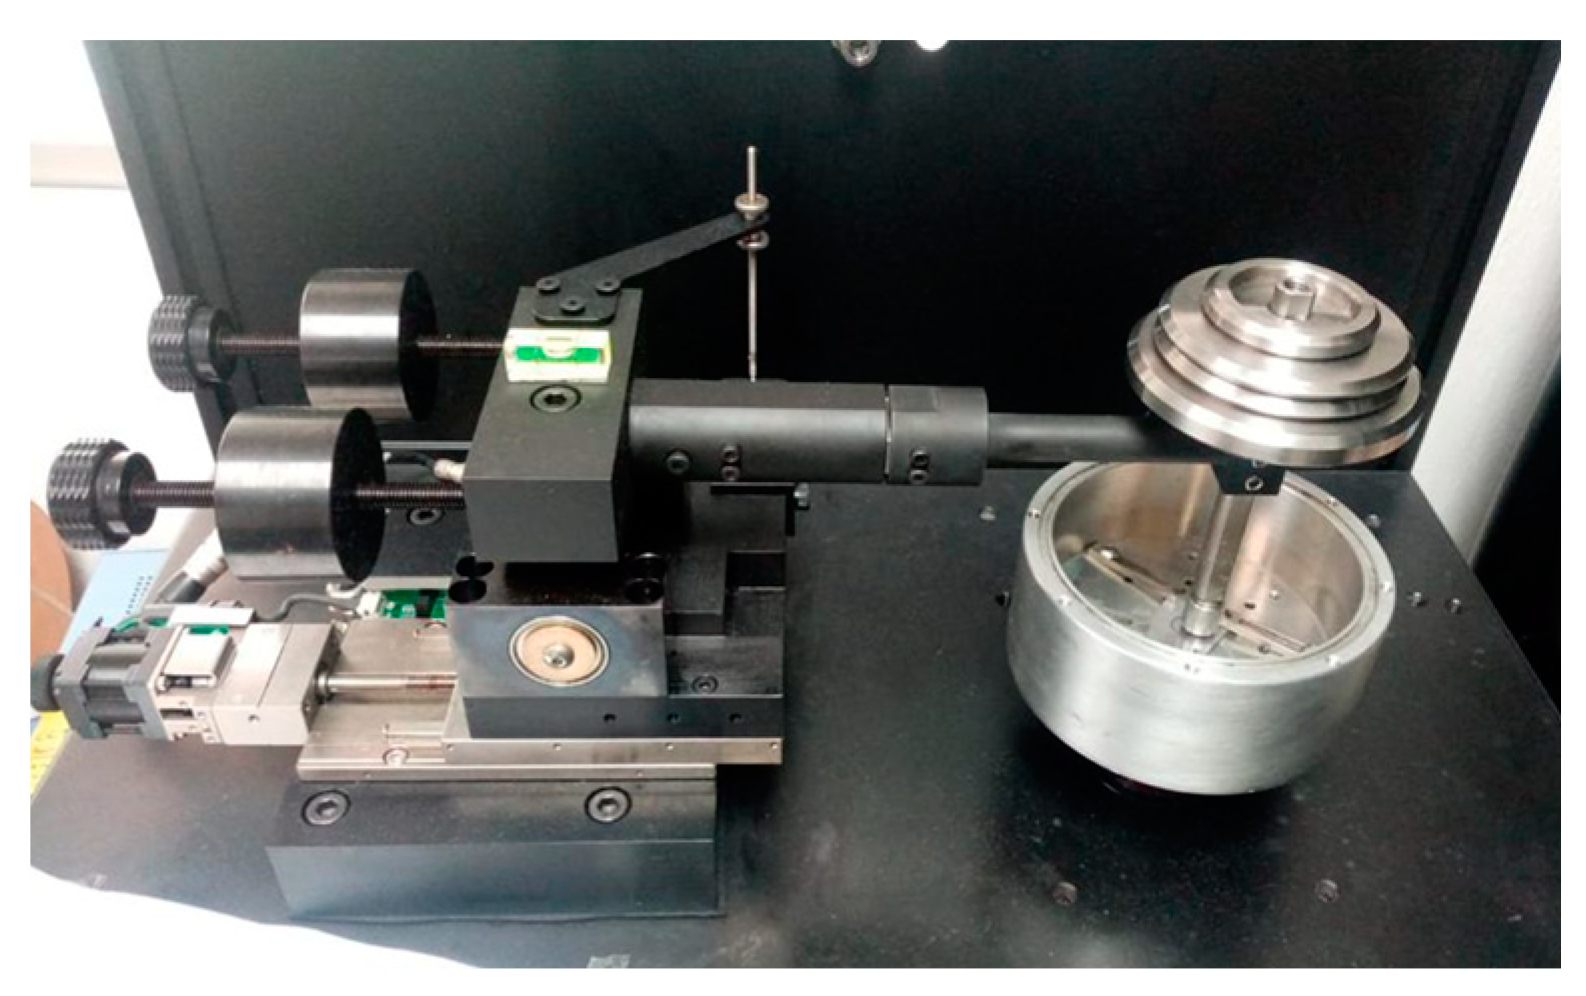
2.4. Tribological Tests

The tribological tests were carried out following the standard test method for wear testing with pin-on-disk apparatus (ASTM G99-95a [45]) in a commercial pin-on-disk tribometer (NANOVEA model T1). A picture of this apparatus is shown in Figure 4. In this equipment, the contact consists of an AISI 52,100 balls (pin) 6 mm in diameter secured to a stationary holder, and the plate (disk) is attached to a container coupled with a variable-speed electric motor. The plates consist of 12 rectified and coated samples. In the test procedure, the coefficient of friction is continually measured using a linear-voltage displacement transducer mounted to the ball holder.
All tests were performed at a constant temperature of 25 °C, relative humidity of 44%, and a dead weight of 10 N. The plate attached to the container rotated for 1 h with a sliding speed of 60 mm/min, covering a total track length of 3.6 m. Following the testing, the steel plates and steel balls were taken out of the tribometer and stored for later characterization. The standard chemical components and the mechanical properties of the pin and disk are shown in Table 3 and Table 4, respectively.

2.5. Study of the Wear Tracks

After the tribological tests were carried out, the resulting wear tracks were inspected by optical microscopy to identify the components of wear traces. The equipment used was an Olympus gx45 metallographic optical microscope at 50× magnification. Then, the width and radius of the wear traces were measured to compute the wear volume following the standard test method for wear testing with a pin-on-disk apparatus, given in the ASTM G99-95a method (Equation (1)).
d i s k v o l u m e   l o s s = 2 π R [ r 2 sin 1 d 2 r d 4 4 r 2 d 2 1 2 ]
Here, R is the wear-track radius, d is the wear-track width, and r is the pin radius. Please note that this equation is only valid by assuming that there is no significant wear on the pin (ASTM G99-95a).

2.6. Measurement of the Film Thickness

All polished and coated samples were embedded in a polyacrylate resin, and the perpendicular side to the coated surface was polished again (ASTM E3-11). Then, the border of each sample was inspected by scanning electron microscopy to measure the film thickness.
Please note that some variables were not considered in this research, namely the hardness of the coatings, the formation of debris from the contacting surfaces, the depletion of oil additives, the chemical degradation reactions of oil, the effect of surface area in the formation of coatings, the effect of roughness in the film growth and the intrinsic mechanical properties of films. However, the study of these variables and their impact could be targeted in further research.

3. Results

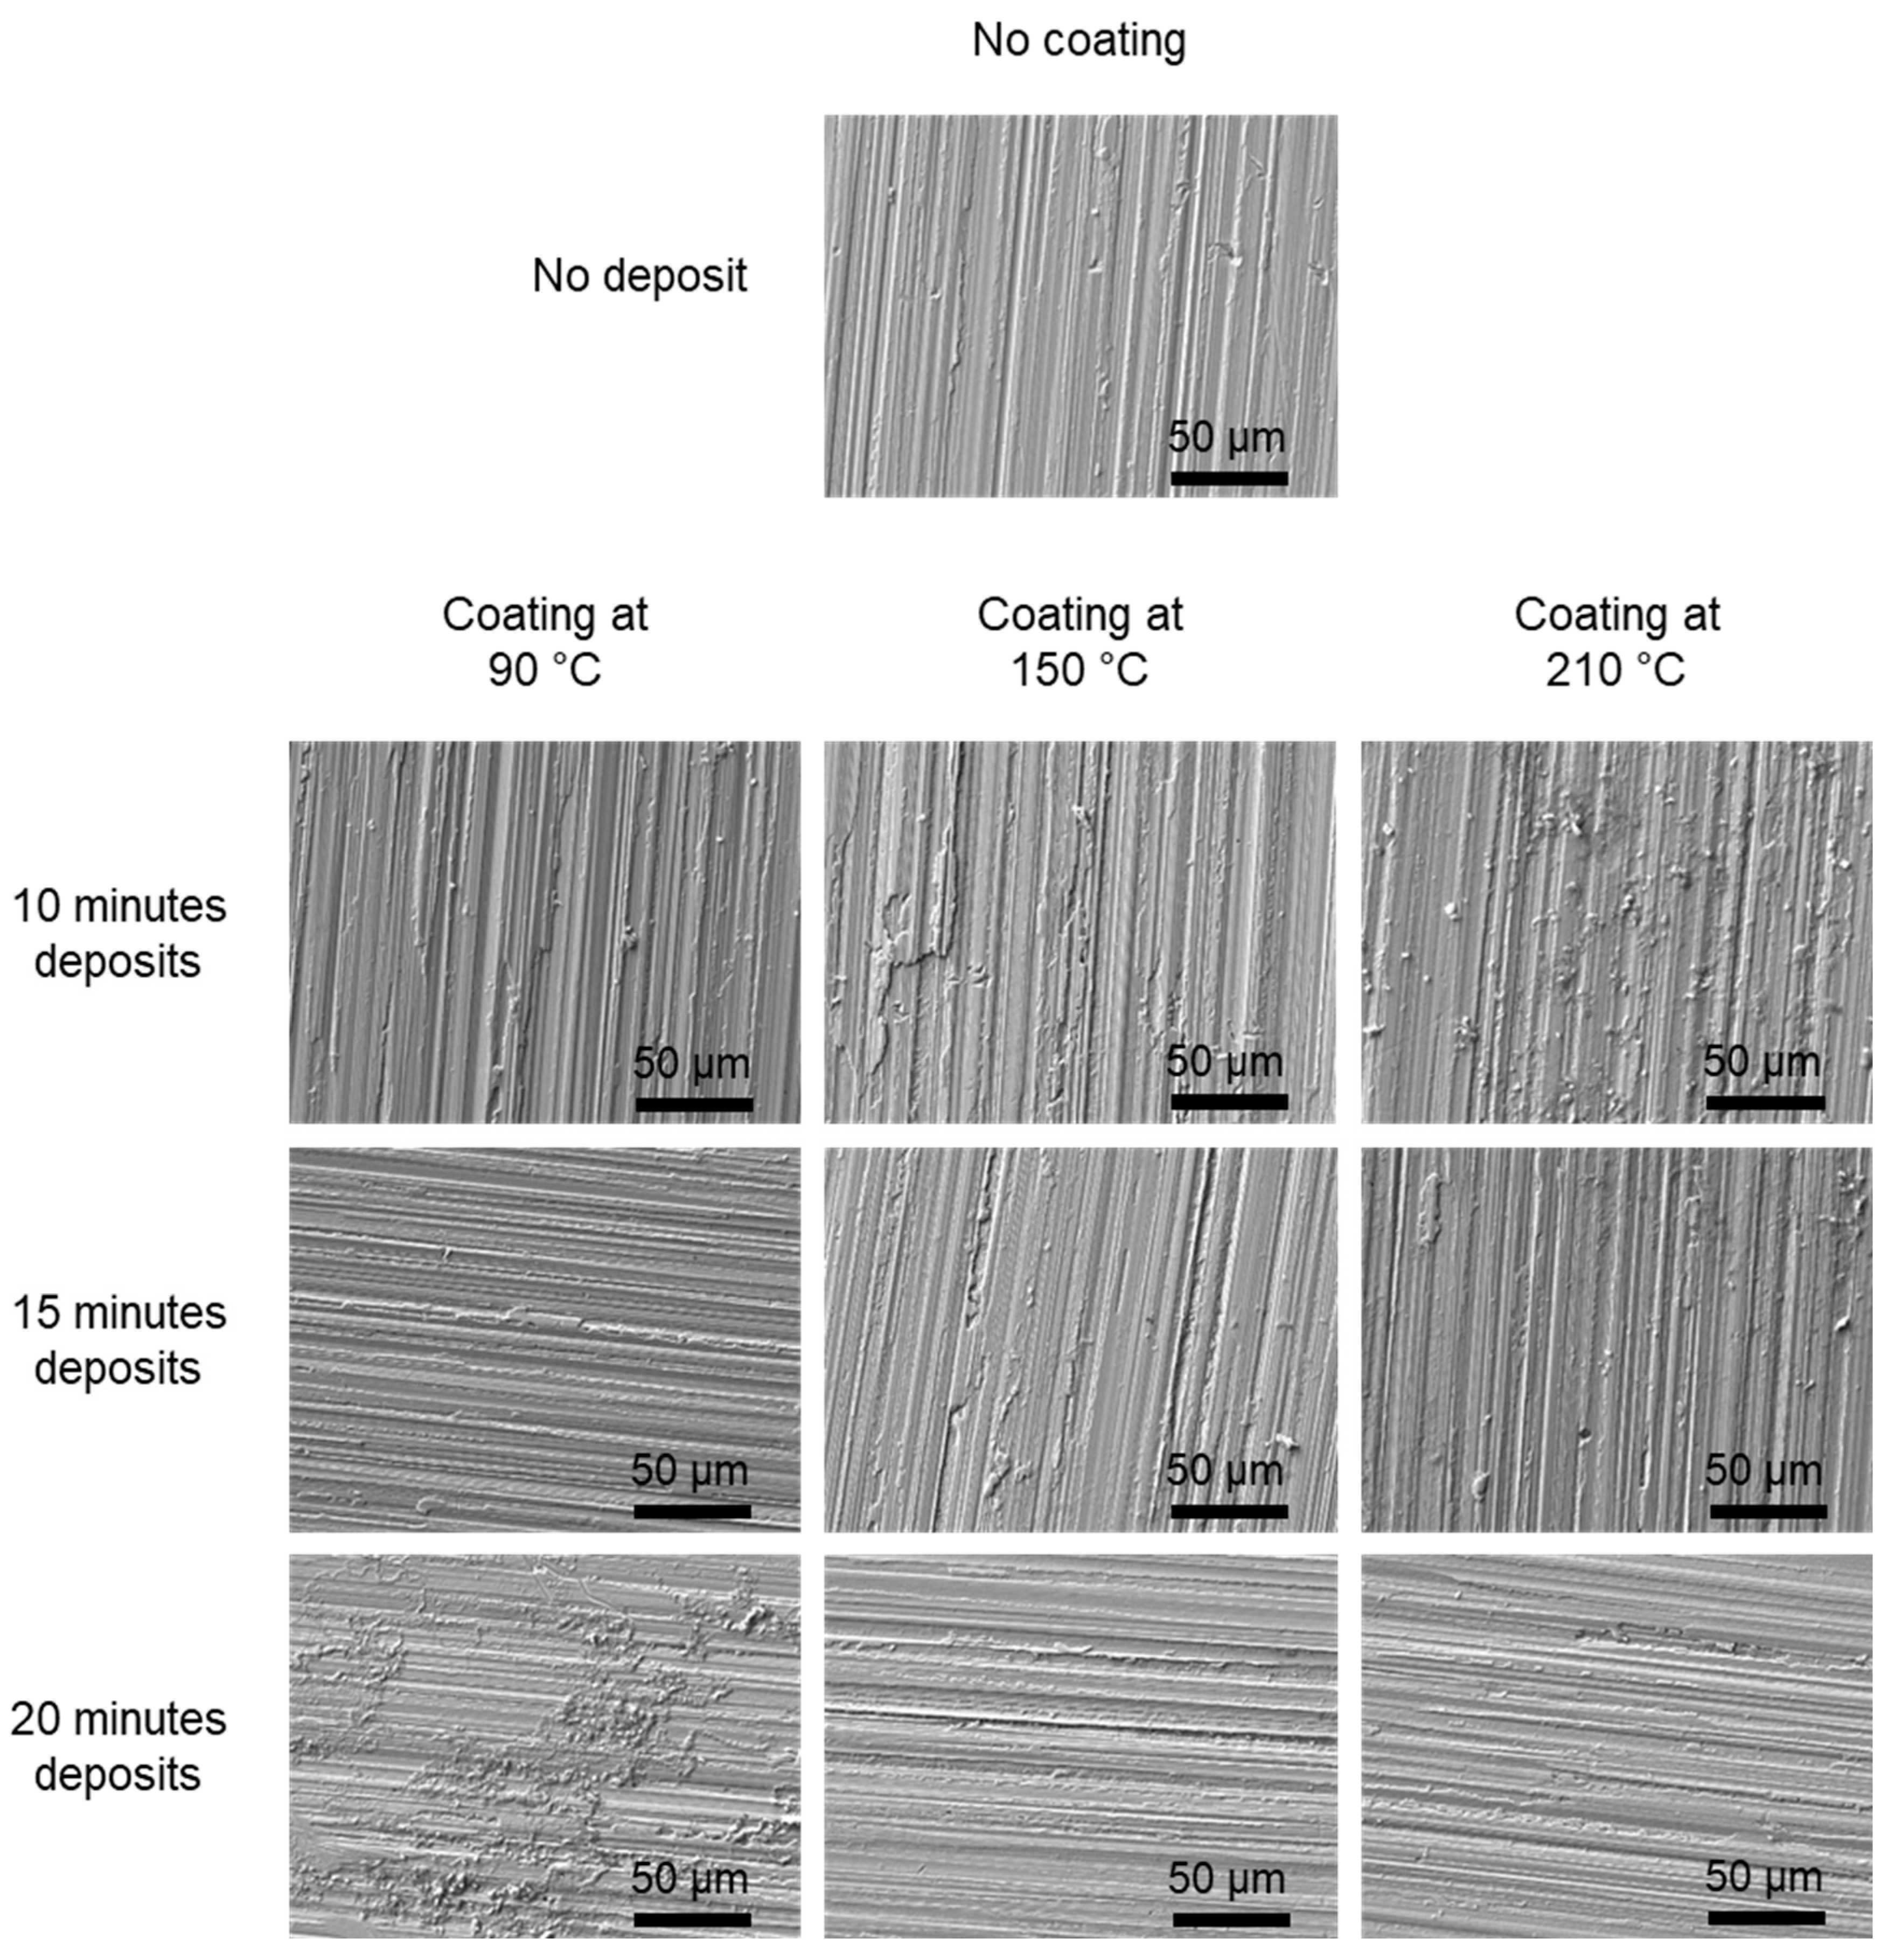
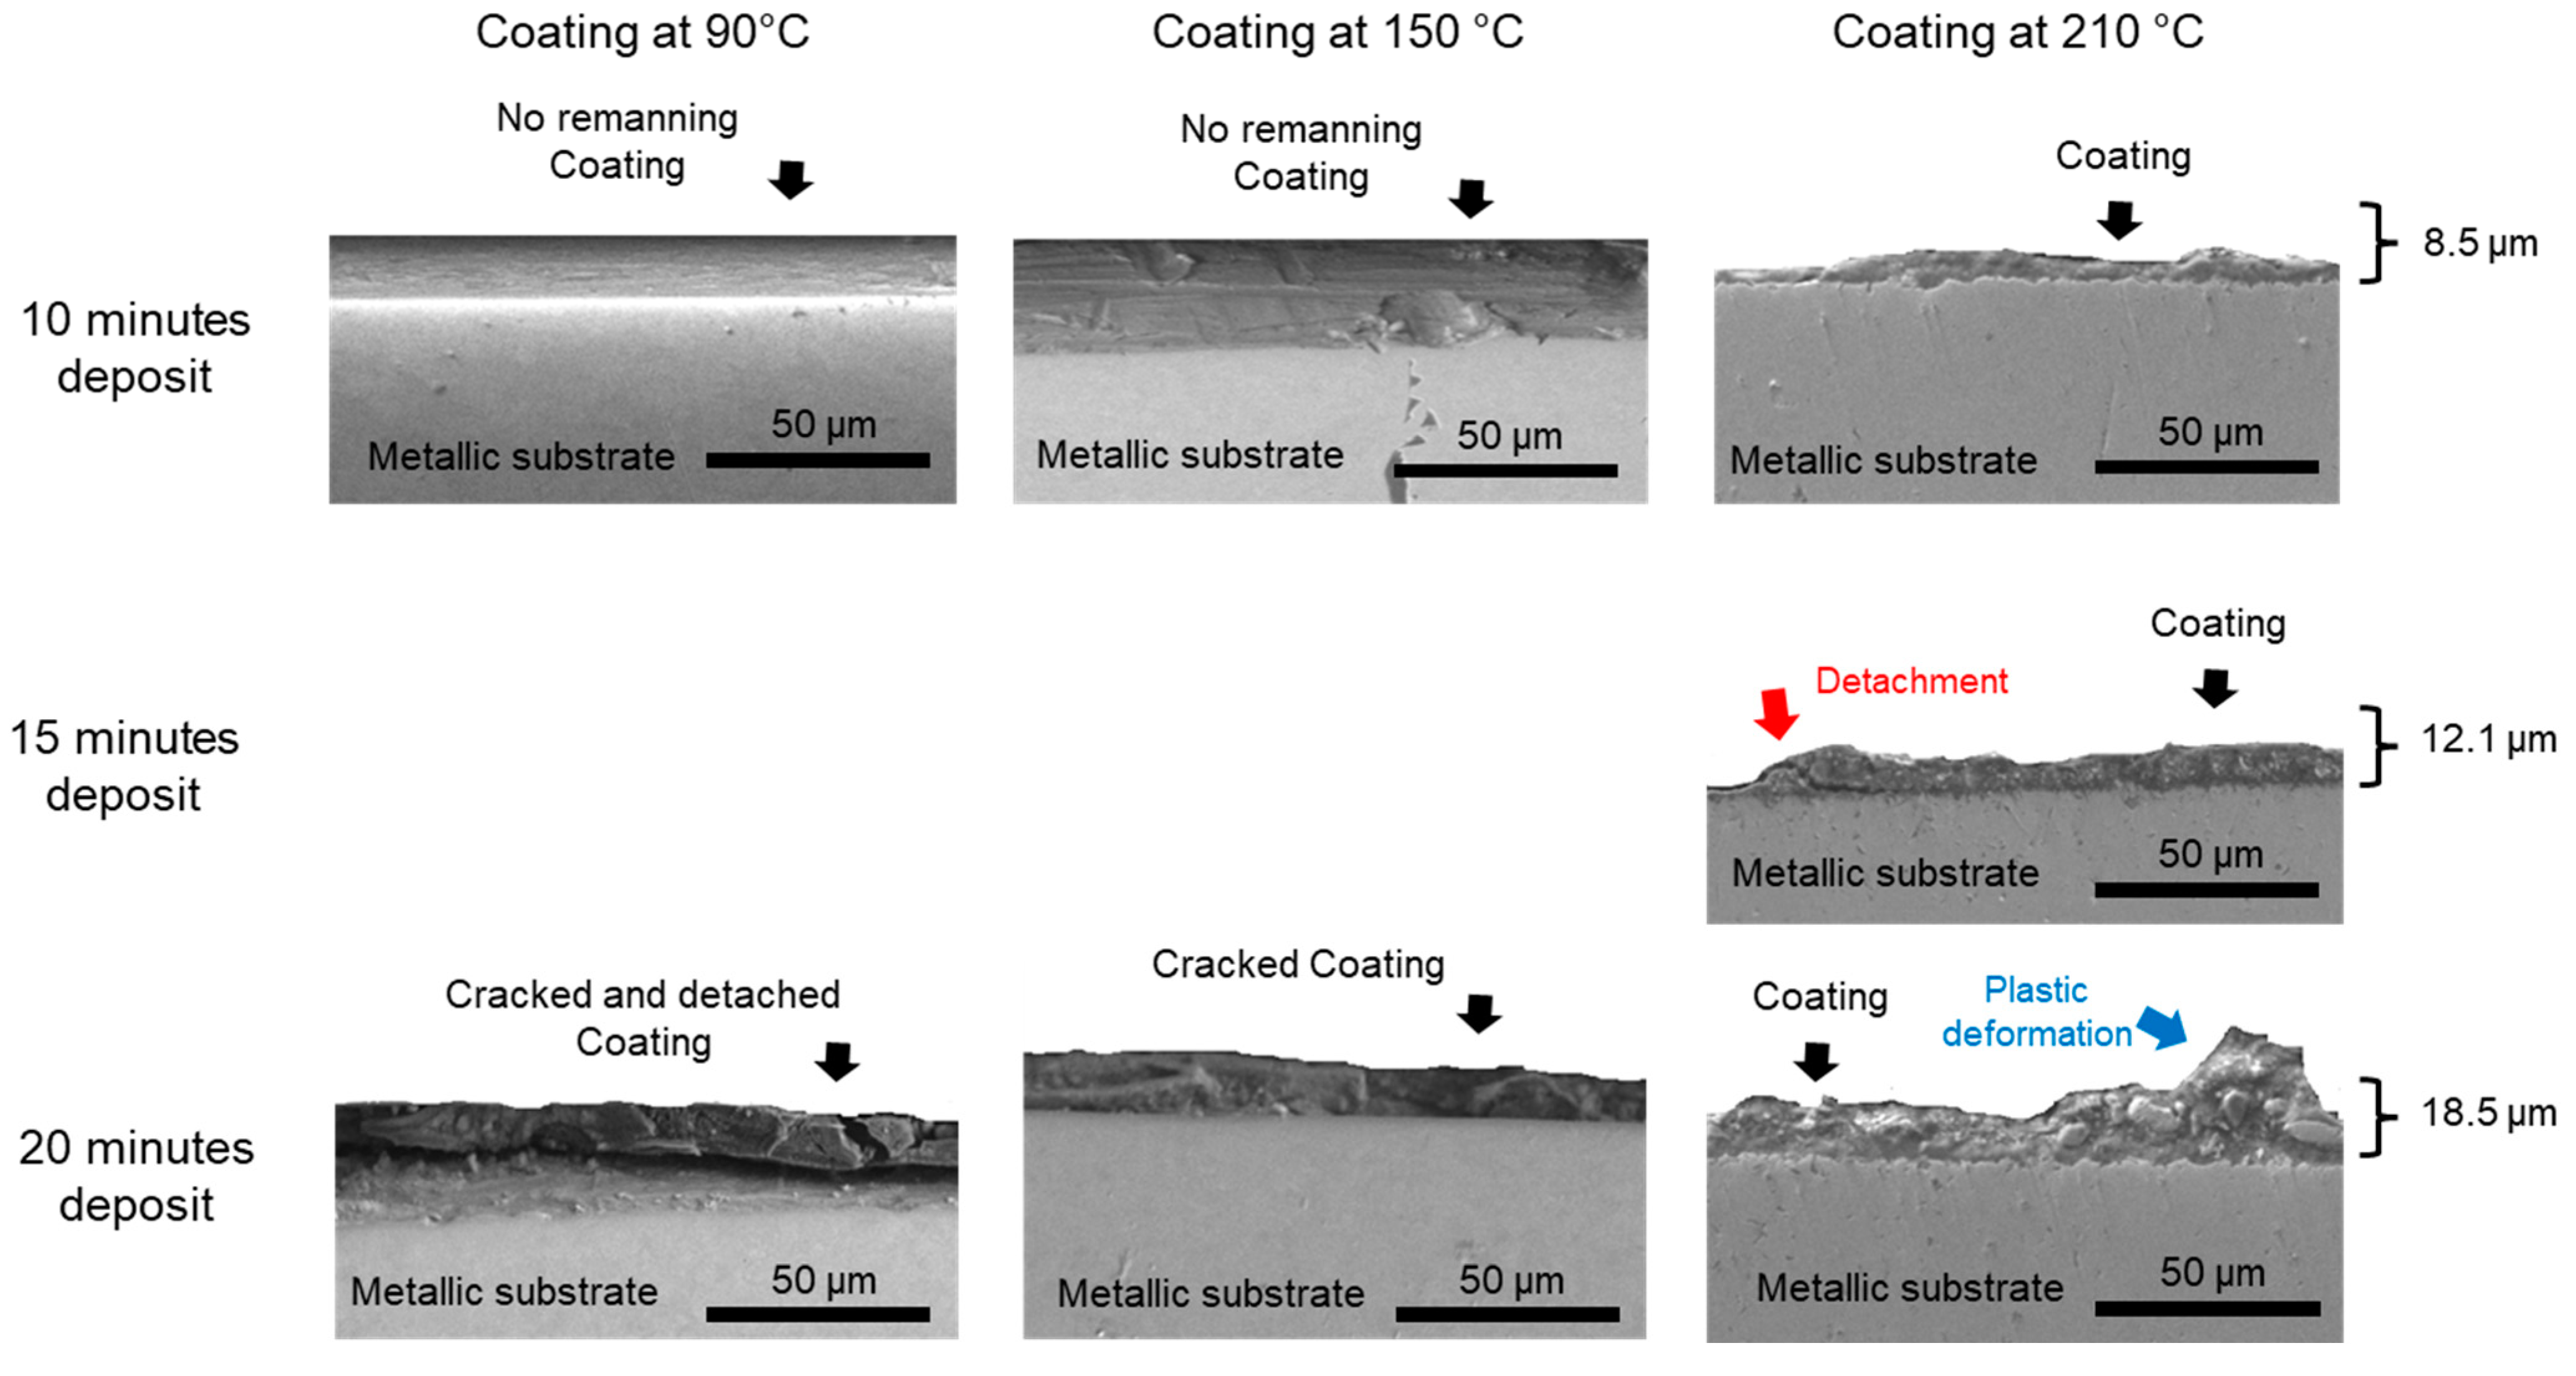
3.1. Topography of the Films

After the rectified samples were coated with the lubricant films, their surface was observed by scanning electron microscopy and compared with the morphology of a non-coated sample (Figure 5). From the uncoated sample image, a pattern of straight, parallel grooves that come from the mechanical treatment of the surface is identified (Figure 5). From the images of the samples coated with the lubricant films, the same pattern of straight and parallel grooves is identified (Figure 5). This reveals that the deposited films replicate the morphology of the surface roughness, at least at these experimental conditions. The film growth is gradual and replicates the morphology of the surface roughness.

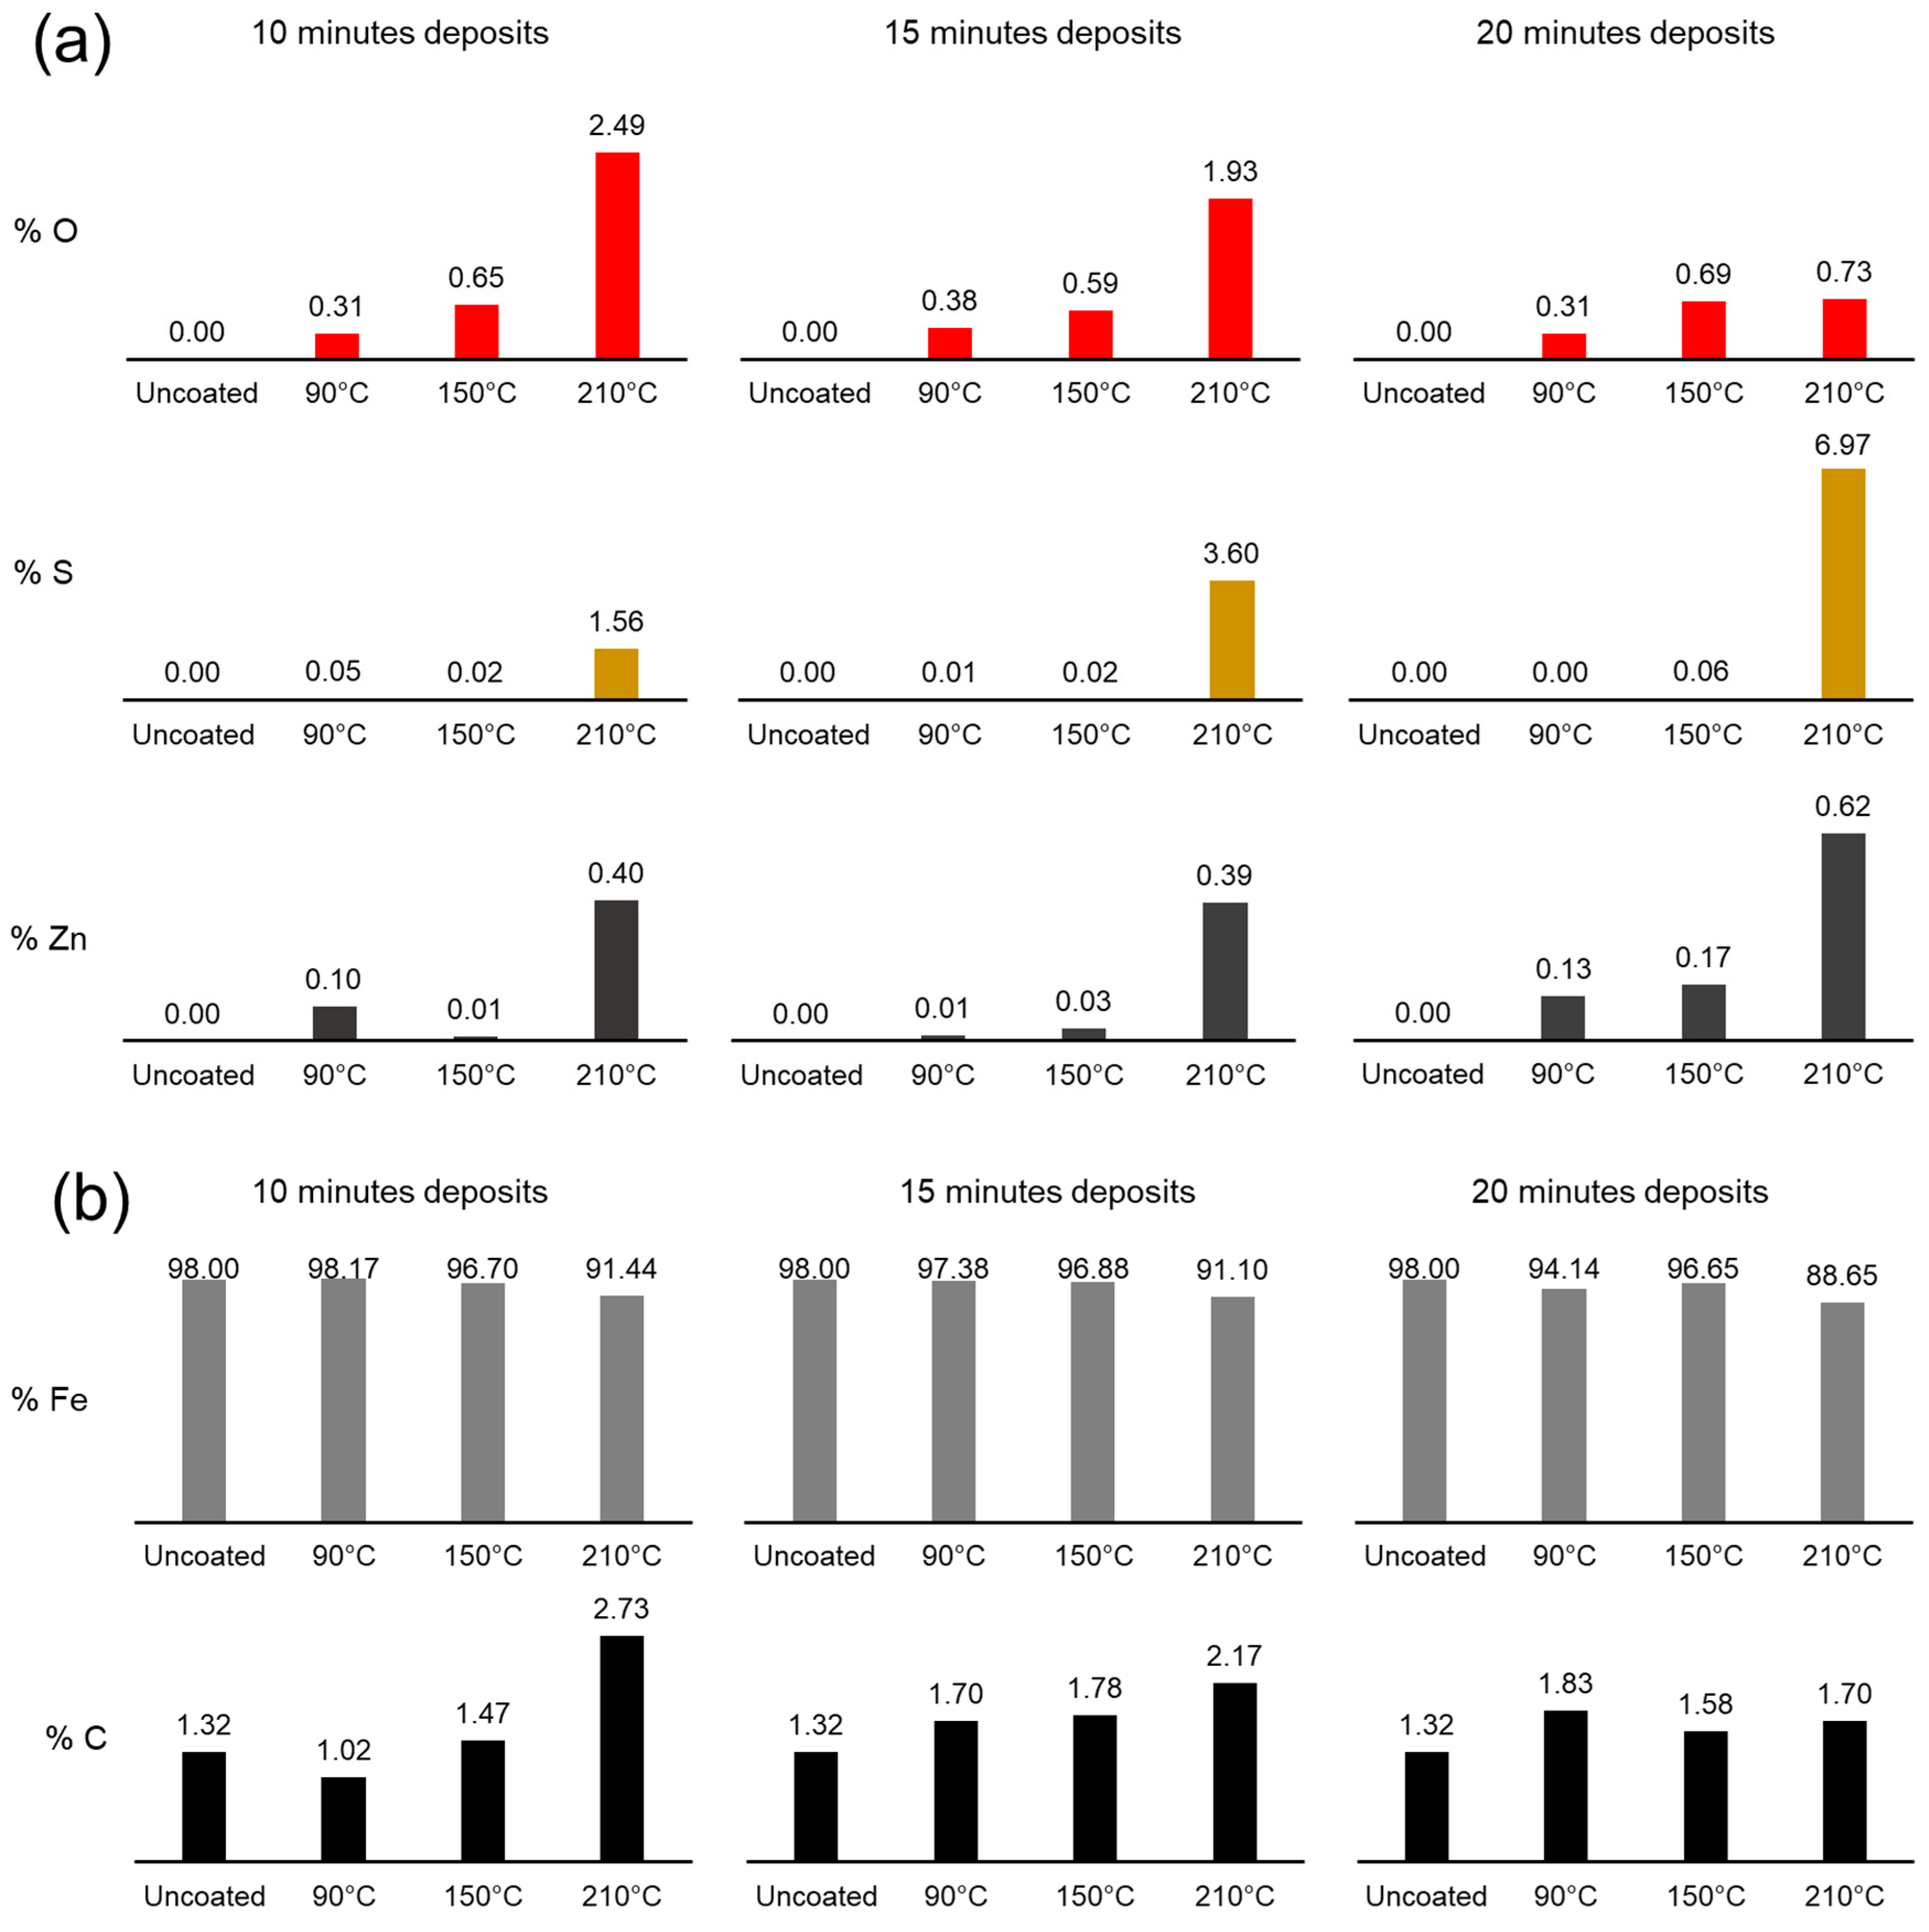
3.2. Characterization of the Films

As well as the micrographs captured of the samples, the elemental analyses of the surfaces coated with the lubricant films were estimated by energy dispersive spectroscopy (Figure 6). On the one hand, the weight percentage of the elements coming from the additives within the lubricant, such as oxygen, sulfur, and zinc, increase as the temperature of deposition increases (Figure 6a), but this behavior is not the same for all three elements when the deposition time increases. In this case, the weight percentage of sulfur and zinc increases, but the weight percentage of oxygen decreases (Figure 6a). On the other hand, the weight percentage of iron detected in the samples is around 98% since it is the main element in the metallic substrates; however, the increase of the deposition temperature and the deposition time decreases the iron percentage detected to almost 88% (Figure 6b) There is no clear trend on the weight percentage of carbon because this element is detected from both the lubricant film and the metallic substrate (Figure 6b).

3.3. Profiles of the Coefficients of Friction

From the tribological tests, the coefficients of friction (COF) versus time were obtained. This information (Figure 7a) was used to obtain the mobile mean (M) of the COF (Figure 7b), given by Equation (2).
M = i = 1 30 C O F i 30
Here, M is the average value of the COF computed from the last 30 points, so this number of points is the size of the sample or, in the case of mobile mean, the period. Please note that the profile obtained using Equation (2) contains the same number of points as raw data, less the number of points of the period. Also, please note that the value of the period was chosen arbitrarily.
The mobile standard deviation (s) of the COF (Figure 7c), given by Equation (3), was also calculated.
s = i = 1 30 C O F i M 2 30
Here, s is the mobile standard deviation of the COF computed from the last 30 points, the same points used to compute the mobile mean of the COF. Please note that the profile obtained using Equation (3) contains the same number of points as the mobile mean of the COF.
Before addressing the comparative analysis of the tribological tests, it is appropriate to discuss some details about the magnitude and shape of the M and s profiles. The M profile for the uncoated sample develops three stages or regions (Figure 8): first, taking into account only the magnitude of the coefficient of friction, a low-friction region appears where friction remains at a low level (blue frame); second, a transition region is observed (black frame) where the M profile evolves, lying between maximum and minimum peaks; third, a high-friction region (red frame) (Figure 8a). Taking into account the shape of the friction profile, the low-friction region follows a linear rise profile (blue frame), the transition region follows a normal distribution profile (black frame) that deviates close to the region of high friction, and finally, the high-friction region follows a constant profile (red frame) (Figure 8b).
Please note that in Figure 8, the friction regions are indicated by dashed colored frames: blue for the low-friction region, black for the transition region, and red for the high-friction region. This color identification is maintained throughout the text for the other graphs of the mobile mean of the friction coefficient. In addition, some colored arrows are added to relate the lettering on the graphs with the interval of time for each region in the profiles.
The s profile for the uncoated sample also develops three regions (Figure 9): first, taking into account only the magnitude of the standard deviation, a sharp-standard-deviation region appears where it evolves along a maximum peak (blue frame); second, a high-standard-deviation region (black frame) where the s profile lies among maximum and minimum peaks; third, a low-standard-deviation region (red frame) (Figure 9a). Taking into account the shape of the standard deviation profile, the sharp-standard-deviation region follows a not normal distribution curve (NN) (blue frame), the high-standard-deviation region follows a quasi-normal distribution curve (QN) (black frame), and the low-standard-deviation region follows a uniform distribution curve (U) (red frame) (Figure 9b).
Please note that in Figure 9, the friction regions are indicated by dashed colored frames: blue for the NN curve, black for the QN curve, and red for the U. This color identification is maintained throughout the text for the other graphs of the mobile standard deviation of the friction coefficient. In addition, some colored arrows are added to relate the lettering on the graphs with each curve in the profiles.
At this point, it is important to mention that the non-normal distribution curve (NN) should be associated with the pattern of the straight and parallel grooves produced during the mechanical treatment of the surface. The surface is anisotropic due to its bimodal roughness distribution (Section 2.1). The quasi-normal distribution curve (QN) should be associated with the normal distribution of the roughness resulting from the total wear of the pattern of the straight and parallel grooves. Finally, the uniform distribution curve (U) should be associated with surface wear, which leaves a wear pattern similar to that observed before the wear tests.
After this analysis, we can relate the shape of s with the shape of M, considering that the shape of s accounts for the interaction between the pin and the surface of the samples. This relationship will be important in the following analysis, which will take into account the interaction of the film deposited over samples that will modify the M and s profiles.

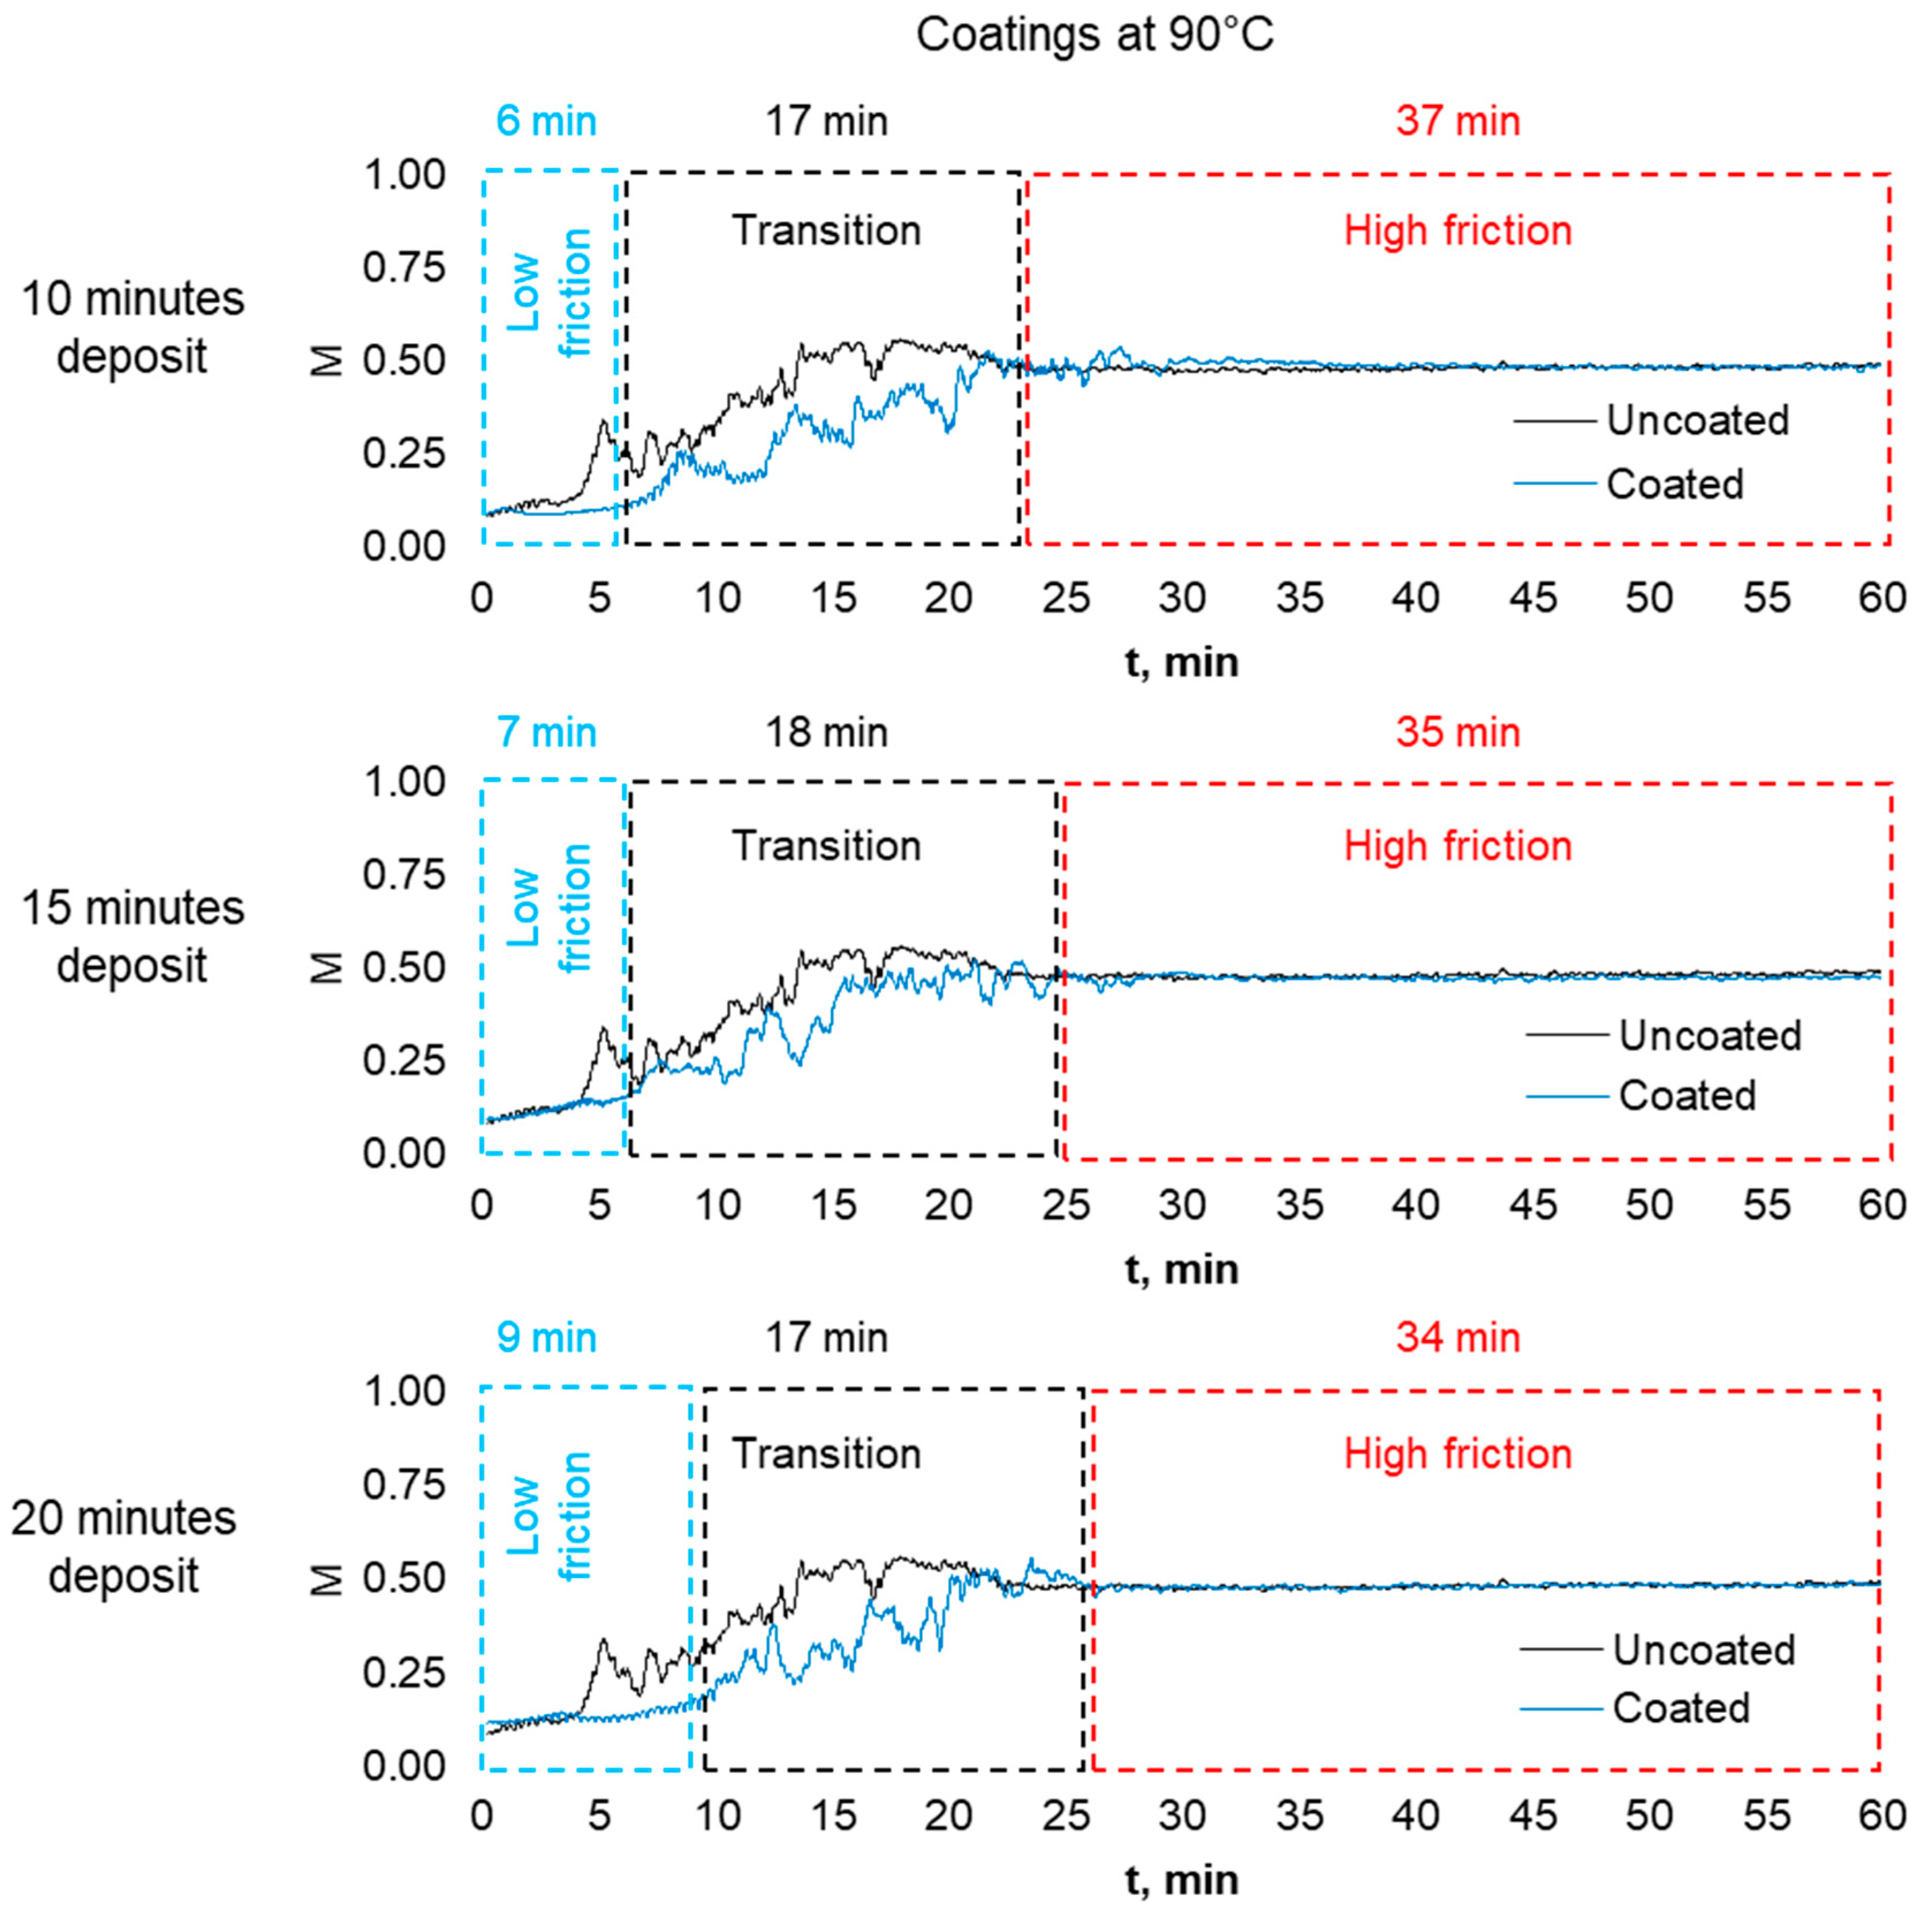
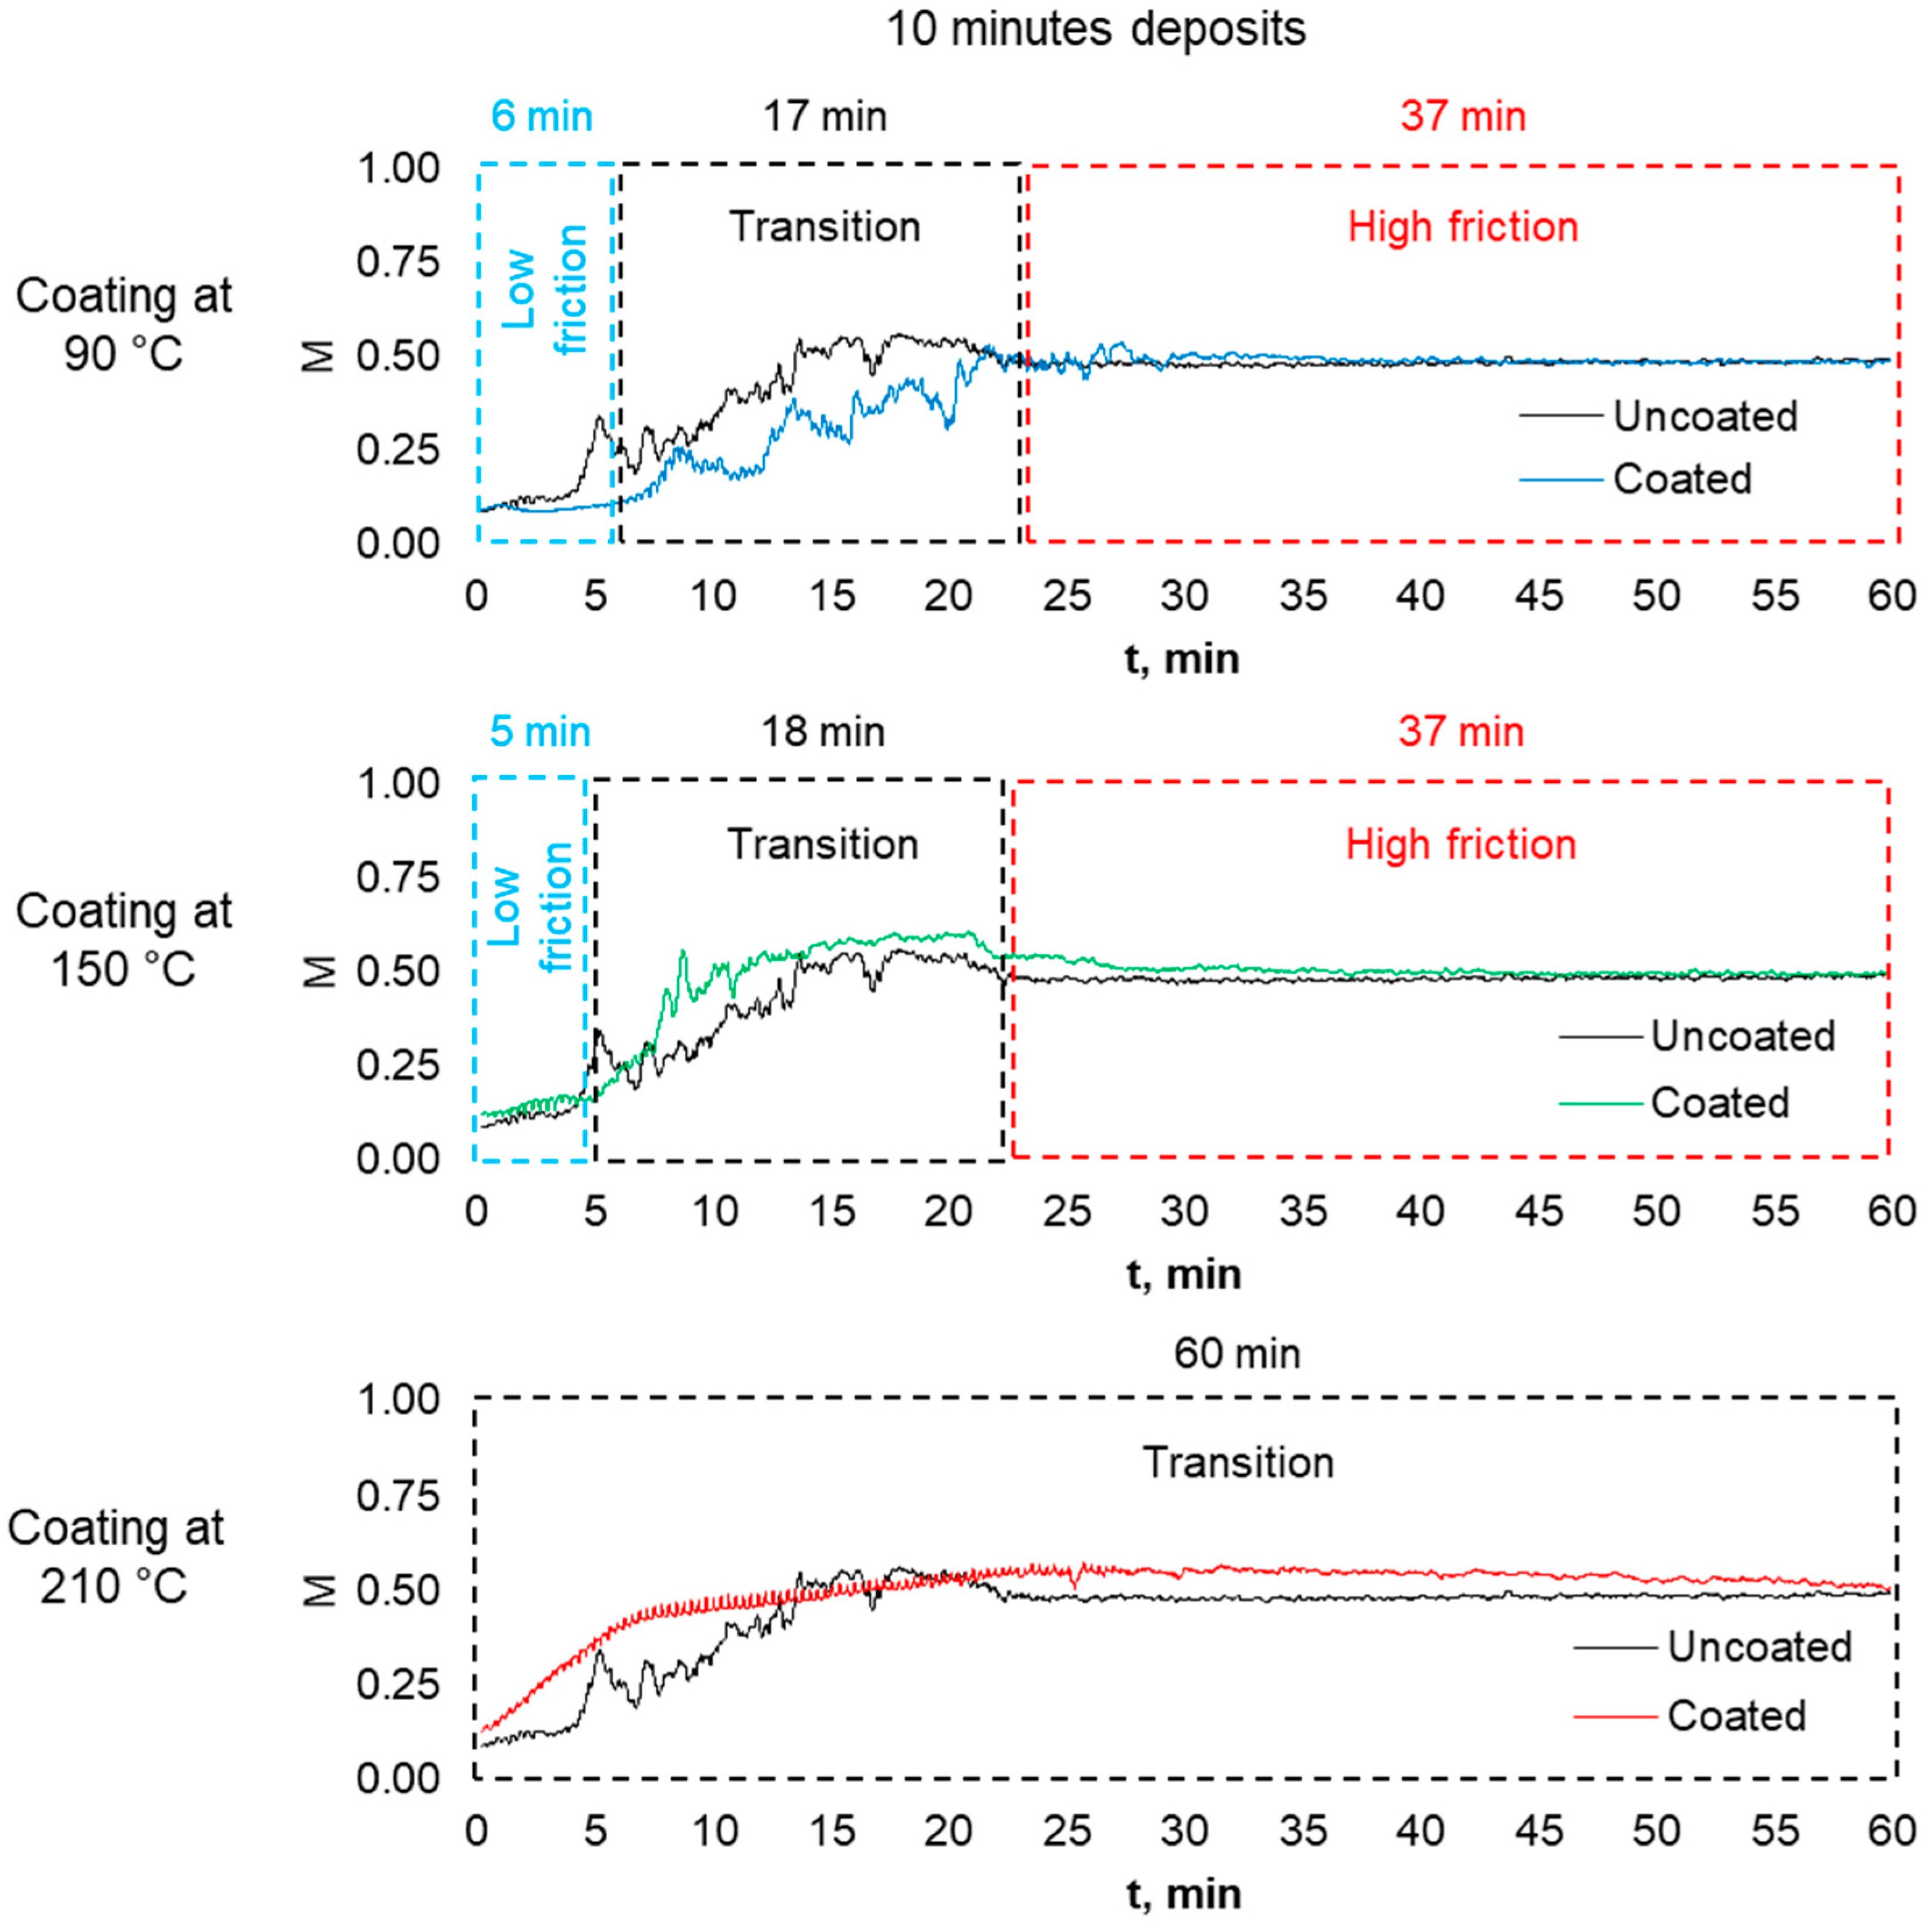
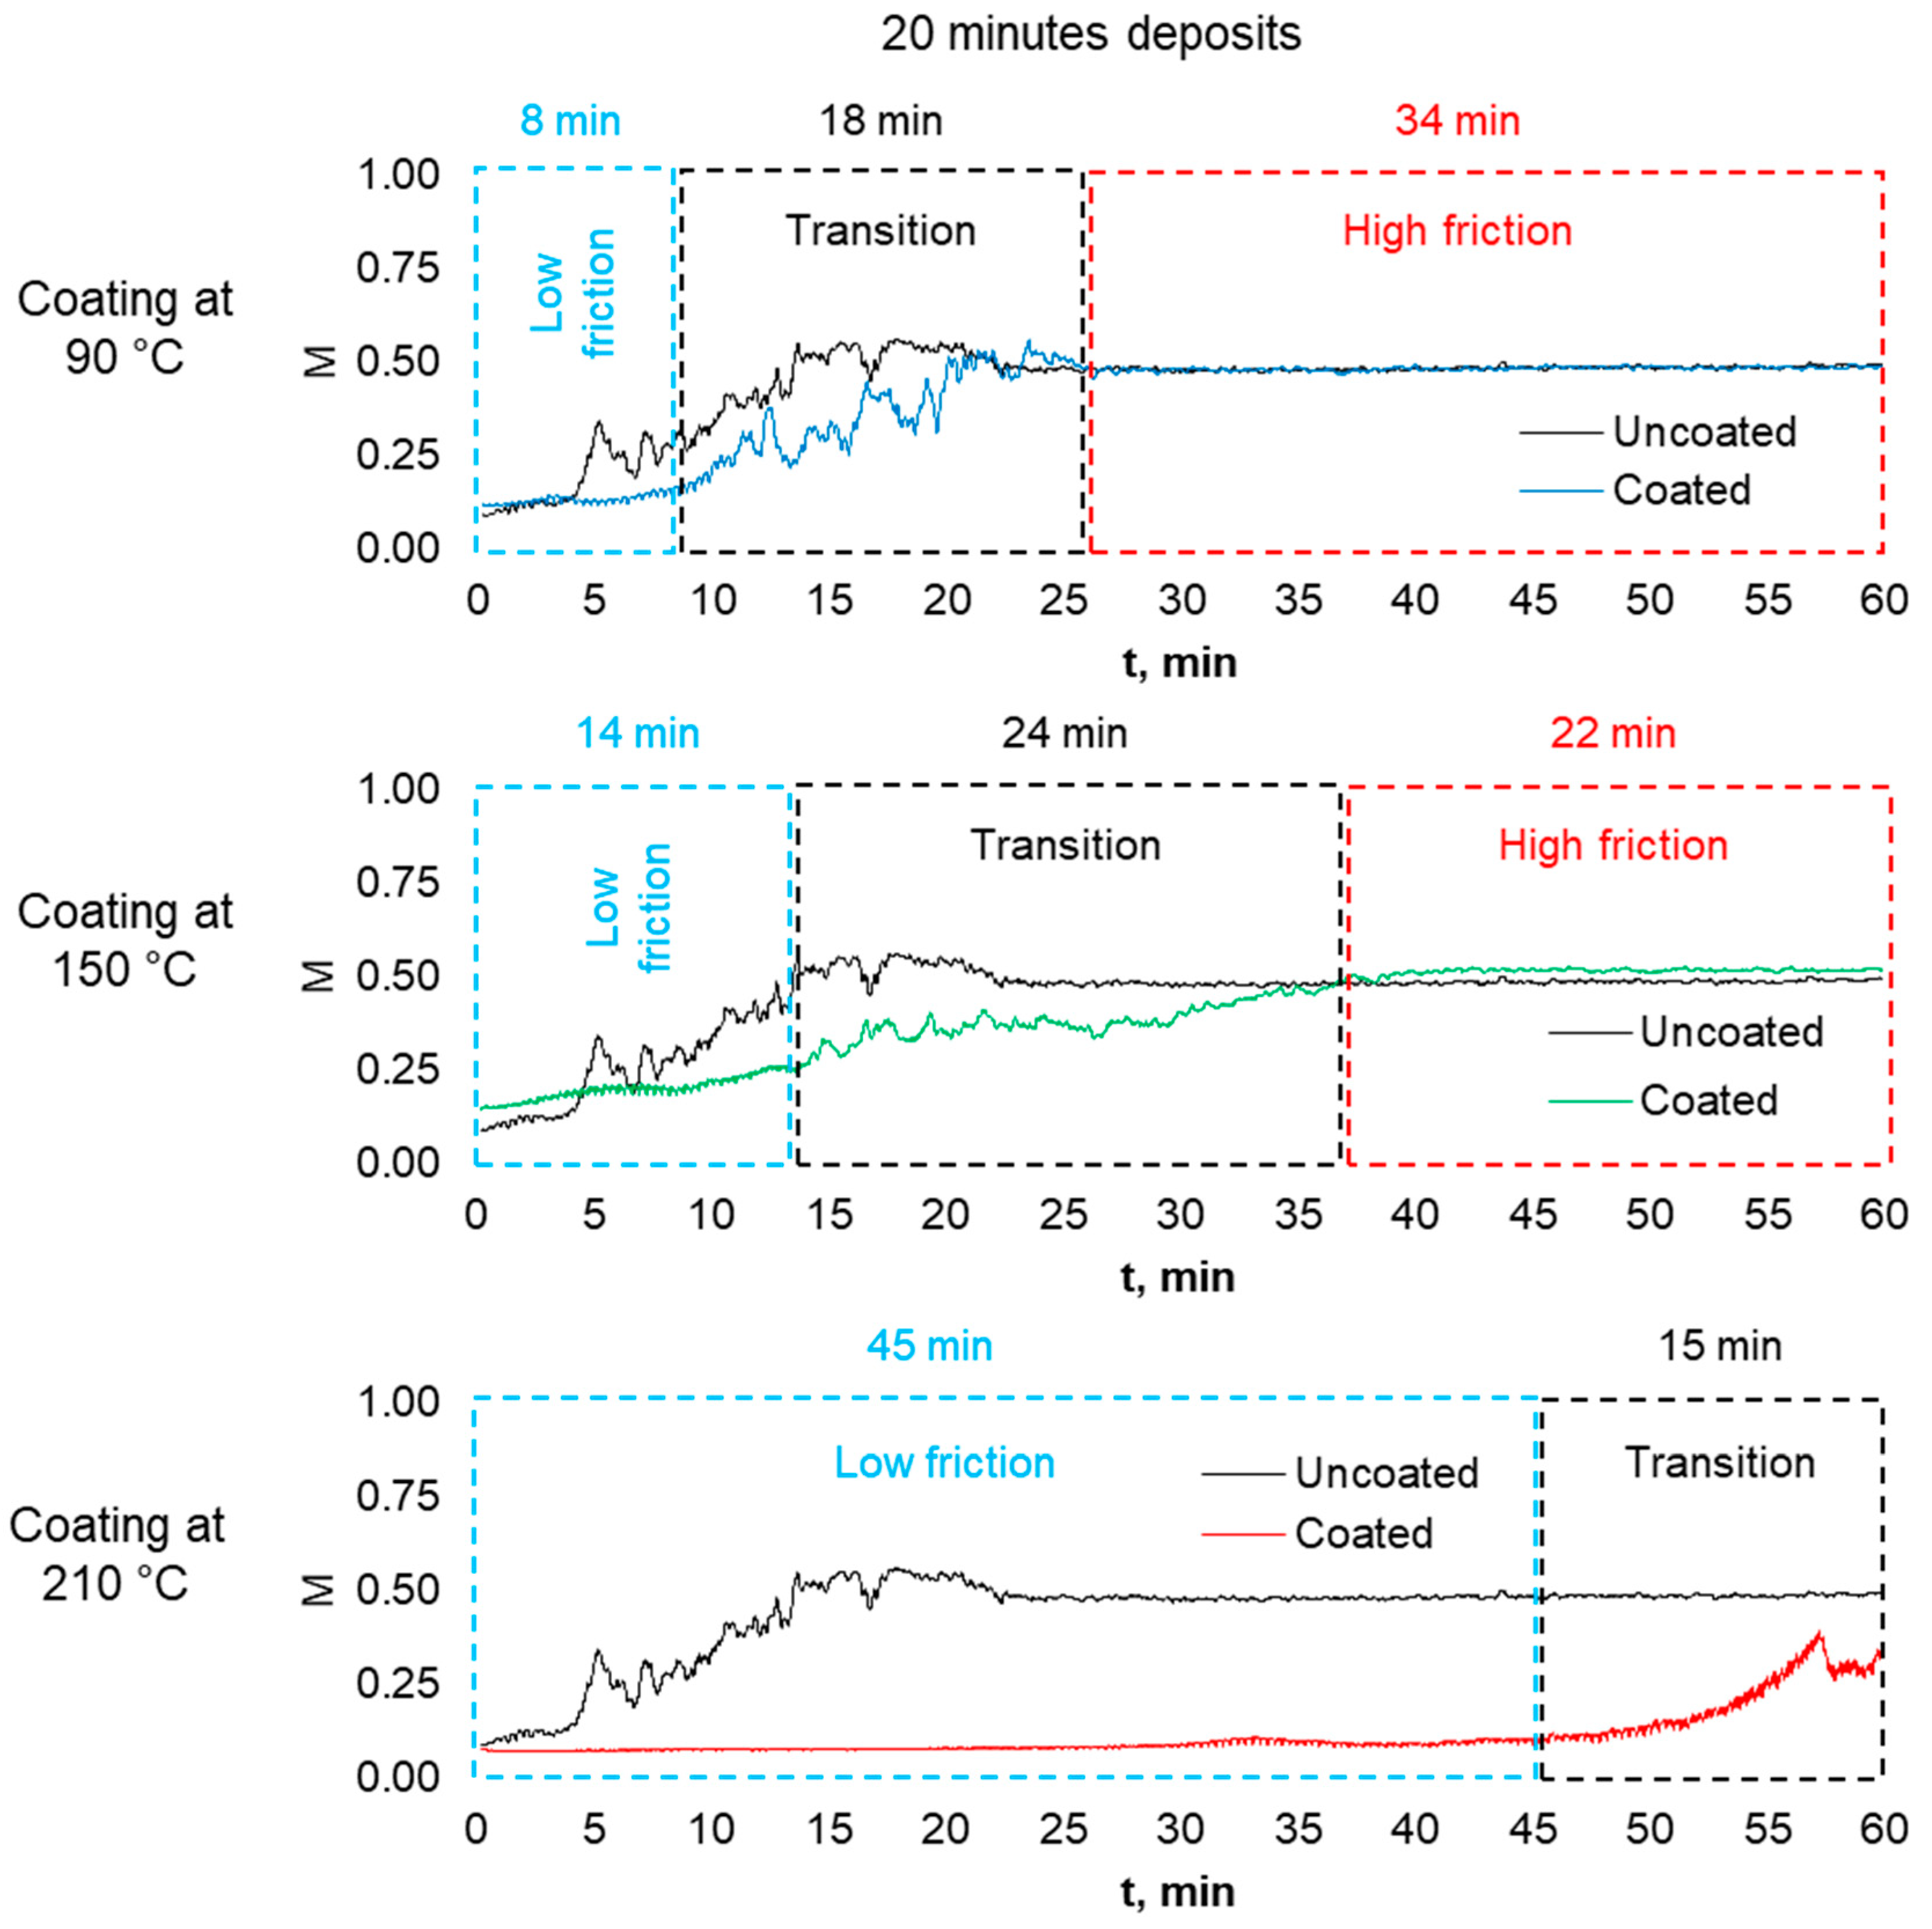
3.3.1. Profiles of the Coefficient of Friction for the Films Deposited at Low Temperature

To analyze the modification of the friction profiles resulting from the samples coated with films deposited at low temperatures, three graphs are presented in Figure 10, which compare the M profile for samples coated at 90 °C for 10, 15, and 20 min of immersion in lubricant (blue profiles), versus the M profile of the uncoated sample (black profiles). By comparing the three regions observed for the coefficient of friction, it is easy to notice the effect of the coatings in reducing friction. In the M profiles for the samples coated with the film deposited for 10, 15, and 20 min, the low-friction region lasts 6, 7, and 8 min, respectively (blue frames). The M profile of the uncoated sample shows a reduction of friction as deposition time increases. In the transition region, all three profiles last almost 18 min (black frames). Finally, the three profiles are essentially the same at the high-friction region for both the coated and uncoated samples (red frames).

3.3.2. Profiles of the Coefficient of Friction for the Films Deposited at Medium Temperature

In Figure 11, five graphs are presented that compare the M profile for samples coated at 150 °C for 10, 15, and 20 min of immersion in lubricant (green profiles) versus the M profile of the uncoated sample (black profiles). Three of these samples are central repetitions, and they were coated at 150 °C for 15 min (the graphics inside the solid black frame). With this, we demonstrate the repeatability of the experiments. In these experimental conditions, the low-friction region lasts 5 min for the sample of the 10 min coating. The same region for the three central repetitions, with 15 min of deposit, lasts 9 min on average, and this region lasts 14 min for the sample of the 20 min coating. Please note that in the low-friction region, the friction decreases as the deposition time increases; however, the transition region for the sample of the 10 min coating overlaps the M profile of the uncoated sample (Figure 11), while in the other cases, the transition regions remain below of the M profile of the uncoated sample. A deeper discussion regarding the superposition of the M profiles for coated samples will be addressed later in the analysis of s profiles (Section 3.4).

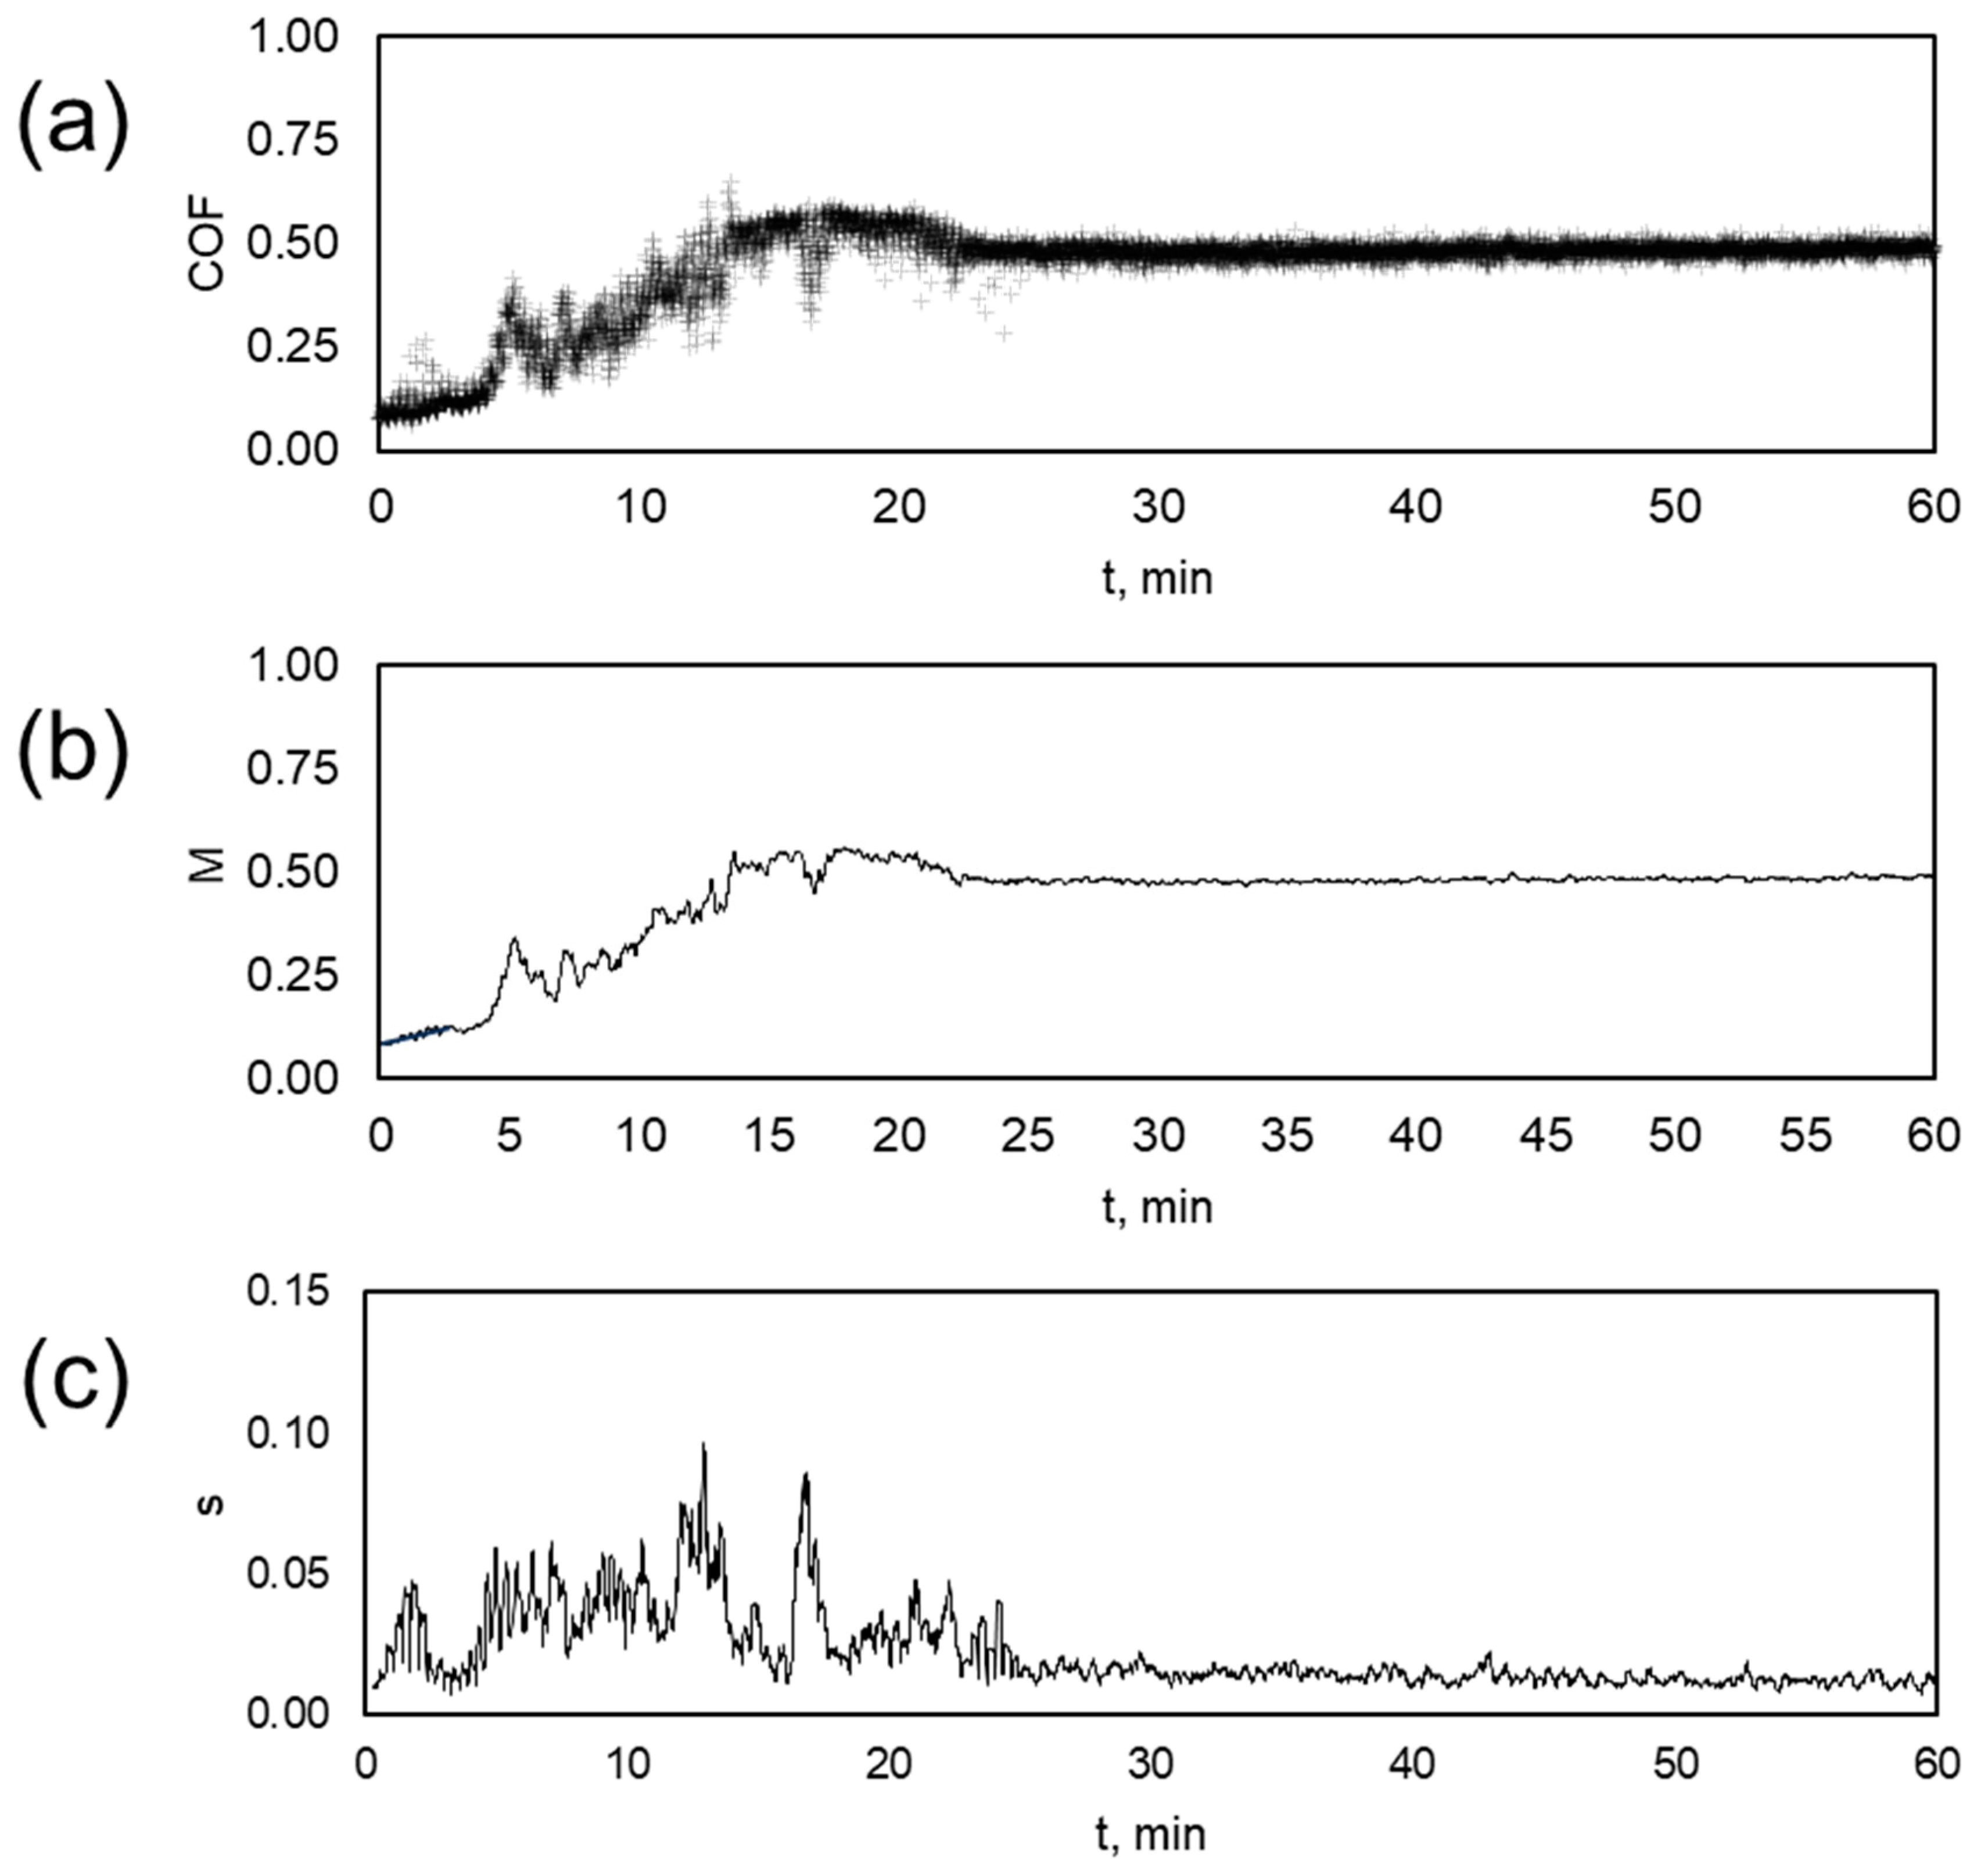
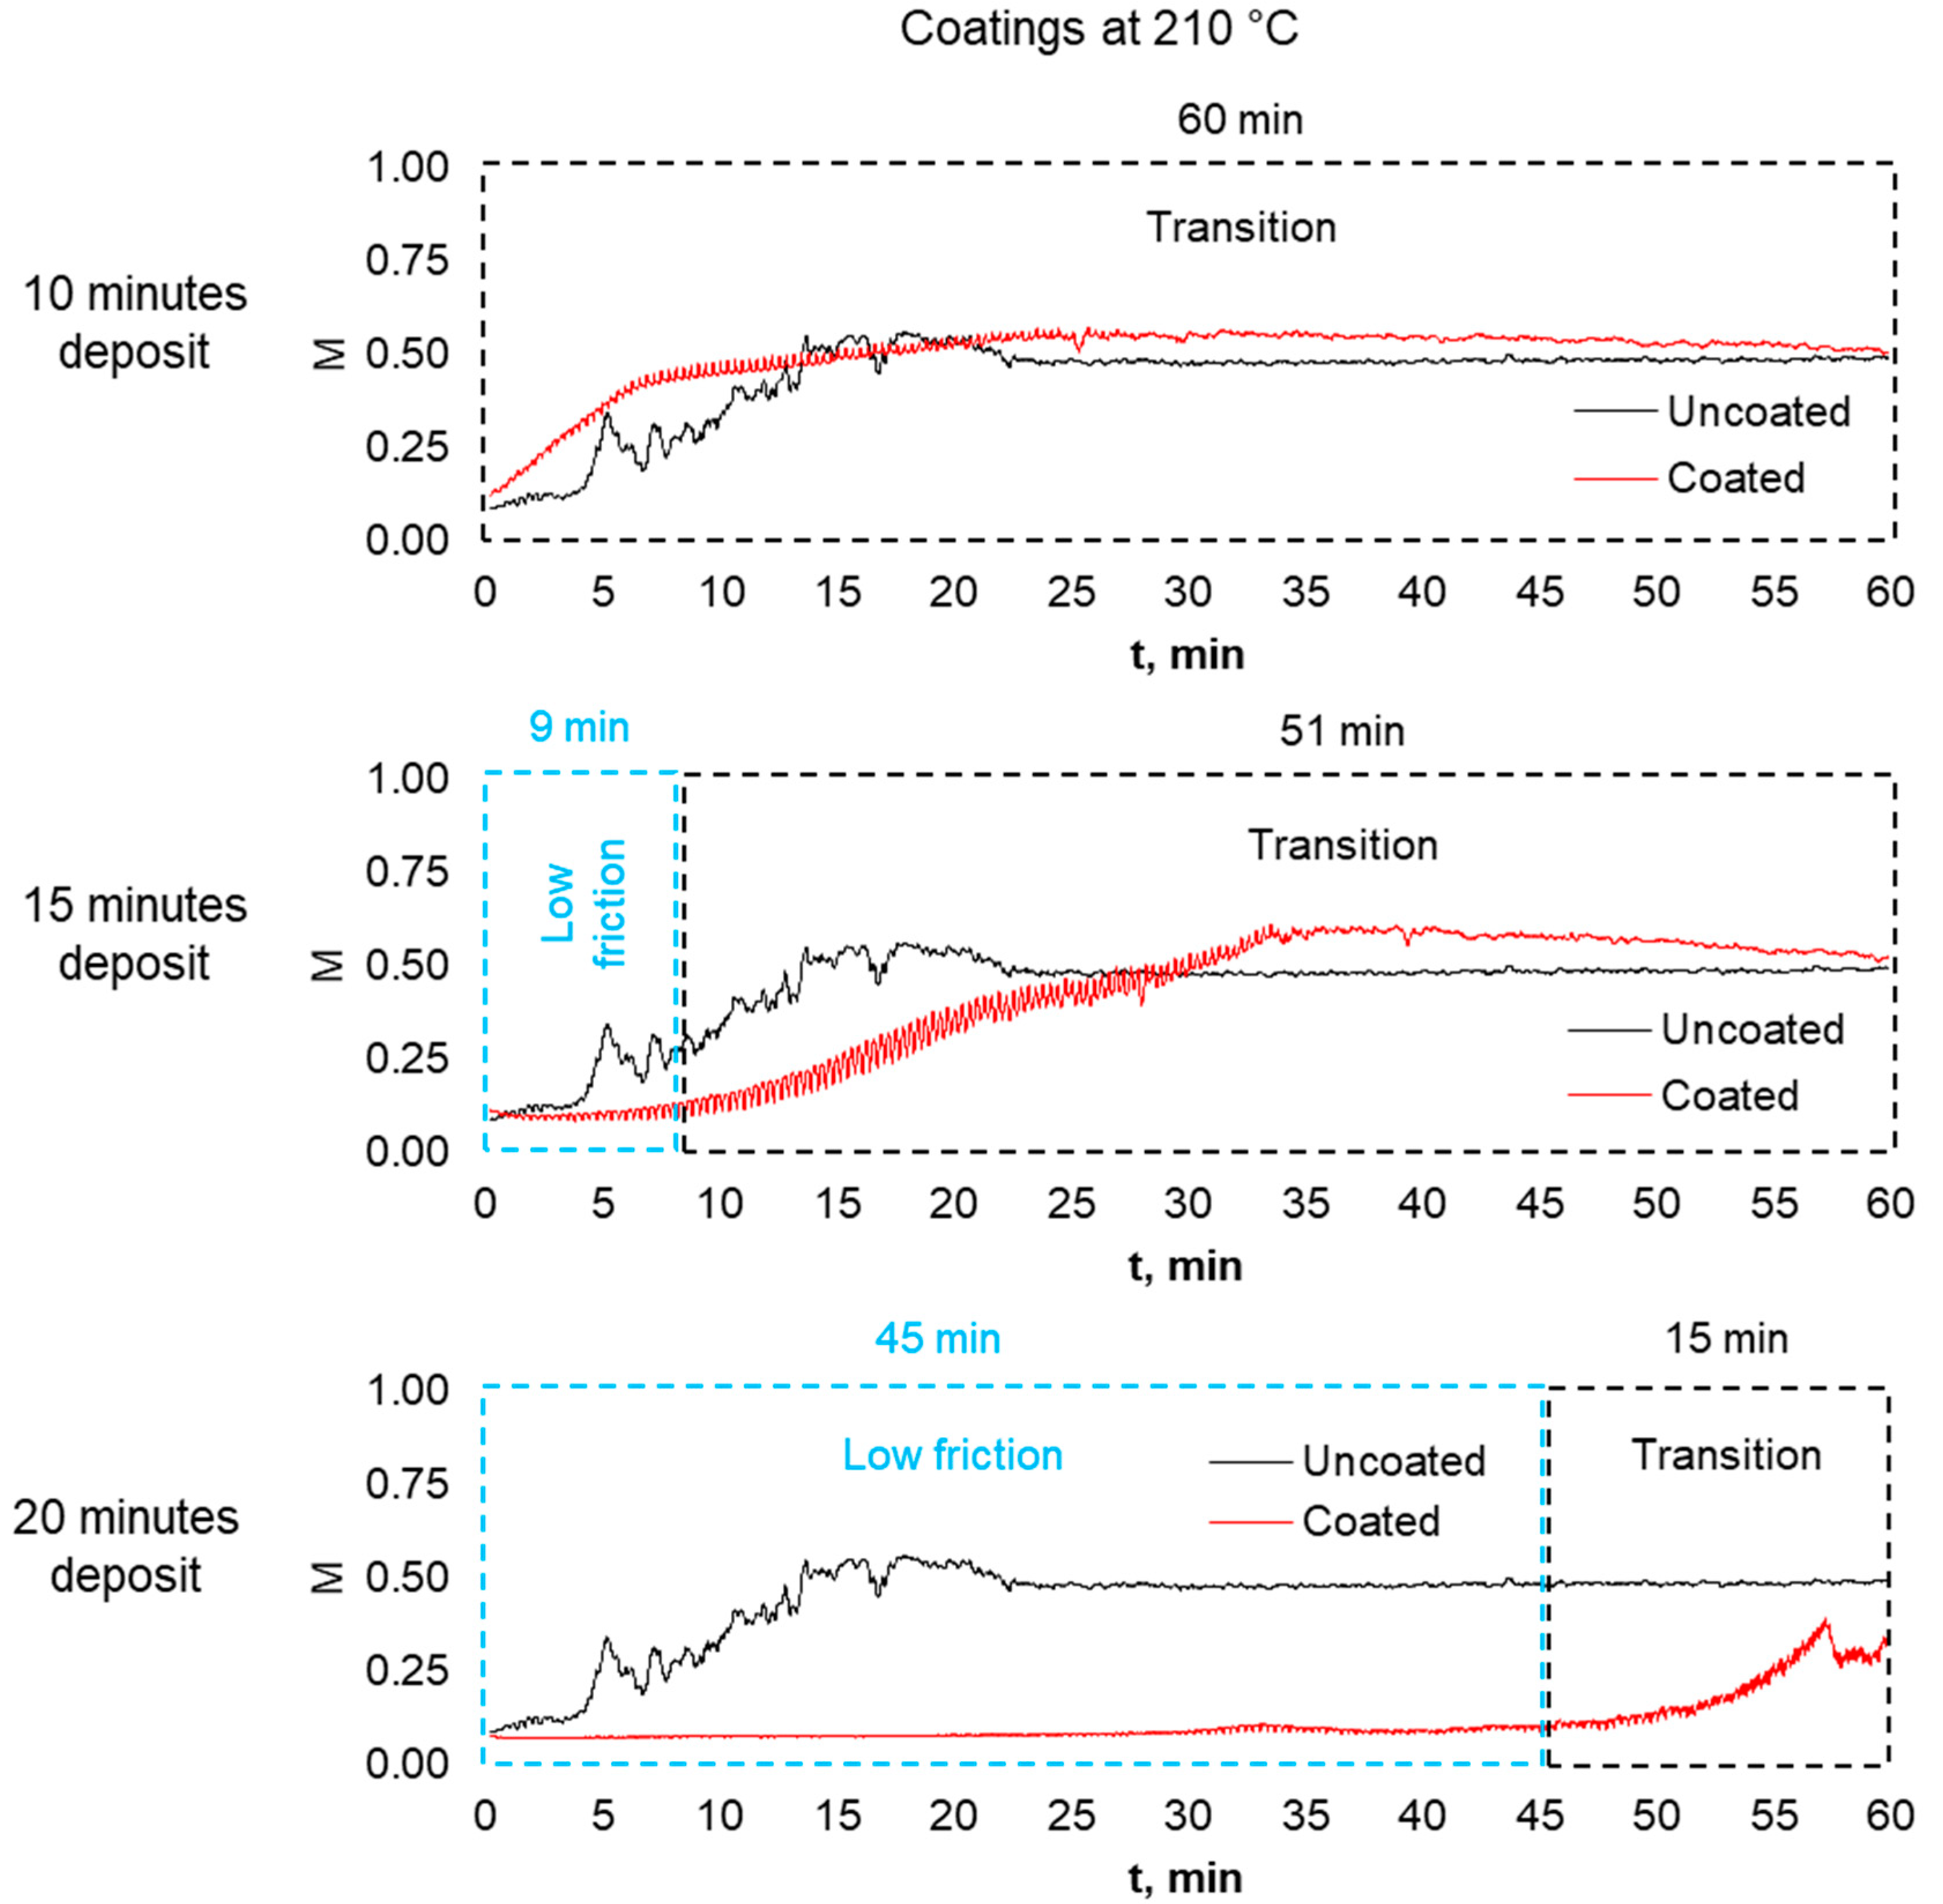
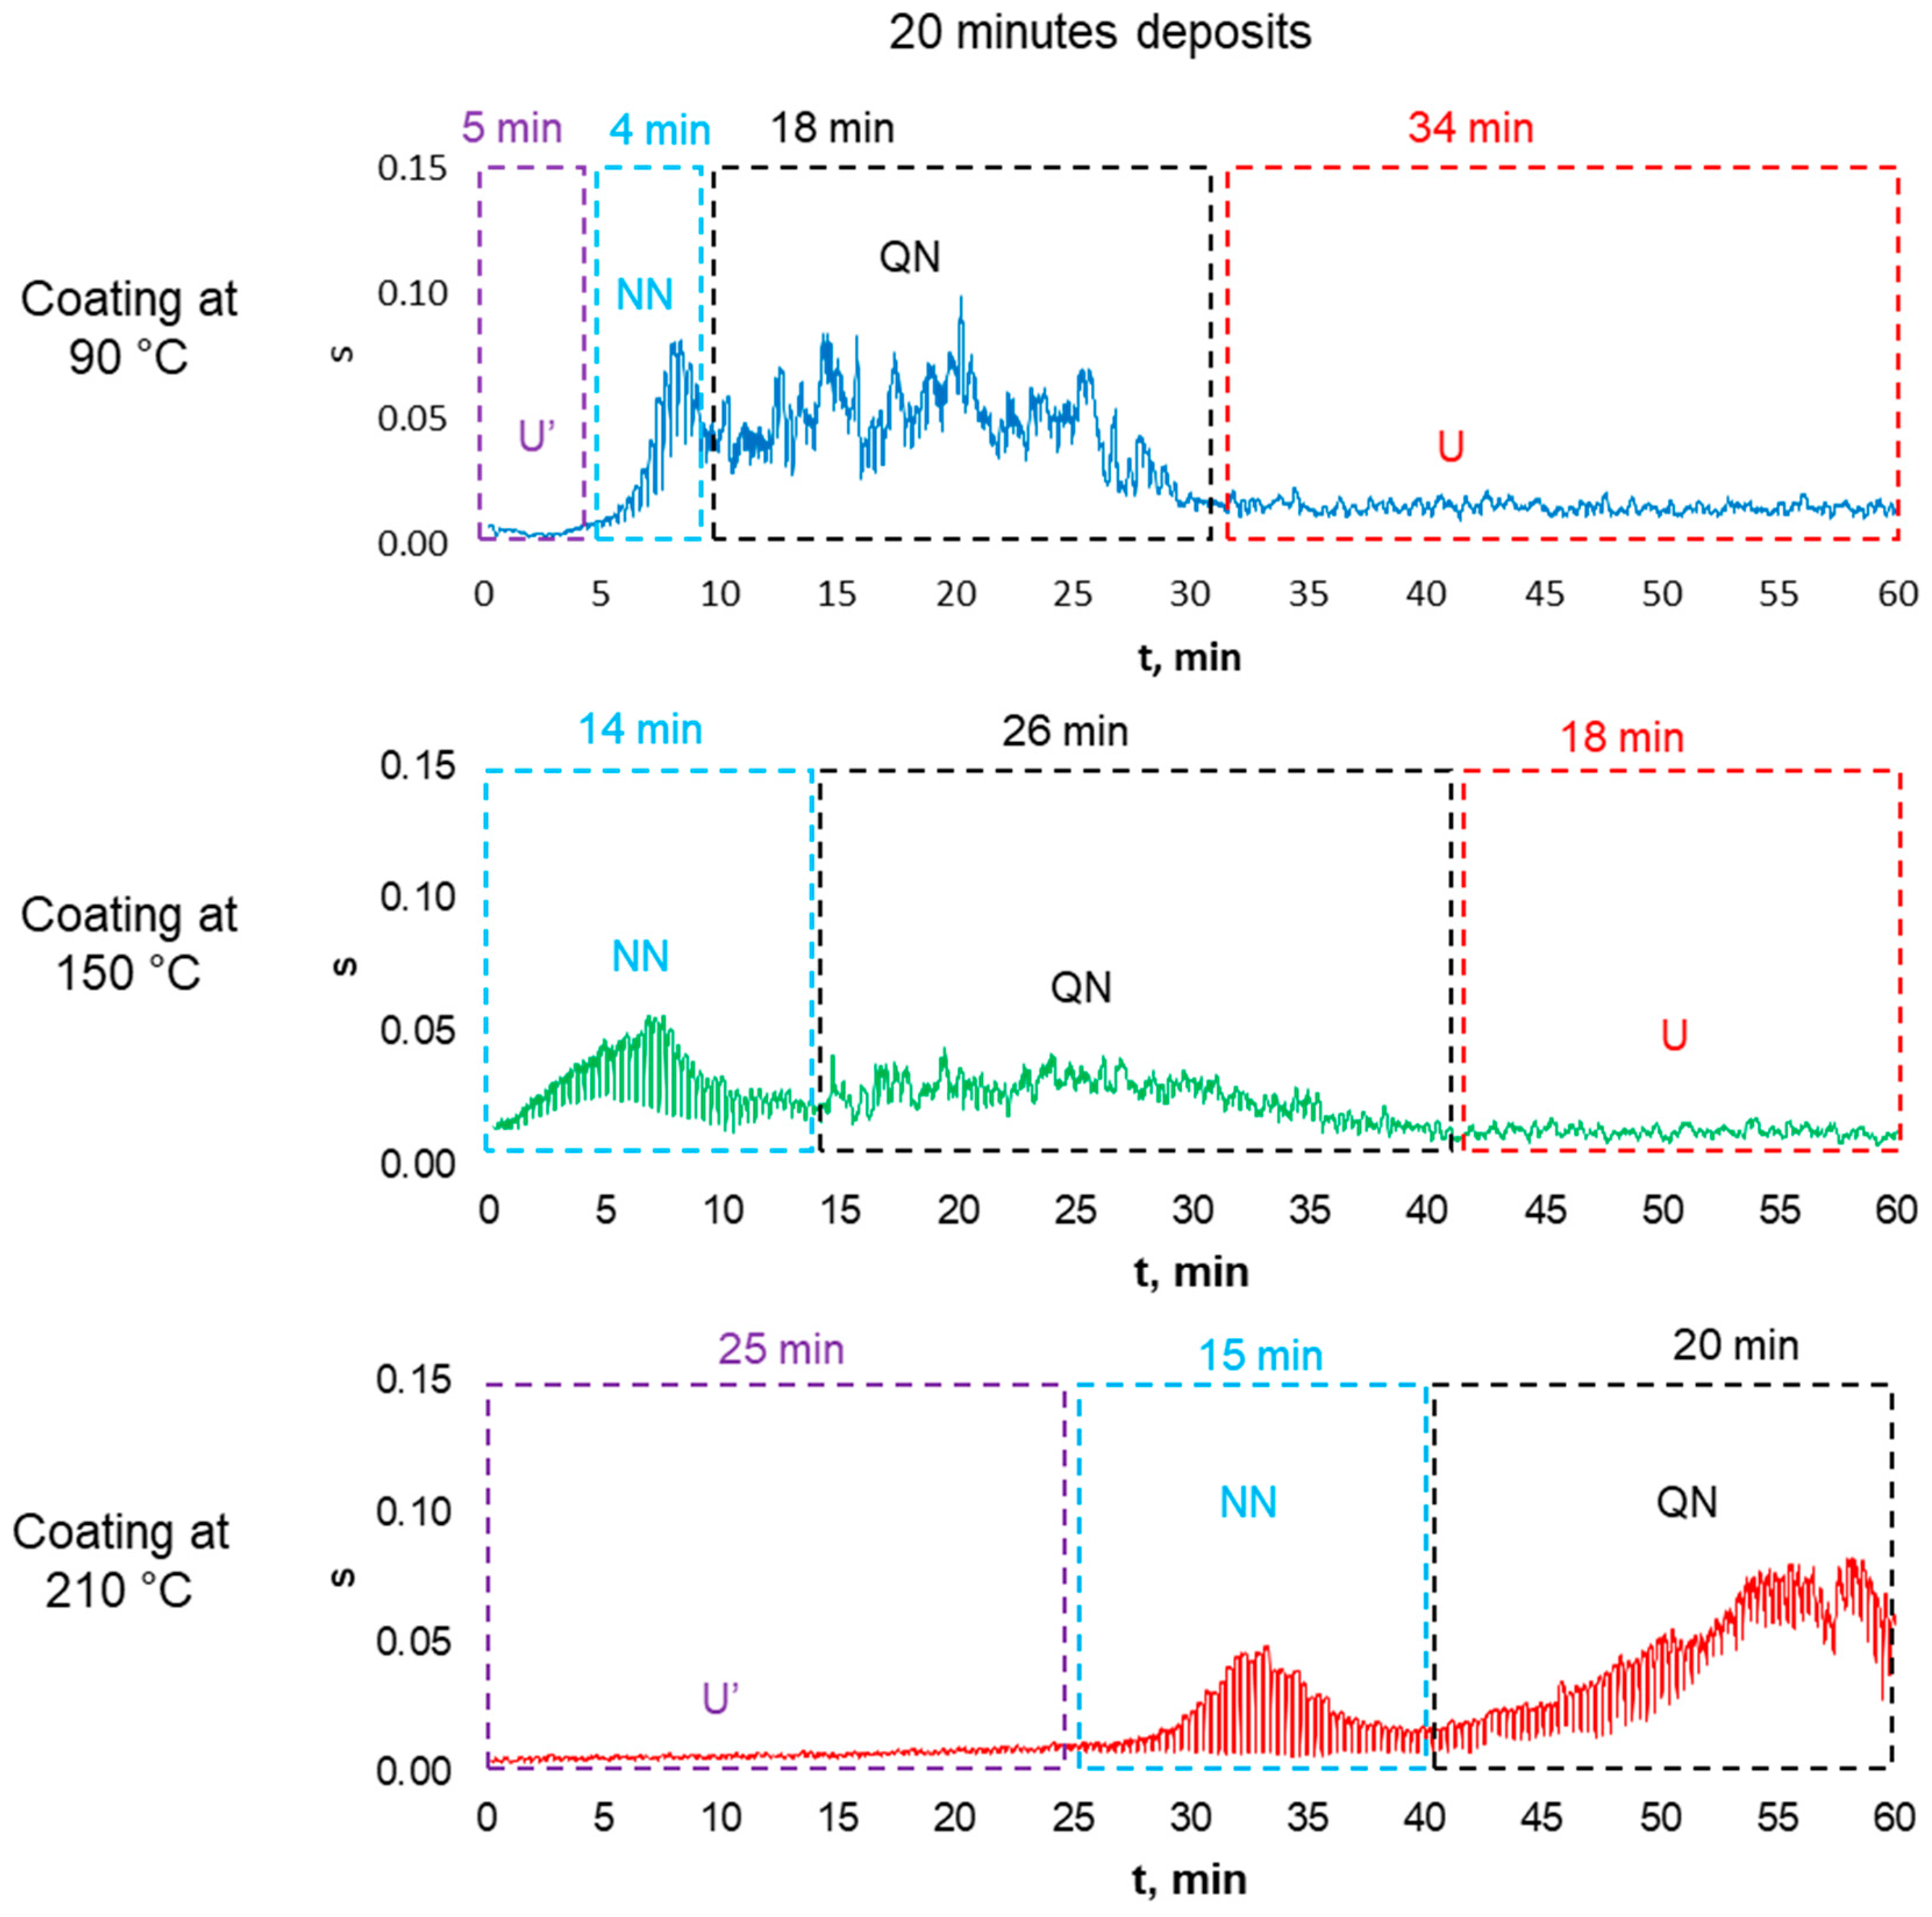
3.3.3. Profiles of the Coefficient of Friction for the Films Deposited at High Temperature

Three graphs are presented in Figure 12, which compare the M profile for samples coated at 210 °C for 10, 15, and 20 min of immersion in lubricant (red profiles) versus the M profile of the uncoated samples (black profiles). In these experimental conditions, there is no low-friction region for the sample of the 10 min coating. The low-friction region for the samples coated for 15 min lasts around 9 min, although it is not clear when it ends. This region lasts 45 min for the sample to be coated for 20 min. Please note that from the beginning to end, the M profile for the sample coated at 210 °C for 10 min overlaps the M profile for the uncoated sample with a not favorable performance. Please also note that the low-friction region for the sample coated for 20 min is much longer than all the other cases.

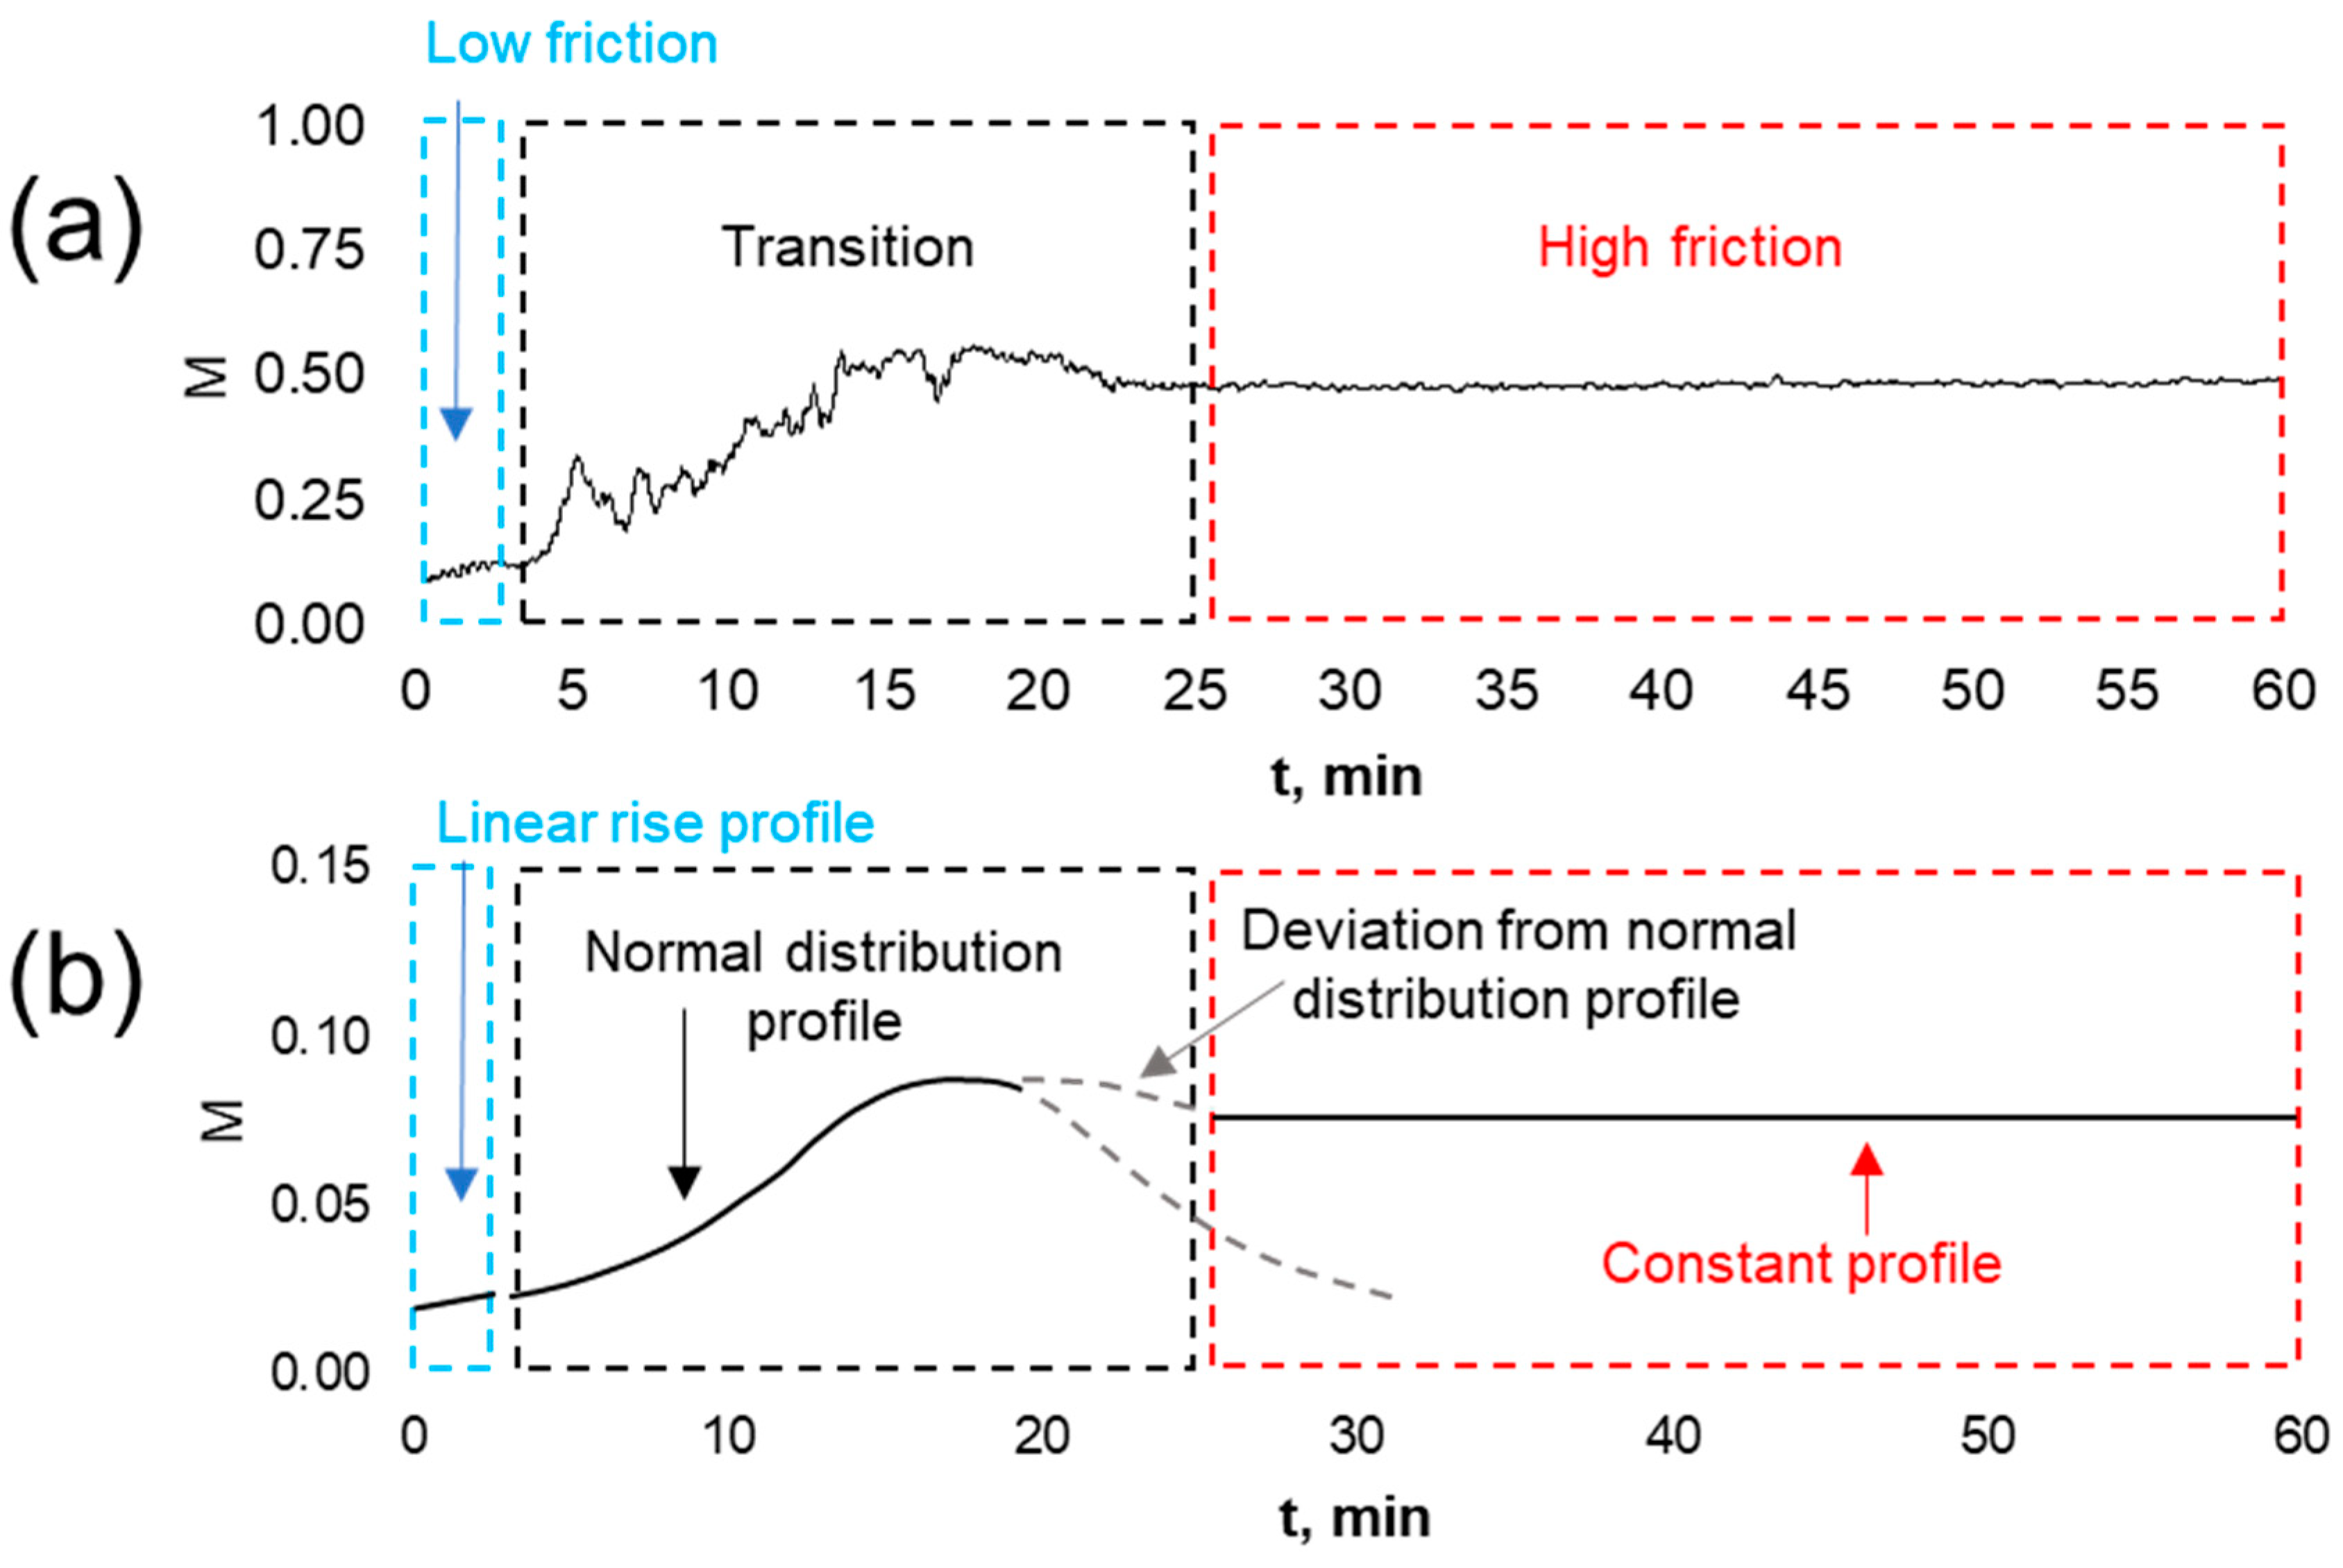
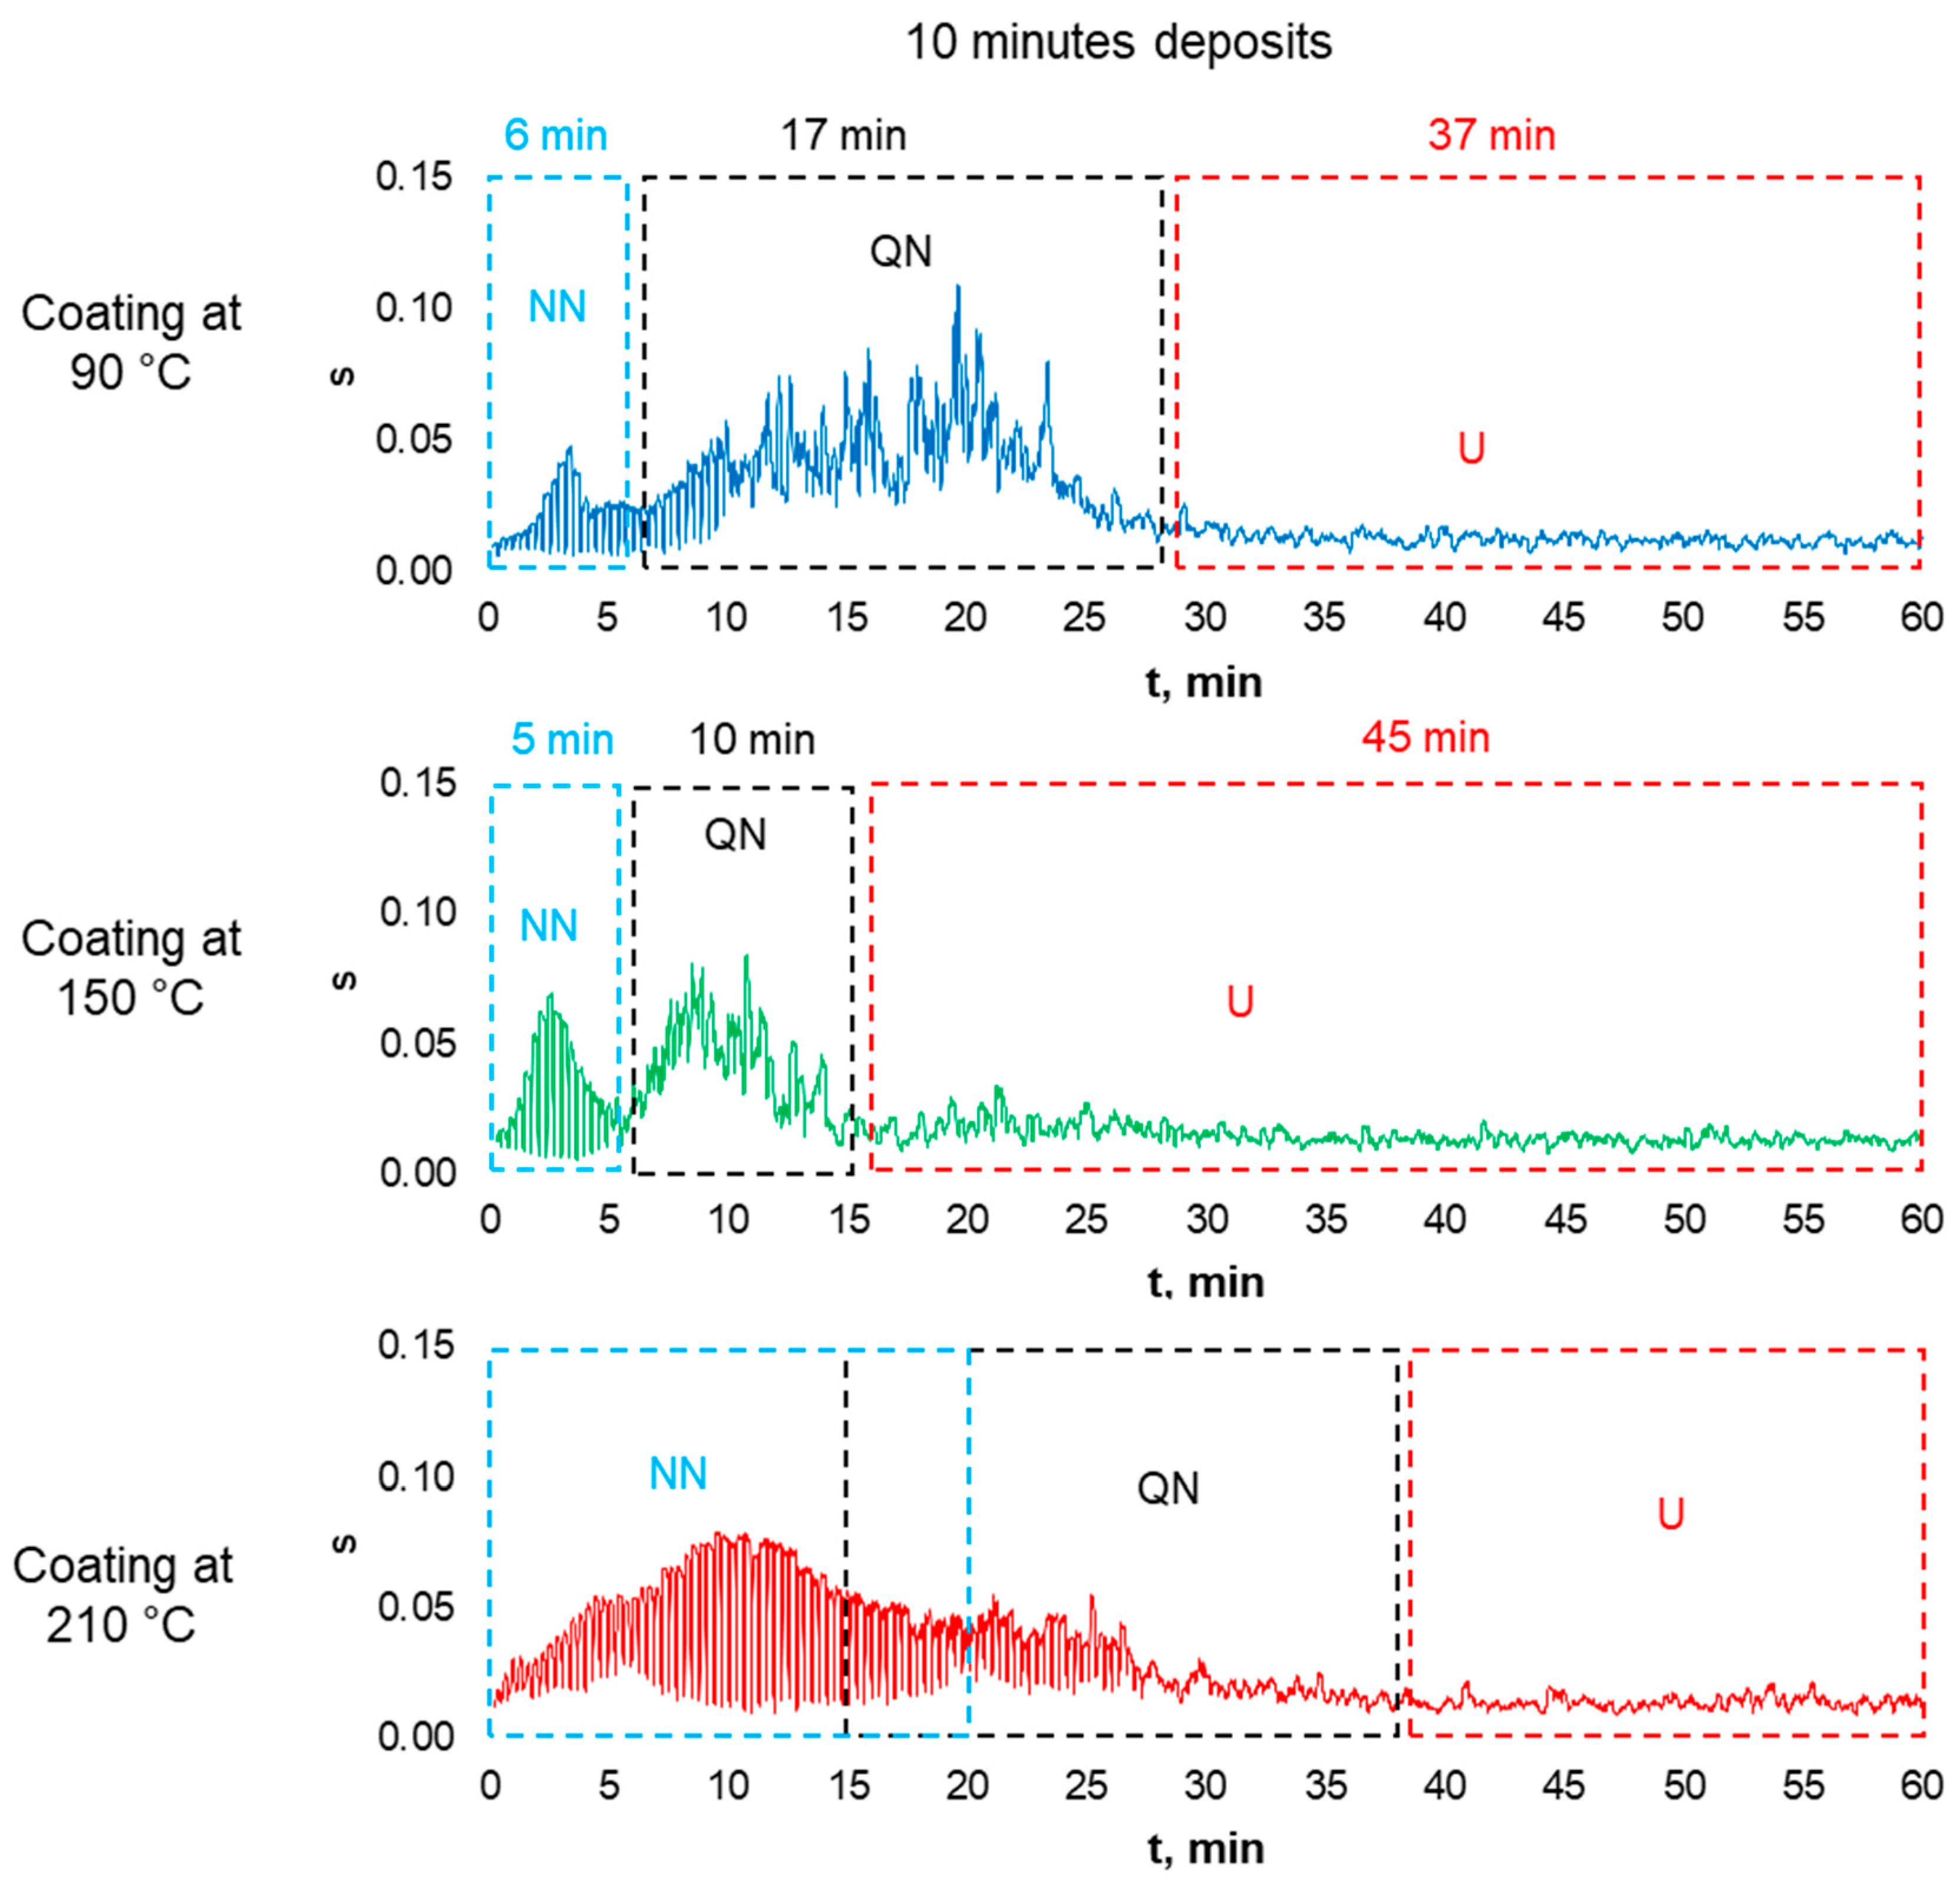
3.3.4. Effect of the Temperature in the Mobile Mean of the Coefficient of Friction

Another way to analyze the mobile mean of the coefficient of friction for the coated samples is by looking at the changes in the friction regions when the deposit time is constant but the deposition temperature is changed. In this way, two phenomena deserve to be discussed: on the one hand, looking at the three M profiles for samples coated for 10 min, it is evident that, for a short deposition time, the increasing of the temperature promotes the overlapping of the uncoated sample M profile, and, at the same time, it promotes the reduction of the low-friction region (Figure 13).
On the other hand, by looking at the three M profiles for samples coated for 20 min, it is evident that a longer deposition time and increasing temperature promote the increase of duration of the low-friction regions (Figure 14) in contrast to the behavior of the samples coated for 10 min (Figure 13).

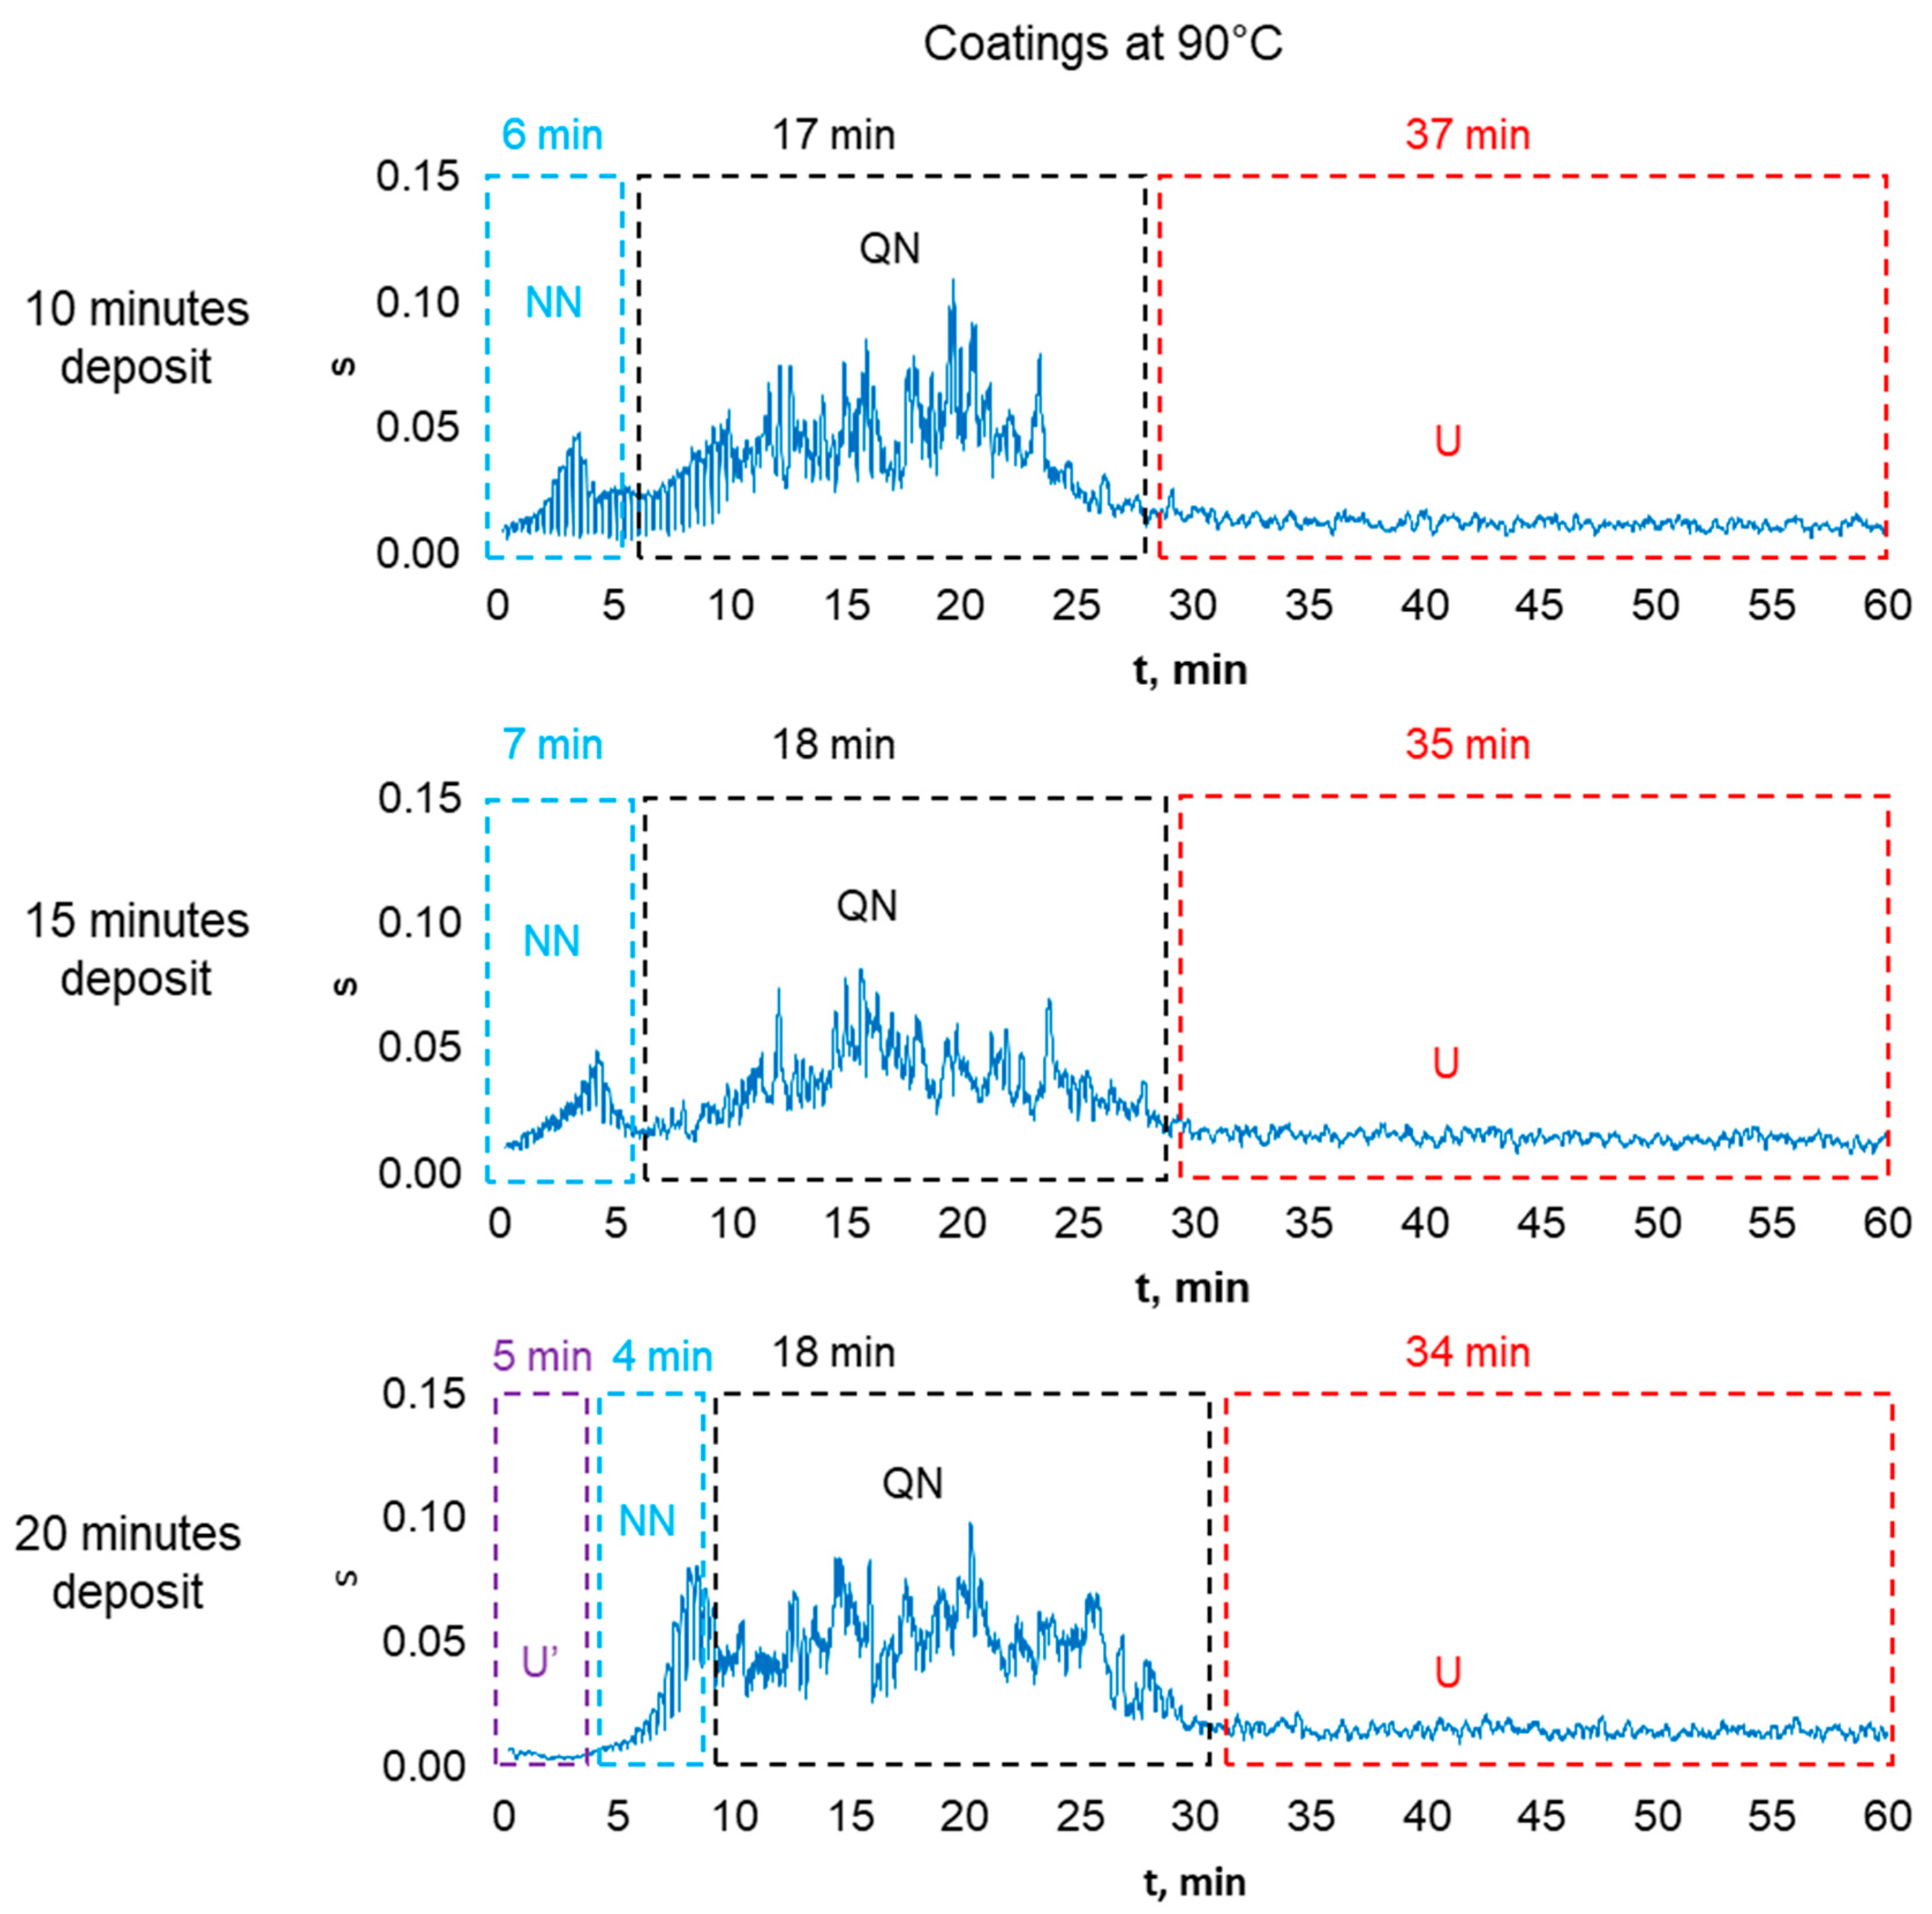
3.4. Profiles of the Standard Deviation

Reviewing the behavior of the M profiles revealed the existence of three regions of friction: low, transitional, and high-friction regions. In this section, we attempt to associate these regions with the standard deviation of friction over time.

3.4.1. Standard Deviation for the Films Deposited at Low Temperature

In the s profile of the samples coated at 90 °C (Figure 15), three zones are observed: the non-normal distribution curve (NN) (blue frames), which is associated with the pattern of the straight and parallel grooves produced during the mechanical treatment of the surface, the quasi-normal distribution curve (QN) (black frames), which is associated with the normal distribution of the roughness resulting from the total wear of the pattern of the straight and parallel grooves, and the uniform distribution curve (U) (red frames), which is associated with the surface wear, which leaves a wear pattern similar to those that existed before the wear tests (Figure 15). We observe that there are two main differences: first, the position of the NN curves is closer to the QN curves as the deposition time is increased, which implies that the coating produces the loss of material from both zones, simultaneously from the pattern of the straight and parallel grooves and the deeper normal distribution of the roughness; second, the occurrence of an extra uniform distribution curve U’ (purple frame) in the s profile of the sample coated for 20 min (Figure 15), which implies this the coating suppresses wear from NN and QN regions, at least for 5 min. It should be noted that the suppression of wear from NN and QN regions should be associated with the film thickness and its mechanical properties, which are changed when experimental conditions change (Section 3.6).

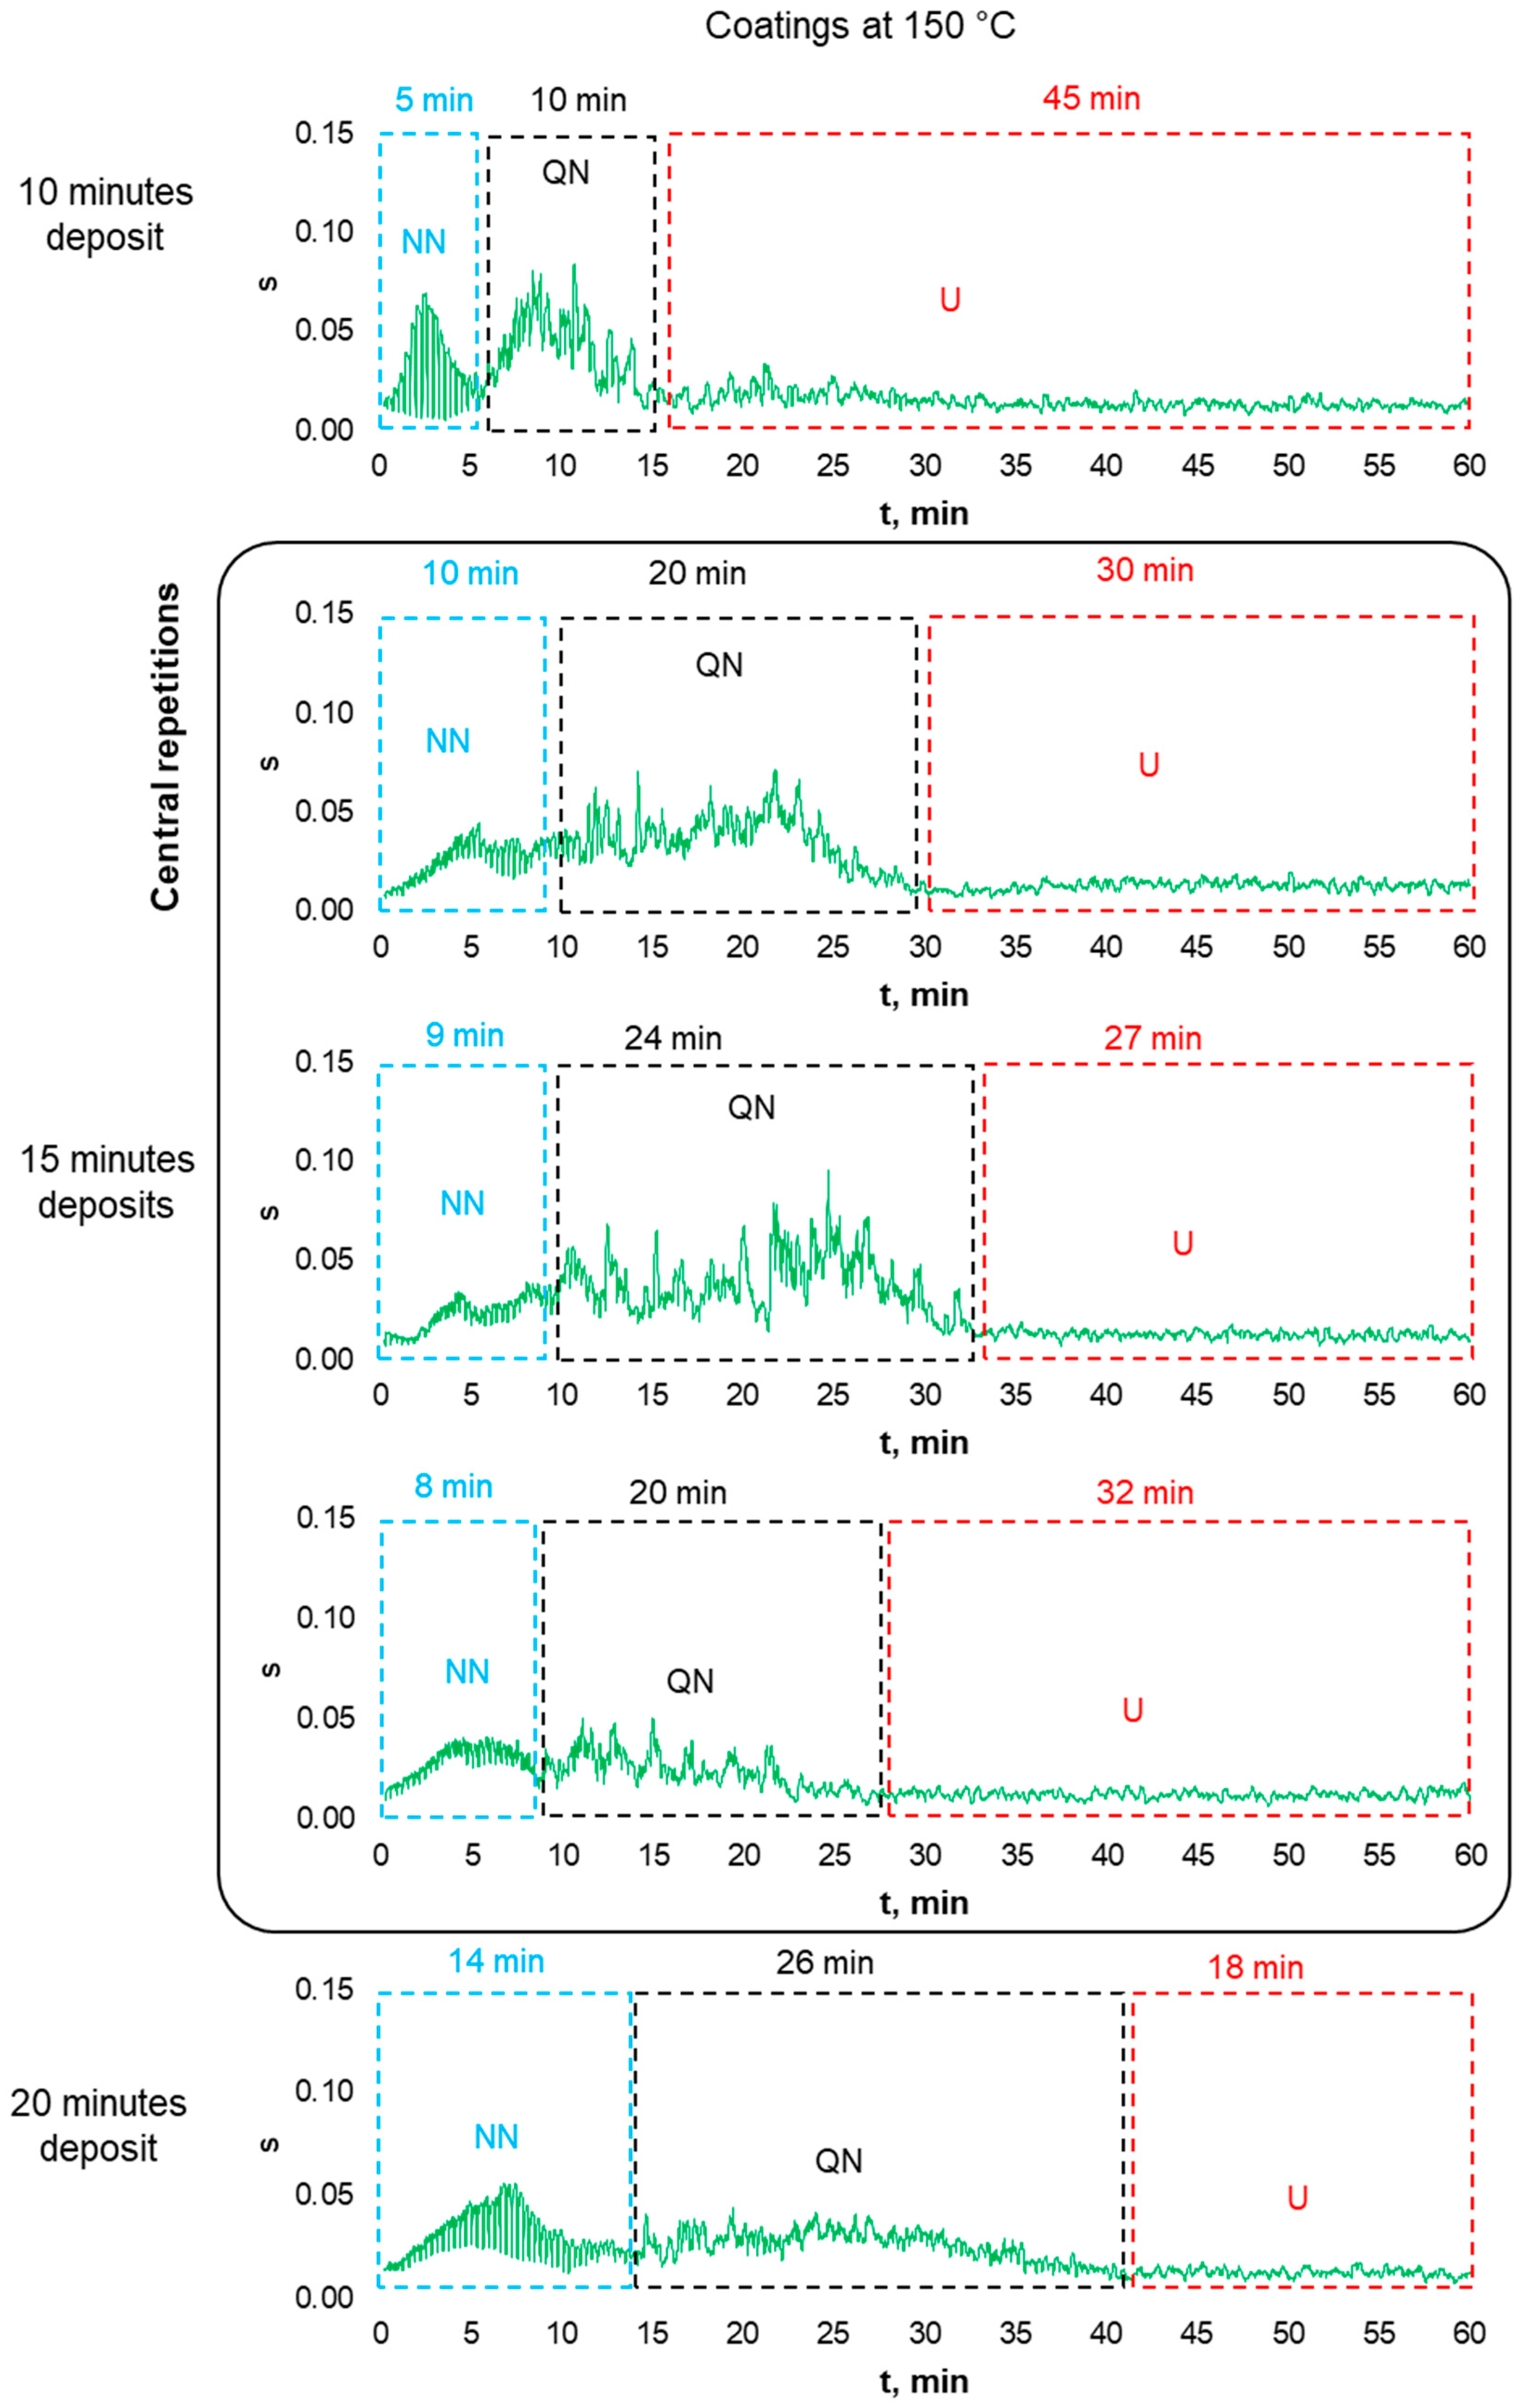
3.4.2. Standard Deviation for the Films Deposited at Medium Temperature

The s profiles for samples coated at 150 °C presented in Figure 16 show the NN, QN, and U curves. There are some differences among them. First, for the sample deposited for 10 min, the three regions are well defined: the NN curve lasts 5 min, the QN curve lasts 10 min, and the U curve lasts 45 min (Figure 16). The short duration of the QN curve should be highlighted, which gives the fast lift of the M profile for this sample (Figure 11) and, consequently, the long duration of the U curve, which causes the early approach of the M profile to the high-friction region (Figure 11). Second, for the samples deposited for 15 min, the central repetitions show an average duration of the NN curve of 10 min, but it is not clear where this ends since in all three central repetitions, NN curves and QN curves are very similar (Figure 16). Despite this, at these experimental conditions, the M profiles for these samples remain below the M profile for the uncoated sample (Figure 11). Third, for the sample deposited for 20 min, the NN curve lasts 14 min, and it is very well differentiated from the QN curve (Figure 16), which is smoother than the other case, giving an uneven transition region in the M profile for this sample (Figure 11).

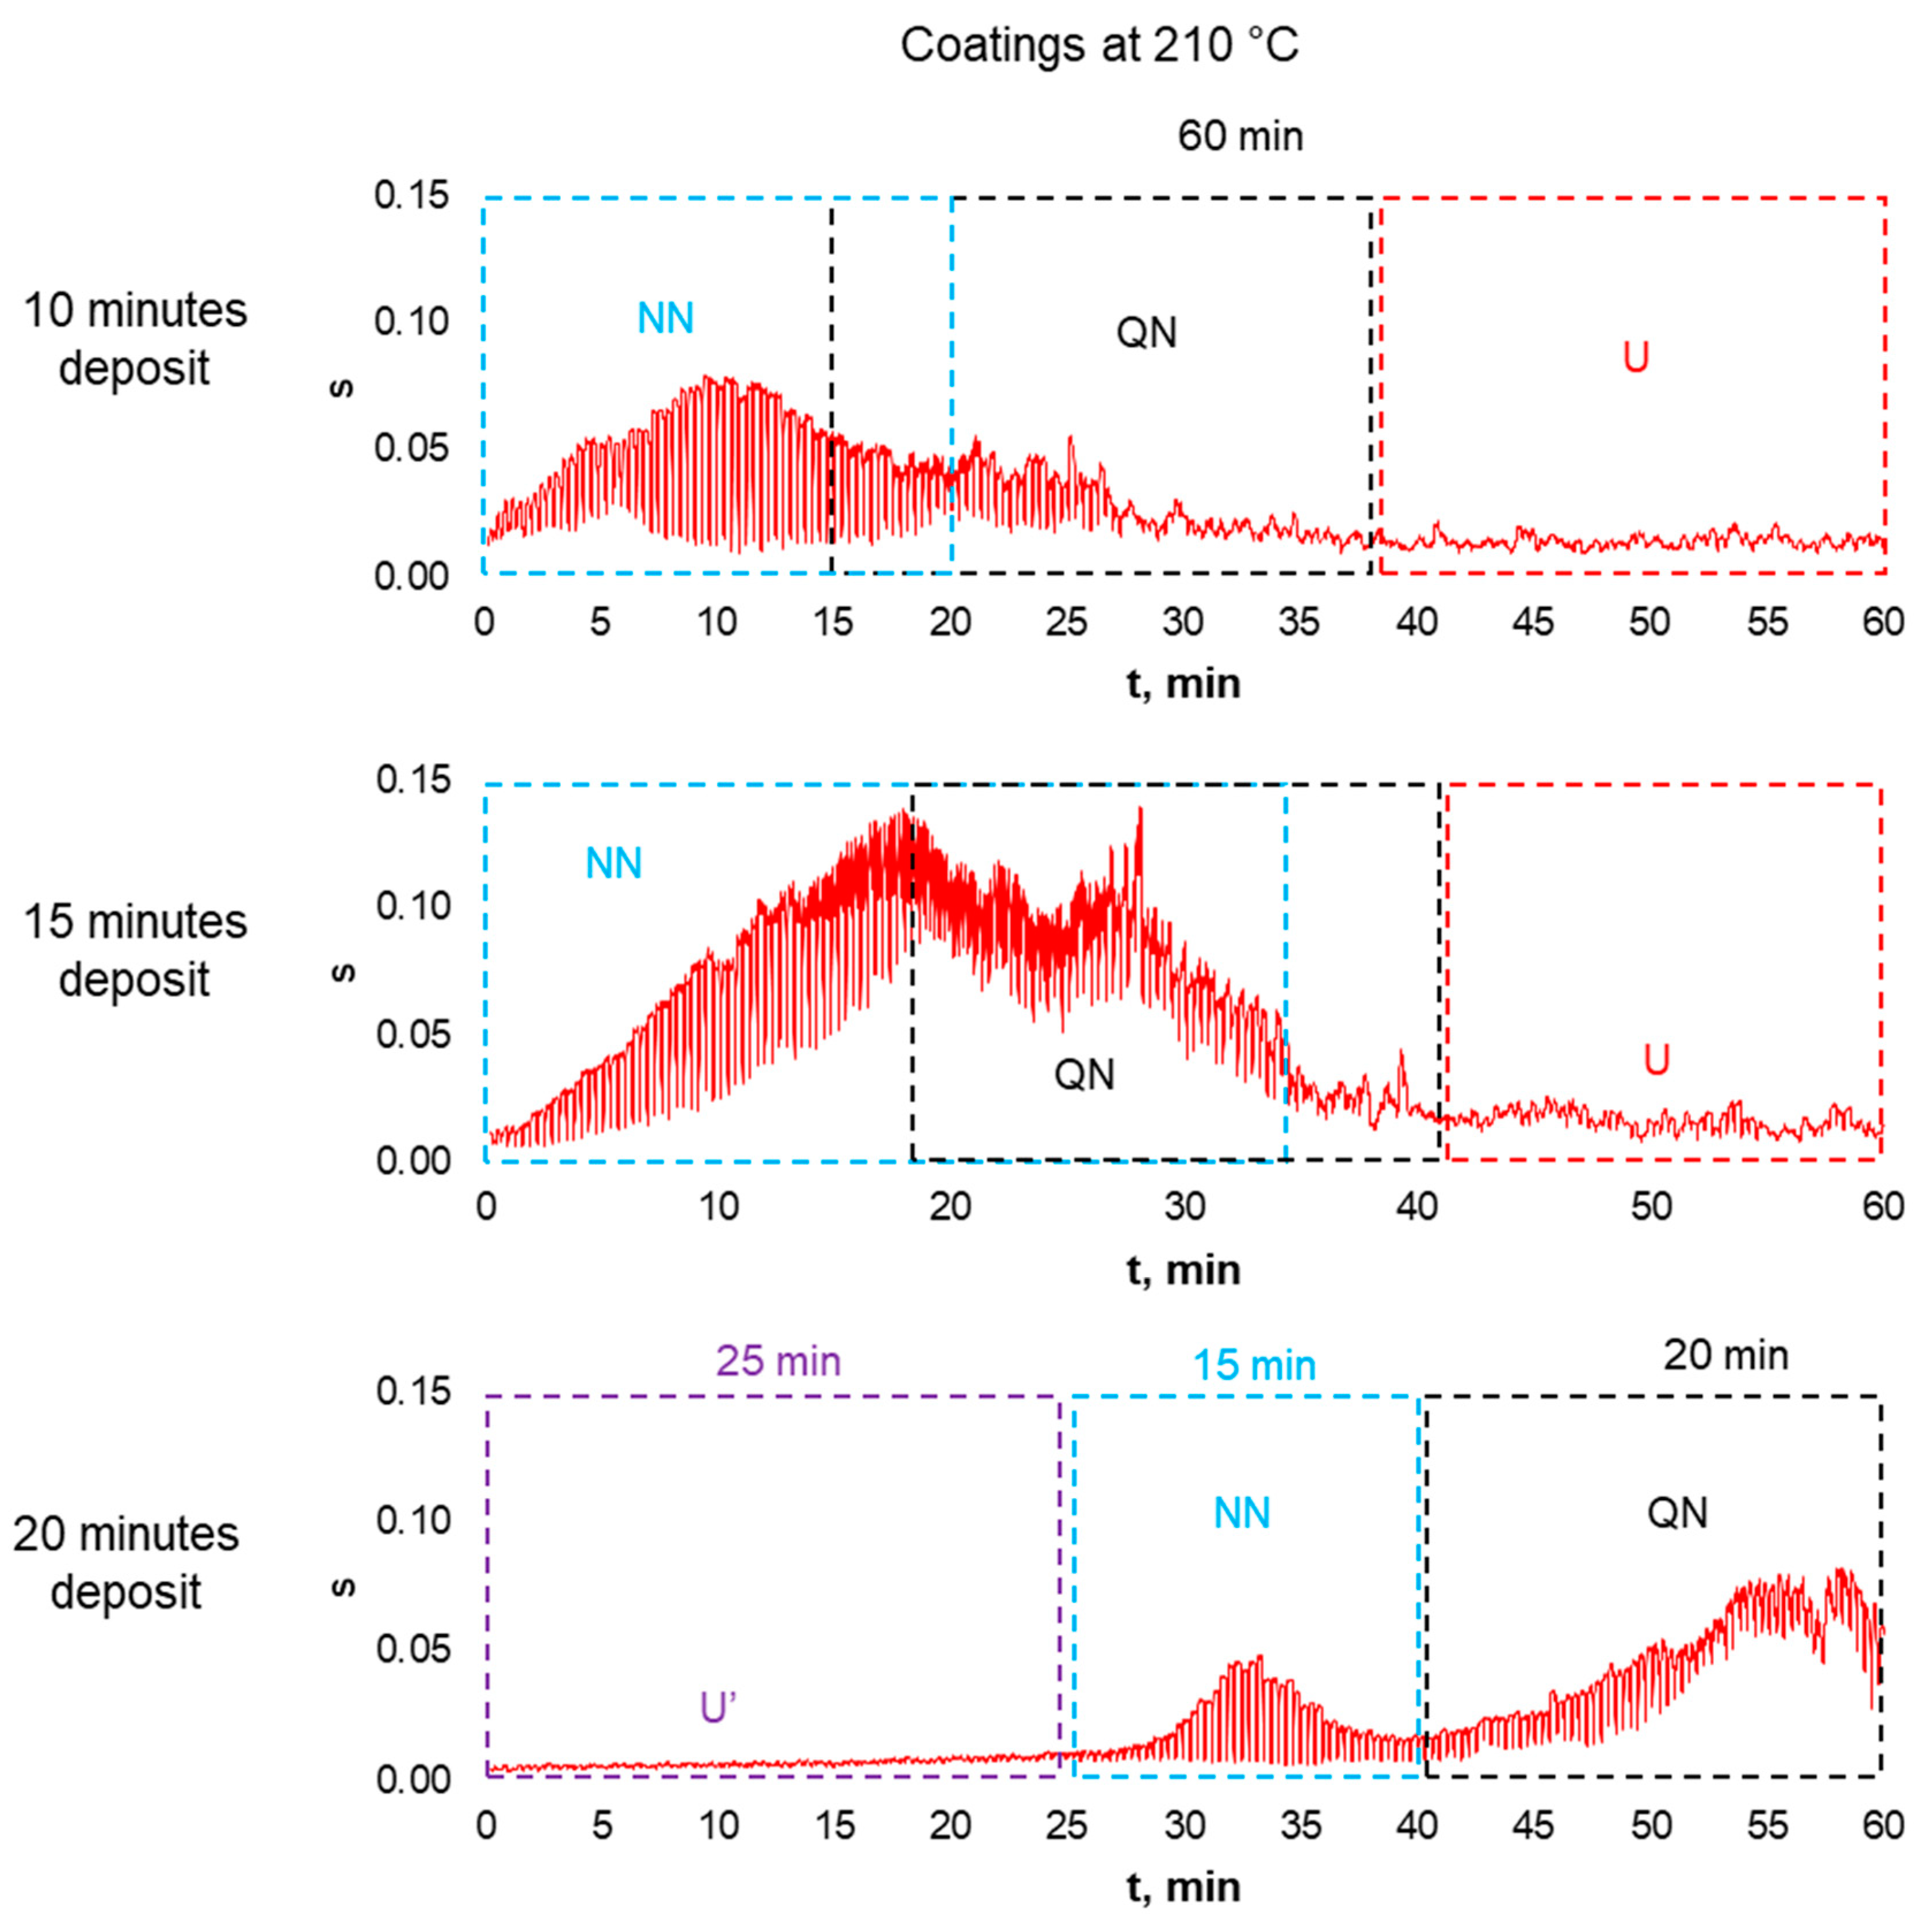
3.4.3. Standard Deviation for the Films Deposited at High Temperature

The s profiles for the samples coated at 210 °C show a completely different behavior. At these experimental conditions, the NN and QN curves are merged or defined according to the deposition time. In the s profile for the sample coated for 10 min, there is no separation between the NN curve and QN curve, and it is difficult to distinguish when the U curve begins to show (Figure 17), which implies the loss of material from both zones, simultaneously, from the pattern of the straight and parallel grooves and the deeper normal distribution of the roughness at the beginning of the test. Therefore, the M profile for this sample overlaps the M profile for the uncoated sample from the initial stage of the test (Figure 12). In the s profile for the sample coated for 15 min, the NN and QN curves are also merged, but in this case, two peaks can be distinguished (Figure 17), which could be related to the zig-zag shape of the M profile for this sample (Figure 12).
The s profile for the sample coated for 20 min shows a uniform-distribution U’ curve (purple frame) (Figure 17), similar to those occurring in the s profile of the sample coated for 20 min at 90 °C (Figure 15), followed by a well-defined NN curve and the beginning of the QN curve. Please note that the occurrence of the U’ curve suppresses wear from NN and QN regions for the first 25 min.

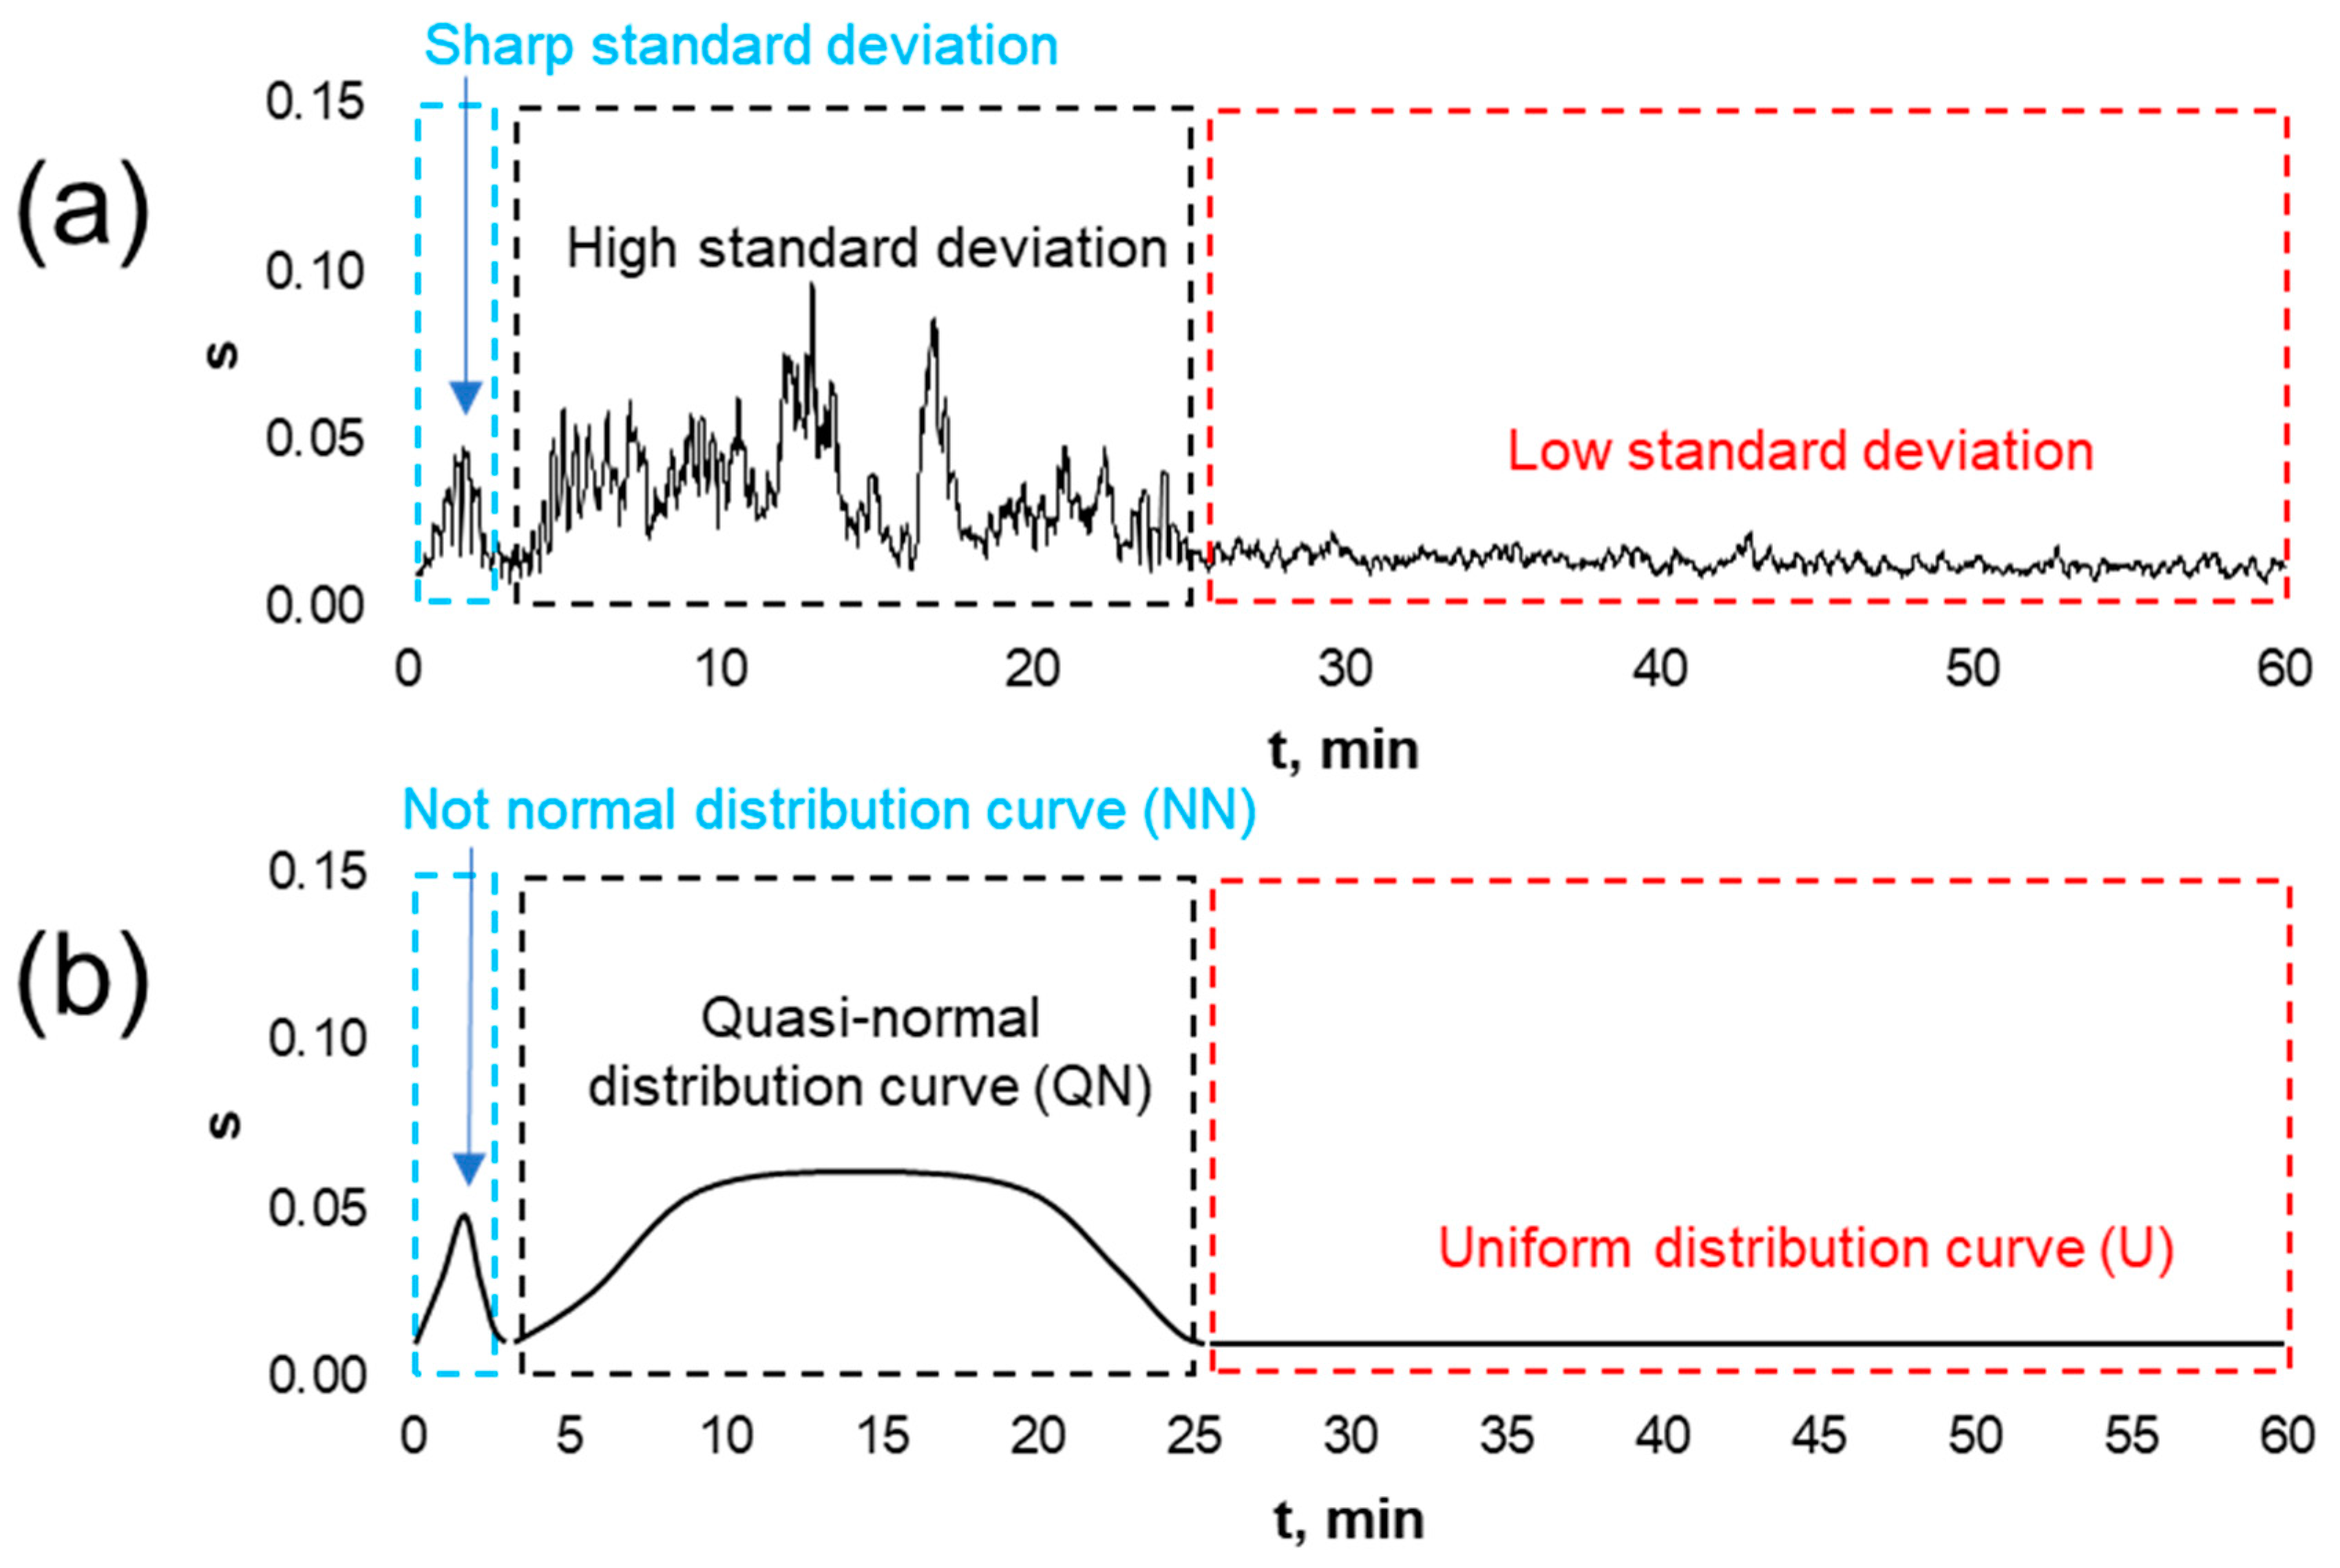
3.4.4. The Effect of the Temperature in the Mobile Standard Deviation

The analysis of the modification of the mobile standard deviation when the deposit time is constant but when the deposition temperature is changed shows that two phenomena deserve to be discussed, parallel to the analysis of the effect of temperature on the mobile mean of friction (Section 3.3.4). On the one hand, the three s profiles for samples coated for 10 min show that, for a short deposition time, increasing the temperature promotes the merging of the NN and QN curves (Figure 18) and, at the same time, promotes the reduction of the low-friction region (Figure 13).
On the other hand, in the three s profiles for samples coated for 20 min, it is evident that, for a longer deposition time, the increase of the temperature promotes the separation of the NN and QN curves (Figure 19), contrasting with the behavior of the samples coated for 10 min (Figure 18). Please note that the long deposition time promotes the presence of the U’ curve that suppresses wear from NN and QN regions; however, unexpectedly, this curve does not appear in the s profile for the sample coated at 150 °C.

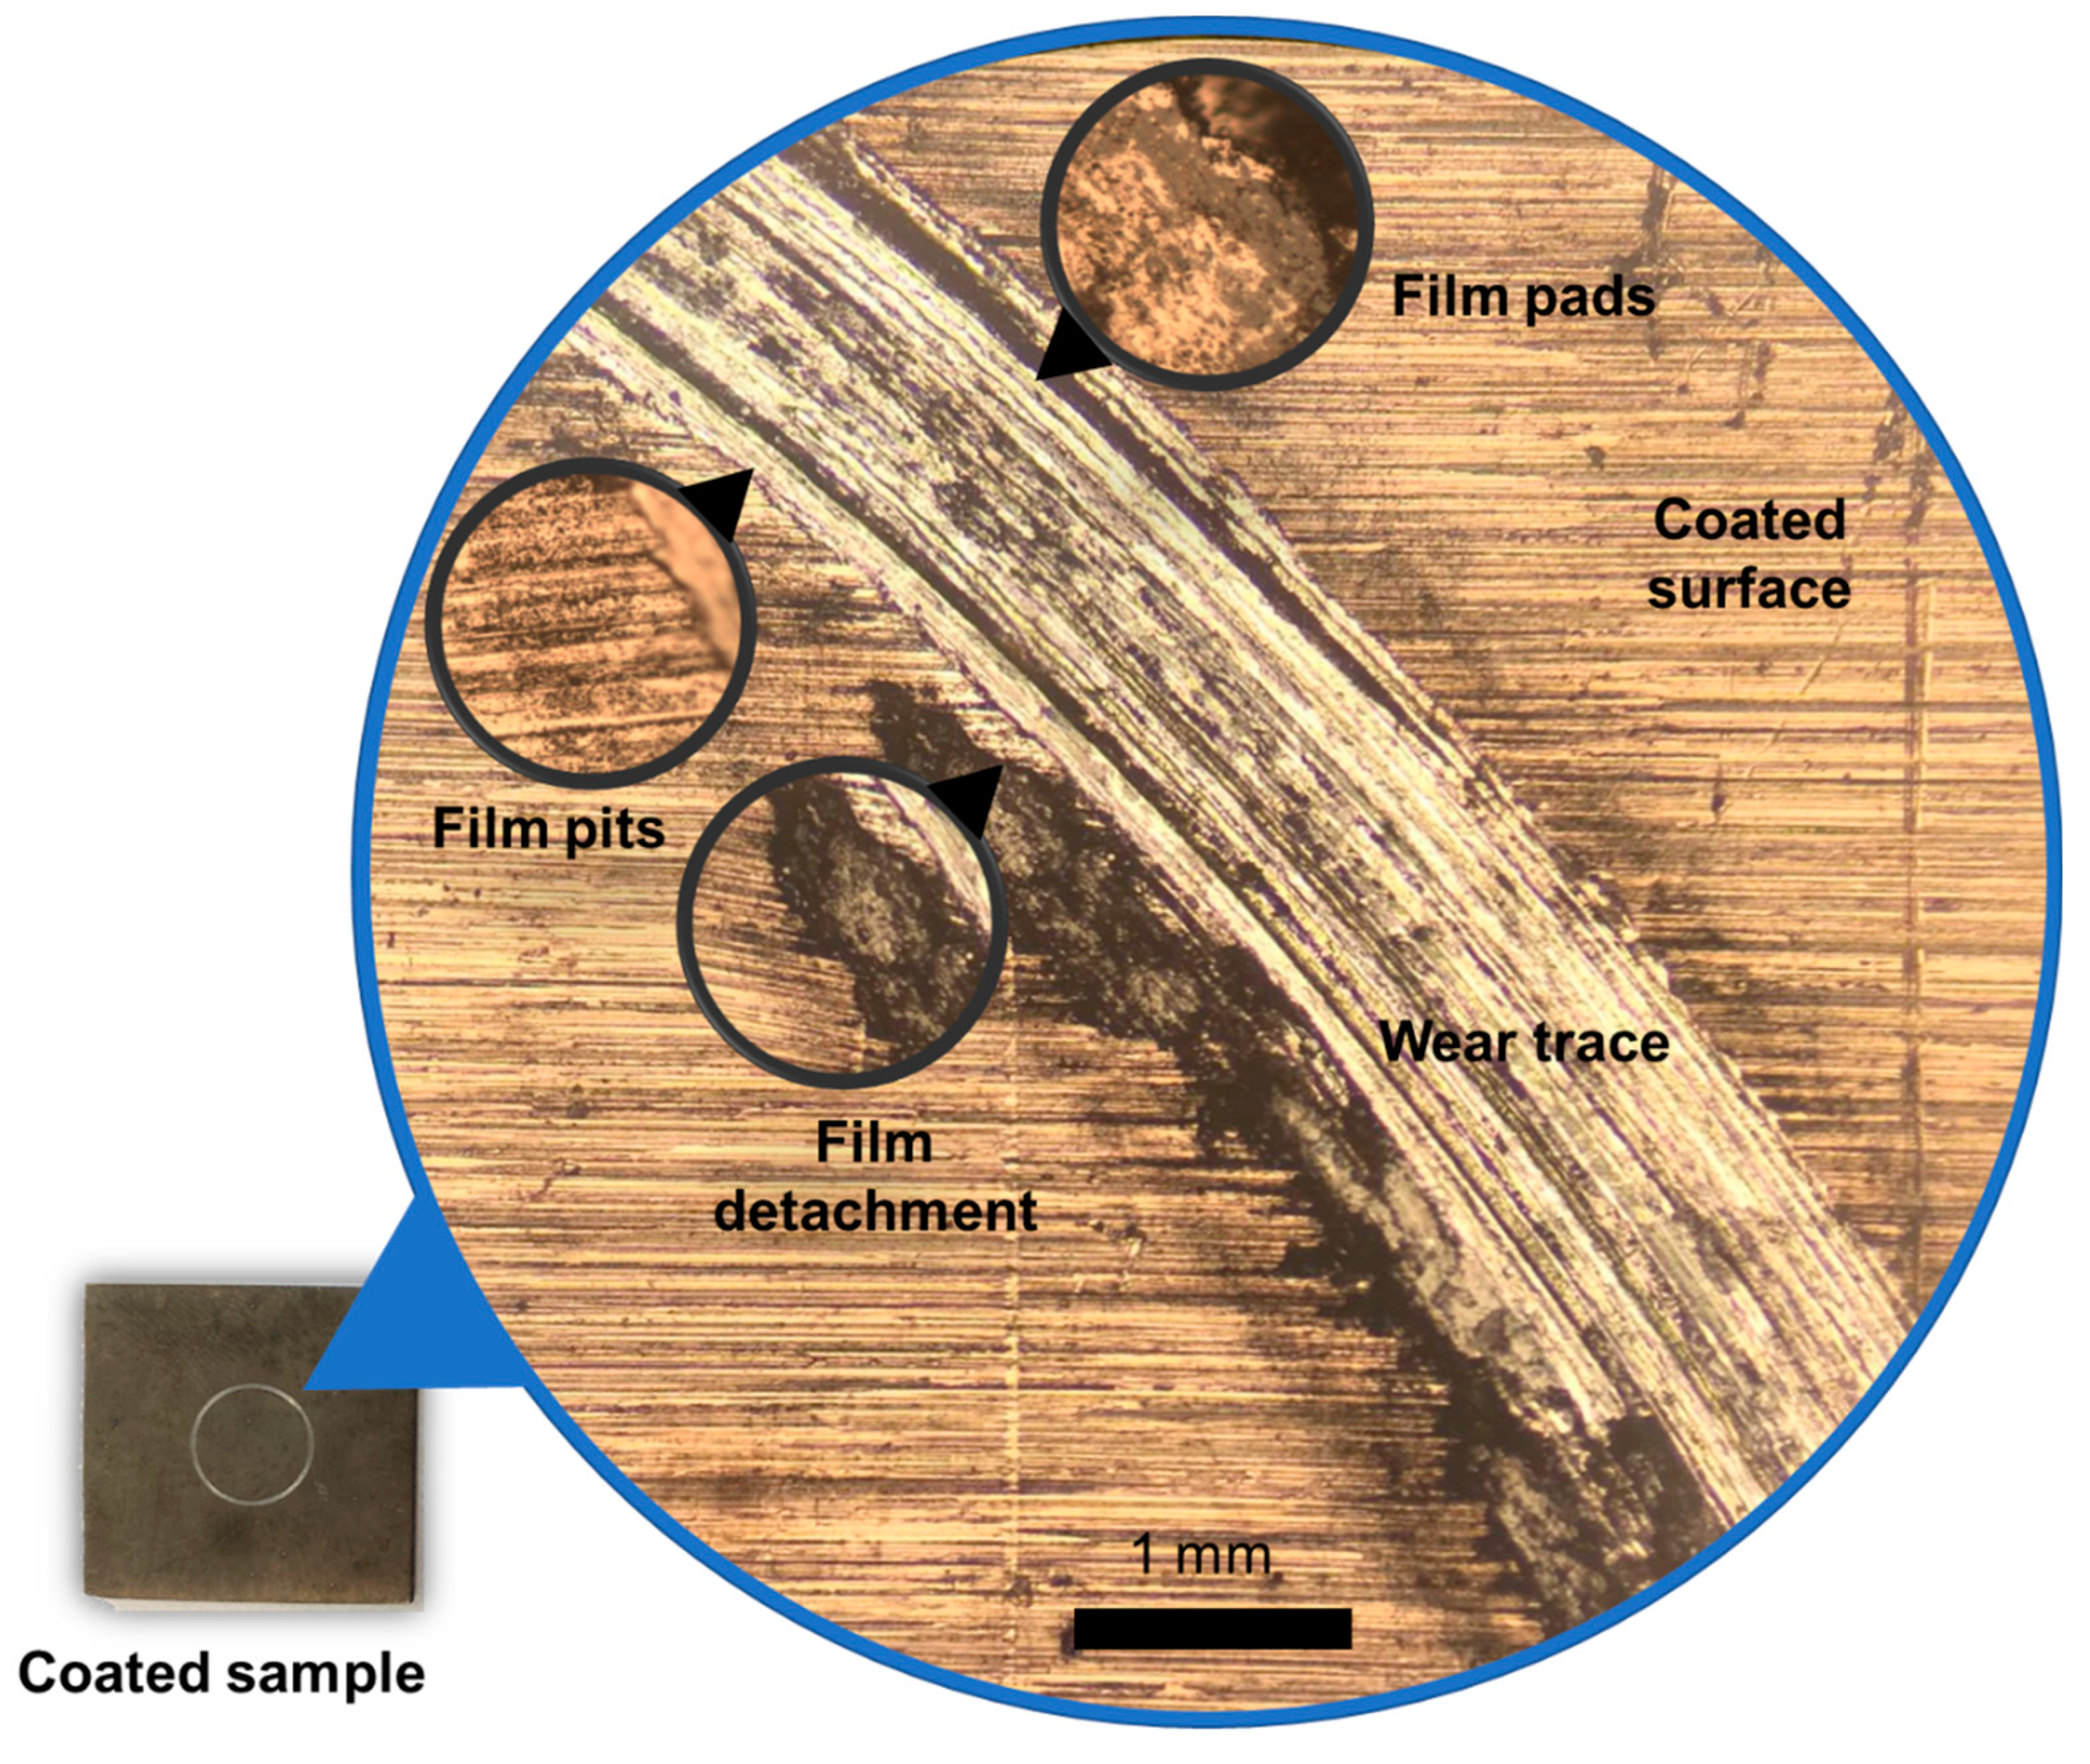
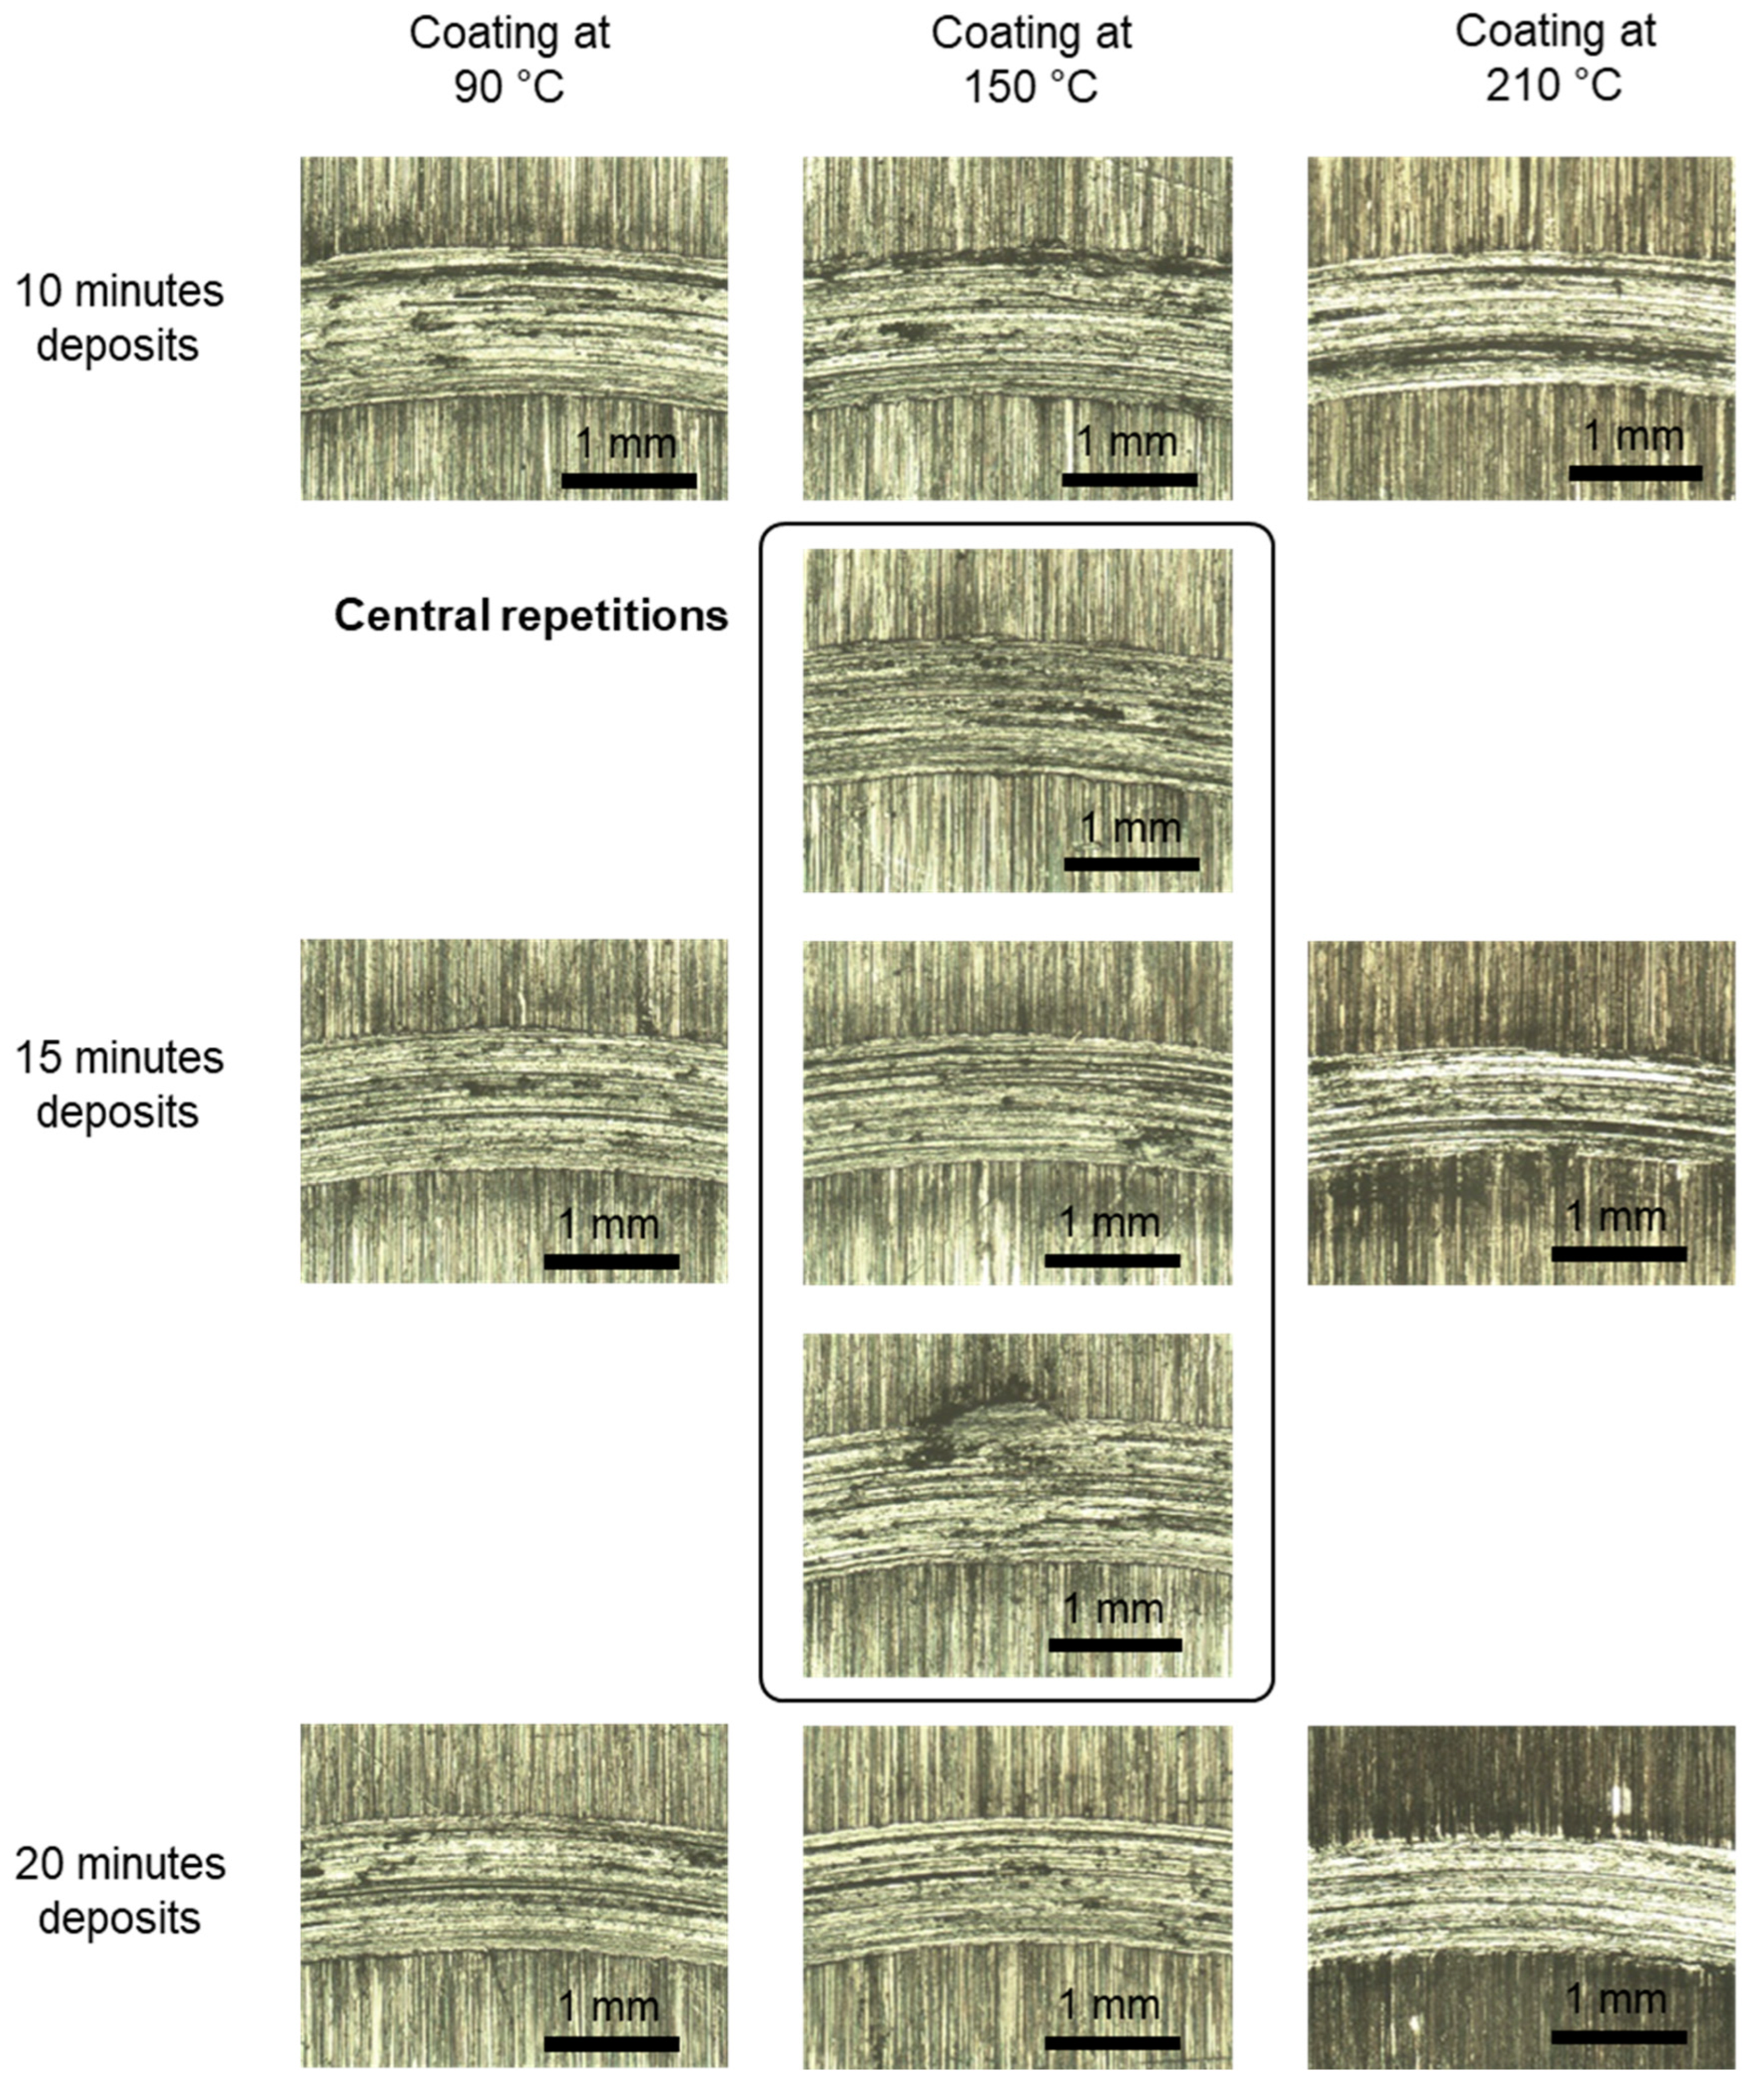
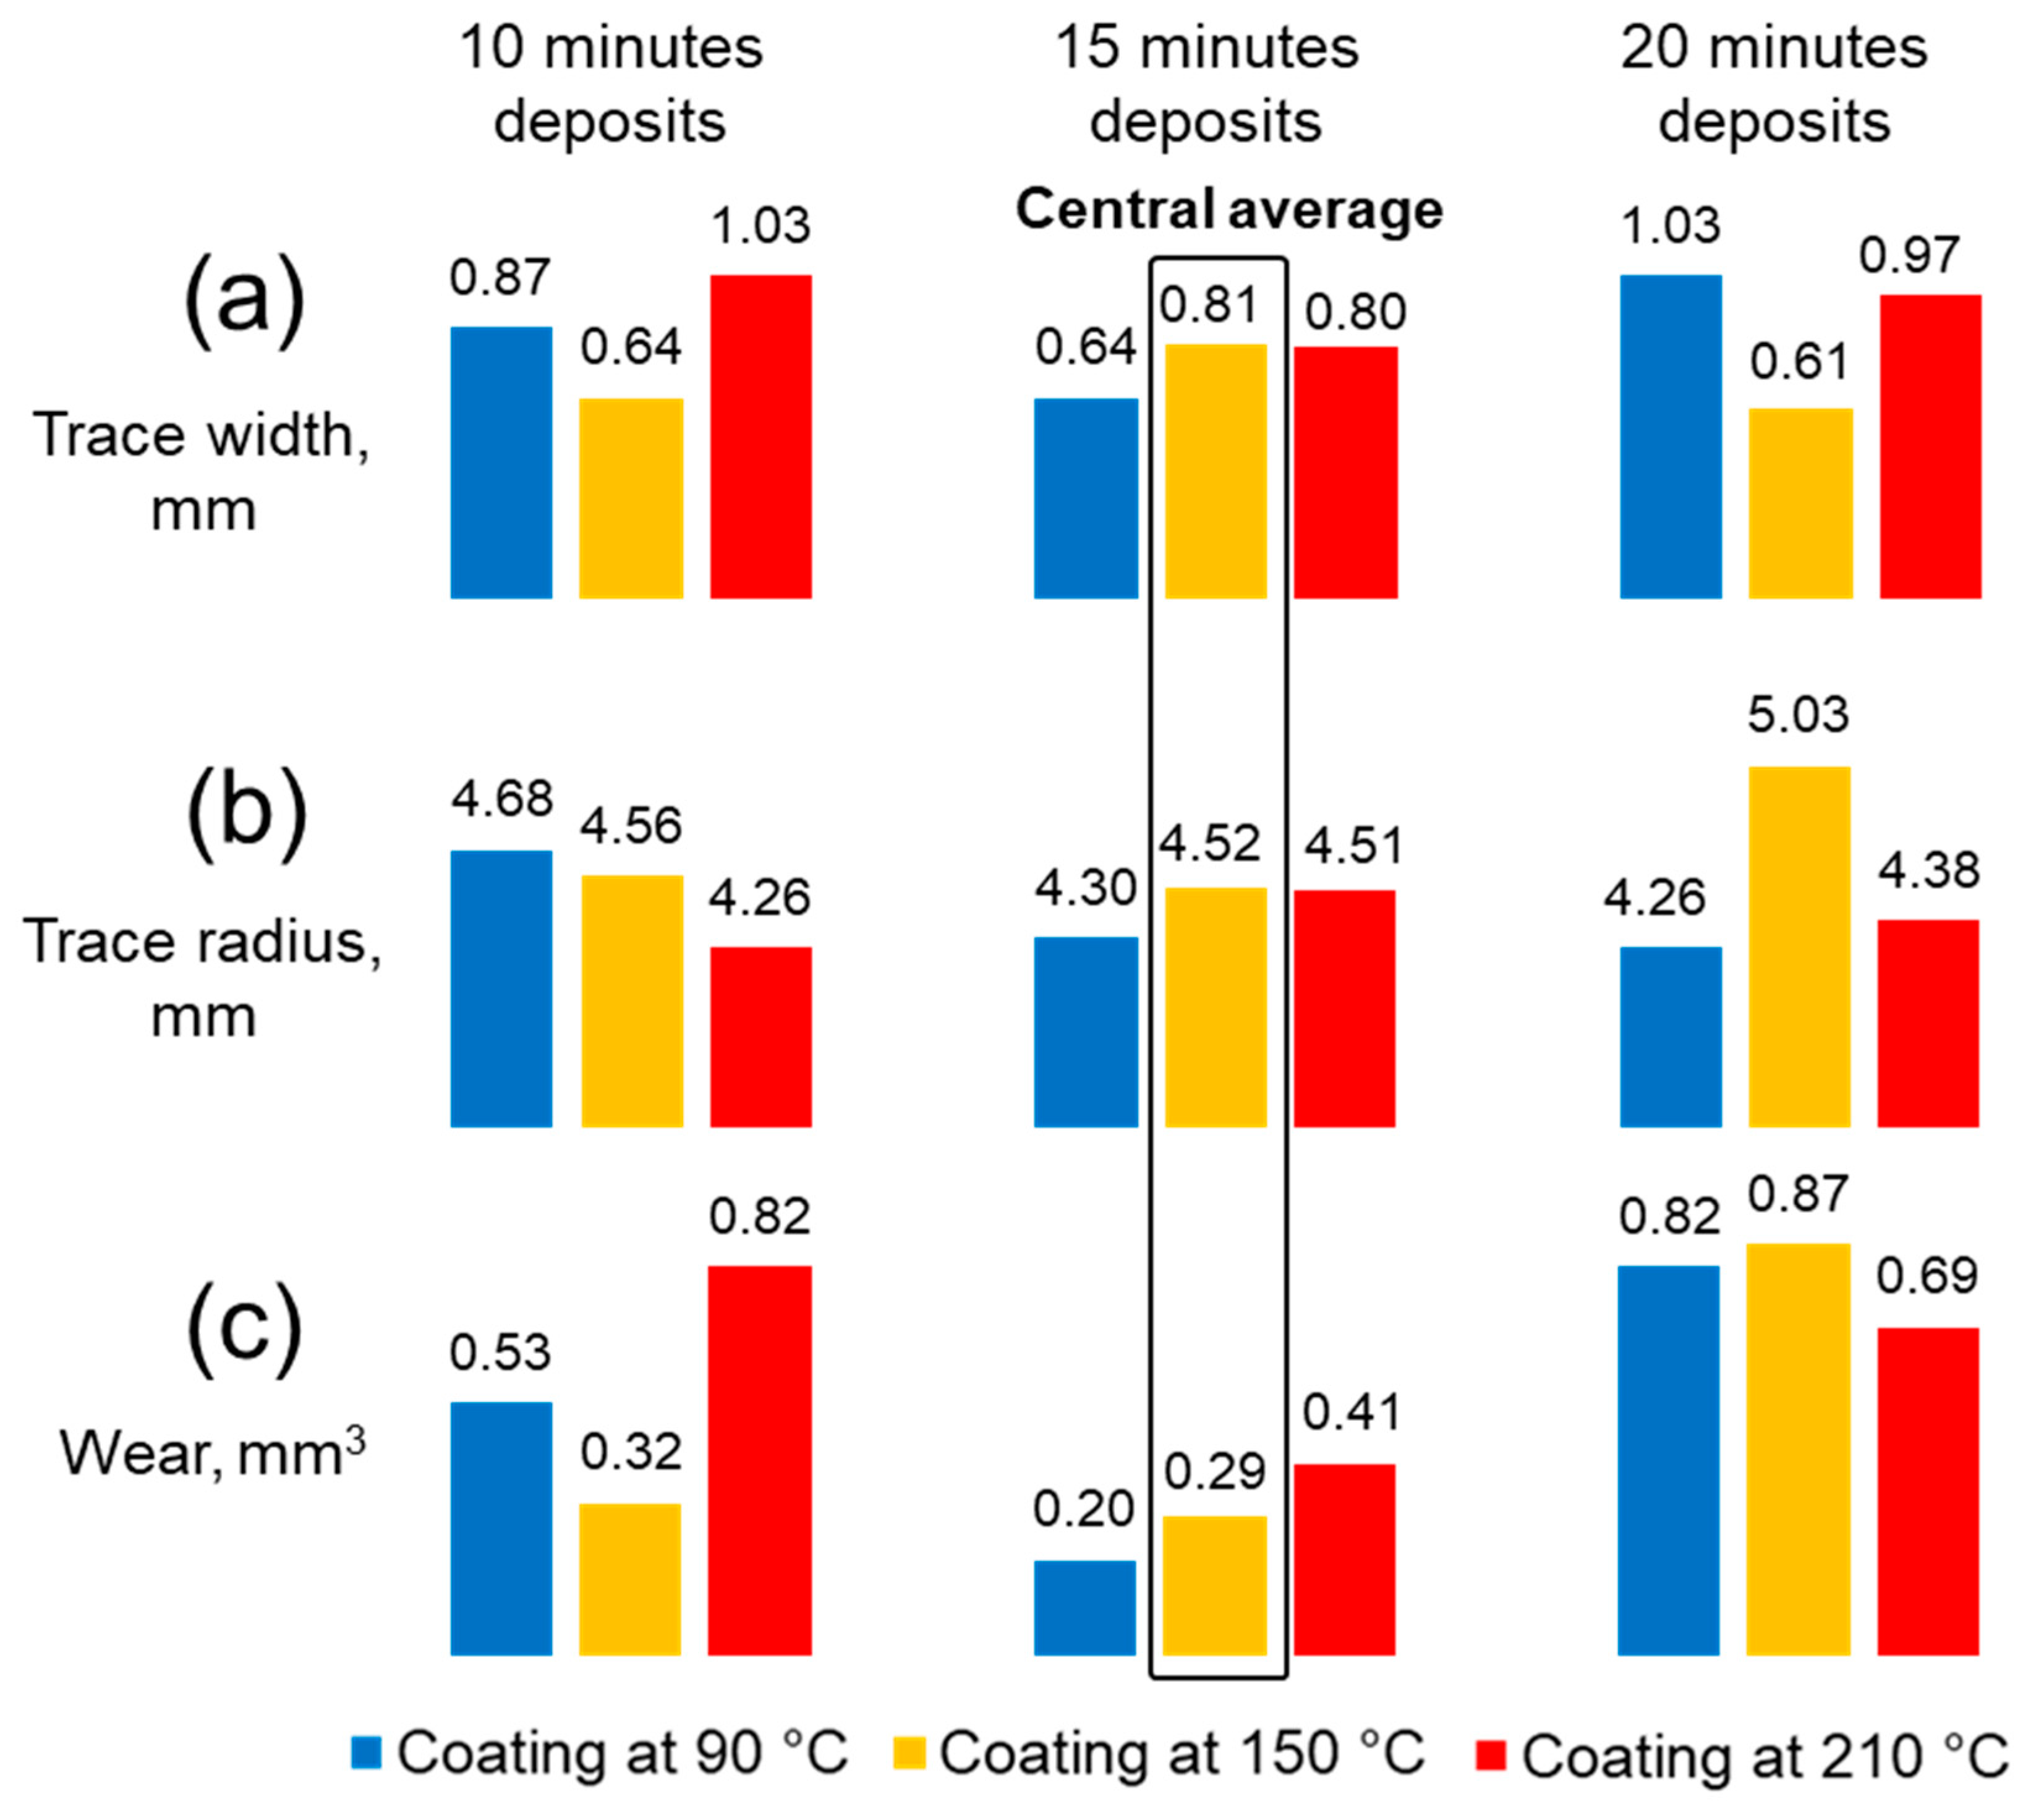
3.5. Wear Tracks Analyses

The wear tracks resulting from the tribological tests were inspected and compared. First, a visual inspection of the wear tracks was conducted to look at the components of wear on the tested sample surfaces. From a 50× optical micrograph, the following components were identified: the coated surface, which looks similar to the pattern of the straight and parallel grooves produced during the mechanical treatment of the surface; the wear trace, which looks like a circular wide trench that breaks the pattern of the straight and parallel grooves; the film detachments, which are zones where the film was eliminated in large portions; the film pits, which are bands of many cracks in the film close to the edge of the wear track; and finally, the film pads in the wear track, which are the film residues not removed from the contact zone (Figure 20).
A simple inspection and comparison among the components in the wear tracks of the coated samples revealed limited information about the contribution of film to the wear dynamics (Figure 21). There are some differences in the amount of film pads over the wear traces, with more film fragments in samples coated for 10 min than in samples coated for 15 and 20 min and wider bands of film pits in samples coated for 15 min than in samples coated for 10 and 20 min. Finally, there was some film detachment, which appears only in one of the central repetitions.

3.6. Accumulated Wear

After the visual inspection of the wear tracks, the widths (Figure 22a) and the radii (Figure 22b) of the wear traces were measured to calculate the wear volume (Figure 22c) following the standard wear test method for a pin-on-disk apparatus (ASTM G99-95a). The wear-track width values ranged from 0.61 to 1.06 mm, and the wear-track radius values ranged from 4.26 to 5.03 mm (Figure 22a,b). Both the width and radius are mainly fixed by the tribometer configuration, position of the pin, load, and speed, and no evident relationship between them and the wear volume, with values ranging from 0.20 to 0.87 mm3, and experimental conditions were found (Figure 22c).

3.7. Films Thickness

The film thickness is an important parameter, which is associated with the tribological performance of the coated samples. First, by looking at the edges of the samples coated at 210 °C (Figure 23), it is clear that the film thickness increases as deposition time is increased. The values of the thickness for the films deposited at this temperature for 10, 15, and 20 min are around 8.15, 13.1, and 18.5 µm, respectively. In these samples, film deformation and detachment caused by the polishing of the samples were observed. Looking at the edges of the samples coated for 10 min (Figure 23), the lack of films on samples coated at 90 and 150 °C is evident, which indicates the complete detachment of the film caused by the polishing of the samples. Finally, analyzing the edges of the samples coated for 20 min (Figure 23), the films of the samples deposited at 90 and 150 °C are cracked and detached from the edge. In these cases, it is noticeable that the resistance of the films improves as deposition temperature is increased.
Please note that the pictures of the samples presented in Figure 23 have been edited to eliminate the encapsulating material area and to highlight the coatings and the border of the metallic samples. Moreover, some colored arrows are added that relate the lettering on the graphs to the cracking and detachment of the plastic deformation of the coatings.

4. Discussion

By summarizing the results of the chemical characterization, thickness, detachments, cracking, and plastic deformation of the coatings for the experiments carried out at 210 °C and 10, 15, and 20 min of deposition time, the following points can be concluded:
Increasing the deposition time allowed the formation of coatings with high sulfur and zinc content and low oxygen and carbon content (Figure 6). Correspondingly, the increasing deposition time formed thicker films, which reduced the cracking and detachment of the coating from the substrate surface and promoted more plastic deformation of the film (Figure 23). The coatings rich in sulfur and zinc, which are elements from additives, increase the permanence of the coating on the substrate surface (Figure 6 and Figure 23), and, in an opposite way, the coatings rich in oxygen and carbon, which are elements form from both oil and additives, reduce the permanence of the coatings on the substrate surface (Figure 6 and Figure 23).
The cracking and detachment of the coatings from the substrate surface are related to the merging of the peaks of the mobile standard deviation profile (Figure 19 and Figure 23), and on the contrary, the plastic deformation of the coatings is related to the resolution of the peaks of the mobile standard deviation profile (Figure 19 and Figure 23). Therefore, signals of the mobile standard deviation observed as merged peaks indicate the detachment and cracking of the coating, and signals of the mobile standard deviation observed as well-defined peaks indicate the plastic deformation of the film instead of its removal from the substrate surface.
The development of merged peaks in the mobile standard deviation profile, which are related to the cracking and detachment of film, produced superimposed profiles of the mobile mean friction coefficient (Figure 13 and Figure 19). On the contrary, the development of well-defined peaks in the mobile standard deviation profile, which is related to the plastic deformation of film, produced low-friction regions of mobile mean friction coefficient (Figure 13 and Figure 19). Therefore, superimposed profiles of the mobile mean friction coefficient indicate the cracking and detachment of the coating from the substrate surface (Figure 13 and Figure 19), and low-friction regions of the mobile mean friction coefficient indicate the plastic deformation of the coatings (Figure 13 and Figure 19).
By summarizing the results of the chemical characterization, thickness, detachments, cracking, and plastic deformation of the coatings for the experiments carried out for 10 and 20 min of deposition at 90, 150, and 210 °C, the following points are induced:
The decreasing of the deposition temperature produced coatings with low oxygen, sulfur, zinc, and carbon content (Figure 6). The profiles of the mobile standard deviation for samples coated at low temperatures for 10 and 20 min developed well-defined peaks (Figure 18 and Figure 19) close to the uncoated reference profile and, consequently, the profiles of the mobile friction coefficient for these samples were very close to the uncoated reference profile (Figure 13, Figure 14, Figure 15 and Figure 19). Therefore, the profiles of the mobile friction coefficient are close to the uncoated reference profile, indicating a negligible amount of deposited film.
Decreasing the deposition temperature promoted more detachment and cracking of the deposited films (Figure 23), and after some testing time, the profiles of the mobile friction coefficient for samples coated at low temperatures matched the uncoated reference profile (Figure 13). Therefore, the approach and matching of the friction profiles to the uncoated reference friction profile indicate coating depletion.
It is worth mentioning some applications or physical situations where this kind of analysis can reveal the dynamics of wear and friction. On one side, looking for surface enhancements with coatings is more frequent. In this way, the laser cladding of carbides and borides of titanium, niobium, molybdenum, tungsten, and vanadium in combination with thermal treatments of the coated surface are proposed to repair worn pieces [46,47], digger teeth, hammers, kitchen knives, liner plates, crushers, loose-soil plow shovels, automobile parts, etc. Another frequent procedure to enhance surface resistance is thermal treatment, by heating or by cryogenic freezing, which modifies the microstructure of the treated material [48,49,50,51,52]. On the other hand, a more recent route of enhancing tribological performance—the use of textures on surfaces inspired by patterns of nature, e.g., grooves in shells—has demonstrated the promotion of the self-compensation of solid lubricating film [53]. Please note that all these procedures to enhance the tribological performance give the surface-lying characteristics depth. However, the analysis and interpretation of the dynamics of the friction coefficient, as presented in this work, provide very useful information to determine the durability of the improvements to surfaces.

5. Novelty and Application

It should be highlighted that the novelty of this work is the statistical analysis of friction data obtained from tribological pin-on-disk tests of coated metallic samples with lubricant films, which, accompanied by the coating characterization and the worn surface inspections, gives new insight into surface roughness evolution along test time, based on the mobile standard deviation of the measured friction. This extra information, in combination with some of the other available experimental tools and mathematical methods, allows us to track the changes in the surfaces and their relationship with friction and wear dynamics. In addition, this type of analysis establishes the base for more rigorous studies of the statistical data coming from tribological tests that increase the available knowledge of the friction and wear phenomena. Other important findings of this work are the remarkable effects of the deposit conditions of the studied coatings, which drastically modified tribological performance.

6. Conclusions

In this work, the tribological performance of films deposited at several experimental conditions—10, 15, and 20 min of deposition time, and at 90, 150, and 210 °C temperatures—was studied by mean of the analysis of surface morphology, the presence of elements coming from additives in coatings, the mobile mean of the coefficient of friction data, the mobile standard deviation of the coefficient of friction data, inspections of the wear-track elements, the quantification of total wear, the analysis of film defects caused by surface polishing, and film thickness. Moreover, three central repetitions were carried out to verify the repeatability of the experiments, which showed remarkably similar behavior.
The results of all these analyses allowed the monitoring of the dynamics of wear and its relationship with friction based on the mobile mean and mobile standard deviation of the friction data, as well as the interaction of the coatings throughout the tribological tests.
Although the coatings enriched with sulfur and zinc were more resistant to detachment and cracking, they were more susceptible to plastic deformation; the coatings enriched with oxygen and carbon were less resistant to detachment and cracking but less susceptible to plastic deformation.
The detachment and cracking of the coatings gave profiles of friction higher than those of similar conditions but without coatings. The cases verified in this work were up to 20% higher than the friction profiles given by the uncoated condition.
The plastic deformation of coatings gives profiles of friction with low-friction operation regions. The cases verified in this work were up to 20% higher than the friction profiles given by the uncoated condition.
Additionally, it is suggested that, for future studies, the processing of this statistical friction data be carried out by means of mathematical tools to obtain a well-defined classification of the roughness–friction–wear states and their dynamics in tribological tests.

Author Contributions

Conceptualization, L.B.G. and S.D.G.; methodology, S.D.G. and B.C.C.; validation, R.M.Y., L.B.G. and J.L.R.; formal analysis, S.D.G. and R.M.Y.; investigation, B.C.C. and S.D.G.; resources, M.A.E.M.; data curation, S.D.G.; writing—original draft preparation, S.D.G. and B.C.C.; writing—review and editing, S.D.G. and B.C.C.; supervision, L.B.G.; project administration, L.B.G. and M.A.E.M.; funding acquisition, M.A.E.M., R.M.Y. and J.L.R. All authors have read and agreed to the published version of the manuscript.

Funding

This research received no external funding.

Institutional Review Board Statement

Not applicable.

Informed Consent Statement

Not applicable.

Data Availability Statement

The datasets generated during and/or analyzed during the current study are available from the corresponding author upon reasonable request.

Acknowledgments

The authors gratefully thank CONACYT for sponsorship and grants and Universidad Michoacana de San Nicolás de Hidalgo for funding these studies.

Conflicts of Interest

The authors declare no conflict of interest.

References

  1. Holmberg, K.; Erdemir, A. Influence of tribology on global energy consumption, costs and emissions. Friction 2017, 5, 263–284. [Google Scholar] [CrossRef]
  2. Ouyang, C.; Bai, P.; Wen, X.; Zhang, X.; Meng, Y.; Ma, L.; Tian, Y. Effects of conformational entropy on antiwear performances of organic friction modifiers. Tribol. Int. 2020, 156, 106848. [Google Scholar] [CrossRef]
  3. Zhang, B.; Xue, Y.; Qiang, L.; Gao, K.; Liu, Q.; Yang, B.; Liang, A.; Zhang, J. Assembling of carbon nanotubes film responding to significant reduction wear and friction on steel surface. Appl. Nanosci. 2017, 7, 835–842. [Google Scholar] [CrossRef]
  4. Shah, R.; Woydt, M.; Zhang, S. The Economic and Environmental Significance of Sustainable Lubricants. Lubricants 2021, 9, 21. [Google Scholar] [CrossRef]
  5. Attia, N.; El-Mekkawi, S.; Elardy, O.; Abdelkader, E. Chemical and rheological assessment of produced biolubricants from different vegetable oils. Fuel 2020, 271, 117578. [Google Scholar] [CrossRef]
  6. Alves, S.M.; Barros, B.S.; Trajano, M.F.; Ribeiro, K.S.B.; Moura, E. Tribological behavior of vegetable oil-based lubricants with nanoparticles of oxides in boundary lubrication conditions. Tribol. Int. 2013, 65, 28–36. [Google Scholar] [CrossRef]
  7. Cornelio, J.A.C.; Cuervo, P.A.; Hoyos-Palacio, L.M.; Lara-Romero, J.; Toro, A. Tribological properties of carbon nanotubes as lubricant additive in oil and water for a wheel–rail system. J. Mater. Res. Technol. 2016, 5, 68–76. [Google Scholar] [CrossRef]
  8. Otero, I.; López, E.R.; Reichelt, M.; Fernández, J. Friction and anti-wear properties of two tris(pentafluoroethyl)trifluorophosphate ionic liquids as neat lubricants. Tribol. Int. 2014, 70, 104–111. [Google Scholar] [CrossRef]
  9. Domínguez-García, S.; Béjar-Gómez, L.; López-Velázquez, A.; Maya-Yescas, R.; Nápoles-Rivera, F. Maximizing Lubricant Life for Internal Combustion Engines. Processes 2022, 10, 2070. [Google Scholar] [CrossRef]
  10. Domínguez-García, S.; Aguilar-Ramírez, C.E.; Béjar-Gómez, L.; Maya-Yescas, R. Mass balance of the tribofilm in lubricated systems. Tribol. Int. 2020, 155, 106757. [Google Scholar] [CrossRef]
  11. Cullen, J.M.; Allwood, J.M.; Borgstein, E.H. Reducing Energy Demand: What Are the Practical Limits? Environ. Sci. Technol. 2011, 45, 1711–1718. [Google Scholar] [CrossRef]
  12. Tung, S.C.; McMillan, M.L. Automotive tribology overview of current advances and challenges for the future. Tribol. Int. 2004, 37, 517–536. [Google Scholar] [CrossRef]
  13. Spiller, S.; Lenauer, C.; Wopelka, T.; Jech, M. Real time durability of tribofilms in the piston ring—Cylinder liner contact. Tribol. Int. 2017, 113, 92–100. [Google Scholar] [CrossRef]
  14. Singh, A.; Gandra, R.T.; Schneider, E.W.; Biswas, S.K. Lubricant Degradation and Related Wear of a Steel Pin in Lubricated Sliding Against a Steel Disc. ACS Appl. Mater. Interfaces 2011, 3, 2512–2521. [Google Scholar] [CrossRef] [PubMed]
  15. Zhao, B.; Dai, X.-D.; Zhang, Z.-N.; Xie, Y.-B. A new numerical method for piston dynamics and lubrication analysis. Tribol. Int. 2016, 94, 395–408. [Google Scholar] [CrossRef]
  16. Akchurin, A.; Bosman, R.; Lugt, P.M. Generation of wear particles and running-in in mixed lubricated sliding contacts. Tribol. Int. 2017, 110, 201–208. [Google Scholar] [CrossRef]
  17. Azam, A.; Dorgham, A.; Morina, A.; Neville, A.; Wilson, M.C. A simple deterministic plastoelastohydrodynamic lubrication (PEHL) model in mixed lubrication. Tribol. Int. 2018, 131, 520–529. [Google Scholar] [CrossRef]
  18. Ghanbarzadeh, A.; Wilson, M.; Morina, A.; Dowson, D.; Neville, A. Development of a new mechano-chemical model in boundary lubrication. Tribol. Int. 2016, 93, 573–582. [Google Scholar] [CrossRef]
  19. Azam, A.; Ghanbarzadeh, A.; Neville, A.; Morina, A.; Wilson, M.C. Modelling tribochemistry in the mixed lubrication regime. Tribol. Int. 2018, 132, 265–274. [Google Scholar] [CrossRef]
  20. Domínguez-García, S.; Maya-Yescas, R.; Béjar-Gómez, L. Reduction of lubricant life in lubrication systems for internal combustion engines due to high lubricant supply rates. Mater. Lett. 2022, 313, 131785. [Google Scholar] [CrossRef]
  21. Dörr, N.; Agocs, A.; Besser, C.; Ristić, A.; Frauscher, M. Engine Oils in the Field: A Comprehensive Chemical Assessment of Engine Oil Degradation in a Passenger Car. Tribol. Lett. 2019, 67, 68. [Google Scholar] [CrossRef]
  22. Okubo, H.; Tadokoro, C.; Sasaki, S. In Situ Raman-SLIM Monitoring for the Formation Processes of MoDTC and ZDDP Tribofilms at Steel/Steel Contacts under Boundary Lubrication. Tribol. Online 2020, 15, 105–116. [Google Scholar] [CrossRef]
  23. Acharya, B.; Seed, C.M.; Krim, J. Shear activation of ZDDP reaction films in the presence and absence of nanodiamonds. Appl. Surf. Sci. Adv. 2022, 7, 100214. [Google Scholar] [CrossRef]
  24. Ghanbarzadeh, A.; Parsaeian, P.; Morina, A.; Wilson, M.C.T.; van Eijk, M.C.P.; Nedelcu, I.; Dowson, D.; Neville, A. A Semi-deterministic Wear Model Considering the Effect of Zinc Dialkyl Dithiophosphate Tribofilm. Tribol. Lett. 2015, 61, 12. [Google Scholar] [CrossRef]
  25. Domínguez-García, S.; Béjar-Gómez, L.; Huirache-Acuna, R.; Lara-Romero, J.; Maya-Yescas, R. Delumping Strategy to Infer Lubrication Reaction Pathways in Internal Combustion Engines. Int. J. Chem. React. Eng. 2019, 18, 20190043. [Google Scholar] [CrossRef]
  26. Morina, A.; Neville, A.; Priest, M.; Green, J. ZDDP and MoDTC interactions and their effect on tribological performance—Tribofilm characteristics and its evolution. Tribol. Lett. 2006, 24, 243–256. [Google Scholar] [CrossRef]
  27. Dawczyk, J.; Morgan, N.; Russo, J.; Spikes, H. Film Thickness and Friction of ZDDP Tribofilms. Tribol. Lett. 2019, 67, 34. [Google Scholar] [CrossRef]
  28. Bayat, R.; Lehtovaara, A. Tribofilm Formation of Simulated Gear Contact Along the Line of Action. Tribol. Lett. 2021, 69, 126. [Google Scholar] [CrossRef]
  29. Yang, X.; Hu, Y.; Zhang, L.; Zheng, Y.; Politis, D.J.; Liu, X.; Wang, L.-L. Experimental and modelling study of interaction between friction and galling under contact load change conditions. Friction 2021, 10, 454–472. [Google Scholar] [CrossRef]
  30. Barber, J.R. Multiscale Surfaces and Amontons’ Law of Friction. Tribol. Lett. 2013, 49, 539–543. [Google Scholar] [CrossRef]
  31. Leibina, A.P.; Mokhnatkin, É.M. Rating engine wear by determining content of metals in oils. Chem. Technol. Fuels Oils 1976, 12, 387–390. [Google Scholar] [CrossRef]
  32. Vakis, A.; Yastrebov, V.; Scheibert, J.; Nicola, L.; Dini, D.; Minfray, C.; Almqvist, A.; Paggi, M.; Lee, S.; Limbert, G.; et al. Modeling and simulation in tribology across scales: An overview. Tribol. Int. 2018, 125, 169–199. [Google Scholar] [CrossRef]
  33. Minfray, C.; Martin, J.M.; De Barros, M.I.; Le Mogne, T.; Kersting, R.; Hagenhoff, B. Chemistry of ZDDP tribofilm by ToF-SIMS. Tribol. Lett. 2004, 17, 351–357. [Google Scholar] [CrossRef]
  34. Bakunin, V.N.; Kuzmina, G.N.; Kasrai, M.; Parenago, O.P.; Bancroft, G.M. Tribological behavior and tribofilm composition in lubricated systems containing surface-capped molybdenum sulfide nanoparticles. Tribol. Lett. 2006, 22, 289–296. [Google Scholar] [CrossRef]
  35. Özkan, D.; Sulukan, E. The anti-wear efficiency of boron succinimide on engine cylinder liner and piston ring surfaces. J. Braz. Soc. Mech. Sci. Eng. 2018, 40, 32. [Google Scholar] [CrossRef]
  36. Umer, J.; Morris, N.; Leighton, M.; Rahmani, R.; Balakrishnan, S.; Rahnejat, H. Nano and microscale contact characteristics of tribofilms derived from fully formulated engine oil. Tribol. Int. 2018, 131, 620–630. [Google Scholar] [CrossRef]
  37. Miranda-Medina, M.d.L.; Tomastik, C.; Truglas, T.; Groiss, H.; Jech, M. Effect of engine oil additives reduction on the tribofilm structure of a cylinder liner model surface. Ind. Lubr. Tribol. 2019, 72, 515–523. [Google Scholar] [CrossRef]
  38. Zhang, J.; Meng, Y. Boundary lubrication by adsorption film. Friction 2015, 3, 115–147. [Google Scholar] [CrossRef]
  39. del Río, J.M.L.; Guimarey, M.J.; Prado, J.I.; Lugo, L.; López, E.R.; Comuñas, M.J. Improving the tribological performance of a biodegradable lubricant adding graphene nanoplatelets as additives. J. Mol. Liq. 2021, 345, 117797. [Google Scholar] [CrossRef]
  40. Burwell, J.T. Law of Adhesive Wear. J. Appl. Phys. 1956, 27, 1561. [Google Scholar] [CrossRef]
  41. Burwell, J.T.; Strang, C.D. On the Empirical Law of Adhesive Wear. J. Appl. Phys. 1952, 23, 18–28. [Google Scholar] [CrossRef]
  42. Bhattacharyya, H.P. On the Law of Adhesive Wear. J. Appl. Phys. 1956, 27, 661–662. [Google Scholar] [CrossRef]
  43. Azam, A.; Dorgham, A.; Parsaeian, P.; Morina, A.; Neville, A.; Wilson, M.C. The mutual interaction between tribochemistry and lubrication: Interfacial mechanics of tribofilm. Tribol. Int. 2019, 135, 161–169. [Google Scholar] [CrossRef]
  44. ASTM E3-11; Standard Guide for Preparation of Metallographic Specimens. ASTM International: West Conshohocken, PA USA, 2017.
  45. ASTM G99-95a; Standard Test Method for Wear Testing with a Pin-on-Disk Apparatus. ASTM International: West Conshohocken, PA, USA, 2000.
  46. Chen, C.; Wang, J.; Ge, Y.; Zhuang, M.; Ma, Z. Microstructure and Wear Resistance of High-Chromium Cast Iron with Multicomponent Carbide Coating via Laser Cladding. Coatings 2023, 13, 1474. [Google Scholar] [CrossRef]
  47. Masafi, M.; Palkowski, H.; Mozaffari-Jovein, H. Microstructural Properties of Particle-Reinforced Multilayer Systems of 316L and 430L Alloys on Gray Cast Iron. Coatings 2023, 13, 1450. [Google Scholar] [CrossRef]
  48. Saraç, E.; Özbek, N.A. Effect of tempering temperature on mechanical properties and microstructure of AISI 4140 and AISI 4340 tempered steels. Mater. Test. 2022, 64, 832–841. [Google Scholar] [CrossRef]
  49. Özbek, N.A. Effects of Cryogenic Treatment on the Microstructure, Hardness, and Wear Behavior of 1.2436 Steel. Gazi J. Eng. Sci. 2023, 9, 100–107. [Google Scholar] [CrossRef]
  50. Özbek, N.A.; Özbek, O. Effect of cryogenic treatment holding time on mechanical and microstructural properties of Sverker 21 steel. Mater. Test. 2022, 64, 1809–1817. [Google Scholar] [CrossRef]
  51. Maurya, A.K.; Patnaik, A.; Pandey, S.M.; Chhibber, R.; Pandey, C. Tribological Performance of Gas Tungsten Arc Welded Dissimilar Joints of sDSS 2507/N50 Steel. J. Mater. Eng. Perform. 2023, 1–15. [Google Scholar] [CrossRef]
  52. Thakare, J.G.; Pandey, C.; Mahapatra, M.M.; Mulik, R.S. Thermal Barrier Coatings—A State of the Art Review. Met. Mater. Int. 2020, 27, 1947–1968. [Google Scholar] [CrossRef]
  53. Lu, G.; Yang, Z. Tribological Performance and Model Establishment of Self-Compensating Lubrication Film Inspired by the Functional Surfaces of Scapharca subcrenata Shells. Coatings 2023, 13, 1399. [Google Scholar] [CrossRef]
Figure 1. Scheme of the experimental procedure to study the statistical friction data, the coating characteristics, and its tribological performance.
Coatings 13 01753 g001
Figure 2. Image of the experimental setup for the obtaining of metallic samples.
Coatings 13 01753 g002
Figure 3. Image of the experimental setup for film deposition.
Coatings 13 01753 g003
Figure 4. Image of the experimental setup of the pin-on-disk tribometer NANOVEA model T1.
Coatings 13 01753 g004
Figure 5. Micrographs of the film topography.
Coatings 13 01753 g005
Figure 6. Weight percentage of elements present on the surfaces of the samples covered with the films. (a) Elements coming from additives and (b) Elements coming from metallic substrate.
Coatings 13 01753 g006
Figure 7. Uncoated sample tribofilm test data. (a) Raw coefficient of friction data (COF), (b) mobile mean of the coefficient of friction (M, with a period of 30 points), and (c) mobile standard deviation of the coefficient of friction (s with a period of 30 points).
Coatings 13 01753 g007
Figure 8. The profile of M for the uncoated sample. (a) Taking into account only the magnitude of the friction and (b) taking into account the shape of the friction profile.
Coatings 13 01753 g008
Figure 9. The profile of s for the uncoated sample. (a) Taking into account only the magnitude of the standard deviation and (b) taking into account the shape of the standard deviation profile.
Coatings 13 01753 g009
Figure 10. Friction profiles of films deposited at 90 °C.
Coatings 13 01753 g010
Figure 11. Friction profiles of films deposited at 150 °C.
Coatings 13 01753 g011
Figure 12. Friction profiles of films deposited at 210 °C.
Coatings 13 01753 g012
Figure 13. Friction profiles of films deposited for 10 min.
Coatings 13 01753 g013
Figure 14. Friction profiles of films deposited for 20 min.
Coatings 13 01753 g014
Figure 15. Standard deviation of films deposited at 90 °C.
Coatings 13 01753 g015
Figure 16. Standard deviation of films deposited at 150 °C.
Coatings 13 01753 g016
Figure 17. Standard deviation of films deposited at 210 °C.
Coatings 13 01753 g017
Figure 18. Standard deviation of films deposited for 10 min.
Coatings 13 01753 g018
Figure 19. Standard deviation of films deposited for 20 min.
Coatings 13 01753 g019
Figure 20. Wear-track components.
Coatings 13 01753 g020
Figure 21. Comparison of wear traces of all coated samples.
Coatings 13 01753 g021
Figure 22. Sizes of the wear tracks. (a) measured width of the wear tracks (b) measured radius of the wear tracks (c) estimated volume of the wear tracks.
Coatings 13 01753 g022
Figure 23. Film growth over the metallic substrate.
Coatings 13 01753 g023
Table 1. Experimental conditions to coat samples used in tribological tests.
RepetitionsTemperature, °CDeposition Time,
min
19010
19015
19020
115010
315015
115020
121010
121015
121020
Table 2. Experimental conditions to coat samples used in thickness measurement.
RepetitionsTemperature, °CDeposition Time,
min
19010
115010
121010
121015
19020
115020
121020
Table 3. Chemical components of the disk and pin.
Element %Disk ASTM A36Pin AISI 52100
C0.25–0.290.93–1.05
Mn0.60–1.200.25–0.45
Si0.15–0.400.15–0.35
P0.04<0.025
S0.05<0.025
Cr1.35–1.60
Table 4. Mechanical properties of the disk and pin.
Mechanical PropertyDisk ASTM A36Pin AISI 52100
Minimum yield strength, MPa250360–560
Tensile strength, MPa400–500590–2010
Elastic modulus, GPa200190
Hardness, HB120180–210
Disclaimer/Publisher’s Note: The statements, opinions and data contained in all publications are solely those of the individual author(s) and contributor(s) and not of MDPI and/or the editor(s). MDPI and/or the editor(s) disclaim responsibility for any injury to people or property resulting from any ideas, methods, instructions or products referred to in the content.

