Article

The Effects of Quenching with Clay on the Microstructure and Corrosion Performance of Steel Blades

1
School of Materials Engineering, North China Institute of Aerospace Engineering, No. 133 Aimin East Road, Langfang 065000, China
2
Research Base for Scientific Cognition and Protection of Cultural Heritage, Nanjing University of Information Science and Technology, Nanjing 210044, China
3
Institute of Cultural Heritage and History of Science and Technology, University of Science and Technology Beijing, Beijing 100083, China
*
Author to whom correspondence should be addressed.
Coatings 2023, 13(11), 1904; https://doi.org/10.3390/coatings13111904
Submission received: 1 October 2023 / Revised: 1 November 2023 / Accepted: 3 November 2023 / Published: 7 November 2023
(This article belongs to the Section Corrosion, Wear and Erosion)

Abstract

:
Coating a sword with a layer of clay prior to water quenching is one way to promote hardening and improve corrosion resistance. In this study, two types of clay coating were prepared on two identical steel swords (L04 and L05) in order to explore the effects of the addition of clay on the microstructure of steel. Samples taken from each blade were compared using metallography, XRD tests, microhardness tests, and electrochemical tests, and the results showed that L04 had a wavy pattern and contained pearlite, martensite, and residual austenite, while L05 had a mesh pattern and consisted of acicular and lath martensite. More importantly, the electrochemical tests indicated that L05 exhibited better corrosion resistance than L04. Each test zone of L05 (with icorr values of 2.48~8.08 μA·cm−2) had lower corrosion rates compared to the corresponding zones of L04 (with icorr values of 2.93~10.44 μA·cm−2). Furthermore, the calculated Rp values of each test zone of L05 (2341~8260 Ω·cm2) were higher than the values of the corresponding zone of L04 (1908~6716 Ω·cm2). These results further demonstrate that the second method of clay coating endowed superior anti-corrosion performance. In addition, the overall strength and toughness of L04 were achieved with a lower hardness back (mean value 320 HV) and a higher hardness edge (mean value 850 HV), whereas the overall strength and toughness of L05 were achieved with a high hardness throughout (mean value 640 HV of the back and 725 HV of the edge).

1. Introduction

In order for a carbon steel sword to be useful as a weapon, it must have a high hardness at the blade edge and a soft interior, and in order to achieve this configuration, some means of selective quenching are required. One way to do this is by covering the entire sword with a layer of clay and then removing the clay near the cutting edge in a particular pattern, as shown in Figure 1a. After water quenching, beautiful patterns remain on the surface of such swords [1,2], as shown in Figure 1b. Because of the resulting balance of desirable combat properties and aesthetic effects, such quenching techniques have been the focus of many metallographic studies. Japanese researchers in particular have published a lot of work in this area [3]. Tatsuo conducted a simulation study of the effect of the thickness of clay on the metallic structure and residual stress based on a finite element method and found that different thicknesses of clay coating resulted in different phase transformations and internal stresses in various areas [4]. Additionally, nondestructive testing using a mapping measurement with pulsed neutron diffraction was performed on a full-shape Japanese sword to elucidate the distributions of microstructural details. The constituent phases in the area closer to the back of the blade (ridge) were found to be ferrite and cementite, composing pearlite, and the area close to the edge was composed of martensite and austenite [5]. Furthermore, the prior-austenite microstructure at the sharp edge of three Japanese swords was characterized using the automatic reconstruction method. In order to obtain fine-grained austenite along with high strength and hardness in the cutting edge, the authors recommended that the carbon content of a Japanese sword should be 0.6%~0.7% of the sword’s total mass, and that the heating temperature should be between 750 and 800 °C [6]. Previous studies have shown that only the front edge and lower sides of swords are hardened with lath martensite using selective quenching and that the ridge of these swords became transformed to a mixture of pearlite and ferrite due to a slower rate of cooling [6,7]. Further, Tawara found that hard martensite and softer troostite (probably fine, unresolved pearlite) coexisted on the boundary zone of the hardened part of these types of swords, where the aforementioned fancy patterns appear [8]. Additionally, the sword forging laboratory of Kyushu University examined the hardness from the blade edge to the back of many swords and found that the most desirable cutting weapons had high hardness in the edge and lower hardness in the back [8]. Similarly, Tatsuo conducted a simulation study of selective quenching processes with clay and found that particular patterns corresponded to the fraction of martensite present, which itself depended on the thickness of the pasted clay [9]. Thus, blade patterns vary with different types of clay coating and on the individual swordsmith.
In addition to their effects on the microstructure and hardness, microstructural transformations can also minimize the corrosion of carbon steel since changes in the crystal structure of the steel during heat treatment can have a significant impact on its electrochemical properties [10]. To date, there have been very few studies that have investigated the relationship between the heat treatment and corrosion resistance of steel swords. Because of this, we studied the microstructure, hardness, and corrosion resistance of artificial steel swords quenched at different temperatures with different cooling media in our previous paper in order to establish the optimal heat treatment conditions for reducing corrosion [11]. However, the effects of quenching from different types of clay coating on the metallographic structure, metallurgic properties, and particularly corrosion resistance have yet to receive a thorough comparative analysis. This paper is thus an extension of our previous work to a certain degree, in which we aim to investigate the effects of quenching by two different clay coatings on the microstructure and corrosion behavior of swords. The metallographic structure, hardness, and electrochemical corrosion resistance of the two differently treated swords were compared and analyzed using an optical microscope, microhardness test, X-ray diffraction (XRD), scanning electron microscope (SEM), and electrochemical tests in an attempt to explain the clay–coat quenching mechanisms as well as to explain how each method endows a sword with the necessary strength and toughness. The results presented provide an important guide for quenching with clay together with a characterization of the corrosion resistance of the blades.

2. Materials and Methods

2.1. Materials and Processing

The materials used for this experiment consisted of two steel bars that weighed 1.5 kg each. The chemical composition of the bars is shown in Table 1.
First, the steel bars were forged into two sword pieces 70 cm in length. Second, the clay was prepared by silica sand, borax, iron powder, and carbon powder (produced by Nangong Chunxu Metal Materials Co., Ltd. grain size 0.09 mm) in a mass ratio of 1:1:1:1, as shown in Table 2, Table 3, Table 4 and Table 5. The clay was then stirred with a moderate amount of 25 °C water to make it sticky and homogeneous. Third, the two swords (L04 and L05) were covered with clay using two different methods in order to obtain different patterns. The first method was to paste the clay on the entire sword (L04) and then remove some clay near the cutting edge to form a wavy pattern, as shown in Figure 2a, and the second method was to squeeze the clay over the entire sword (L05) to form a mesh pattern, as shown in Figure 2b. Both of the coated swords were heated uniformly along the length until becoming totally red (800~820 °C). Next, the swords were plunged into water horizontally with the edge down. The precise temperature of a heated sword and the cooling water depends on the school of forging as well as the material properties and sword dimensions. Water was historically the predominant quenchant as it was considered to result in good hardenability. The clay acts as an insulator and only the area not covered with it cools at a fast enough rate to achieve selective quenching. Finally, the surface of the swords was then ground and polished unless any defects such as quenching cracks were not discovered, and the pattern at the boundary of the coated and uncoated area became detectable under blue light after acid washing. The wavy pattern on the front edge and lower sides of the L04 sword is shown in Figure 2c, and the mesh pattern on the entire surface of the L05 sword is shown in Figure 2d.

2.2. Sample Preparation

One sample was cut from the sword L04 with the wavy pattern, and another sample was cut from the sword L05 with the mesh pattern. Both samples were obtained by cutting cuboids of 10 × 5 × 5 mm along the longitudinal section of the blade that were then ground and polished by emery paper from 320 to 3000 grit and subsequently polished using 100 nm diamond spray suspension. Finally, the samples were cleaned completely with ethyl alcohol prior to analysis.

2.3. Characterization of the Microstructure

To analyze the effects of the different types of quenching with the clay on changes in the micro-structure of each sword, the metallographic morphologies of the cross-section were observed using an optical microscope (DMI5000 microscope, Leica, Wetzlar, and Germany). These morphologies were noticeably different for each clay coating method. Physical phase analysis of the samples was carried out using an XRD-Bruker D8 (Billerica, MA, USA) equipped with a Cu-Kα X-ray beam generator and an area detector. The working voltage used for this analysis was 40 kV, the working current was 40 mA, and the scanning speed was 20°/min. Physical phase search and XRD profiles were then conducted using the Jade 9.0 software.

2.4. Microhardness Tests

To characterize the evolution of hardness during the quenching process and to compare the hardness of each sample, we performed Vickers indentation tests using a microhardness tester (HXD-1000TMC, Taiming Optical Instrument Co., Ltd., Shanghai, China). A load of 200 g was applied for a duration of 15 s. To measure microhardness, the cross-section of each sample was divided into eight regions at locations 2 mm apart from each other. An average of three readings was calculated for each region, and these readings were taken at locations 200 μm apart from each other. The average values of three readings from eight regions were plotted.

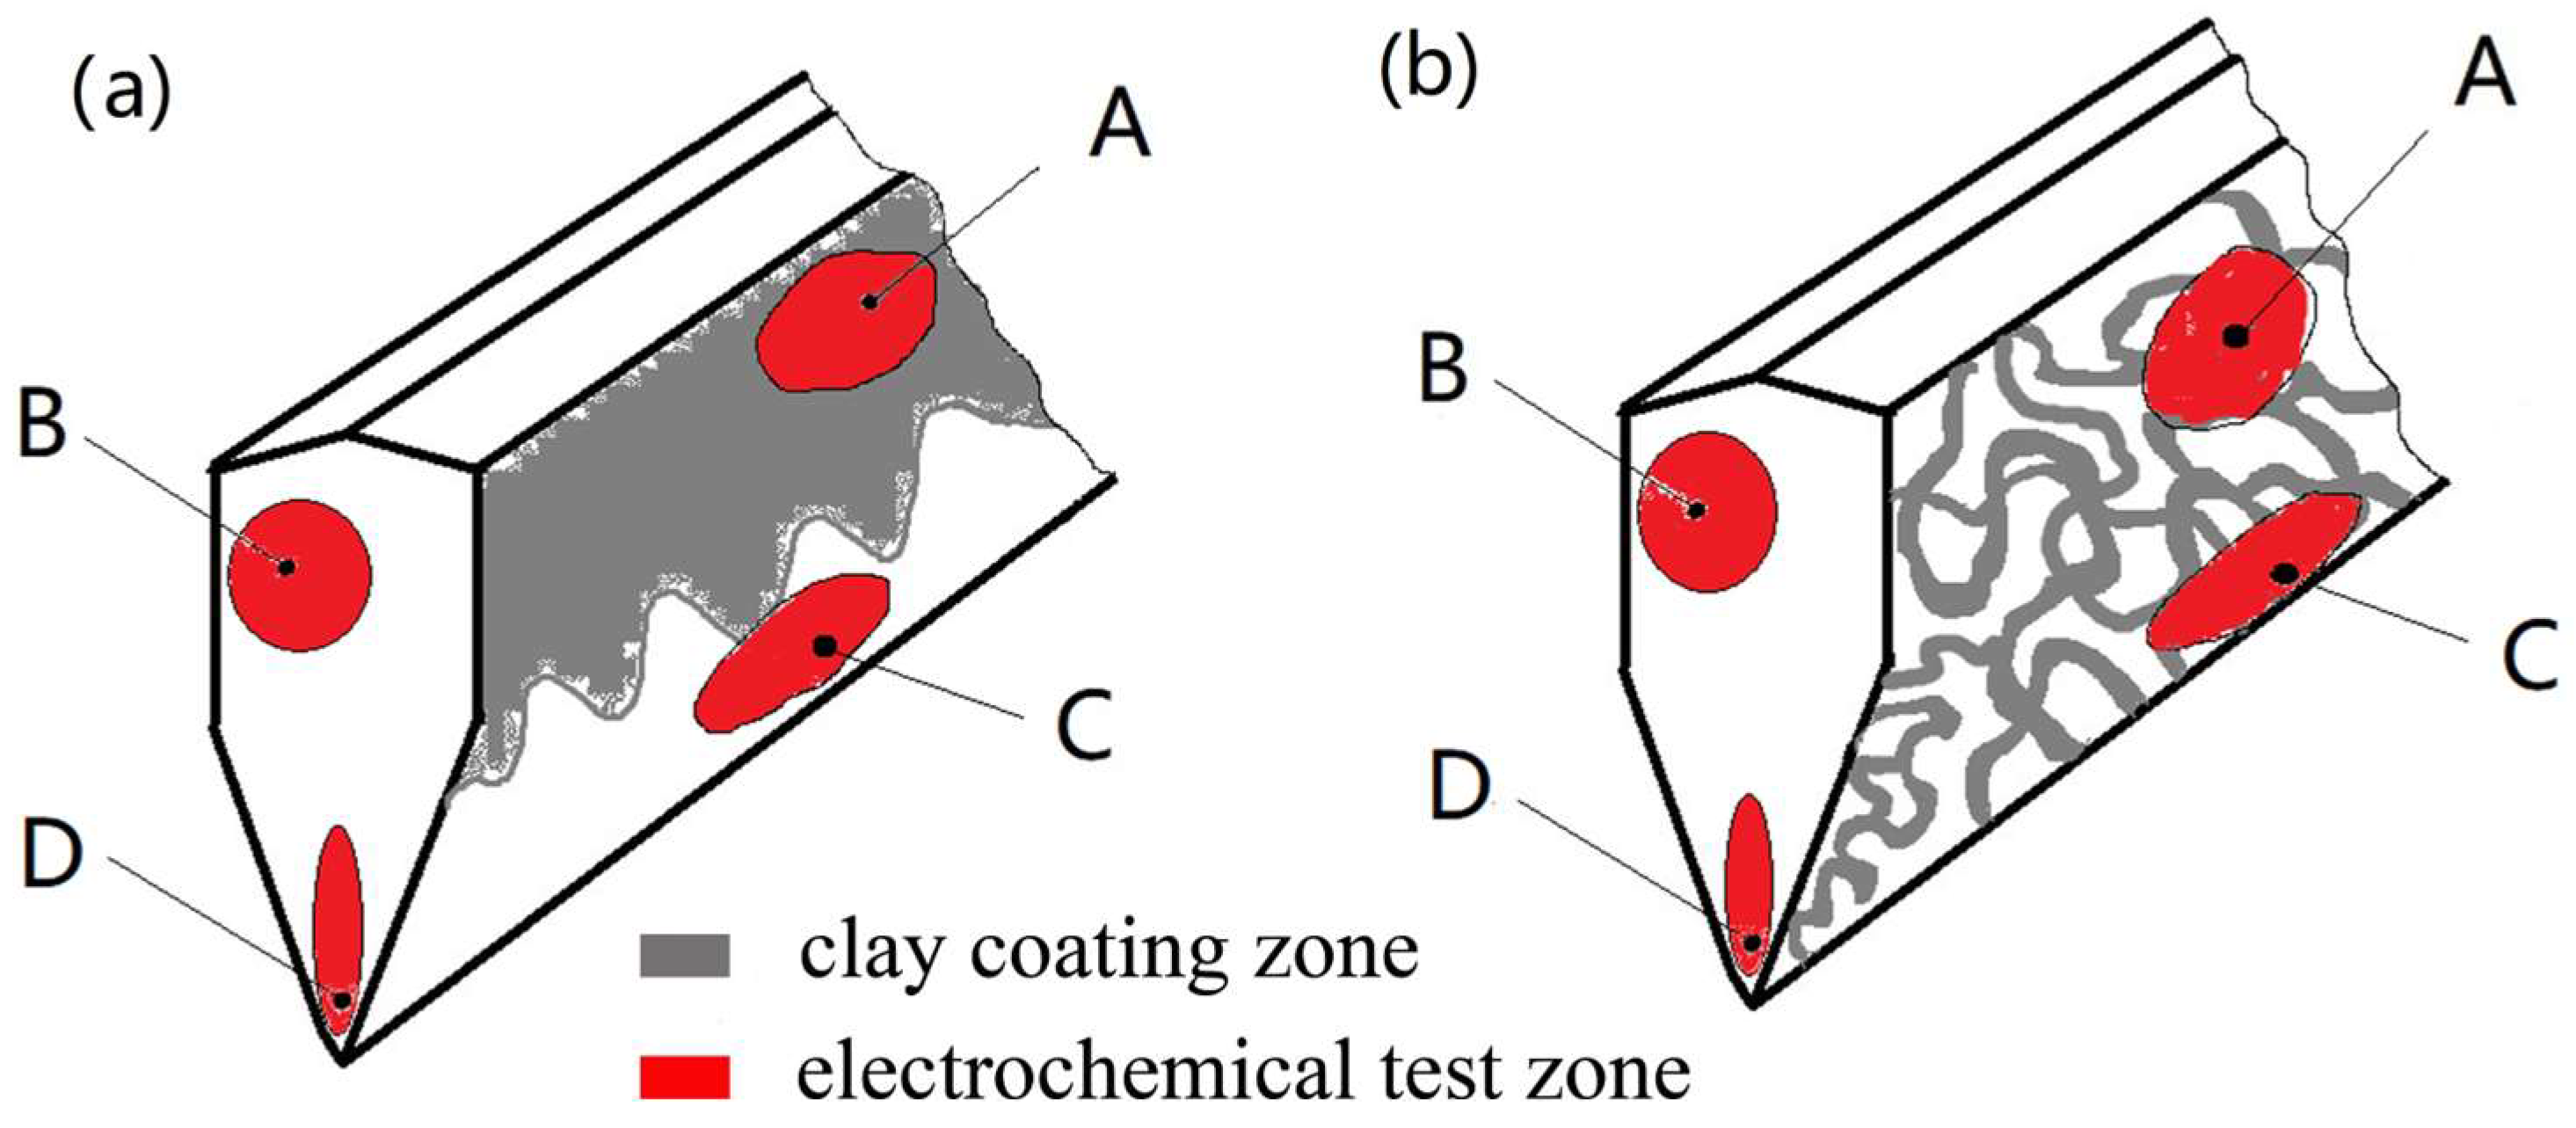
2.5. Electrochemical Corrosion Behavior

In order to investigate the corrosion resistance properties of the samples, electrochemical tests were performed on an electrochemical workstation (CORRTEST CS350H) using a three-electrode system that comprised a platinum sheet as the auxiliary electrode, a saturated calomel electrode (SCE) as the reference electrode, and the grounded sword samples as the working electrode. The untested areas were covered by the peelable insulating adhesive that was removed after testing. Electrochemical corrosion tests were performed in 3.5 wt.% neutral NaCl solution. Potentiodynamic polarization measurements were initiated at 250 mV below the open-circuit potential (OCP) and scanned toward the positive direction at a scan rate of 1 mV/s until the anodic current density reached 1 mA/cm2. Tafel extrapolation was used to analyze the polarization data, and an electrochemical impedance spectrum (EIS) test was carried out at the OCP under a 10 mV AC excitation voltage with a frequency range of 0.01 Hz to 100 kHz [12,13,14,15]. We used the Apollo 300 field emission scanning electron microscope (SEM) equipped with energy dispersive X-ray spectroscopy (EDS) to observe the corrosion performance of the two samples.

3. Results

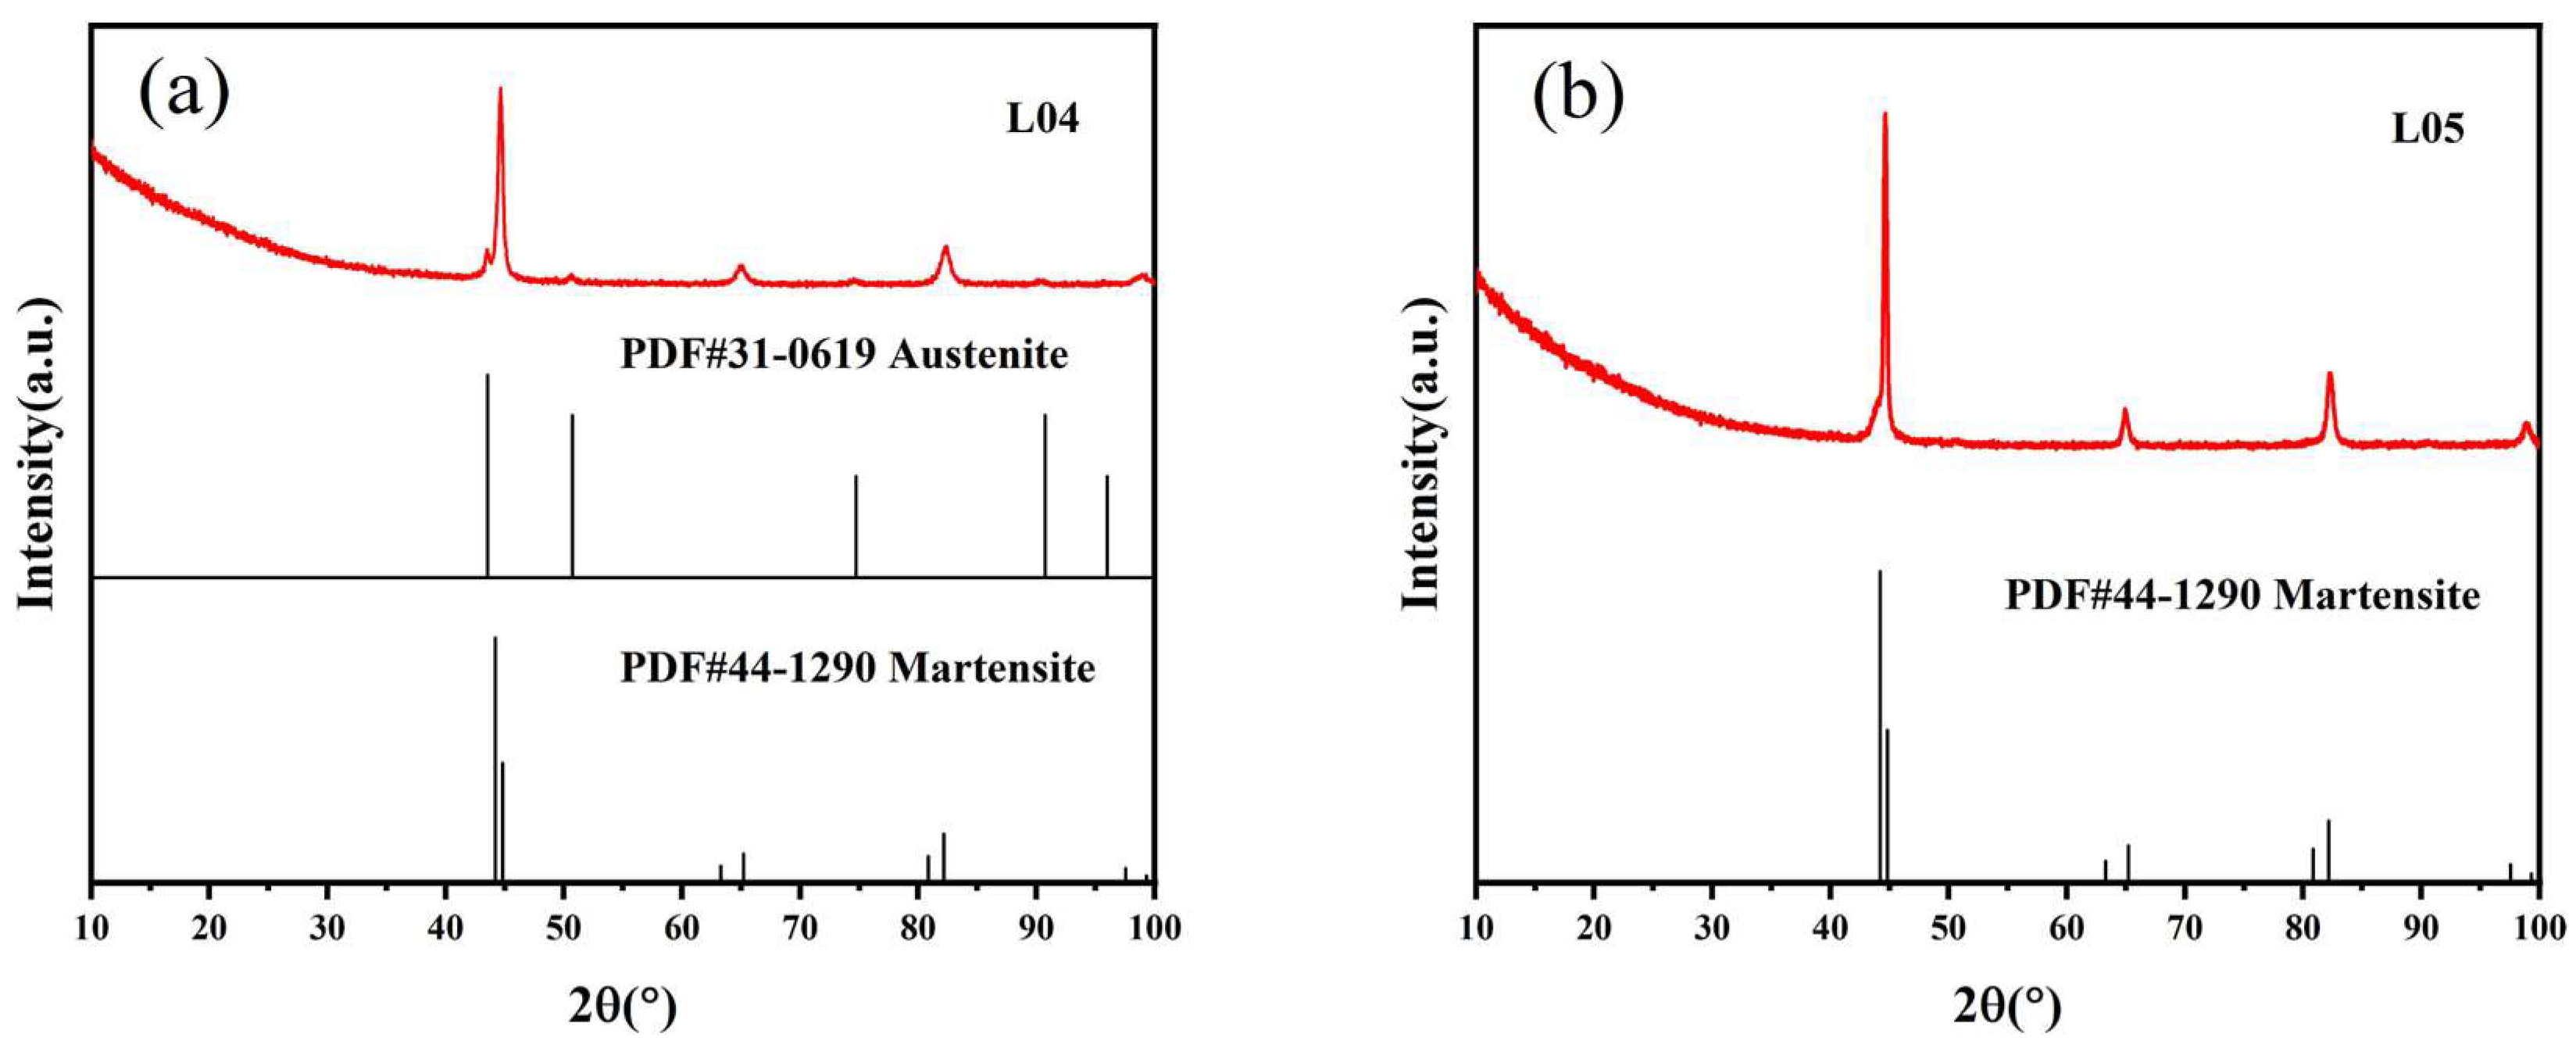
3.1. Characterization of the Microstructure

The metallographic observation areas of L04 and L05 were divided into A, B, and C zones and A and B zones, respectively, according to each sword’s metallographic structure, as shown in Figure 3. The microstructure of these areas directly corresponds to the microstructure of the sides of the swords and thus directly demonstrate the effects of the particular method of quenching with the clay. The corresponding metallographic features obtained by an optical microscope are shown in Figure 4 and Figure 5.
Evidently, the microstructure of L04 was heterogeneous. The cross-section of zone A consisted of pearlite inside the grain and some cementite surrounding the grain boundary, as shown in Figure 4a. As a result, we can conclude that the area covered by clay was cooled at a slower rate during quenching due to the barrier effect of the clay coating. However, zone C of L04 was characterized by containing mostly martensite, indicating that the cooling rate of the uncoated area was fast enough to help transform the edge microstructure directly from unstable austenite to martensite, as shown in Figure 4c. Moreover, zone B located at the border between the coated and uncoated area, where the cooling rate was faster than zone A but slower than zone C, had a transition of pearlite mixed with martensite, as shown in Figure 4b. Apparently, the objective of the clay coating was to control the intensity of heat transfer, which resulted in the observed variations in the microstructure after water quenching. As a consequence, the first clay coating method that resulted in a wavy pattern turned out to be nothing more than heat treatment of the uncoated area of L04.
In contrast to L04, L05 had a more homogeneous metallographic structure. Zone A was predominantly acicular martensite and carbide in some areas and a mixture of lath martensite and acicular martensite in other areas, as shown in Figure 5a,b. Additionally, the proportion of the transition zone was higher than that of L04 as a result of the interlacing clay on the surface of L05. Due to the thin edge, the clay on this area had little effect on its cooling rate, however. Hence, zone B of L05 was acicular martensite, which was the same as the edge of L04, as shown in Figure 5c. In short, the structural discrepancy between the cutting edge zone and other zones in L05 was not as great as with L04, indicating that the second clay coating method that resulted in the mesh pattern was equivalent to the heat treatment of the whole area of L05.
XRD analysis was performed to complement the observations that were made on the microstructures of the samples. After these tests, the resulting spectra were compared to standard PDF cards using Jade 9.0 software, as shown in Figure 6. In addition to martensite, L04 had more residual austenite than L05, indicating that the first way, which produced a wavy pattern, had a stronger hindering effect on cooling and produced a more diverse structure. This result agreed with the chemical composition provided in Table 1 and the metallographic structure provided in Figure 4 and Figure 5.

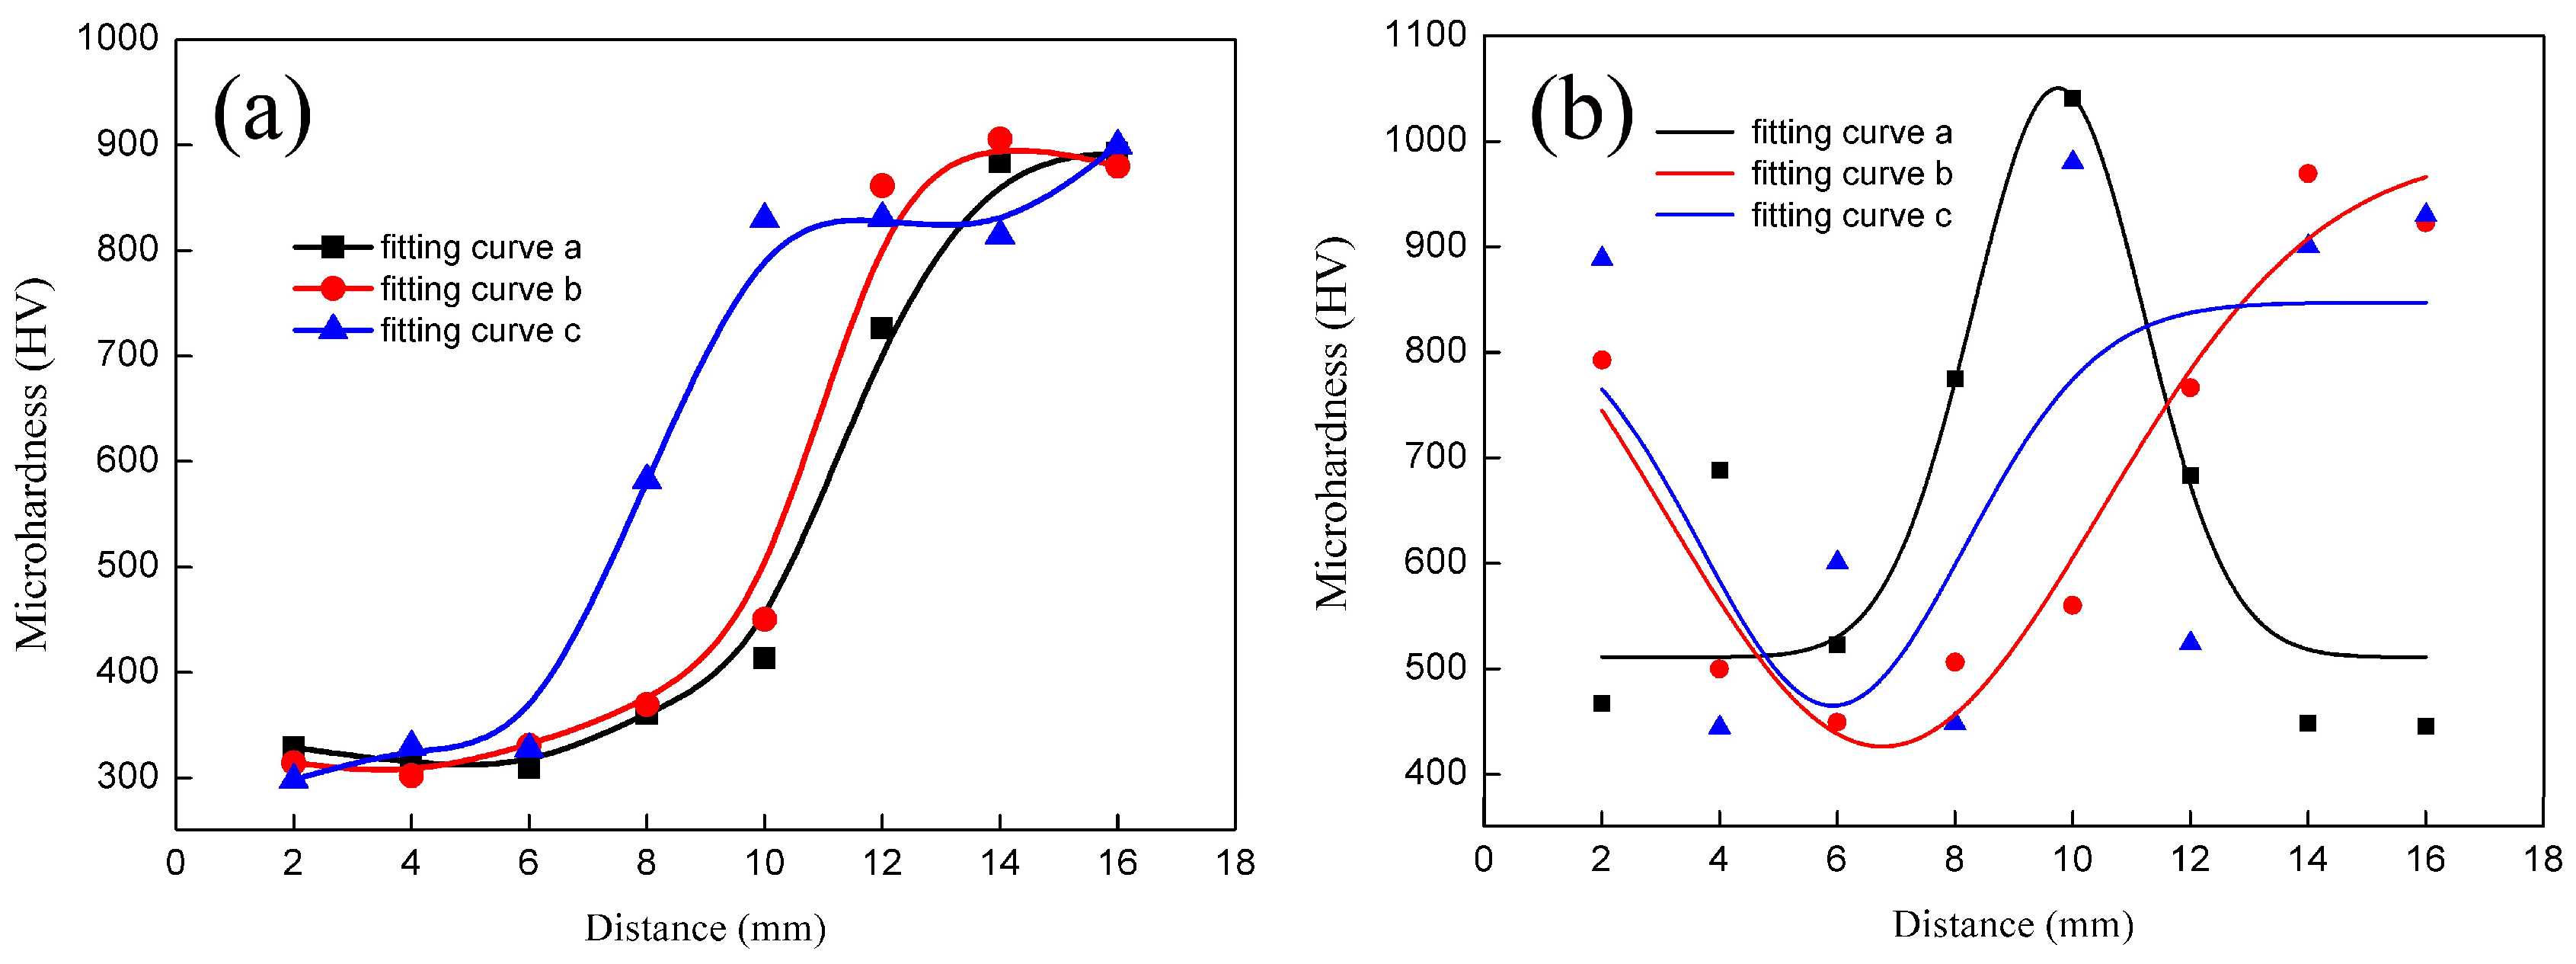
3.2. Microhardness Tests

In the cross-section of both swords, micro-Vickers hardness was measured along the center line and both sides from the a, b, and c directions, and the fitted hardness curves of L04 in all three directions from the blade edge to the back of the sword were relatively similar, as shown in Figure 7a. The hardness value of the front edge and lower sides was significantly higher (mean value 850 HV) than that of the upper part of the cross-section (mean value 320 HV), indicating that the first clay coating way for the wavy pattern had the effect of partial hardening. Obviously, any area not covered with clay would have been hardened by quenching. In addition, the border between the quenched and unquenched regions had an intermediate value (mean value 600 HV), avoiding sudden changes in hardness and stress cracks. The transition zone of the c-direction had higher hardness values than that of the other two as well, likely due to the thinner coat of clay and corresponding faster cooling rate. The hardness value of the various testing sites corroborated the corresponding phase structure. Thus, L04 obtained its desirable combination of strength and toughness by combining the different hardness of the edge and the back, and the wavy pattern along the length of the blade divided the blade into hardened and unhardened areas.
Compared to L04, the hardness curves of L05 were not regular, as shown in Figure 7b. L05 had low and high hardness distributed in the upper and lower sides that were in relation to the non-uniformity of the coating, resulting in a non-uniform hardness distribution throughout the cross-section. Therefore, the highest value of 1000 HV occurred in the center rather than at the edge because of different cooling rate caused by the uncoated regions in the center and coated regions at the edge. Despite the variation in hardness, however, the average value for L05 (700 HV) was higher than that for L04 (600 HV), indicating that the second clay coating method provided better hardenability than the first. Unlike L04, which had a distinct difference in hardness between the back and the edge, L05 achieved its strength and toughness through the homogeneity of its hardness overall.

3.3. Electrochemical Corrosion Behavior

3.3.1. Potentiodynamic Polarization Tests

The electrochemical testing zone and the corresponding polarization curves are shown in Figure 8 and Figure 9, respectively. The different testing zones of the two samples showed a similar pattern in potentiodynamic polarization curves, indicating that both samples had experienced the same oxygen reduction corrosion reactions and that this did not change depending on the way of clay coating. When the overpotential of the anode branch was greater than 50 to 100 mV and the overpotential of the cathode branch was greater than 55 mV, the logarithmic current density was approximately linear in relation to the applied potential, approaching Tafel-type behavior [16,17,18]. The polarization curves were fitted using the Tafel extrapolation method, and the results are shown in Table 6.
The anodic Tafel slope (ba) shows the resistance in the anode reaction, which in this case was the ionization of iron. The cathodic Tafel slope (bc) indicates the resistance of oxygen reduction, which in this case was the resistance of oxygen to hydroxide [19,20]. If the corrosive power is ignored, a larger corrosion resistance corresponds to a slower corrosion rate. The anodic Tafel slope (ba) for each testing zone of L05 was greater than that of L04, and the cathodic Tafel slope (bc) varied in the opposite direction to ba. The higher ba values of L05 revealed that it had higher resistance to iron anodic dissolution. The range of corrosion potential (Ecorr) for all samples was about −0.42 to −0.49 VSCE, and the values varied only slightly. Thus, changes in the value of Ecorr were insignificant between the two differently heat-treated samples. Importantly, since the corrosion rate is the result of the combined effect of the corrosion resistance of the swords and the corrosive ability of the solution, icorr can actually completely reflect the corrosion rate [21,22,23]. According to Faraday’s law, the corrosion rate is shown in the depth of corrosion (μm/a), which is calculated by the following Equation (1):
V d = i c o r r · M 2 ρ · F
where icorr is the current density, M is the molar mass, ρ is the density of matter, and F is Faraday’s constant. The icorr value is inversely proportional to the electrochemical reaction rate.
The lowest corrosion rate was observed in the A zone of L05 with a value of 2.48 μA/cm2. Researchers have reported that when heat treatment causes the homogeneous distribution of precipitated carbides in the steel’s matrix, an increase in corrosion resistivity occurs [24]. In the quenching process of L05, the second method of clay coating resulted in a more uniform cooling rate than that of L04 and thus caused a more homogeneous distribution of precipitated carbides in the L05 matrix. However, the highest corrosion rate, with a value of 10.44 μA/cm2, was observed to the D zone of L04, which had a martensite matrix. This is probably related to the naked edge (L04-D) having the highest cooling rate and thus transforming the steel into martensite with a low percentage of carbides that are also of small size. In this situation, the corrosion resistance is reduced [25]. Comparing the icorr values of each zone of L04 and L05, L05 had a lower value than L04.
In addition, the polarization resistance (Rp) was calculated by following Equation (2):
R p = b a · b c 2.303 ( b a + b c )
where ba is the anodic Tafel slope, and bc is the cathodic Tafel slope. A low Rp indicates a (relatively) higher corrosion rate, and vice versa. We observed that the Rp values of each test zone of L05 were greater than the values of the corresponding zone of L04. Since parameters icorr and Rp reflect corrosion rates directly [26,27,28], this result indicates clearly that the second method of clay coating reduced the corrosion rate more than the first.
Although the Tafel fit analysis is somewhat subjective [29], the mean and standard deviation were within reasonable limits. Hence, the results can reasonably be used to compare the effect of the two patterns on corrosion.

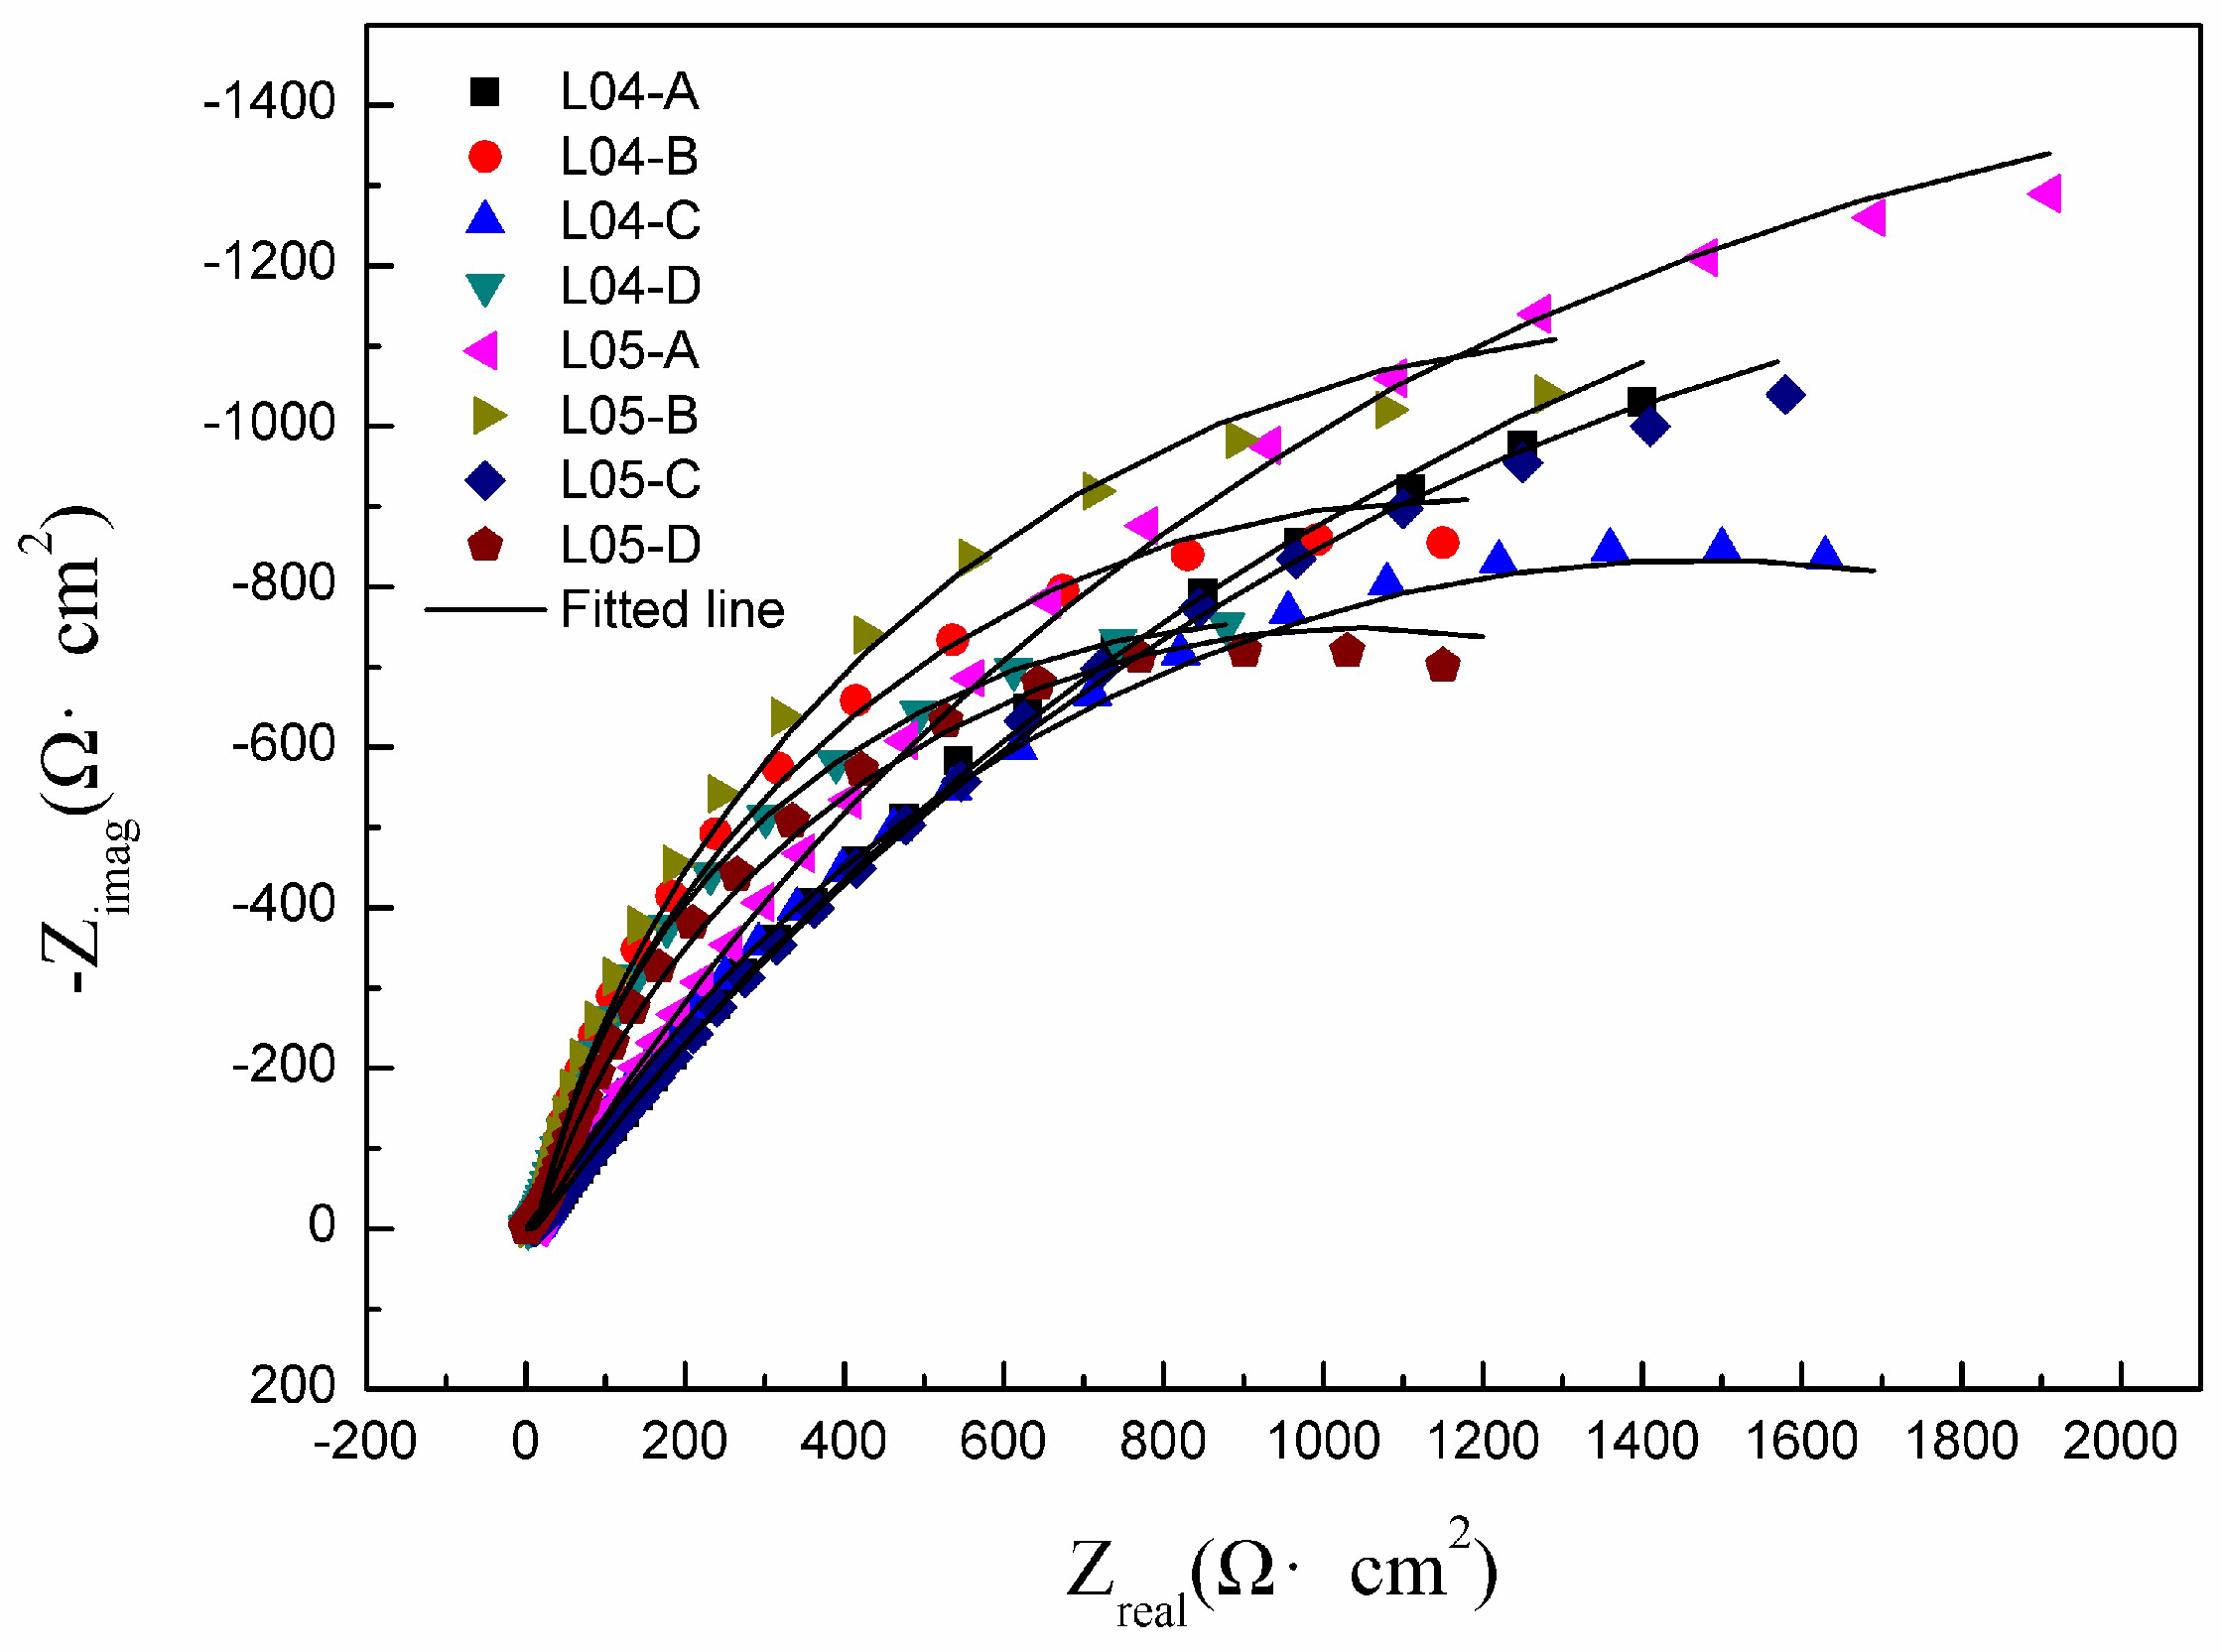
3.3.2. EIS Measurements

EIS measurements were used to evaluate the corrosion kinetic information and the associated mechanisms under the two different types of clay coating. Figure 10 shows the Nyquist plots of the EIS measurements of L04 and L05 in 3.5 wt.% NaCl solution in the frequency range from 100 kHz to 10 mHz. All of the curves exhibited a similar pattern of obvious capacitive arcs. These comparative curves of all tested zones thus show that both L04 and L05 exhibited similar corrosion behavior in the same aggressively corrosive environment.
In general, the impedance modulus at a low frequency (|Z|) can be used to measure the anti-corrosion performance of the samples [30,31,32]. From the Nyquist and Bode plots in Figure 10 and Figure 11a, we see that the capacitive arc of L05-A in the Nyquist curve and the impedance modulus in the Bode curve (|Z|) of L05-A were the largest, indicating that L05-A had the best corrosion resistance. Correspondingly, L04-D had the worst corrosion resistance with the smallest capacitive arc and |Z|. In addition, two obvious time constants can be observed in Figure 11b that correspond to the oxide film on the sample surfaces and the electrochemical reaction. Therefore, the equivalent circuit model was adopted as shown in Figure 12 to fit the impedance data in order to analyze the kinetics of the corrosion reaction quantitatively under the two different methods of quenching with the clay. The elements of the equivalent electrical circuit are as follows: Rs is the solution resistance, Qhf is the original surface capacitance at a high frequency, Rpo is the high-frequency resistance that corresponds to the resistance of the electrolyte and corrosion products, Rct is the charge transfer resistance at the active corroded surface at low frequencies, and Qlf is the interfacial capacitance of the corroded surface at low frequencies [33,34,35].
The fitting results are given in Table 7. The impedance of a CPE is: ZQ(ω) = [Y0(jω)n]−1, where Y0 and ω are the admittance magnitude of CPE and the angular frequency, respectively. n is the Q-power (0 < n ≤ 1), reflecting the dispersion effect. Rf represents the resistance of corrosion products. Rct is the decisive parameter for corrosion. In general, Rct is always used to indicate the corrosion rate of the metal electrodes in electrolyte solution because the electrons are the core reaction carriers in the charge transfer process [36]. The Rct of the testing regions of L05 had a higher value than L04, indicating that L05 had better corrosion resistance, which was consistent with the Tafel fit of the potentiodynamic polarization curves. Since the second method of clay coating produced a more uniform structure and avoided the clear-cut structure produced by the first method, the L05 sword was better able to resist corrosion. In addition, in both L04 and L05, the Rct of the back of the sword was greater than that of the edge (L04-A > L04-C, L04-B > L04-D, L05-A > L05-C, L05-B > L05-D), indicating that the back had better corrosion resistance. Due to the severe lattice distortion of single-phase martensite and stress concentration at the edges, the corrosion activity at the edges was more active than that of the two-phase pearlite at the backs, even though a two-phase structure was less corrosion-resistant than the single-phase structure, theoretically [11]. These results show that the stress state as well as the structural homogeneity had a significant influence on corrosion [37].

3.3.3. Corrosion Morphologies

Figure 13 shows the SEM images of samples after corrosion testing. The back and edge zones of L04 both had the characteristics of local corrosion, including intergranular corrosion and pitting corrosion, which are closely related to microstructure and residual stress [38,39], as shown in Figure 13a–c. However, the back of L05 experienced local corrosion, while its edge zone was uniformly corroded and the corrosion points did not comprise to lines, as shown in Figure 13d–f. The corrosion of L04 was also more severe than that of L05 because the increased residual austenite and multiphase microstructure made for a larger difference in the structure between the cathode and anode area, resulting in a larger discrepancy of electrochemical activity and a higher tendency to corrode.

4. Conclusions

(1) The quenching by two different methods of clay coating not only provided two swords (L04 and L05) that both had desirable strength and toughness but also gave their surfaces unique patterns, a wavy pattern and a mesh pattern, respectively.
(2) The metallographic structure of L04 was pearlite and reticulated carburite at the back of the blade and martensite at the edge, and this structure was bounded by the wavy pattern. The metallographic structure of L05 was acicular martensite and lath martensite at the back of the blade and acicular martensite at the edge, with no obvious boundaries. The structure of L05 was more homogeneous than that of L04, as borne out by the XRD tests of each sample.
(3) Microhardness tests showed that the strength and toughness properties of L04 were achieved by its lower hardness (mean value 320 HV) at the back and the higher hardness (mean value 850 HV) of the edge, whereas the strength and toughness properties of L05 were achieved by its high hardness throughout (mean value 640 HV of the back and 725 HV of the edge). The results of our microhardness tests were consistent with our microstructure analysis.
(4) The potentiodynamic polarization results showed that each testing zone of L04 (with icorr values 2.93~10.44 μA·cm−2) had higher corrosion rates compared to the corresponding zones of L05 (with icorr values 2.48~8.08 μA·cm−2). Furthermore, the Rp values of each test zone of L04 (1908~6716 Ω·cm2) were lower than the values of the corresponding zone of L05 (2341~8260 Ω·cm2). These results indicate that L05 had better anti-corrosion properties.
(5) As the Nyquist and Bode plots show, zone A of L05 had the best corrosion resistance, and zone D of L04 had the worst corrosion resistance. The EIS experimental data revealed that the Rct values of L04 (1988~4526 Ω·cm2) were lower than those of L05 (2018~4808 Ω·cm2) as well, indicating that L05 had better corrosion resistance than L04 and that the back of the swords had better corrosion resistance than the edges. These results further reflected that the second method of clay coating reduced the corrosion rate more than the first, which is attributable to the homogeneity of the structure and stress state.

Author Contributions

Methodology and manuscript review, W.W.; investigation, C.B.; formal analysis, S.L.; data curation, S.D.; writing—original draft preparation, Q.C.; writing—review and editing, X.L. All authors have read and agreed to the published version of the manuscript.

Funding

This research was funded by the National Natural Science Foundation of China (No. 51861135307), the Postgraduate Research and Practice Innovation Program of Jiangsu Province (No. KYCX21_0981), the Scientific Research of Universities of Hebei Province (No. ZC2022025), and the Science and Technology Support of Langfang City project (No. 2022011034, No. 2021011076), Central Government Guidance Funds for Local Scientific and Technological Development (No. 236Z1012G).

Institutional Review Board Statement

Not applicable.

Informed Consent Statement

Not applicable.

Data Availability Statement

Not applicable.

Acknowledgments

The authors express sincere thanks to Qinglong Li for technical guidance on clay coating. The authors thank Lizhong Wu and Xianguang Zhou for their guidance and cooperation. The authors thank Guorong Zheng and Ajin Chen for showing me their intricate and beautiful works. The authors thank Ping Chen and Yicheng Cui for their help. Their patience is greatly appreciated.

Conflicts of Interest

The authors declare no conflict of interest.

References

  1. Mackenzie, D. History of quenching. Int. Heat Treat. Surf. Eng. 2008, 2, 68–73. [Google Scholar] [CrossRef]
  2. Wadsworth, J.; Lesuer, D. Ancient and modern laminated composite—From the Great Pyramid of Gizeh to Y2K. Mater. Charact. 2000, 45, 289–313. [Google Scholar] [CrossRef]
  3. Notis, M. The history of the metallographic study of the Japanese sword. Mater. Charact. 2000, 45, 253–258. [Google Scholar] [CrossRef]
  4. Inoue, T. The Japanese sword the material, manufacturing and computer simulation of quenching process. Mater. Sci. Res. Int. 1997, 4, 193–203. [Google Scholar]
  5. Harjo, S.; Kawasaki, T.; Grazzi, F.; Shinohara, T.; Tanaka, M. Neutron diffraction study on full-shape Japanese sword. Materialia 2019, 7, 100377. [Google Scholar] [CrossRef]
  6. Pham, A.; Ohba, T.; Morito, S.; Hayashi, T. Automatic reconstruction approach to characterization of prior-austenite microstructure in various Japanese swords. Mater. Trans. 2015, 56, 1639–1647. [Google Scholar] [CrossRef]
  7. Yaso, M.; Takaiwa, T.; Minagi, Y.; Kanaizumi, T.; Kubota, K.; Hayashi, T.; Morito, S.; Ohba, T. Study of Japanese sword from a viewpoint of steel strength. J. Alloys Compd. 2013, 577S, S690–S694. [Google Scholar] [CrossRef]
  8. Tanimura, H. Development of the Japanese sword. JOM 1980, 32, 63–73. [Google Scholar] [CrossRef]
  9. Inoue, T. Tatara and the Japanese sword: The science and technology. Acta Mech. 2010, 214, 17–30. [Google Scholar] [CrossRef]
  10. William, D. Materials Science and Engineering: An Introduction, 7th ed.; John Wiley& Sons. Inc.: New York, NY, USA, 2009; pp. 623–637. [Google Scholar]
  11. Wu, W.; Li, X. Investigation of effect of heat treatment on the Han dynasty steel sword corrosion by electrochemical corrosion testing. Int. J. Electrochem. Sci. 2022, 17, 221268. [Google Scholar] [CrossRef]
  12. Tian, W.; Chen, F.; Cheng, F.; Li, Z.; Pang, G. Corrosion properties of pure aluminum prepared by spark plasma sintering (SPS) using different grain size of aluminium powders as raw material. Int. J. Electrochem. Sci. 2020, 15, 9120–9134. [Google Scholar] [CrossRef]
  13. Liang, Z.; Jiang, K.; Feng, B.; Lin, S.; Chao, X.; Sui, Q.; Zhang, T. Corrosion evolution of Cu-Pb alloys from the Western Zhou dynasty in simulated archaeological soil environment. J. Electroanal. Chem. 2021, 899, 115688. [Google Scholar] [CrossRef]
  14. Wang, Q.; Cao, X.; Wu, T.; Liu, M.; Li, C.; Yin, F. Corrosion of X80 steel welded joint under disbonded coating in an acidic soil solution. Int. J. Pres. Ves. Pip. 2021, 194, 104508. [Google Scholar] [CrossRef]
  15. Tian, W.; Li, Z.; Kang, H.; Cheng, F.; Chen, F.; Pang, G. Passive film properties of bimodal grain size AA7075 aluminium alloy prepared by spark plasma sintering. Materials 2020, 13, 3236. [Google Scholar] [CrossRef]
  16. Tian, W.; Chen, F.; Li, Z.; Pang, G.; Meng, Y. Corrosion product concentration in a single three-dimensional pit and the associated pitting dynamics. Corros. Sci. 2020, 173, 108775. [Google Scholar] [CrossRef]
  17. Jafery, K.M.; Embong, Z.; Othman, N.; Yaakob, N.; Shah, M.; Hashim, N. Initial stage of corrosion formation for X70 pipeline external surface in acidic soil (peat) environment. Mater. Today Proc. 2022, 51, 1381–1387. [Google Scholar] [CrossRef]
  18. Qin, Q.; Wei, B.; Bai, Y.; Fu, Q.; Xu, J.; Sun, C.; Wang, C.; Wang, Z. Effect of alternating current frequency on corrosion behavior of X80 pipeline steel in coastal saline soil. Eng. Fail. Anal. 2021, 120, 105065. [Google Scholar] [CrossRef]
  19. Wei, B.; Xu, J.; Cheng, Y.; Sun, C.; Yu, C.; Wang, Z. Effect of uniaxial elastic stress on corrosion of X80 pipeline steel in an acidic soil solution containing sulfate-reducing bacteria trapped under disbonded coating. Corros. Sci. 2021, 193, 109893. [Google Scholar] [CrossRef]
  20. Zhu, M.; Zhao, B.; Yuan, Y.; Yin, S.; Guo, S. Effect of annealing temperature on microstructure and corrosion behavior of CoCrFeMnNi high-entropy alloy in alkaline soil simulation solution. Mater. Chem. Phys. 2022, 279, 125725. [Google Scholar] [CrossRef]
  21. Yang, L.; Zhang, H.; Zhang, S.; Shi, Z.; Wei, C.; Ma, M.; Liu, R. Effect of Cu content on the corrosion behavior of Ti-based bulk amorphous alloys in HCl solution. Mater. Lett. 2023, 337, 133742. [Google Scholar] [CrossRef]
  22. Liu, C.; Gao, Y.; Chong, K.; Guo, F.; Wu, D.; Zou, Y. Effect of Nb content on the microstructure and corrosion resistance of FeCoCrNiNbx high-entropy alloys in chloride ion environment. J. Alloys Compd. 2023, 935, 168013. [Google Scholar] [CrossRef]
  23. Shi, Z.; Wang, Z.; Wang, X.; Zhang, S.; Zheng, Y. Effect of thermally induced B2 phase on the corrosion behavior of an Al0.3CoCrFeNi high entropy alloy. J. Alloys Compd. 2022, 903, 163886. [Google Scholar] [CrossRef]
  24. Ahmadi, M.; Mirzaee, O.; Azadi, M.; Biukani, H. Effects of various double-quenching treatments on the microstructure and corrosion properties of D2 tool steel. Int. J. Pres. Ves. Pip. 2023, 202, 104915. [Google Scholar] [CrossRef]
  25. Khan, M.; Sarkar, A.; Mehtani, H.; Raut, P.; Prakash, A.; Prasad, M.; Samajdar, I.; Parida, S. Microstructure and aqueous corrosion in carbon steel: An emerging correlation. Mater. Chem. Phys. 2022, 290, 126623. [Google Scholar] [CrossRef]
  26. Tian, W.; Chen, F.; Li, Z.; Pang, G.; Li, Y. Stress corrosion cracking of 05Cr17Ni4Cu4Nb and 1Cr12Ni3Mo2VN martensitic stainless steels under constant load. Int. J. Electrochem. Sci. 2020, 15, 6572–6581. [Google Scholar] [CrossRef]
  27. Kang, L.; Zeng, Q.; Wang, B.; Zeng, J.; Liao, B.; Wu, H.; Cheng, Z.; Guo, X. Facile fabrication of multi superlyophobic nano soil coated-mesh surface with excellent corrosion resistance for efficient immiscible liquids separation. Sep. Purif. Technol. 2022, 284, 120266. [Google Scholar] [CrossRef]
  28. Azoor, R.; Deo, R.; Birbilis, N.; Kodikara, J. On the optimum soil moisture for underground corrosion in different soil types. Corros. Sci. 2019, 159, 108116. [Google Scholar] [CrossRef]
  29. Rossi, S.; Pinamonti, M.; Calovi, M. Influence of soil chemical characteristics on corrosion behaviour of galvanized steel. Case Stud. Constr. Mat. 2022, 17, e01257. [Google Scholar] [CrossRef]
  30. Ye, Y.; Liu, Z.; Liu, W.; Zhang, D.; Zhao, H.; Wang, L.; Li, X. Superhydrophobic oligoaniline-containing electroactive silica coating as pre-process coating for corrosion protection of carbon steel. Chem. Eng. J. 2018, 348, 940–951. [Google Scholar] [CrossRef]
  31. Yin, X.; Mu, P.; Wang, Q.; Li, J. Superhydrophobic ZIF-8-based dual-layer coating for enhanced corrosion protection of Mg alloy. ACS Appl. Mater. Interfaces 2020, 12, 35453–35463. [Google Scholar] [CrossRef]
  32. Li, C.; Li, Y.; Wang, X.; Yuan, S.; Lin, D.; Zhu, Y.; Wang, H. Synthesis of hydrophobic fluoro-substituted polyaniline filler for the long-term anti-corrosion performance enhancement of epoxy coatings. Corros. Sci. 2021, 178, 109094–109104. [Google Scholar] [CrossRef]
  33. Liu, H.; Cheng, Y. Corrosion of initial pits on abandoned X52 pipeline steel in a simulated soil solution containing sulfate-reducing bacteria. J. Mater. Res. Technol. 2020, 9, 7180–7189. [Google Scholar] [CrossRef]
  34. Ma, H.; Zhao, B.; Liu, Z.; Du, C.; Shou, B. Local chemistry–electrochemistry and stress corrosion susceptibility of X80 steel below disbonded coating in acidic soil environment under cathodic protection. Constr. Build. Mater. 2020, 243, 118203. [Google Scholar] [CrossRef]
  35. Fan, Y.; Chen, C.; Zhang, Y.; Liu, H.; Liu, H.; Liu, H. Early corrosion behavior of X80 pipeline steel in a simulated soil solution containing Desulfovibrio desulfuricans. Bioelectrochemistry 2021, 141, 107880. [Google Scholar] [CrossRef]
  36. Su, P.; Wu, X.; Guo, Y.; Jiang, Z. Effects of cathode current density on structure and corrosion resistance of plasma electrolytic oxidation coatings formed on ZK60 Mg alloy. J. Alloys Compd. 2009, 475, 773–777. [Google Scholar] [CrossRef]
  37. Osório, W.; Peixoto, L.; Garcia, L.; Garcia, A. Electrochemical corrosion response of a low carbon heat treated steel in a NaCl solution. Mater. Corros. 2009, 60, 804–812. [Google Scholar] [CrossRef]
  38. Qin, J.; Li, Z.; Ma, M.; Yi, D.; Wang, B. Diversity of intergranular corrosion and stress corrosion cracking for 5083 Al alloy with different grain sizes. Trans. Nonferrous Met. Soc. China 2022, 32, 765–777. [Google Scholar] [CrossRef]
  39. Wang, S.; Lamborn, L.; Chen, W. Pre-cyclic-loading-enhanced Stage-1b stress corrosion crack growth of pipeline steels. Corros. Sci. 2022, 208, 110693. [Google Scholar] [CrossRef]
Figure 1. Section of a sword. (a) Clay coating; (b) blade pattern [4].
Coatings 13 01904 g001
Figure 2. Two types of clay coating and their resulting blade patterns. (a) Clay coating method one; (b) clay coating method two; (c) the L04 sword with the wavy pattern from method one; (d) the L05 sword with the mesh pattern from method two.
Coatings 13 01904 g002
Figure 3. Metallographic observation areas. (a) L04; (b) L05.
Coatings 13 01904 g003
Figure 4. Metallographic morphologies of L04. (a) zone A; (b) zone B; (c) zone C.
Coatings 13 01904 g004
Figure 5. Metallographic morphologies of L05. (a,b) zone A; (c) zone B.
Coatings 13 01904 g005
Figure 6. XRD profiles. (a) L04; (b) L05.
Coatings 13 01904 g006
Figure 7. Microhardness curves. (a) L04; (b) L05.
Coatings 13 01904 g007
Figure 8. Electrochemical testing zones. (a) L04; (b) L05.
Coatings 13 01904 g008
Figure 9. Typical potentiodynamic polarization curves of the samples.
Coatings 13 01904 g009
Figure 10. Typical Nyquist plots for EIS testing of L04 and L05.
Coatings 13 01904 g010
Figure 11. Bode plots for both samples in 3wt.% NaCl solution. (a) The Bode impedance modulus plots; (b) the Bode phase angle plots.
Coatings 13 01904 g011
Figure 12. The equivalent circuit used to fit the impedance plots.
Coatings 13 01904 g012
Figure 13. Typical corrosion morphologies of the samples. (ac) L04; (df) L05.
Coatings 13 01904 g013
Table 1. Chemical composition of the steel bars (wt.%).
CSiMnPSLoss
0.980.30.20.030.0298.47
Table 2. Chemical composition of the silica sand (wt.%).
SiO2Al2O3Fe2O3CaOMgOK2ONa2OLoss
70.612.53.85.62.22.91.80.6
Table 3. Chemical composition of the borax (wt.%).
Na2B4O7ChlorideSulfateCarbonate
95.10.03<0.20.1
Table 4. Chemical composition of the iron powder (wt.%).
FeCuSZnOSn
99.990.0030.0030.0010.0020.001
Table 5. The composition of the carbon powder (wt.%).
Fixed CarbonAsh ContentVolatiles
85.6513.061.29
Table 6. Tafel extrapolation results for the potentiodynamic polarization curves of the samples.
Samplesba
(mV∙dec−1)
bc
(mV∙dec−1)
icorr
(μA·cm−2)
Ecorr
(VSCE)
Corrosion Rate
(μm/a)
Rp
(Ω·cm2)
L04-A56 ± 7236 ± 402.93 ± 0.42−0.460.068 ± 0.016716
L04-B57 ± 6302 ± 458.73 ± 1.23−0.460.204 ± 0.032388
L04-C46 ± 4231 ± 323.67 ± 0.52−0.440.086 ± 0.014544
L04-D53 ± 5339 ± 4010.44 ± 1.56−0.450.245 ± 0.031908
L05-A59 ± 7234 ± 282.48 ± 0.35 −0.450.062 ± 0.018260
L05-B65 ± 8194 ± 255.12 ± 0.72−0.490.120 ± 0.014134
L05-C54 ± 7165 ± 163.01 ± 0.43−0.420.070 ± 0.015876
L05-D56 ± 8195 ± 298.08 ± 1.15−0.430.189 ± 0.022341
Table 7. Fitted results of the EIS experimental data.
SamplesY0 (S·sn·cm−2)nRhf (Ω·cm2)Rct (Ω·cm2)
L04-A5.64 × 10−40.910211 ± 1.554526 ± 601
L04-B3.14 × 10−40.894719 ± 2.692312 ± 332
L04-C3.69 × 10−40.893116 ± 2.053037 ± 458
L04-D1.56 × 10−40.856734 ± 4.891988 ± 268
L05-A3.91 × 10−40.922317 ± 2.354808 ± 676
L05-B3.31 × 10−40.891814 ± 1.852837 ± 371
L05-C4.86 × 10−40.910812 ± 1.684732 ± 689
L05-D5.28 × 10−40.864824 ± 3.262018 ± 273
Disclaimer/Publisher’s Note: The statements, opinions and data contained in all publications are solely those of the individual author(s) and contributor(s) and not of MDPI and/or the editor(s). MDPI and/or the editor(s) disclaim responsibility for any injury to people or property resulting from any ideas, methods, instructions or products referred to in the content.

