Article

High-Rate Epitaxial Growth of Silicon Using Electron Beam Evaporation at High Temperatures

1
SINTEF Industry, P.O. Box 124 Blindern, 0314 Oslo, Norway
2
SINTEF Digital, 0314 Oslo, Norway
*
Author to whom correspondence should be addressed.
Coatings 2023, 13(12), 2030; https://doi.org/10.3390/coatings13122030
Submission received: 31 October 2023 / Revised: 24 November 2023 / Accepted: 28 November 2023 / Published: 30 November 2023

Abstract

:
This paper describes the high-rate (~1.5 μm/min) growth of Si films on Si supporting substrates with (100) crystallographic orientation at 600 °C, 800 °C, and 1000 °C in a vacuum environment of ~1 × 10⁻⁵ mbar using electron beam (e-beam) evaporation. The microstructure, crystallinity, and conductivity of such films were investigated. It was established that fully crystalline (Raman spectroscopy, EBSD) and stress-free epi-Si layers with a thickness of approximately 50 µm can be fabricated at 1000 °C, while at 600 °C and 800 °C, some poly-Si inclusions were observed using Raman spectroscopy. Hall effect measurements showed that epi-Si layers deposited at 1000 °C had resistivity, carrier concentration, and mobility comparable to those obtained for c-Si wafers fabricated through ingot growth and wafering using the same solar grade Si feedstock used for the e-beam depositions. The dislocation densities were determined to be ∼2 × 107 cm−2 and ∼5 × 106 cm−2 at 800 and 1000 °C, respectively, using Secco etch. The results highlight the potential of e-beam evaporation as a promising and cost-effective alternative to conventional CVD for the growth of epi-Si layers and, potentially, epi-Si wafers. Some of the remaining technical challenges of this deposition technology are briefly indicated and discussed.

1. Introduction

Recently, the chemical vapor deposition (CVD) method has been widely used for the manufacture of epitaxial silicon layers and epitaxial wafers. In the frame of the CVD approach, epitaxial layers can be deposited on relevant supporting substrates from a trichlorosilane source gas or a tetrachloride source gas at 1000 °C and above. The dopant gases are diboran or phosphin. The gas flows and process times must be carefully chosen to achieve the specified layer thickness, layer resistivity, and relevant requirements for defect density.
Deposition of epi-Si layers at high deposition rates followed by the lift-off step is extremely important for photovoltaics, which looks for kerfless/kerffree approaches to fabricate Si wafers in a cost-effective way to avoid losses of silicon during the wire sawing wafering step.
Today, high-quality monocrystalline silicon (Si) ingots are typically grown using the Czochralski (CZ) method and cut using wire sawing to thin wafers, creating the basis for different devices. The fabrication of thin wafers (around ~100 µm) is of increasing importance to reduce material consumption and to enable the processing of novel devices with increased functionality, such as flexible solar cells. However, due to the physical limitations of the sawing technology used today, especially the ratio between the saw thickness and the wafer thickness, an increasing amount of Si-material is lost in the cutting process as the wafer thickness continues to decrease. In fact, the thickness of wafers produced today is comparable to the thickness of the saw, giving about 50% Si material loss (kerf) per wafer produced. Although some material can be regained through kerf remelting [1], the achieved yield is strongly limited by several issues, such as material contamination, increased energy usage, handling and breakage of the cut wafers, and an increased number of processing steps. For these reasons, new approaches and methods must be developed to reduce the associated energy and material costs (and the environmental footprint) and enable continued technological development.
There are several different methods for producing “kerfless/kerffree” Si wafers without casting and sawing: the Direct Wafer® production process to fabricate high-performance “kerfless” silicon wafers directly from molten silicon [2], the “Smart-cut” process [3], epitaxial growth using CVD on a porous Si substrate followed by exfoliation of the epi-Si wafer [4,5], and some others, like stress-induced lift-off processes, which for several reasons have not achieved practical application in PV so far. Moreover, the edge-defined, film-fed growth (EFG) technique [6] has been commercialised but has not been able to stay competitive with the Cz-Si approach due to low throughput, non-standard geometry, and high dislocation density resulting in lower cell efficiencies and increased brittleness.
The most technologically advanced ion cut process is the Smart-Cut process [3], which involves hydrogen implantation followed by wafer bonding and annealing. This method allows the transfer of Si layers with required thickness. To obtain thicker layers more adapted to photovoltaic applications, hydrogen implantation at high energies (with few c) has been successfully implemented, providing freestanding Si layers with thicknesses in the range of 9 µm to 100 µm [7,8]. However, it has turned out that Smart-Cut technology is too expensive to be implemented in the mass production of Si wafers.
The alternative low-cost stress-induced spalling approaches that have been developed are: (i) glue-cleave [9], (ii) SLIM-cut (stress-induced lift-off method) [10], (iii) “cold split” [11], and (iv) controlled spalling [12]. These approaches do not require the costly formation of a weak layer (except “cold split”), as they are based on the formation of thermal stress inside the silicon bulk. The main drawback linked to stress-induced spalling methods is the lack of control over the thickness of the exfoliated Si layers.
Nevertheless, NexWafe, a spin-off of ISE Freiburg, has implemented a CVD deposition method to process a thick crystalline epi-Si layer (n-type, 50–180 µm thick) on a reusable template using trichlorosilane as a gaseous precursor at a deposition rate of about 2 µm/min. The fully grown wafer is then detached from the seed wafer, aiming at replacement of traditional CZ wafers, and ~20% efficiency for solar cells processed from such wafers is reached [13]. According to NexWafe, their technology could save up to 60% of Si-loss during sawing, reduce energy consumption during manufacturing by up to 80%, and require 70% less investment cost for its scrap-free wafer production. IMEC has demonstrated conversion efficiency of about 22.5% [14] for n-PERT solar cells based on CVD wafers grown by Crystal Solar.
Although CVD-based epitaxial wafers have excellent material quality, as evidenced by the minority-carrier lifetime measurements and cell efficiencies, usage of poisonous gases and the need for complex and expensive infrastructure and safety-related considerations create some barriers for penetration of this technology at the industrial level.
Therefore, the search for cost-effective alternatives to CVD approaches is an important task for Si-based PV and potentially for Si-based microelectronics technologies.
In particular, recent technological advances based on developments of physical vapor deposition (PVD) processes, such as electron beam (e-beam) deposition, have enabled the possibility to process reasonable quality Si films using laser or solid-phase crystallization processes applied to e-beam deposited Si films [15,16] or by the direct growth of Si layers using e-beam deposition at elevated temperatures (below 650 °C [16]). It should be noted that the processing of Si-based layers through the e-beam evaporation of Si offers several advantages over CVD-based methods due to the elimination of toxic gases, feedstock flexibility, and the possibility for direct growth of p/n junctions using p/n Si feedstock for e-beam evaporation. Moreover, a high deposition rate (up to 30 µm/minute) at elevated temperatures (~800 °C) has been demonstrated [17,18]. Since the deposition temperature was not high enough, high-quality epi-Si growth was not achieved. Epi-Si layers with high quality have been grown using CVD at high temperatures (1000 °C and above). However, the growth of epi-Si layers at such high temperatures and their analysis have not, to the best of our knowledge, been reported for the e-beam deposition-based process so far.
The main goal of this article is to present and compare the initial results of e-beam Si layers deposited at different elevated temperatures, 600 °C, 800 °C, and 1000 °C, all with a high deposition rate (about 1.5 µm/min), realised by the implementation of an advanced dedicated e-beam system.

2. Materials and Methods

2.1. High-Temperature Electron Beam Evaporation

Si layers with different thicknesses were deposited on polished n-doped monocrystalline 6″ Si wafers with (100) orientation and resistivity >3500 Ωcm using an e-beam-based process at different temperatures up to 1000 °C. All Si-layers were deposited using a Polyteknik Flextura 200 cluster system, specifically developed for the high-temperature, high-rate deposition of Si-based materials. The e-beam power supply was 10 kW, and the e-beam crucible size was 500 cm3, with a scanning area of 5 × 5 cm2. The maximum substrate size was 6″. The substrate holder was connected to the ground potential. The feedstock used in the depositions was p-doped Si from an ingot made by Elkem (resistivity of 5.4−5.7 Ω cm (top-cut)) within the framework of the national project “SolarUnited”. The substrates were treated in 2% HF solution for 30 s immediately prior to transfer to the load-lock of the deposition system. The substrate temperatures during the deposition process were chosen: 600, 800, and 1000 °C. The emission current was around 600–700 mA, ensuring a deposition rate of ~1.5 μm/min. To melt as large an area as possible, the source had a constant rotation speed of 0.1 rpm and the e-beam had a 20 mm peak-to-peak off-centred linear scanning pattern. The power was ramped up slowly to ensure melt-stabilization before deposition of the Si layer. During the ramp-up and deposition stages, a reducing background was ensured by continuously flushing the chamber with H2(g) in order to reduce O2 and H2O partial pressures during deposition. The thickness of the epi-Si layers deposited at varying substrate temperatures was ~50 μm.
The base pressure of the chamber was below 1 × 10⁻⁷ mbar and, during the depositions, in the 10−5 mbar range.

2.2. Characterization

The layers deposited at different temperatures were investigated with Raman spectroscopy for their state of crystallinity using a MonoVista CRS+ Raman microscope (S&I Spectroscopy & Imaging GmbH, Warstein, Germany). A laser light with a wavelength of 532 nm was used at 0% attenuation, corresponding to 120 mW. The acquisition time for each spectrum was set to 30 s to maximise the peak to background noise ratio. A Raman detector at 2400 grating resolution was selected for acquisition to increase the resolution of the spectra.
Scanning electron microscopy (SEM) for microstructural studies and electron backscatter diffraction (EBSD) for grain orientation studies were conducted using an FEI NOVA NanoSEM650 instrument equipped with an Oxford Instruments Nordlys EBSD system.
To determine the extended defect density, etching was performed using a 5 min Secco etch (50% HF:0.15 mol/LK2Cr2O7, ratio 2:1).
The electrical parameters of the e-beam deposited layers were measured by means of room-temperature Hall measurements using a Lakeshore 7605 setup, with soldered indium contacts, and by employing a field strength of ±1 T, in the Van der Pauw geometry.

3. Results and Discussion

The silicon layers deposited on polished six-inch Si substrates with a high deposition rate of ~1.5 µm/minute at 600 and 800 °C visually demonstrated areas of different appearance; some areas appeared shiny, whereas others appeared grey and matte. The sample deposited at 800 °C had a higher ratio of shiny areas than the one deposited at 600 °C. On the other hand, the layer deposited at 1000 °C with the same deposition process conditions did not have any grey areas and was fully shiny. As shown in the SEM images in Figure 1, the grey parts had a rough microstructure, while the shiny parts were flat. The SEM images confirmed an overall flat microstructure for the layer deposited at 1000 °C, and no areas with a rough microstructure could be observed for this sample. The areas with the rough microstructure in the layers deposited at 600 and 800 °C probably appeared because of lower surface diffusion energy for Si atoms due to the lower temperature of the substrates during deposition.
A cross section EBSD image of a film deposited at 1000 °C is shown in Figure 2. The EBSD orientation map shows that the deposited layer had the same orientation as the substrate and that the orientation perpendicular to the sample surface was (100), clearly demonstrating the epitaxial nature of the film.
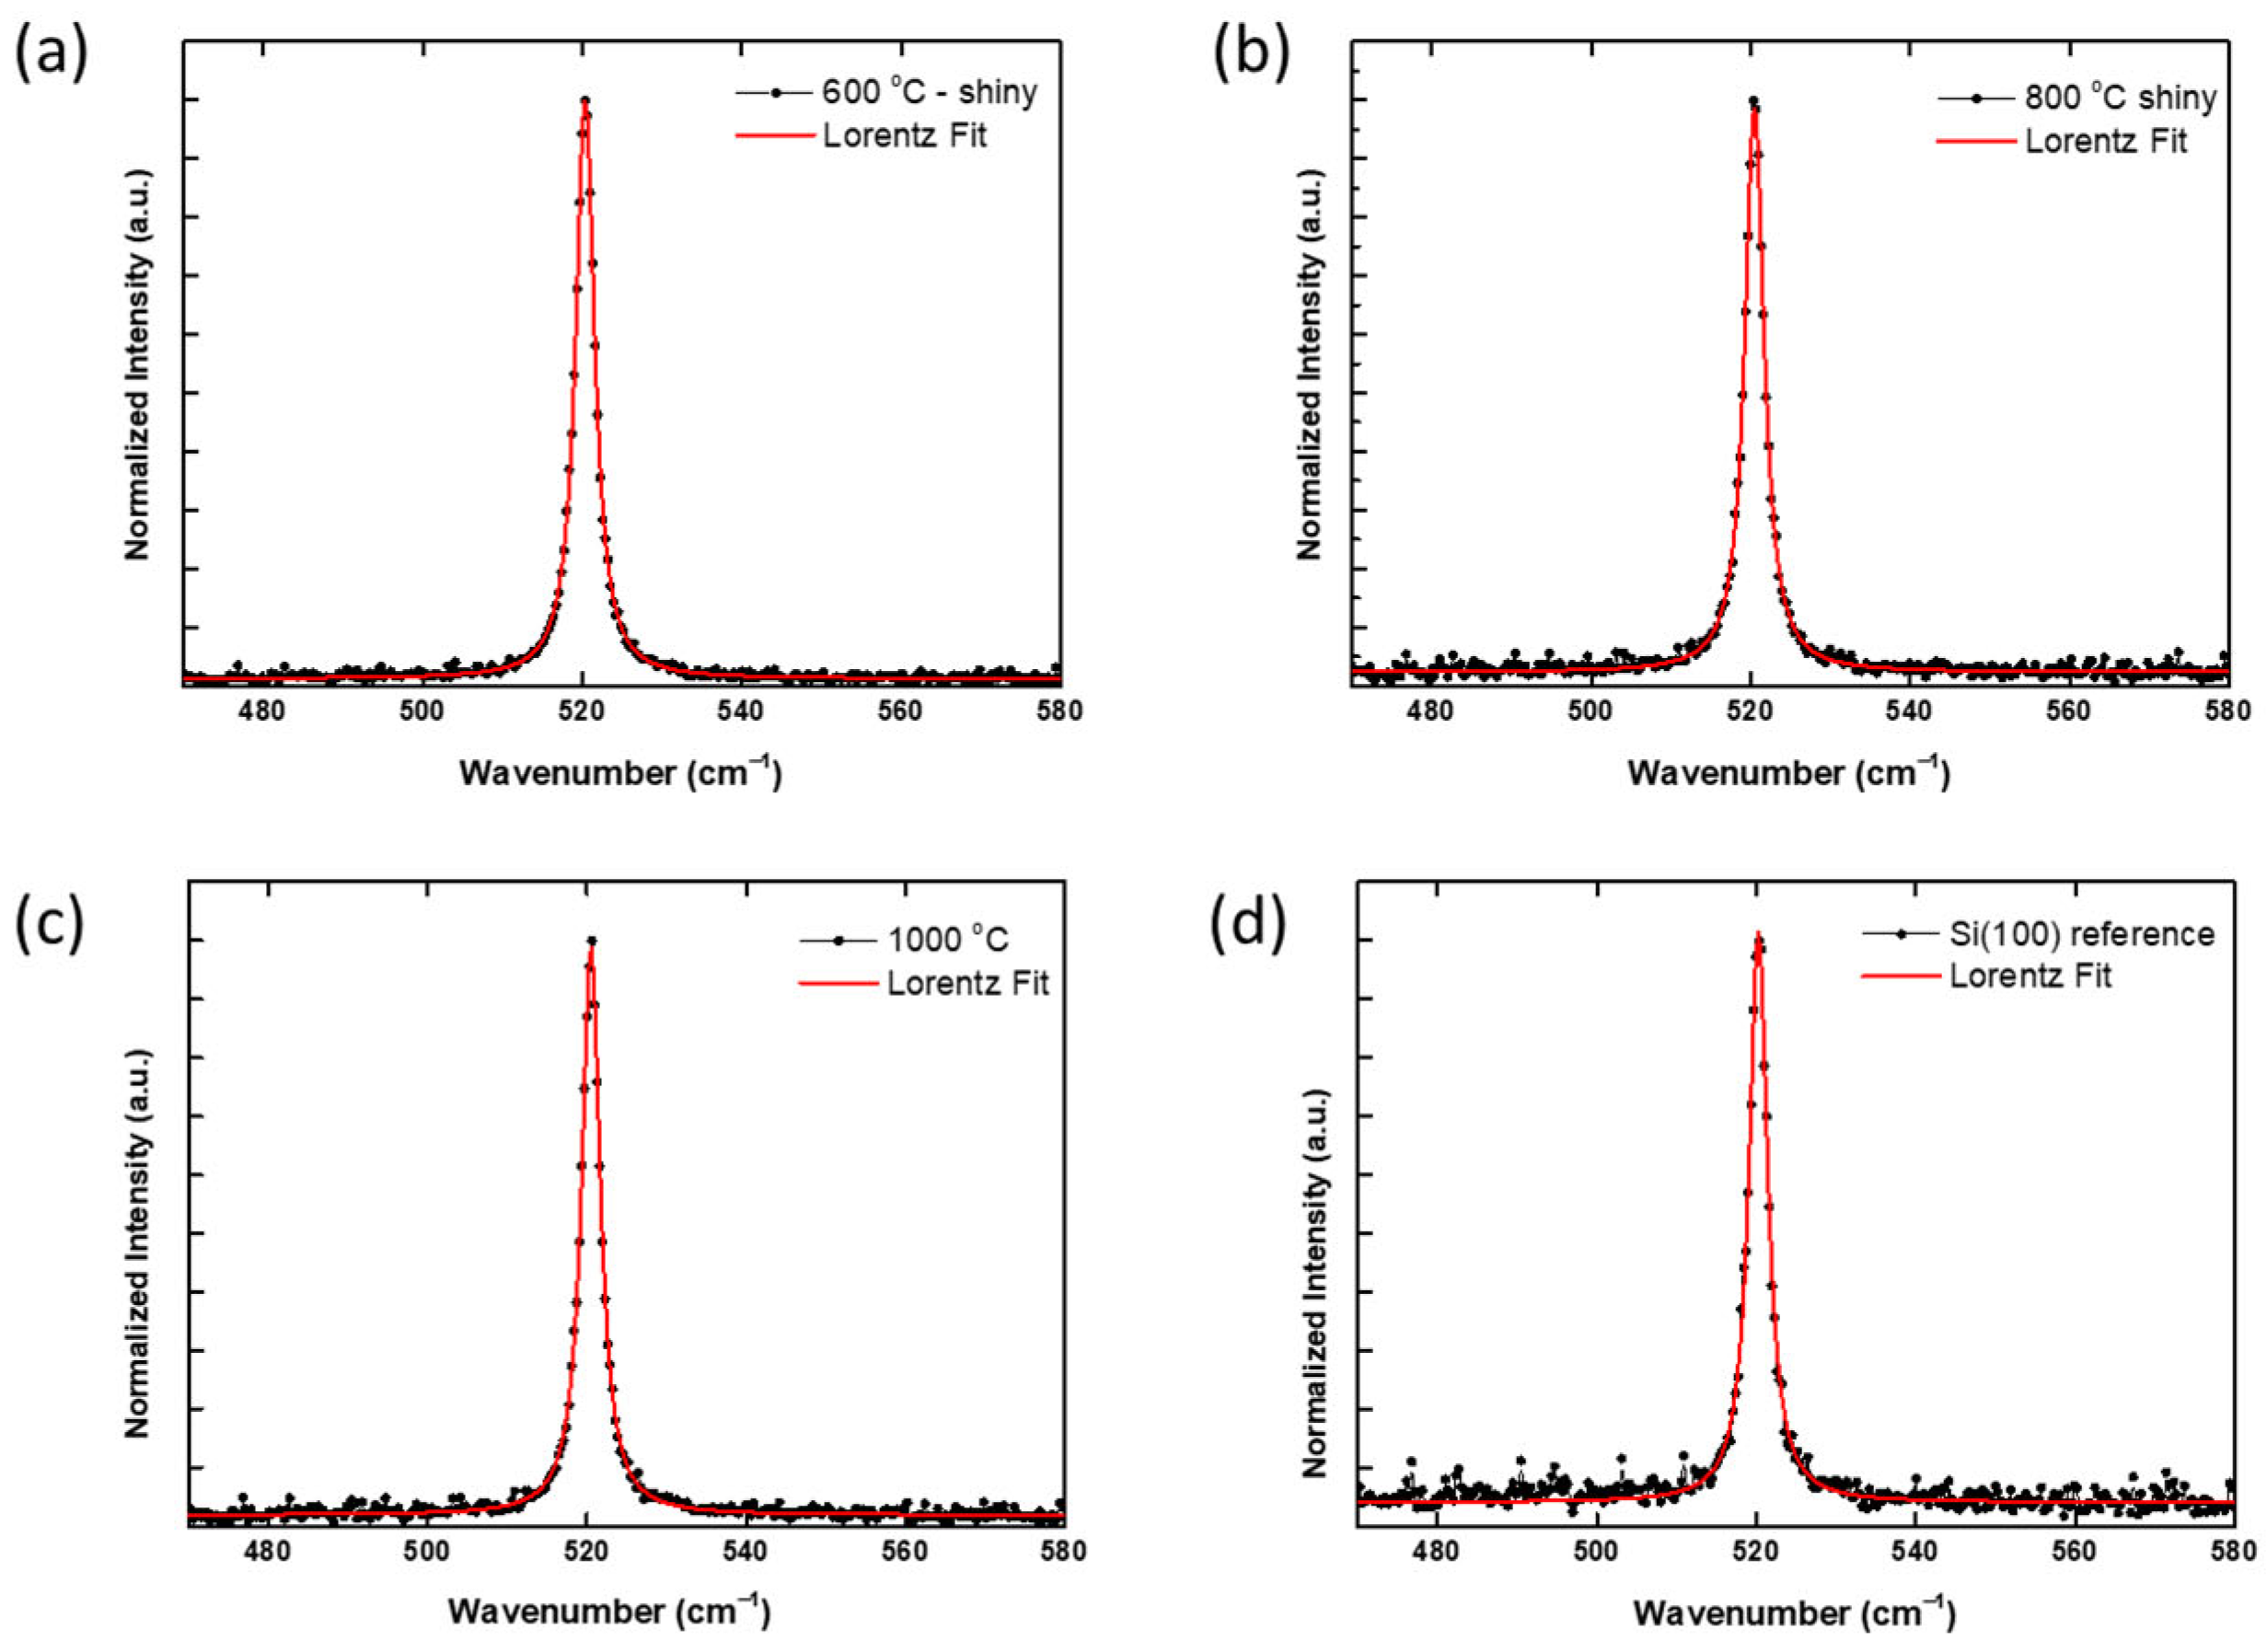
Figure 3 shows the Raman spectra for the shiny areas of the silicon layers deposited at 600, 800, and 1000 °C. Figure 3 shows that at all three selected deposition temperatures, the Raman peak was located at 520 cm−1, which is the representative wavenumber for crystalline and stress-free silicon material. The same peak was present in the reference Si (100) wafer.
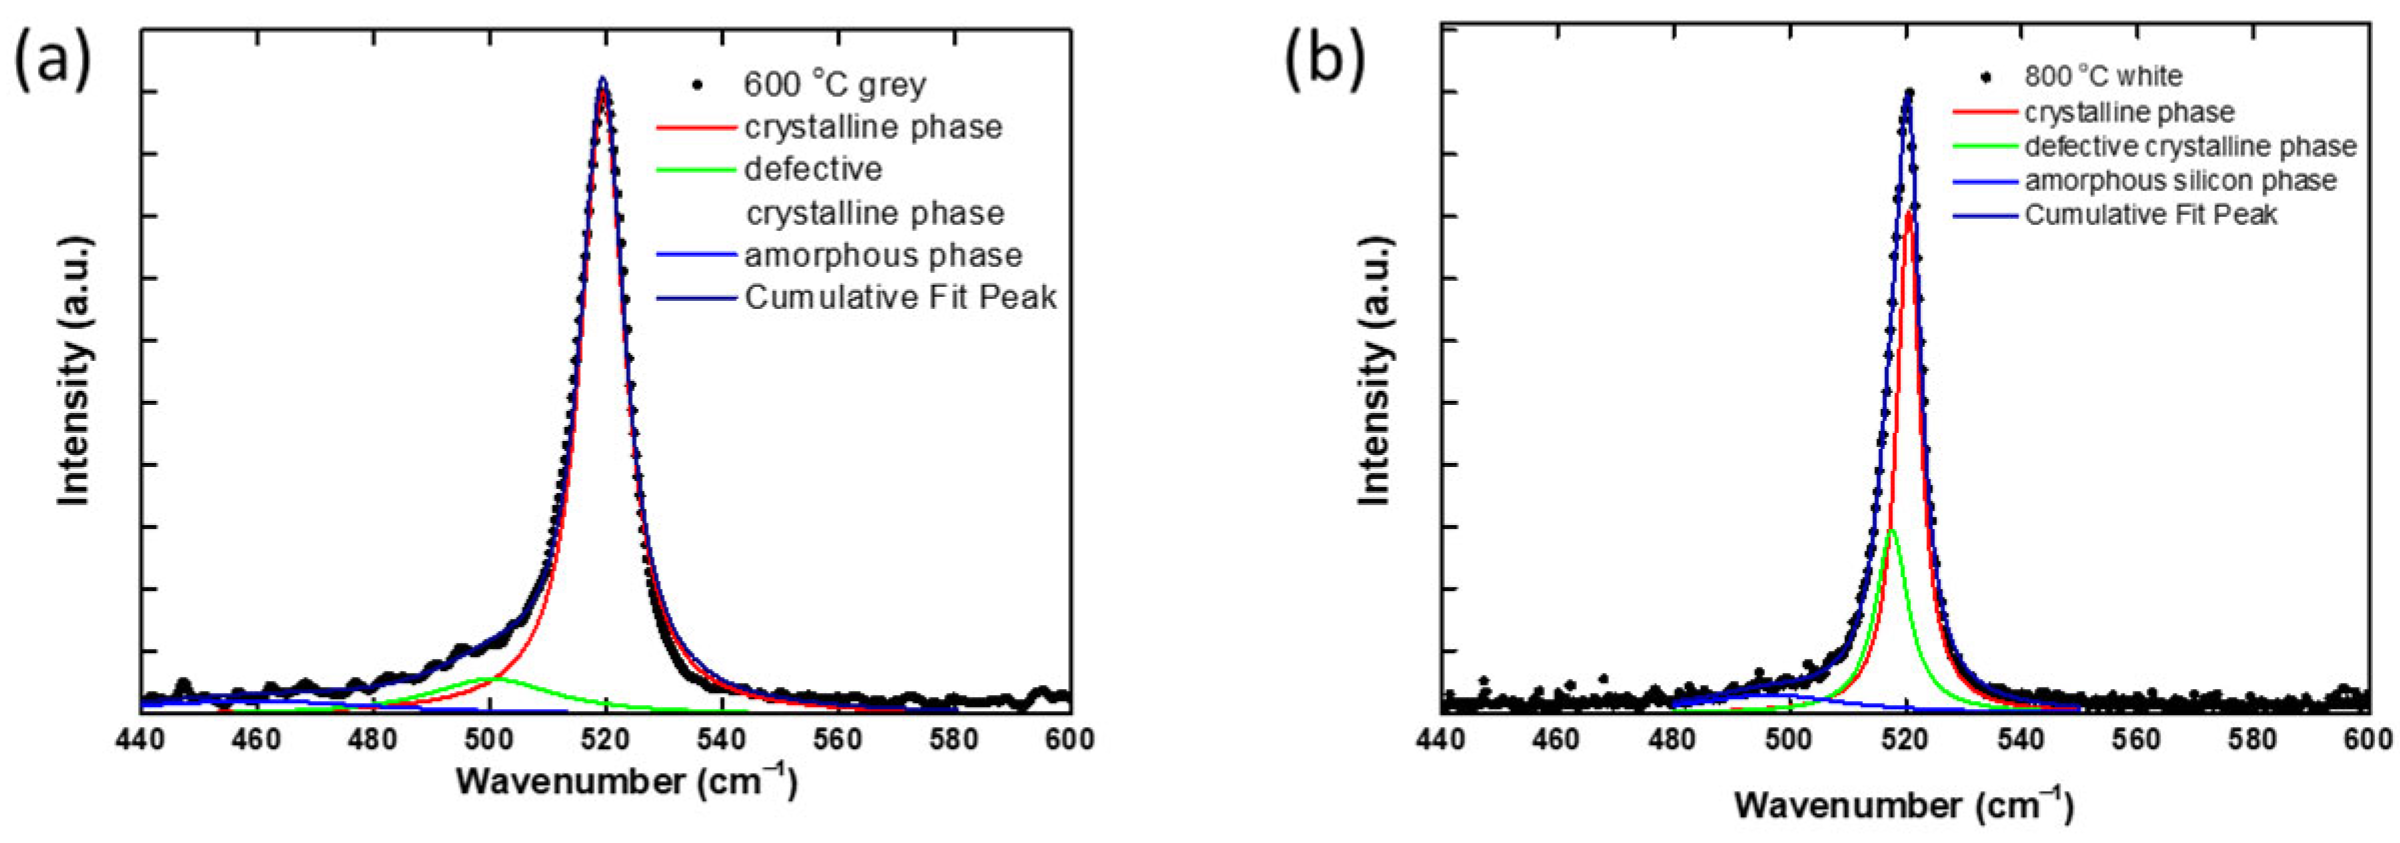
Figure 4 depicts the Raman spectra from the grey parts of the 600 and 800 °C films, showing the crystalline phase (c-Si) around 520 cm−1 and the so-called defective/mixed crystalline phase around 510 cm−1 obtained through deconvolution of the Raman spectra. The Raman peak around 510 cm−1 is also sometimes referred to as a mixed crystallinity peak (mc-Si) [19].
The defective/mixed crystalline phase is usually attributed to microcrystalline Silicon [19,20], which was formed in the grey parts of the 600 °C and 800 °C films as a transition phase between amorphous and crystalline silicon during the crystallization process. More investigations are required to clarify the nature and reason for the formation of such areas with a defective/mixed crystallinity phase. Such studies are outside the scope of this article. However, it can be concluded that a higher deposition temperature fully eliminates the formation of such a defective/mixed crystallinity phase.
The fitting of the Raman spectra for the grey areas was conducted using Lorentzian shapes for the deconvoluted lines. Three peaks around 520, 510, and 480 cm−1, representing the crystalline, defective, or mixed crystalline peak and the amorphous peak, respectively, were chosen for the fittings. It is important to note that the positions of these peaks were not fixed during the fitting procedure, and, as a result of fitting, they could therefore deviate from the initial values. Prior to the fitting process, the raw data underwent normalization and smoothening. Firstly, the data were normalised such that the maximum peak was assigned the value 1. A moving average smoothing approach was then applied to data with a pixel size of 10. The resulting refined positions for the different constituents are given in Table 1. From Table 1, the defective peak appeared at a lower wavenumber for the Si film deposited at 600 °C compared to the one deposited at 800 °C. This could indicate the presence of phases with less crystallinity and therefore the lower quality of the film deposited at 600 °C compared to the film deposited at 800 °C. Defective peaks did not appear for Si layers deposited at 1000 °C, showing that such layers obtained higher quality than those deposited at lower temperatures. Therefore, Si films deposited at 600 °C were not analysed in further detail.
It should be noted that since the surface morphology of the Si films deposited at 600 °C and 800 °C was different (Figure 1), direct comparison of the crystallinity levels for these films could not be performed correctly.
Hall effect measurements were performed on the deposited films in the van der Pauw configuration, and the results are given in Table 2.
The Si wafers, which were used as a feedstock to fill the crucible for the e-beam process, obtained a resistance of 5.5–5.7 Ω·cm, and a boron concentration of ~2.7 × 10¹⁵ B-atoms/cm3. The specific resistance and carrier concentration of the film deposited at 1000 °C were about 5.01 Ω·cm and 4.93 × 10¹⁵ 1/cm3, respectively. Hence, the resistivity of the deposited Si film was a bit lower and the carrier concentration (therefore the concentration of boron) was a bit higher than those of the Si feedstock. This indicates that some additional doping of boron from the Si feedstock occurred, which means a faster transfer of B than Si upon the introduction of the e-beam evaporation process. It should be noted that the co-evaporation of silicon and boron in a vacuum chamber using e-beam showed some peculiarities. First of all, the temperature during the e-beam process could be as high as 3000 °C under the electron beam spot and, secondly, the vacuum pressures of silicon and boron were different, which could lead to different evaporation rates for these elements. Moreover, some segregation processes of boron initiated at the solid/liquid Si interface could occur in the crucible with the boron-doped Si feedstock during melting using e-beam deposition. At this stage of development, it can be only stated that more boron atoms compared to that of silicon were evaporated and transferred to Si films during the e-beam deposition process. This means that the remaining silicon material in the crucible contained less boron after e-beam treatment compared to initial Si feedstock. Similar results were reported in [21], where the purification of upgraded metallurgical silicon by means of the extraction of boron and phosphorus was experimentally demonstrated using concentrated solar radiation in the temperature range of 1550–1700 °C. Further detailed investigations concerning the transferability of dopants (boron in our case) should be performed. The p-type hole mobility was about 253 cm2/(V·s), which indicated that the epi-Si layer, deposited at 1000 °C, was still not as perfect as the Cz-Si wafer, which has been used as a feedstock for e-beam evaporation (the hole mobility is about 408.5 cm2/(V·s). However, the measured numbers were quite close to each other even without significant process optimization, indicating the potential of the e-beam deposition approach.
The film deposited at 800 °C had about five times higher resistance, mainly due to a lower carrier concentration, and a comparable mobility.
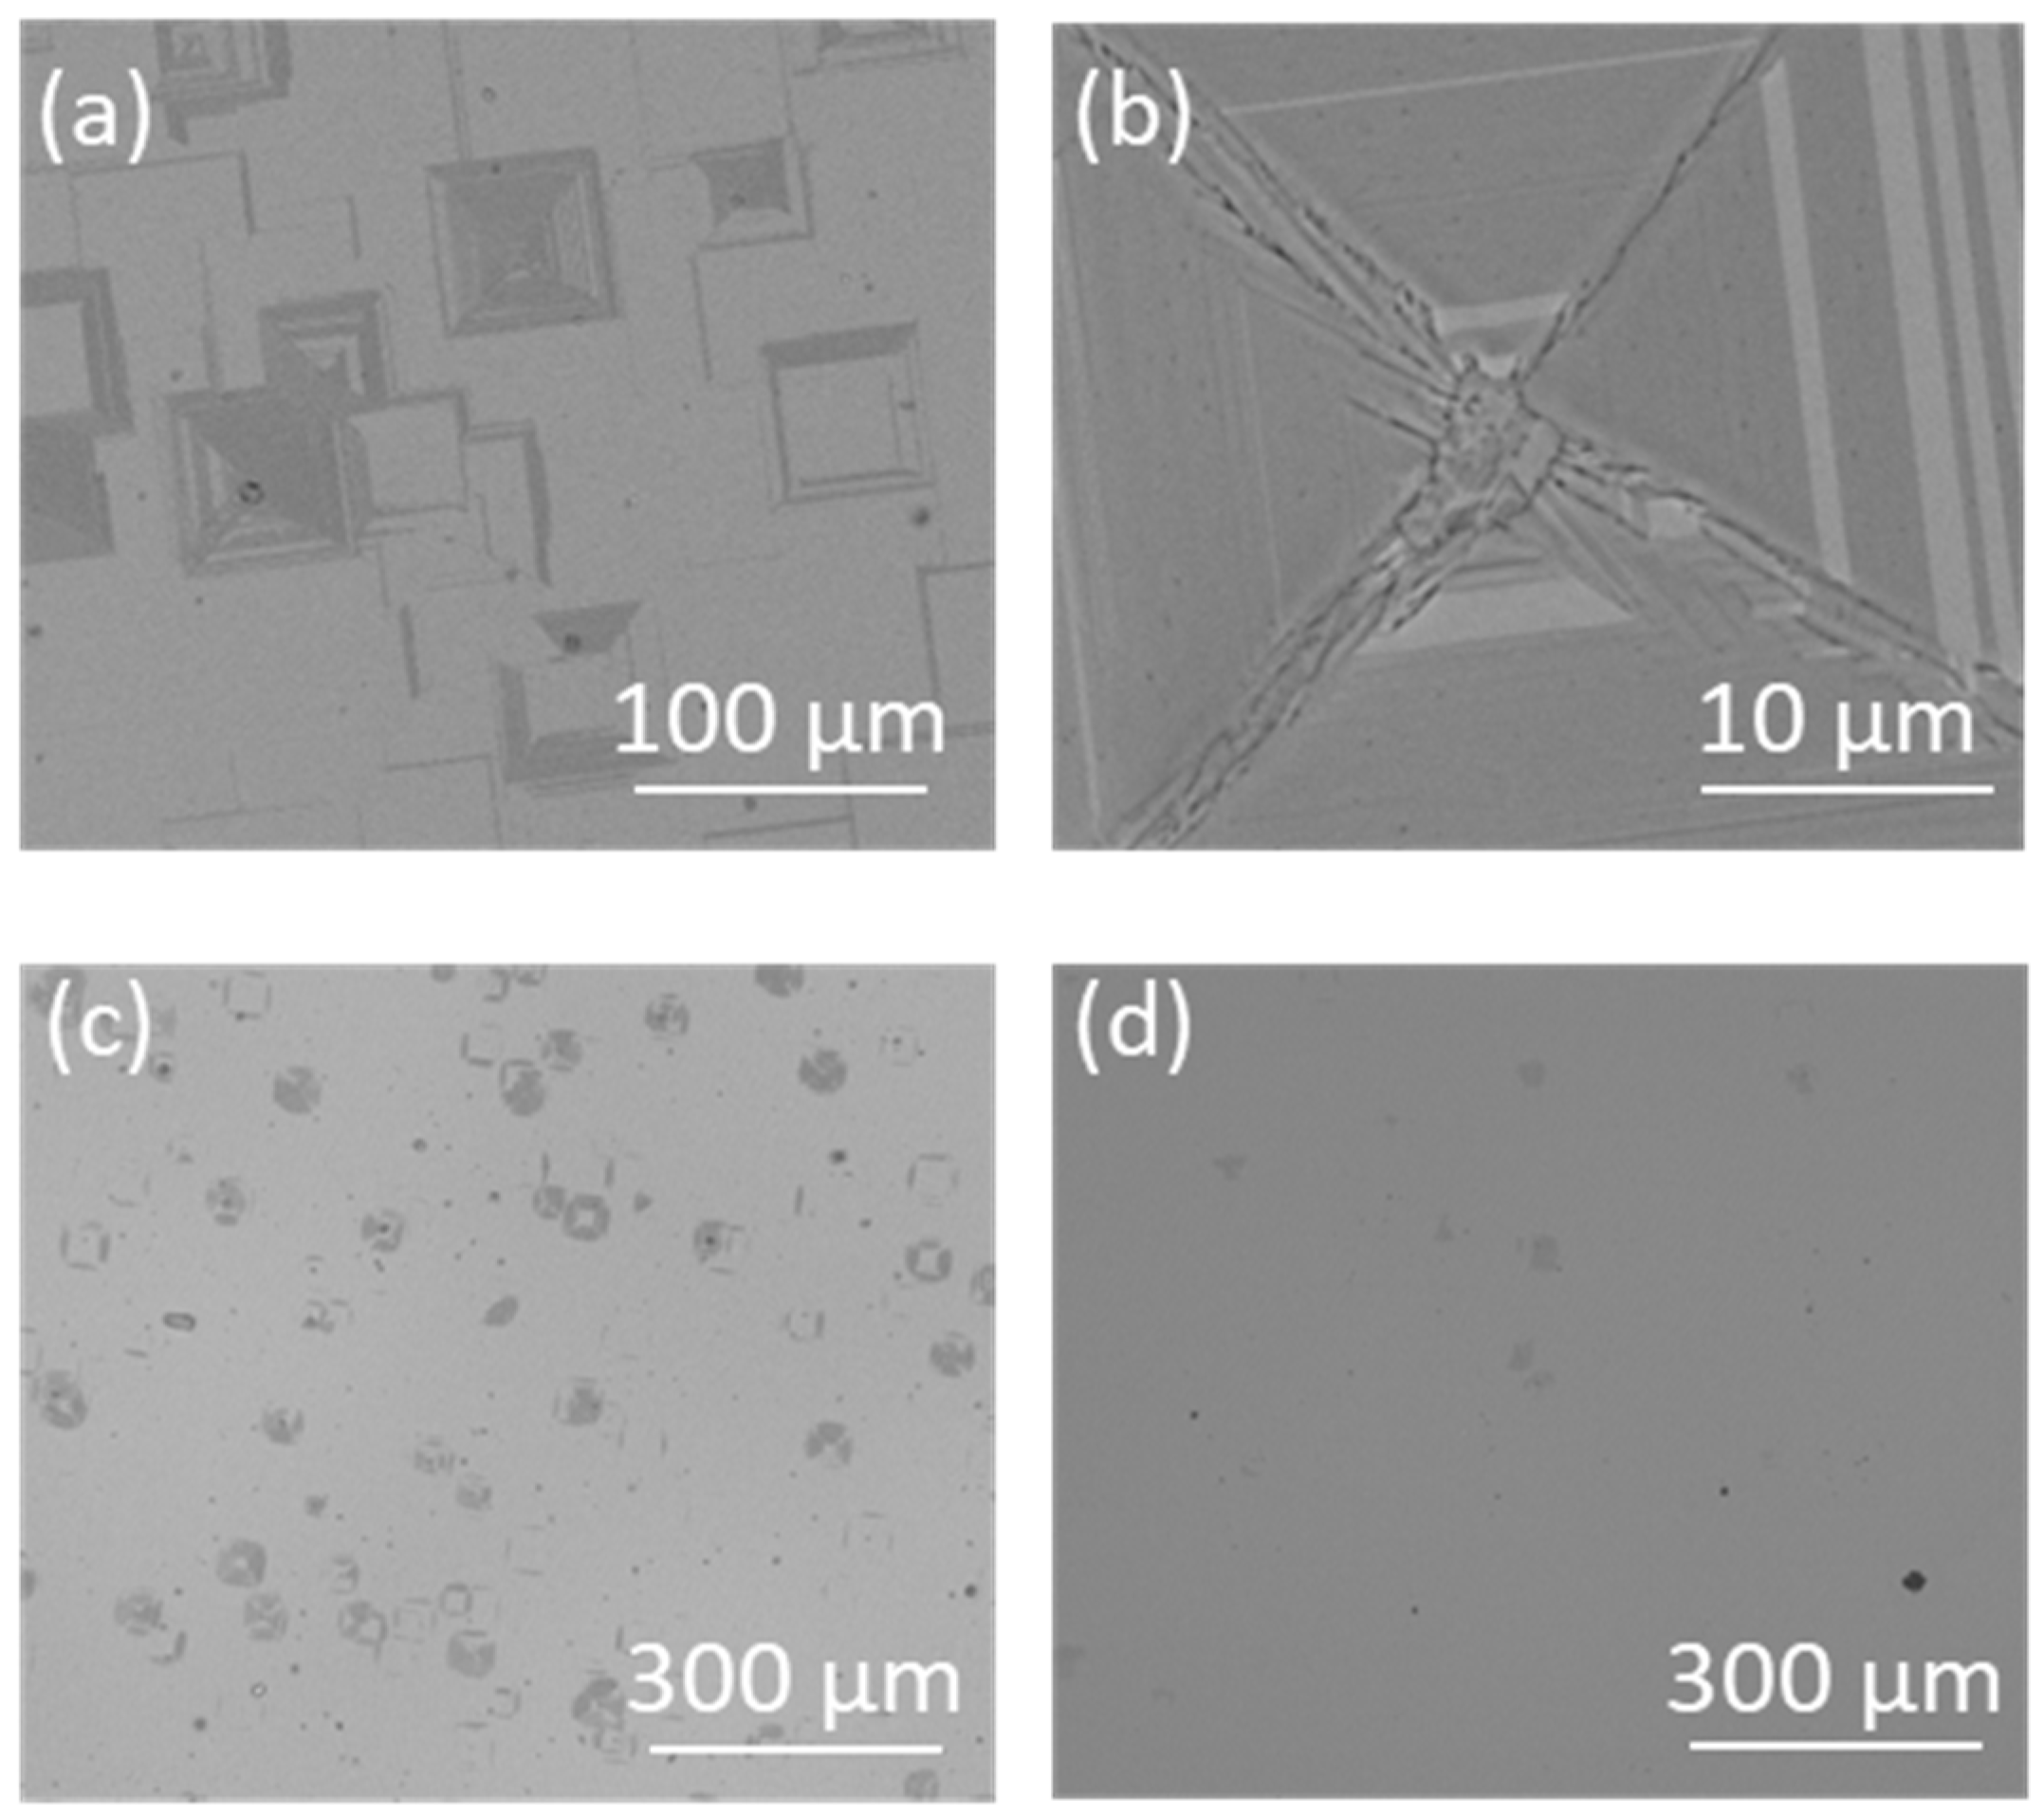
In the flat and crystalline regions of the e-beam deposited layers, some defects, often squares, appeared (Figure 5a,b). Many of these defects appear to have originated around silicon droplets/particles in the deposited layer, as can be seen in the SEM images in Figure 5a,b. The defects in the 1000 °C film were accompanied by the formation of twin structures. The size of the defects/squares varied, which indicated that they originated from different depths in the film. Despite these defects, most of the surface area was flat, homogeneous, and smooth. It should be noted that similar defects have been observed after the CVD growth of Si layers [22]. Investigations to reduce the number of defects through more careful control of the process parameters have shown that regular cleaning of the e-beam chamber is the most efficient means to reduce the number of defects in the films. Figure 5c,d compares the surface structure of two layers deposited at 1000 °C before chamber cleaning 5c and directly after cleaning 5d. Figure 5 shows that such simple measures can significantly reduce the particles and associated defects. Other attempts to reduce the number of defects, such as using a reduced deposition rate at the beginning of the process, did not give a reduced number of defects. Usually, the growth of highly crystalline films requires very slow deposition rates ranging from several to several tens μm/h [23], and if the rate is much higher, it can affect the single-crystal film growth. The high deposition rates can potentially create specific defects [22], but this appeared not to be the only reason for the defect formation.
Another related reason, which caused the appearance of defects upon high deposition rate e-beam evaporation, was the formation of metal spits/droplets from the melt reaching the surface of the substrate during the evaporation process, where they solidified as particles in the deposited film. “Spitting” can usually be resolved by proper rise and soak times during the homogenization of the melt. Additional initiatives aimed at enhancing the process conditions to effectively manage and decrease defect density need to be implemented. One of the options is to raise the deposition temperature above 1000 °C, up to 1100–1200 °C, as carried out in [24] for epi-Si-based layers deposited using CVD-based processes.
Secco etching was performed for 5 min to reveal the extended defects of the films, and Figure 6 shows etch pits on films deposited at 800 and 1000 °C. The dislocation densities were determined to be ∼2 × 107 cm−2 and ∼5 × 106 cm−2 at 800 and 1000 °C, respectively. It is obvious that the structural quality of the films depends significantly on the deposition temperature and that the film deposited at the highest deposition temperature (1000 °C) had the lowest density of defects.
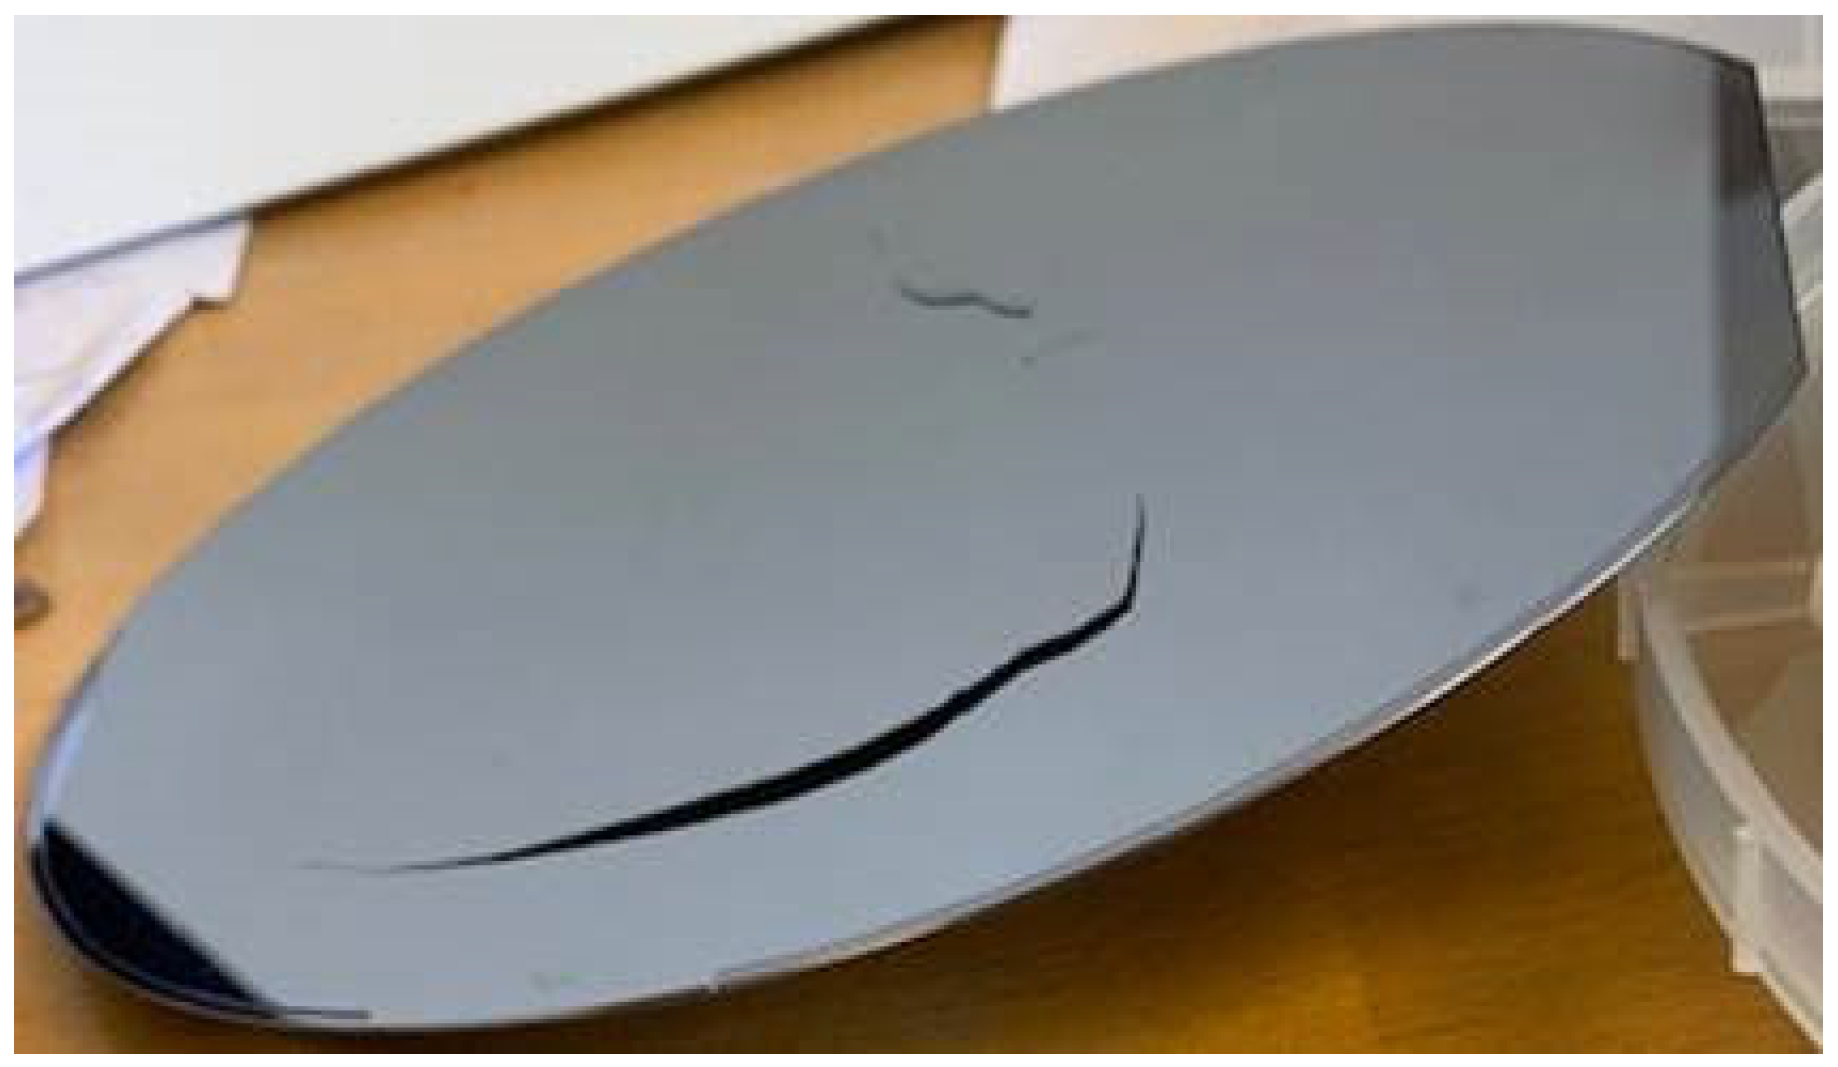
Initial tests were performed to verify the feasibility of the exfoliation of e-beam epi-Si layers from a support substrate. Here, a ~140 µm thick layer was deposited onto a Si “mother” substrate with a porous layer, similar to that reported in [25,26]. An image of the as-deposited epi-Si/porous Si structure is shown in Figure 7. A partial exfoliation of the central part of the epi-Si layer can be seen after fast cooling of the epi-Si/porous Si/Si supporting substrate structure. This result serves as an initial and indicative proof of concept, demonstrating the feasibility of executing a lift-off process for e-beam deposited Si epi-layers deposited on supporting Si substrates with a porous Si weak layer. It should be noted that the “onset” of the exfoliation of the epi-Si layer in our case was observed without the use of the laser cutting of edges, laser notching, or any implementation of any metallic stressor, which were used in [26]. Improvements to the lift-off process for e-beam deposited layers are needed, but these initial findings indicate its feasibility. The observed initiation of exfoliation is akin to the blistering phenomenon [27], previously studied as an indicator of the feasibility to implement the “Smart-cut” process.

4. Conclusions

The growth of p-doped Si films on Si (100) substrates at temperatures of 600, 800, and 1000 °C in a vacuum environment of ~1 × 10⁻⁵ mbar using high-rate e-beam evaporation was performed and analysed. The study successfully demonstrated the growth of p-doped Si films on Si (100) substrates at temperatures ranging from 600 to 1000 °C using high-rate e-beam evaporation. Notably, fully crystalline Si layers with a thickness of approximately 50 µm could be achieved at a deposition rate of ~1.5 µm/min at 1000 °C. This highlights the potential of e-beam evaporation as a promising and cost-effective alternative to conventional CVD for the growth of epi-Si layers and, potentially, epi-Si wafers. It should be noted that the deposition rate of e-beam deposited layers is comparable to that of the atmospheric pressure CVD-based processes and can be as high as above 30 µm/min [17,18]. While the deposition rate of e-beam deposited layers rivals that of atmospheric pressure CVD-based processes, the Secco etch experiments exposed a notable density of extended defects at elevated temperatures. This underscores the necessity for further optimization in the growth of Si layers and epi-wafers using e-beam evaporation. Future studies should explore deposition temperatures up to 1200 °C, comparing the results with CVD-based processes. Additionally, an in-depth analysis of the transferability of dopants (boron, gallium, and phosphorous) during e-beam evaporation is crucial, and in situ doping using effusion cells may be necessary [28]. Furthermore, the e-beam evaporation process should be examined for its potential to effectively remove boron from the Si feedstock, and manufacturing processes like lift-off should be explored for producing epi-Si-based wafers.
The Polyteknik Flextura 200 system was financed by the Norwegian laboratory for Si solar cell technology (supported by the Research Council of Norway, Project No. 245744). This work was performed at the Norwegian Research Center for Sustainable Solar Cell Technology (FME SUSOLTECH, Project No. 257639/E20). The centre is co-sponsored by the Research Council of Norway and its research and industry partners.

Author Contributions

Conceptualization, A.G.U., R.D.-H. and M.S.; methodology: A.G.U., R.D.-H., M.S. and T.O.S.; formal analysis: A.G.U., R.D.-H., M.S., T.O.S., J.S.G., K.R. and B.D.B.; writing—original draft preparation, M.S., A.G.U., T.O.S. and R.D.-H.; writing—review and editing, M.S.; project administration, M.S.; funding acquisition, R.D.-H. and T.O.S. All authors have read and agreed to the published version of the manuscript.

Funding

This research was funded by the Research Council of Norway, Grant No. 257639/E20 and 245744.

Institutional Review Board Statement

Not applicable.

Informed Consent Statement

Not applicable.

Data Availability Statement

Data are contained within the article.

Acknowledgments

The authors acknowledge B. Karlsen (SINTEF, Norway) for performing the Secco etch, H.N. Riise (University of Oslo, Norway) for the Hall measurements and Sarah Kajari-Schröder (ISFH, Germany) for providing the Si supporting substrate with a porous layer.

Conflicts of Interest

The authors declare no conflict of interest.

References

  1. Syvertsen, M.; Halvorsen, T.; Mørk, K.; Nordmark, A.; Kaden, T.; Ulyashin, A. Remelting and Purification of Si-Kerf for PV Wafers. In Proceedings of the 33rd European Photovoltaic Solar Energy Conference and Exhibition, Amsterdam, The Netherlands, 25–29 September 2017; pp. 1882–1885. [Google Scholar] [CrossRef]
  2. Van Mierlo, F.; Jonczyk, R.; Qian, V. Next Generation Direct Wafer® Technology Delivers Low Cost, High Performance to Silicon Wafer Industry. Energy Procedia 2017, 130, 2–6. [Google Scholar] [CrossRef]
  3. Bruel, M.; Aspar, B.; Auberton-Hervé, A.-J. Smart-Cut: A New Silicon on Insulator Material Technology Based on Hydrogen Implantation and Wafer Bonding. Jpn. J. Appl. Phys. Part 1 Regul. Pap. Short Notes Rev. Pap. 1997, 36, 1636–1641. [Google Scholar] [CrossRef]
  4. Tanielian, M.; Blackstone, S.; Lajos, R. A New Technique of Forming Thin Free Standing Single-Crystal Films. J. Electrochem. Soc. 1985, 132, 507. [Google Scholar] [CrossRef]
  5. Solanki, C.S.; Carnel, L.; Van Nieuwenhuysen, K.; Ulyashin, A.; Posthuma, N.; Beaucarne, G.; Poortmans, J. Thin-Film Free-Standing Monocrystalline Si Solar Cells with Heterojunction Emitter. Prog. Photovolt. Res. Appl. 2005, 13, 201–208. [Google Scholar] [CrossRef]
  6. LaBelle, H.E., Jr.; Mlavsky, A.I. Growth of Controlled Profile Crystals from the Melt: Part I—Sapphire Filaments. Mater. Res. Bull. 1971, 6, 571–579. [Google Scholar] [CrossRef]
  7. Assaf, H.; Ntsoenzok, E. Transfer of Thin Silicon Layers by MeV Hydrogen Implantation. Nucl. Instrum. Methods Phys. Res. Sect. B 2005, 240, 183–187. [Google Scholar] [CrossRef]
  8. Kuisseu, P.S.P.; Pingault, T.; Ntsoenzok, E.; Regula, G.; Mazen, F.; Sauldubois, A.; Andreazza, C. Silicon Exfoliation by Hydrogen Implantation: Actual Nature of Precursor Defects. Nucl. Instrum. Methods Phys. Res. Sect. B Beam Interact. Mater. At. 2017, 401, 38–44. [Google Scholar] [CrossRef]
  9. Schoenfelder, S.; Breitenstein, O.; Rissland, S.; De Donno, R.; Bagdahn, J. Kerfless Wafering for Silicon Wafers by Using a Reusable Metal Layer. Energy Procedia 2013, 38, 942–949. [Google Scholar] [CrossRef]
  10. Dross, F.; Robbelein, J.; Vandevelde, B.; Van Kerschaver, E.; Gordon, I.; Beaucarne, G.; Poortmans, J. Stress-Induced Large-Area Lift-off of Crystalline Si Films. Appl. Phys. A Mater. Sci. Process. 2007, 89, 149–152. [Google Scholar] [CrossRef]
  11. Swoboda, M.; Beyer, C.; Rieske, R.; Drescher, W.; Richter, J. Laser Assisted SiC Wafering Using COLD SPLIT. Mater. Sci. Forum 2017, 897, 403–406. [Google Scholar] [CrossRef]
  12. Bedell, S.W.; Fogel, K.; Lauro, P.; Shahrjerdi, D.; Ott, J.A.; Sadana, D. Layer Transfer by Controlled Spalling. J. Phys. D Appl. asPhys. 2013, 46, 152002. [Google Scholar] [CrossRef]
  13. Milenkovic, N.; Driessen, M.; Steinhauser, B.; Benick, J.; Lindekugel, S.; Hermle, M.; Janz, S.; Reber, S. 20% Efficient Solar Cells Fabricated from Epitaxially Grown and Freestanding N-Type Wafers. Sol. Energy Mater. Sol. Cells 2017, 159, 570–575. [Google Scholar] [CrossRef]
  14. Press Release IMEC. Imec and Crystal Solar Demonstrate 22.5 Percent nPERT Si Solar Cells on Kerfless Epitaxial Wafers. 2016. Available online: https://www.Imec-Int.Com/En/Articles/Imec-and-Crystal-Solar-Demonstrate-22-5-Percent-Npert-Si-Solar-Cells-on-Kerfless-Epitaxial-Wafers (accessed on 20 September 2023).
  15. Becker, C.; Sontheimer, T.; Steffens, S.; Scherf, S.; Rech, B. Polycrystalline Silicon Thin Films by High-Rate Electronbeam Evaporation for Photovoltaic Applications—Influence of Substrate Texture and Temperature. Energy Procedia 2011, 10, 61–65. [Google Scholar] [CrossRef]
  16. Gorka, B.; Dogan, P.; Sieber, I.; Fenske, F.; Gall, S. Low-Temperature Epitaxy of Silicon by Electron Beam Evaporation. Thin Solid Film. 2007, 515, 7643–7646. [Google Scholar] [CrossRef]
  17. Saager, S.; Scheffel, B.; Heinß, J.-P. High-rate deposition of high-pure silicon thin films for PV Absorber layers by crucible-free electron beam physical vapor deposition. Surf. Coat. Technol. 2019, 378, 125019. [Google Scholar] [CrossRef]
  18. Heinß, J.P.; Pfefferling, B.; Saager, S.; Temmler, D. High Purity Deposition of Silicon Layers with Rates ≥ 300 nm/s. In Proceedings of the 31st European Photovoltaic Solar Energy Conference and Exhibition, Hamburg, Germany, 14–18 September 2015. [Google Scholar] [CrossRef]
  19. Ellert, C.; Wachtendorf, C.; Hedler, A.; Klindworth, M.; Martinek, M. Influence of Raman Crystallinity on the Performance of Micromorph Thin Film Silicon Solar Cells. Sol. Energy Mater. Sol. Cells 2012, 96, 71–76. [Google Scholar] [CrossRef]
  20. Ledinský, M.; Vetushka, A.; Stuchlík, J.; Mates, T.; Fejfar, A.; Kožka, J.; Ŝtêpánek, J. Crystallinity of the mixed phase silicon thin films by Raman spectroscopy. J. Non-Cryst. Solids 2008, 354, 2253–2257. [Google Scholar] [CrossRef]
  21. Flamant, G.; Kurtcuoglu, V.; Murray, J.; Steinfeld, A. Purification of Metallurgical Grade Silicon by a Solar Process. Sol. Energy Mater. Sol. Cells 2006, 90, 2099–2106. [Google Scholar] [CrossRef]
  22. Kivambe, M.M.; Powell, D.M.; Castellanos, S.; Jensen, M.A.; Morishige, A.E.; Lai, B.; Hao, R.; Ravi, T.S.; Buonassisi, T. Characterization of High-Quality Kerfless Epitaxial Silicon for Solar Cells: Defect Sources and Impact on Minority-Carrier Lifetime. J. Cryst. Growth 2018, 483, 57–64. [Google Scholar] [CrossRef]
  23. Sturm, J.C.; Chung, K.H. Chemical Vapor Deposition Epitaxy of Silicon-Based Materials Using Neopentasilane. ECS Trans. 2009, 16, 799–805. [Google Scholar] [CrossRef]
  24. Rosenits, P.; Kopp, F.; Reber, S. Epitaxially Grown Crystalline Silicon Thin-Film Solar Cells Reaching 16.5% Efficiency with Basic Cell Process. Thin Solid Film. 2011, 519, 3288–3290. [Google Scholar] [CrossRef]
  25. Gemmel, C.; Hensen, J.; Kajari-Schröder, S.; Brendel, R. Lifetime Analysis for Defect Characterization in Kerfless Epitaxial Silicon from the Porous Silicon Process. Energy Procedia 2016, 92, 29–36. [Google Scholar] [CrossRef]
  26. Niepelt, R.; Hensena, J.; Knorr, A.; Steckenreiter, V.; Kajari-Schoder, S.; Brendel, R. High-Quality Exfoliated Crystalline Silicon Foils for Solar Cell Applications. Energy Procedia 2014, 55, 570–577. [Google Scholar] [CrossRef]
  27. Huang, L.-J.; Tong, Q.-Y.; Chao, Y.-L.; Lee, T.-H.; Martini, T.; Gösele, U. Onset of Blistering in Hydrogen-Implanted Silicon. Appl. Phys. Lett. 1999, 74, 982–984. [Google Scholar] [CrossRef]
  28. Sedani, S.H.; Yasar, O.F.; Karaman, M.; Turan, R. Effects of Boron Doping on Solid Phase Crystallization of in Situ Doped Amorphous Silicon Thin Films Prepared by Electron Beam Evaporation. Thin Solid Film. 2020, 694, 137639. [Google Scholar] [CrossRef]
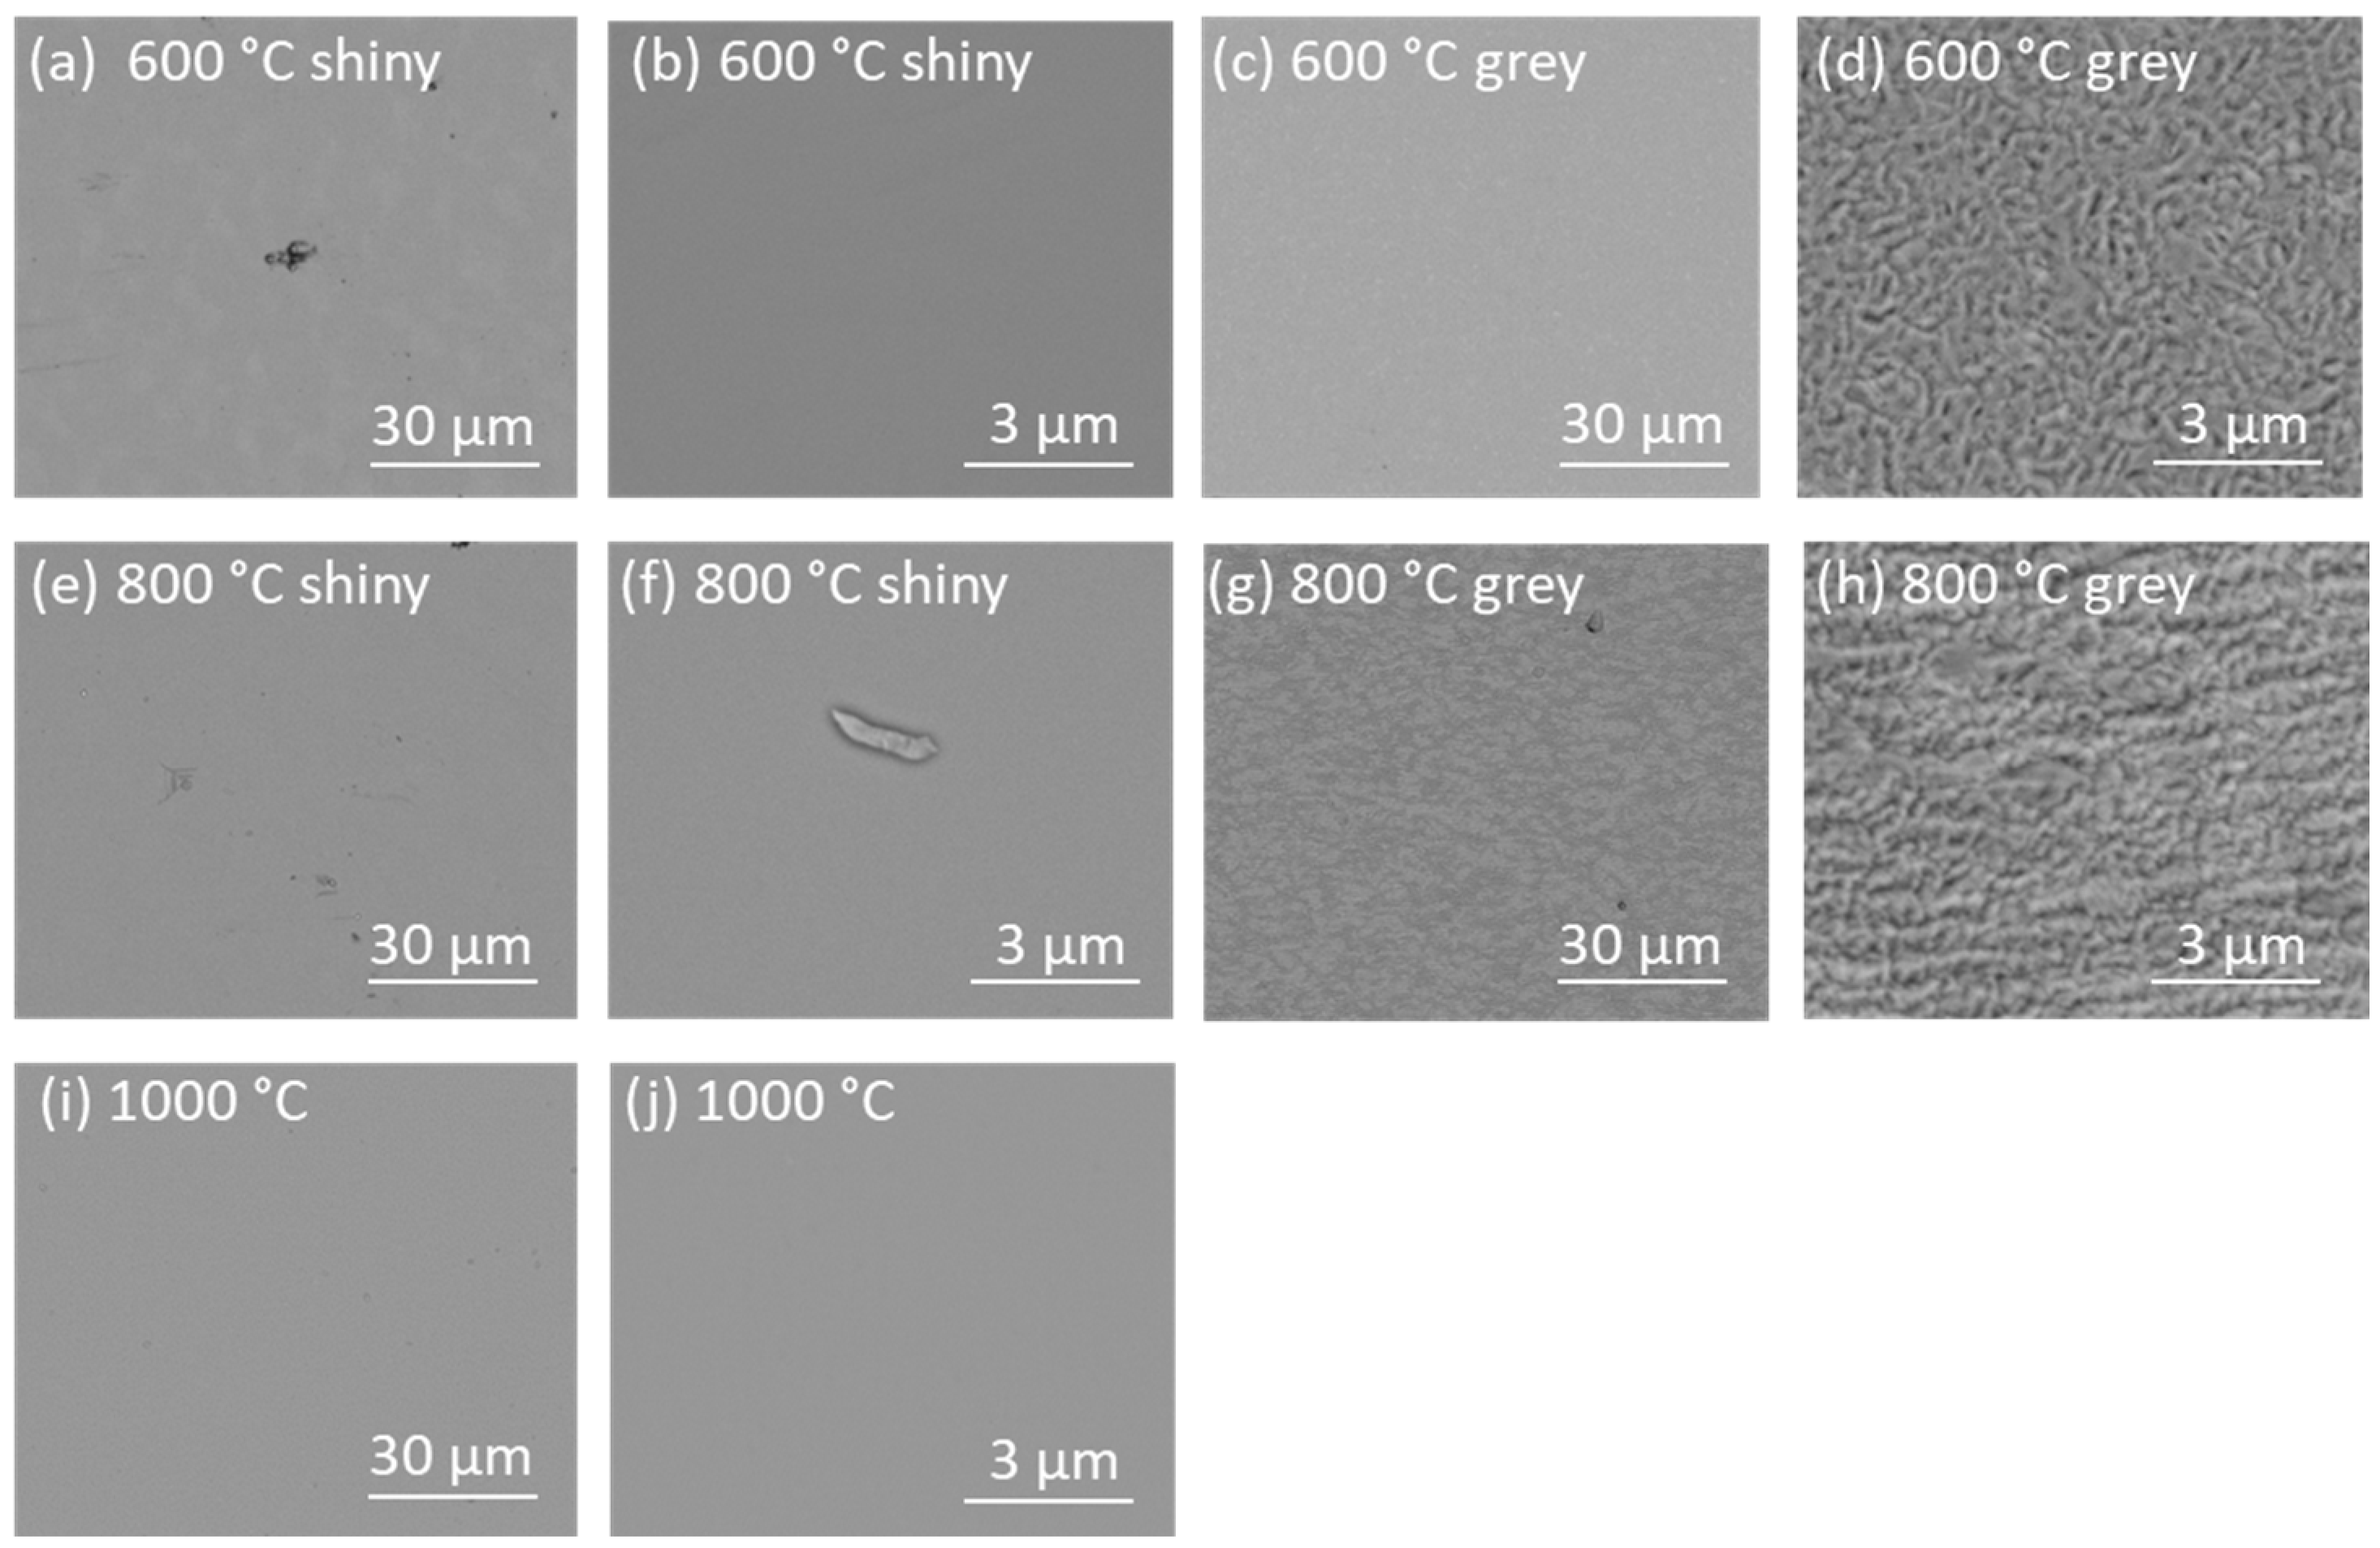
Figure 1. SEM images of the surface of the deposited films at: 600 °C (a,b) shiny part and (c,d) grey part; 800 °C (e,f) shiny part and (g,h) grey part; and 1000 °C (i,j).
Coatings 13 02030 g001
Figure 2. Cross section of a layer deposited at 1000 °C (in the left part of the image) on top of the substrate (to the right). (a) SEM image where the interphase between the deposited film and the substrate is marked with a dotted line, and (b) SEM image with the IPF-x (inverse pole figure) colour from the EBSD overlayed. The x-direction of the inverse pole figure is left/right in the image (the view from the surface of the film).
Coatings 13 02030 g002
Figure 3. Raman shift at 520 cm−1 showing a crystalline and stress-free silicon material: (a) shiny area of film deposited at 600 °C, (b) shiny area of film deposited at 800 °C, (c) film deposited at 1000 °C, and (d) Si100 wafer reference. Lorentzian fitting was applied to all Raman spectra.
Coatings 13 02030 g003
Figure 4. Grey areas of Si films deposited at (a) 600 °C and (b) 800 °C, including Lorentzian shapes for deconvoluted lines.
Coatings 13 02030 g004
Figure 5. SEM images of the surface of films deposited at 1000 °C: (a,b) images of defects measured with different magnifications; (c,d) comparison of Si film quality before chamber cleaning (c) and directly after chamber cleaning (d).
Coatings 13 02030 g005
Figure 6. SEM images of Secco-etched surfaces of the Si films at (a) 800 °C and (b) 1000 °C.
Coatings 13 02030 g006
Figure 7. Onset of exfoliation of the epi-Si layer deposited on the porous Si supporting substrate using e-beam evaporation at 1000 °C.
Coatings 13 02030 g007
Table 1. Wavenumber for the crystalline, defective, or mixed crystalline peaks and the amorphous peak for the films deposited at 600, 800, and 1000 °C. The Si (100) reference wafer was included for comparison.
SampleSi Crystalline
[cm−1]
Si Defective
[cm−1]
Si Amorphous
[cm−1]
Si (100) ref520.24--
Si 1000 °C520.49--
Si 800 °C shiny520.48--
Si 600 °C shiny520.36--
Si 800 °C grey520.52517.62496.69
Si 600 °C grey519.42500.35459.33
Table 2. Resistivity, carrier density, and mobility from the Hall effect measurements.
SampleResistivity
[Ω·cm]
Carrier Density
[1/cm3]
Mobility
[cm2/(V·s)]
800 °C28.49.17 × 1014240
1000 °C5.014.93 × 1015253
Reference values
for Si feedstock
5.5–5.72.7 × 1015 *408.5
* For the feedstock, the value is the measured boron concentration, not the charge carrier concentration.
Disclaimer/Publisher’s Note: The statements, opinions and data contained in all publications are solely those of the individual author(s) and contributor(s) and not of MDPI and/or the editor(s). MDPI and/or the editor(s) disclaim responsibility for any injury to people or property resulting from any ideas, methods, instructions or products referred to in the content.