Article

Numerical Simulation of Graphene Growth by Chemical Vapor Deposition Based on Tesla Valve Structure

1
Faculty of Metallurgy and Energy Engineering, Kunming University of Science and Technology, Kunming 650093, China
2
School of Materials and Architectural Engineering, Guizhou Normal University, Guiyang 550014, China
3
Kunming Metallurgical Research Institute, Kunming 650093, China
*
Authors to whom correspondence should be addressed.
These authors contributed equally to this work.
Coatings 2023, 13(3), 564; https://doi.org/10.3390/coatings13030564
Submission received: 25 January 2023 / Revised: 20 February 2023 / Accepted: 21 February 2023 / Published: 6 March 2023
(This article belongs to the Special Issue Chemical Vapor Deposition (CVD) of Coatings and Films)

Abstract

:
Chemical vapor deposition (CVD) has become an important method for growing graphene on copper substrates in order to obtain graphene samples of high quality and density. This paper mainly focuses on the fluid flow and transmission phenomenon in the reactor under different process operating conditions and reactor structures. Two macroscopic physical parameters that are established as important for CVD growth are temperature and pressure. Based on the special structure of a miniature T45-R Tesla valve acting as a CVD reactor structure, this study uses numerical simulation to determine the effect of the pressure field inside a Tesla valve on graphene synthesis and temperature variation on the graphene surface deposition rate. This macroscopic numerical modeling was compared to the existing straight tube model and found to improve the graphene surface deposition rate by two orders of magnitude when the 1290–1310 K reaction temperature range inside the Tesla valve was maintained and verified through the experiment. This study provides a reference basis for optimizing the reactor geometry design and the effects of changing the operating parameters on carbon deposition rates during a CVD reaction, and will furthermore benefit future research on the preparation of high-quality, large-area, and high-density graphene by CVD.

1. Introduction

Chemical vapor deposition (CVD) is a potential method used to produce large-area and uniform graphene. However, as noted in the previous section, in the chemical vapor deposition system, the carbon source, substrate, catalyst, and deposition conditions (temperature, pressure, time, etc.) are all parameters affecting the deposition effect [1]. Of these, fluid dynamics is one of the main factors, and computational fluid dynamics (CFD) is thus adopted. The growth temperature, pressure, and the surface deposition rate can be simulated, and the optimal reaction conditions can be optimized or improved according to the simulation results.
CFD simulations are mainly divided into the following two categories: (1) CVD reactor simulation studies, mainly focusing on the fluid flow and transmission phenomena in the reactor under different process operating conditions and reactor structures and neglecting the chemical reactions in the CVD process; and (2) CVD chemical simulation studies, the objective of which is to elucidate the reaction mechanism in the gas phase and surface reactions.
It is found that the Tesla valve can realize the single guiding characteristic of the fluid without any moving parts in the whole, and only use the space structure to promote the gas flow, without the input of energy. It has potential application value especially in the microfluid control system and the development of valves with no moving parts. Truong et al. used numerical methods to study the two-dimensional constant flow models of different Tesla valves [2]. They derived formulas for the optimal valve geometric parameters and determined the complete design valve optimization parameters. Zhang et al. proposed a three-dimensional (3D) model of the Tesla valve with Reynolds numbers of up to 2000 [3]. In addition, they numerically investigated the effect of the valve aspect ratio on its performance based on the relationship between diodicity (Di) and flow rate. Thompson et al. used high-performance computing and 3D computational fluid dynamics to simulate the effectiveness of a multistage Tesla valve under laminar flow conditions [4]. They established a correlation for predicting the Di of multi-stage Tesla valves and demonstrated that the secondary flow at the outlet of the Tesla valve intensified with increasing Reynolds numbers. Moreover, pressure and velocity clouds were plotted for various multistage Tesla valves, providing a more comprehensive record of the complex physicochemical properties inside the flow field.
Gan et al. used computational fluid dynamics to conduct a systematic study of the gas phase process of graphene growth [5]. The simulations indicated that the surface deposition process of graphene was limited by the methane transport component at atmospheric pressure and surface chemistry at low pressure.
Qian et al. conducted numerical simulations of Al2O3–water nanofluid flow through a miniature T45-R Tesla valve [6]. They analyzed the effects of nanofluid flow rate, temperature, and nanoparticle volume fraction on the fluid separation and pressure drop characteristics of the bifurcated section. Fauzi et al. used fluid dynamics to simulate chemical vapor deposition (CVD) for graphene growth in an atmospheric pressure environment flowing in a high Reynolds number state [7]. The residence and diffusion time of the active material were reduced, which was beneficial to graphene deposition.
Although a few studies have investigated the simulation of special CVD reactor structures for nanofluid flow through micro-Tesla valves, there is a lack of research on the growth of graphene and nanofluid flow through micro-scale valves by changing the CVD reactor structure. The numerical simulation and experimental study of graphene growth based on the special structure of Tesla valve have not been reported. It is of great practical significance to study the flow characteristics of graphene nanofluids.
Therefore, based on my previous research, this study investigates the effect of temperature change on the pressure field, Di, and deposition rate of graphene surface for graphene synthesis by growing graphene in a microscale T45-R type Tesla valve structure using the CVD method under both atmospheric (101,325 Pa) and low (660 Pa) pressures [8,9] and combined with the experiment. Compared with the existing straight tube model, the graphene surface deposition rate is improved. The experiment results of this study may provide a reference for other researchers interested in this field of study.

2. Thermodynamic Numerical Analysis of Graphene Prepared by the CVD Method

2.1. Principle of Chemical Reaction

At present, in the experiments on the chemical vapor growth of graphene on a copper surface using methane as carbon source, the theory suggests that methane vapor decomposition can be neglected in the whole process, because the barrier for the first step of methane dehydrogenation reaction is about 4.5 eV [5,10]. In the numerical simulation, we mainly consider the influence of pressure (operating pressure) changes in the CVD reaction in the Tesla valve on the gas flow and surface deposition rate, so we do not consider the gas phase decomposition of methane and only consider the surface chemical reaction. Therefore, we only examined the total reaction of carbon deposited by the dehydrogenation of methane on the surface at two different pressures: atmospheric (AP-101,325 Pa) and low (LP-660 Pa) pressure.
CH 4   ( g )   K S C ( s ) + 2 H 2   ( g )

2.2. Reaction Geometry Model

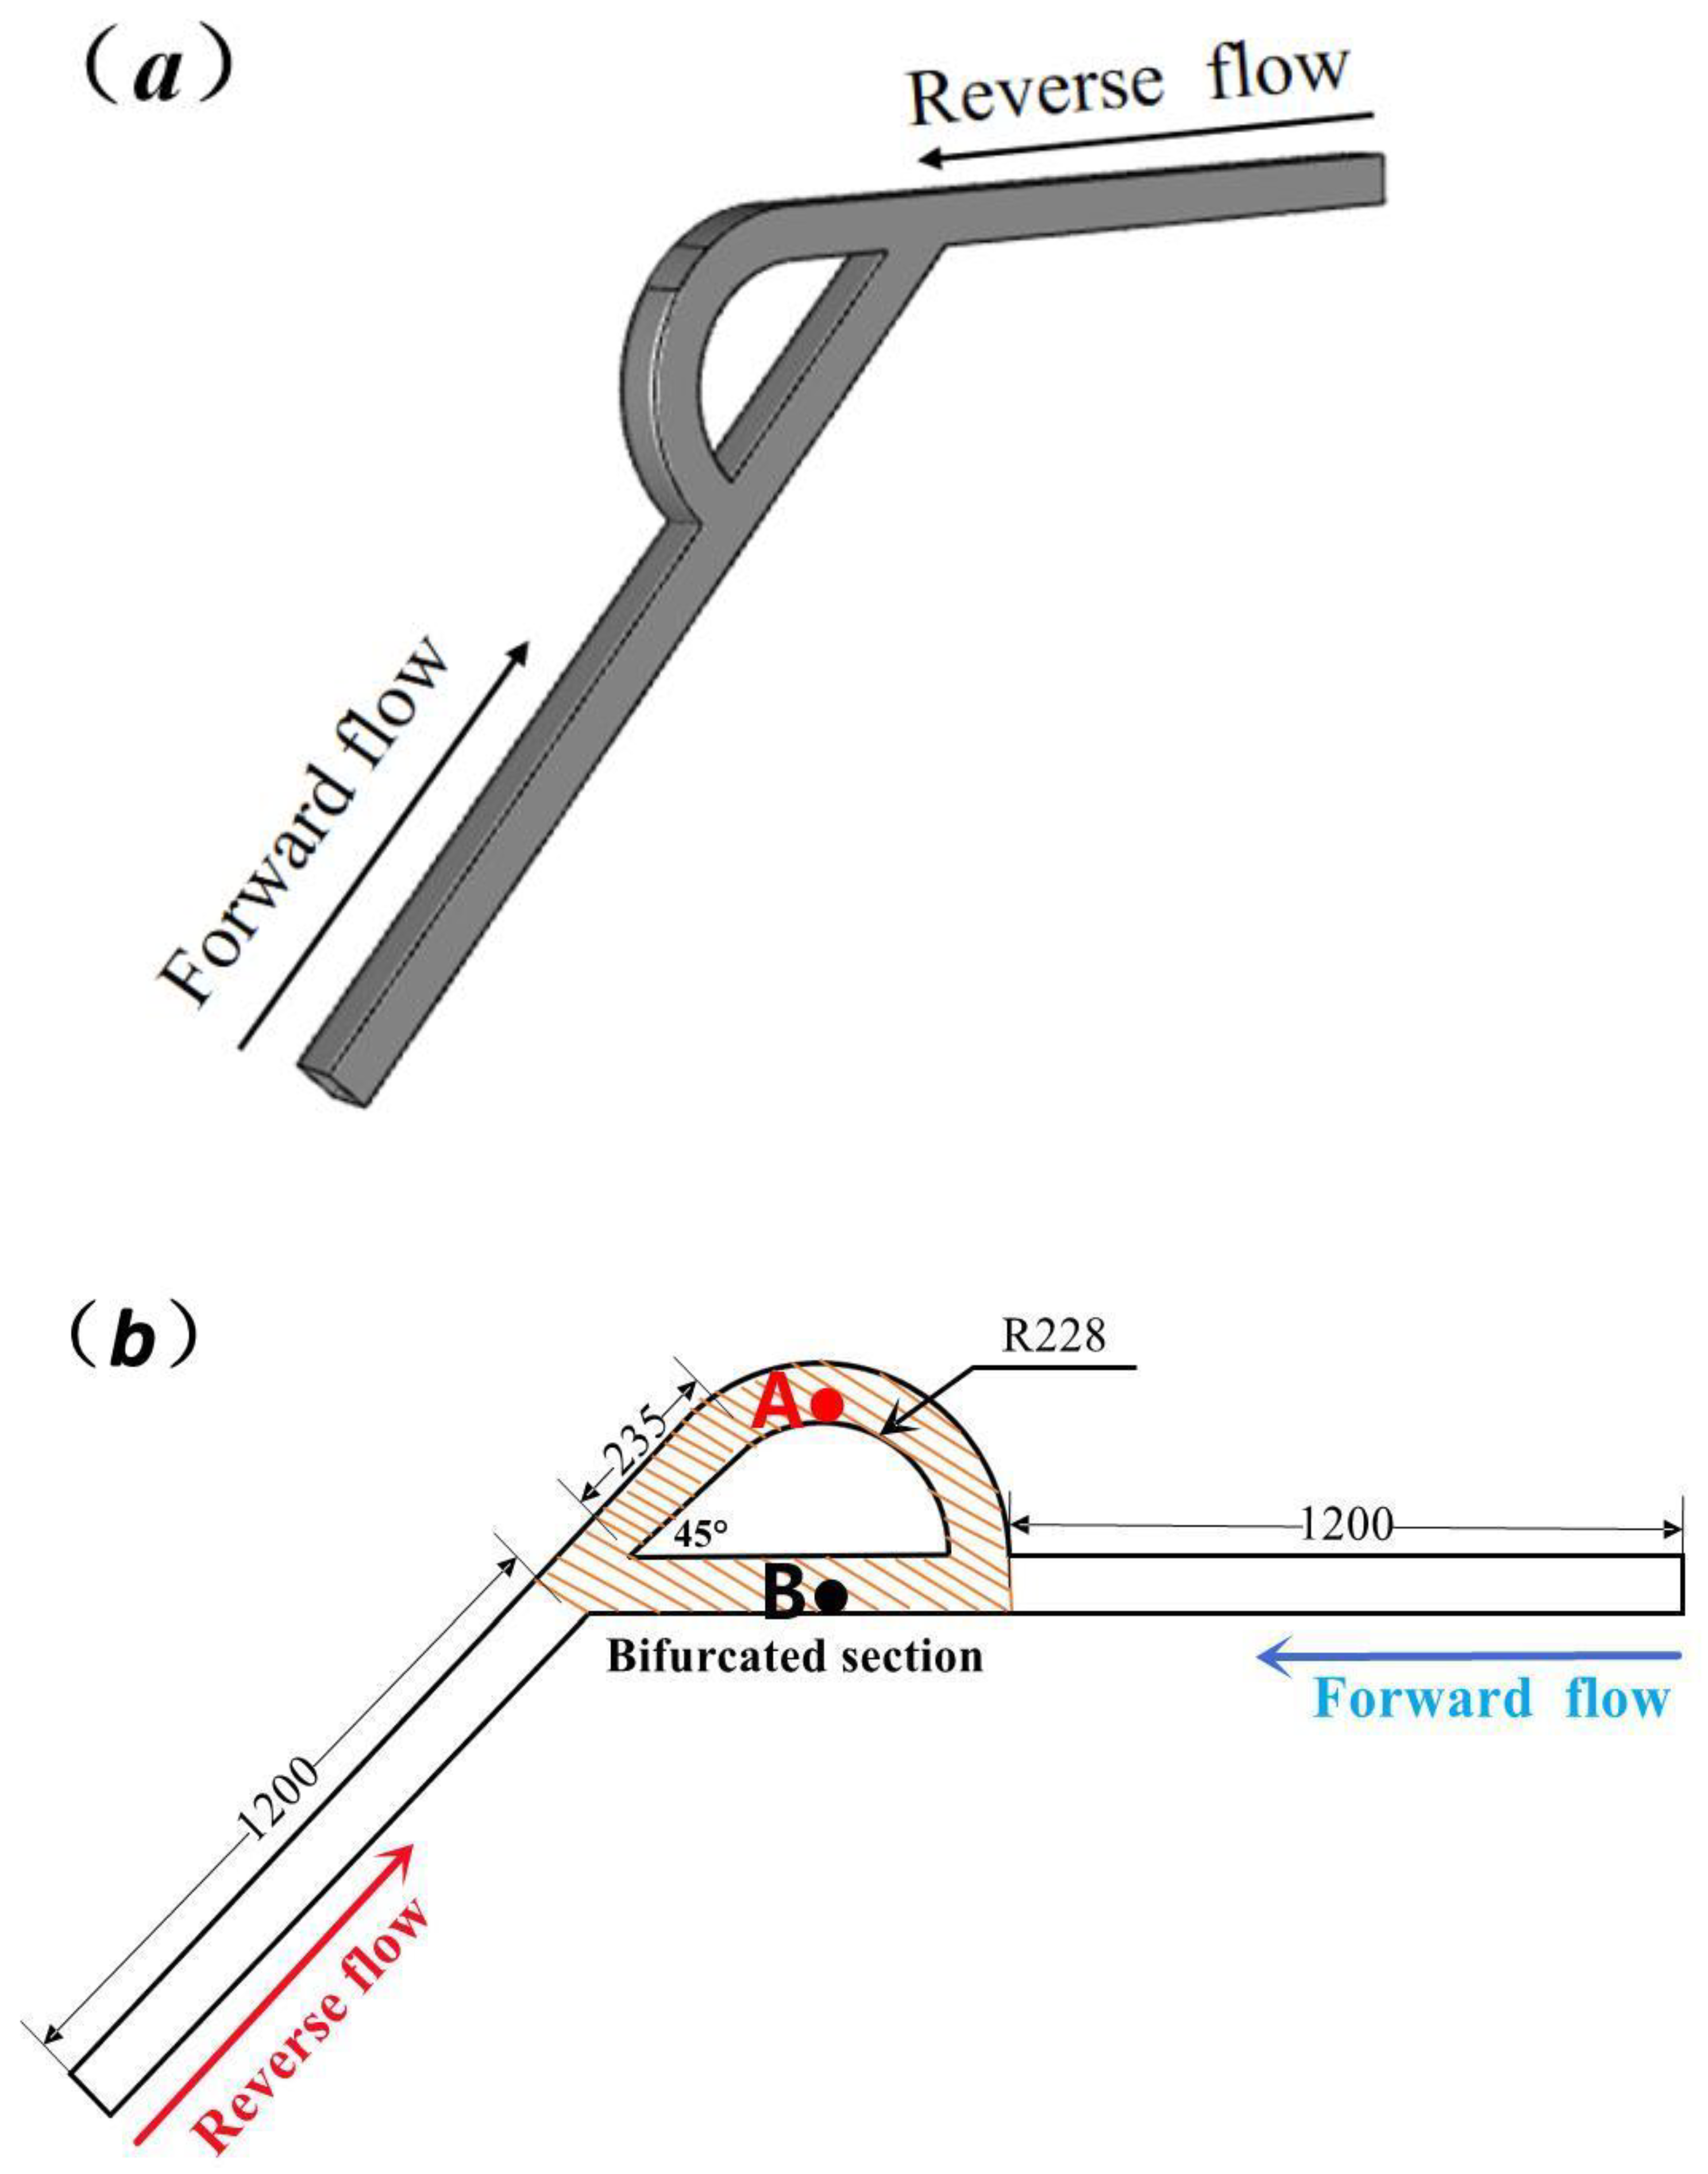
The structure of the CVD reactor is shown in Figure 1, which is based on a miniature T45-R Tesla valve [6], and a simplified diagram is given in Figure 2 to reduce computational time.

2.3. Simplified Numerical Model Based on T45-R Tesla Rice Structure

The valve used in this study was a miniature single T45-R type Tesla valve [6] (the numerical model was derived from the model used in the study by Qian et al.). The 3D model and its geometric parameters are illustrated in Figure 2a. The T45-R Tesla valve consisted of three parts: the inlet, bifurcation, and outlet. The cross-section of the miniature T45-R Tesla valve was a square with side lengths of 100 μm, and the lengths of the inlet and outlet sections were 1200 μm. For the circular arc channel, the radius of the inner arc was 228 μm, the length of the straight section tangent to the arc was 235 μm, and the angle at the bifurcation was 45°. Two points, A and B, were chosen as the monitoring points for the numerical simulation, i.e., the reaction surface for the practical graphene deposition, as shown in Figure 2b.

2.4. Thermodynamic Numerical Analysis

According to the thermodynamic theory, using thermodynamic simulation software Factsage 8.2, the molar reaction enthalpies of the methane decomposition reaction at different temperatures were calculated and plotted [10]. As shown in Figure 3, the methane decomposition was a heat-absorbing reaction, causing the enthalpy to increase with the increasing temperature.
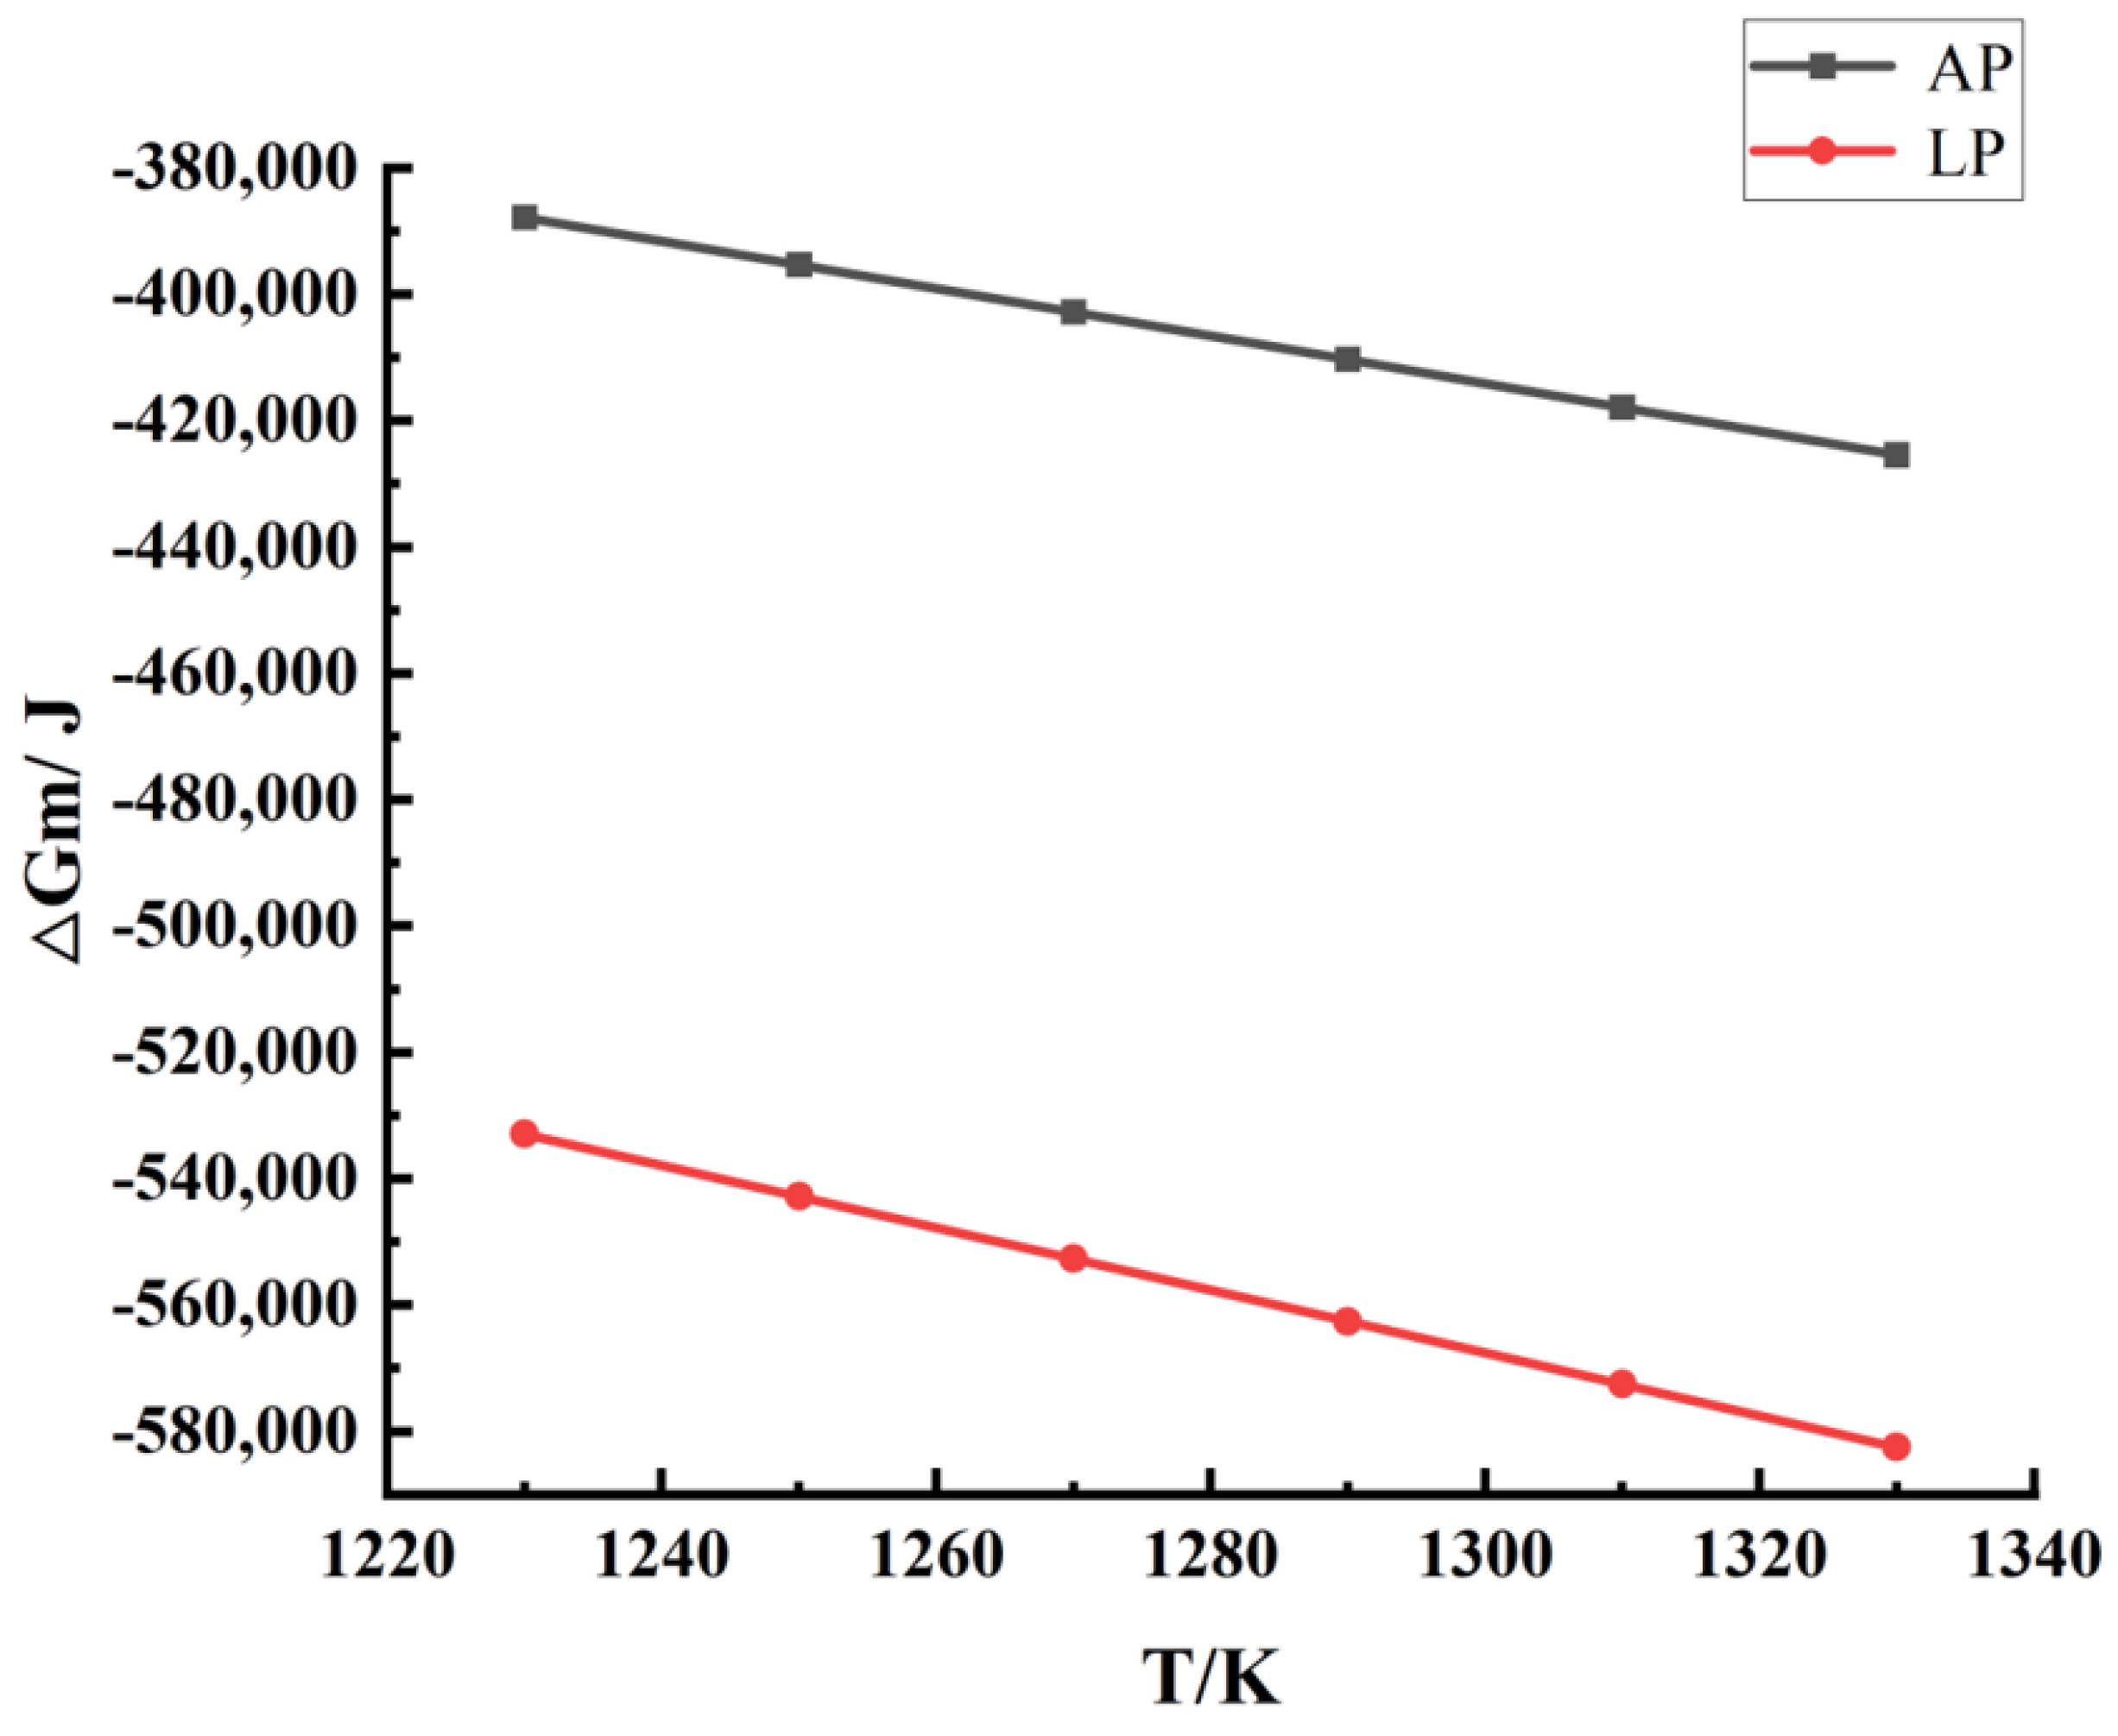
The Gibbs free energy data of the methane decomposition reaction at different temperatures in the interval of 1230–1330 K were calculated and plotted using the Factsage software 8.2 according to the existing literature [6], as shown in Figure 4.
The likelihood of a reaction occurring was determined by the magnitude of the Gibbs free energy of the reaction process. The Gibbs free energy values of the reaction process were always negative, indicating that the methane decomposition reaction tended to proceed spontaneously between 1230 K and 1330 K. According to the Gibbs minimum free energy theory, reactions with the smallest Gibbs free energy exhibited a greater thermodynamic trend. The higher the reaction temperature, the smaller the Gibbs free energy of methane decomposition; i.e., as can be seen from the thermodynamic reaction data, the direction of the methane decomposition reaction played a dominant role, and the trend of methane decomposition was obvious.

3. Numerical Model

3.1. Governing Equations

In this study, we used computational fluid dynamics software Fluent and focused on the surface deposition rate of graphene, which is in the order of micron per minute, which means that the surface growth rate is relatively slow. Thus, the system can be considered to be in a steady state any instant during the process. The model used to calculate gas flow in the reactor is based on the steady state, Reynolds-averaged Navier–Stokes (RANS) equations (continuity, momentum, energy, and species equations) [11], in which the gas mixture (CH4 and H2) is considered an incompressible ideal gas. The details of the governing equations are listed in Table 1.
Here:
μ e f f = μ + μ t ; λ e f f = λ + λ t ; h = j m j T r e f T c p , j d T .

3.2. Forward Flow and Reverse Flow

Under atmospheric pressure (AP) conditions, Fluent 2021R simulation results show that, as in Figure 2, both the left and right ports of the channel can be used as the inlet and outlet flows; the right and left ends are defined as the inlets for the forward and reverse flows, respectively. The forward and reverse flow directions refer to the direction of less and greater resistance, respectively, in the fluid flow process. When the fluid flow direction changed, the inlet and outlet sections switched, and the bifurcation section consisted of a straight and curved channel. Forward flow is defined as fluid entering the T45-R Tesla valve from the channel in common with the bifurcated section, whereas reverse flow is defined as fluid entering from the opposite end. Velocity clouds of the forward and reverse flows were obtained under a 2 mL/min fluid flow rate with the inlet as the boundary condition, as shown in Figure 5.

3.3. Single Conductivity Parameter

A measure of the unidirectional flow of a Tesla valve can be described by the Di number, which is related to the magnitude of pressure potential energy loss in the valve during forward and reverse flows. The outlet was considered to be the zero point of the pressure potential energy, making Di numerically equal to the ratio of the pressure drop in the reverse flow to the pressure drop in the forward flow [1,8], expressed as:
D i = Δ p r Δ p f
where Di is the diodicity, Δpr is the pressure difference between the reverse inlet and outlet, and Δpf is the pressure difference between the forward inlet and outlet. The larger the Di value, the more challenging reverse flow when compared to forward flow, the better the blocking of the Tesla valve, and the more obvious the single-guide effect of the Tesla valve.

3.4. Boundary Conditions and Parameter Settings

The inlet and outlet boundaries were set as the velocity and pressure inlet conditions, respectively, the reference pressure as 0 Pa, and the inner wall as the no-slip wall surface. Two monitoring positions, A and B, were selected on the reaction surface for the depositing graphene, as shown in Figure 2b.
All the physical parameters of the materials used in this study were obtained from Li Gan et al. [5] (as shown in Table 2).
The appropriate model was selected according to governing Equations (2)–(5). The calculation method was chosen for the SIMPLEC numerical algorithm, and the discrete format was chosen for the second-order windward format and adjusted to set an appropriate relaxation factor. The inlet was used as the initial condition. The inlet boundary condition was set to the inlet velocity, and the outlet boundary condition was set to the static pressure condition, output at a pressure of 0 Pa.

4. Results and Discussion

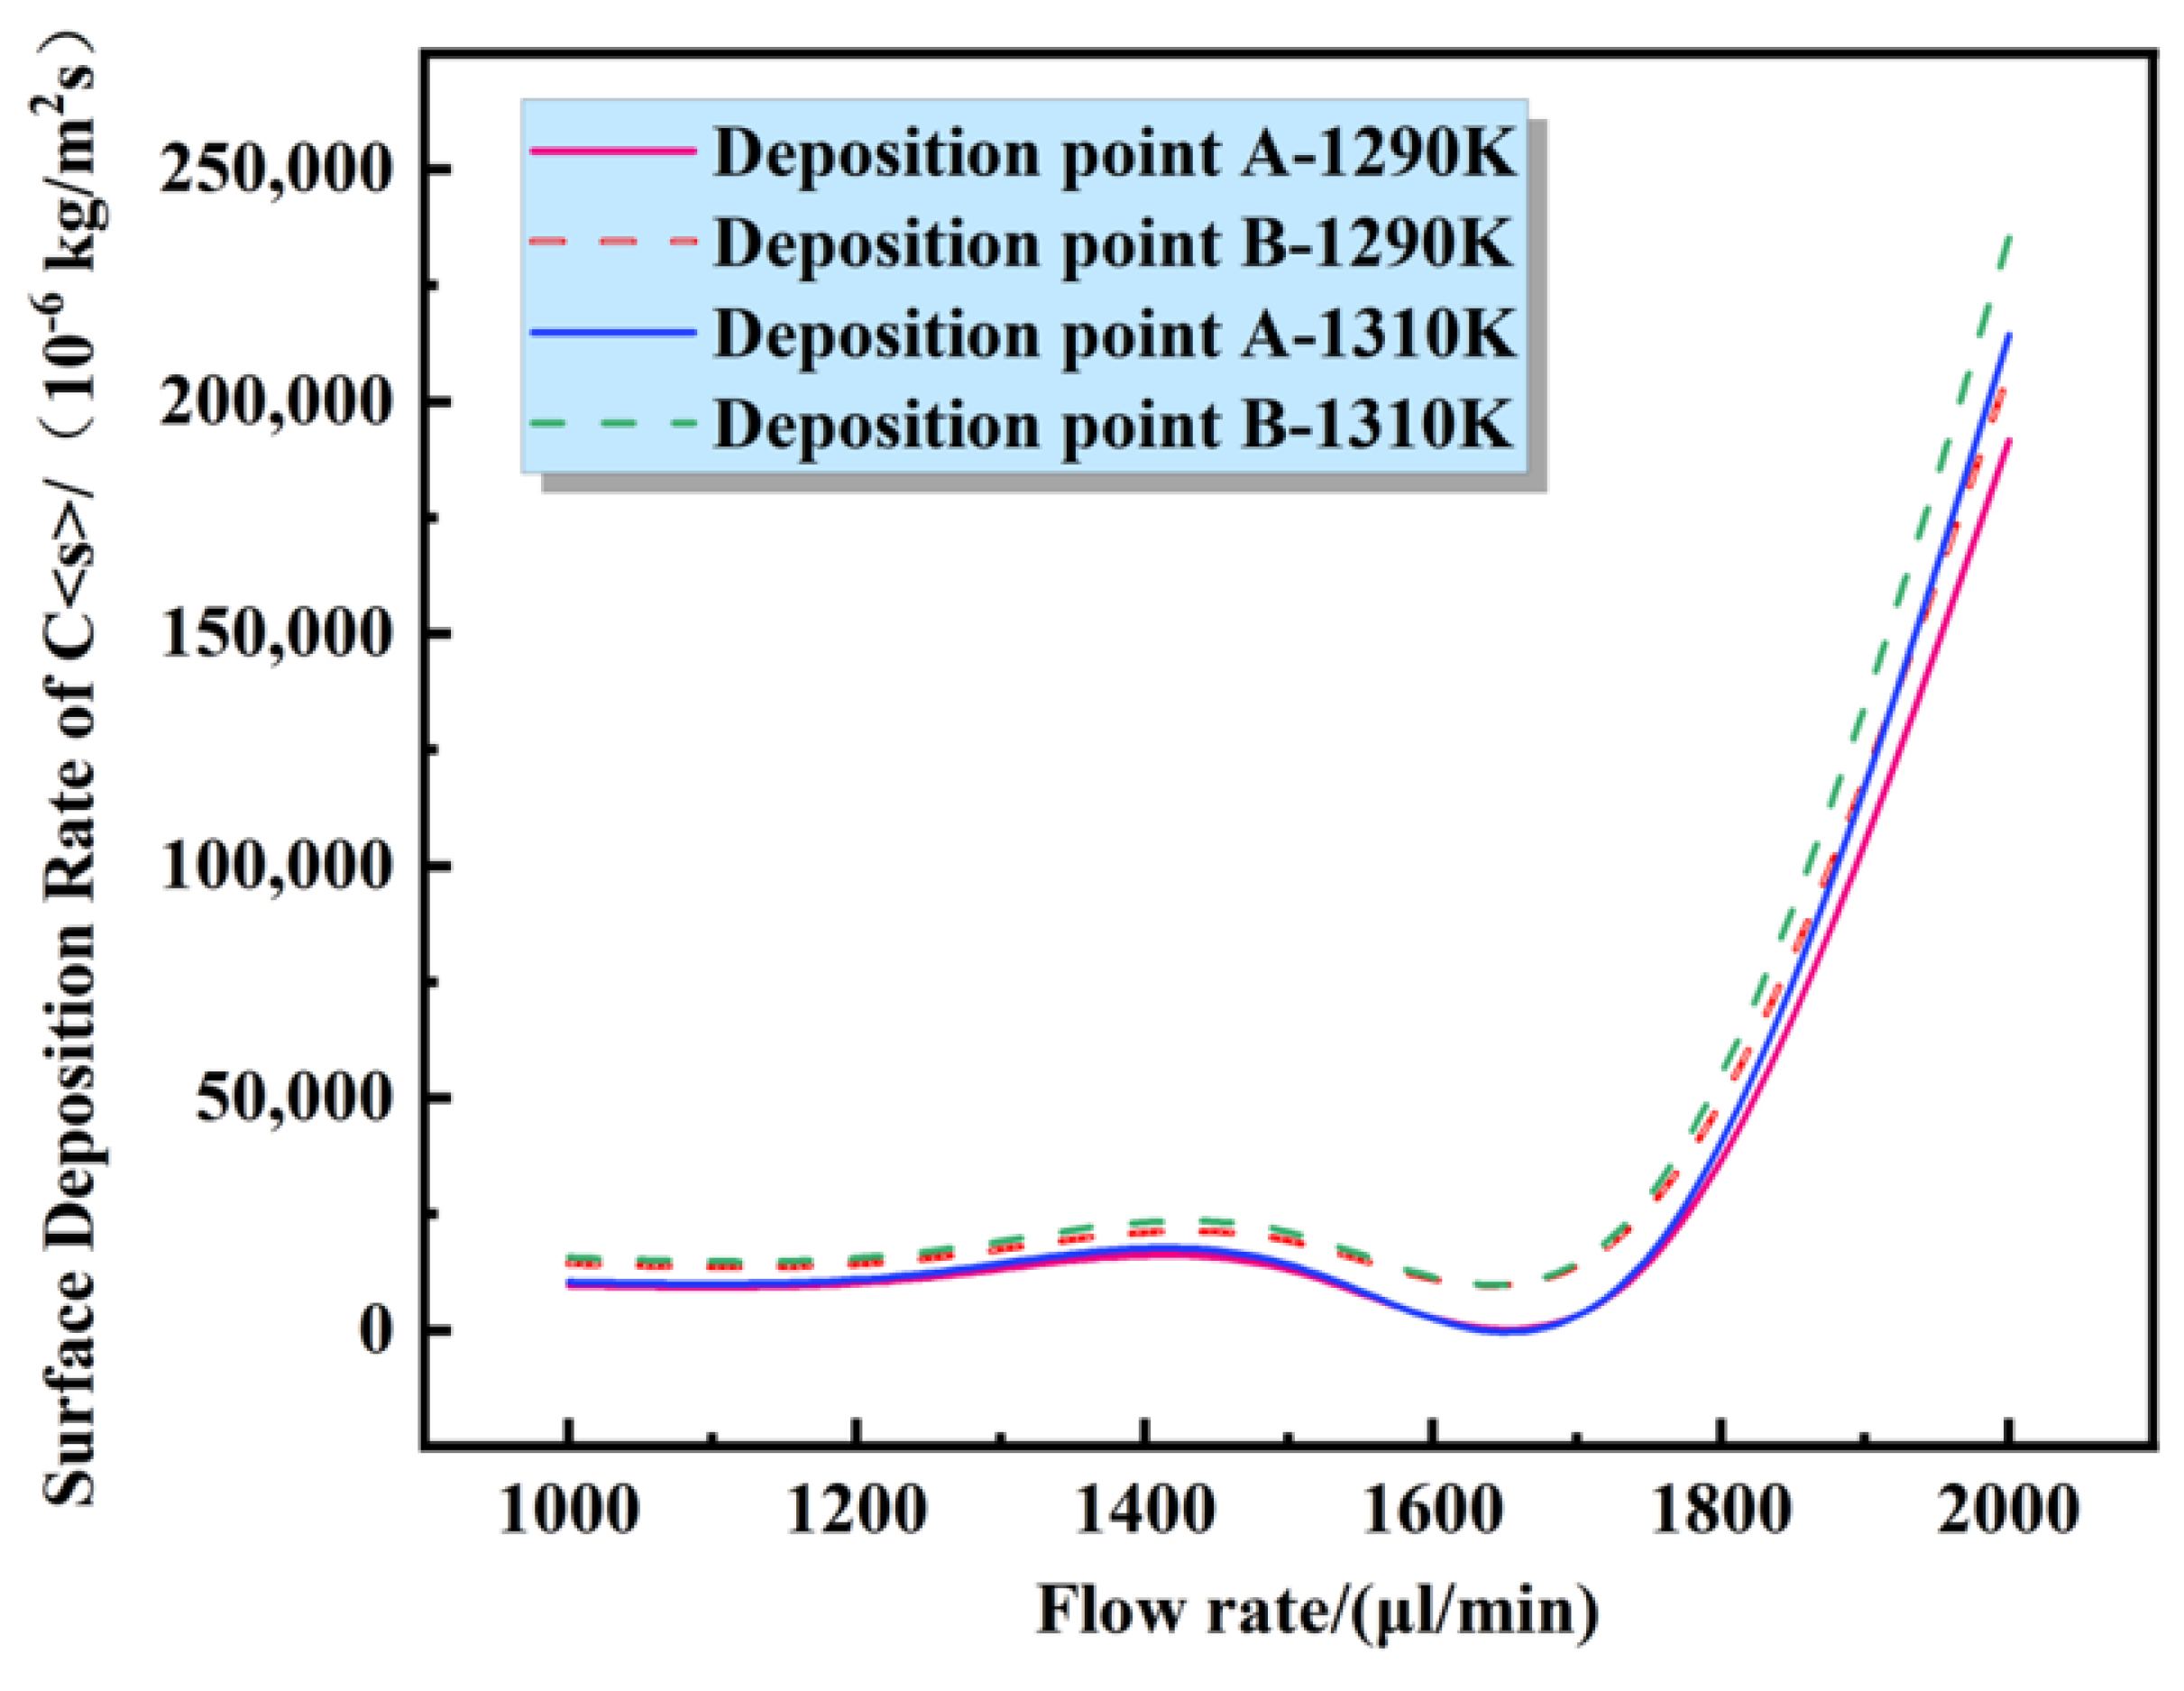
According to previous research [4,5,10], the temperature of graphene prepared by CVD on the surface of a copper substrate is approximately 1273 K and the melting point of copper is 1353 K. Therefore, for the simulation of the deposition rate with temperature, the Tesla valve structure was used to select temperatures of 1230, 1250, 1270, 1290, 1310, and 1330 K in order, according to the previous literature. The selection of intake flow rate is adjusted based on the research by Truong and Nguyen, and the simulation results are shown in the Figure 6. The flow rate was finally selected at 2000 μL/min. The CVD growth of graphene was simulated at two different pressures, atmospheric (AP-101,325 Pa) and low (LP-660 Pa). The temperature of the copper substrate reaction surface was varied to calculate the Di values and graphene surface at 1230, 1250, 1270, 1290, 1310, and 1330 K.
As can be seen from Figure 6, the carbon deposition rate increases with the increase of the intake flow rate. This is because when the gas flow rate is small, very little reactants (CH4 and H2) are transferred to the surface of copper foil. The carbon deposition rate is limited by the transfer rate. As the velocity of the feed flow increases, the concentration of the reactants transferred to the surface of the copper foil increases, and thus the carbon deposition rate increases. However, with the increase of the flow rate, as the reaction progresses, the reactant inside the Tesla valve is continuously consumed and the amount of reactant gradually decreases. When the mixed gas flow rate exceeds 2000 μL/min, the growth curve of carbon deposition rate tends to be gentle. If the supply rate continues to increase when the gas flow inside the valve also continues to rise to a certain value, the reaction time of the gas mixture on the copper foil surface within a unit time is too short, and thus the carbon deposition rate will also decrease continuously. As a result, the reactants are not fully consumed and discharged with the exhaust gas from the outlet, resulting in a waste of resources. Therefore, the mixed gas flow into the Tesla valve was selected as 2000 μL/min, and the adjustment of the range value was also consistent with the study of Truong, T. Q., and Nguyen et al.

4.1. Effect of Pressure Field on Graphene Synthesis

To avoid problems caused by truncation errors in the simulation, the operating pressure needs to be subtracted from the total pressure during the solution process. The relationship among operating pressure, relative pressure (P), and absolute pressure is: P = Pabs − Pop. Therefore, the numerical value of static pressure in the simulation results can be negative but the absolute total pressure will not be. Changes in static pressure can represent changes in total pressure in the reactor. In the CVD simulation, we set the operating pressure to 101,325 Pa in the atmospheric pressure (AP) and 660 Pa in the low pressure (LP). Gauge pressure is set to 0 Pa mainly in the boundary conditions of mass flow inlet and pressure outlet. The cloud image of the forward and reverse inflow of mixed gas is shown in Figure 7:
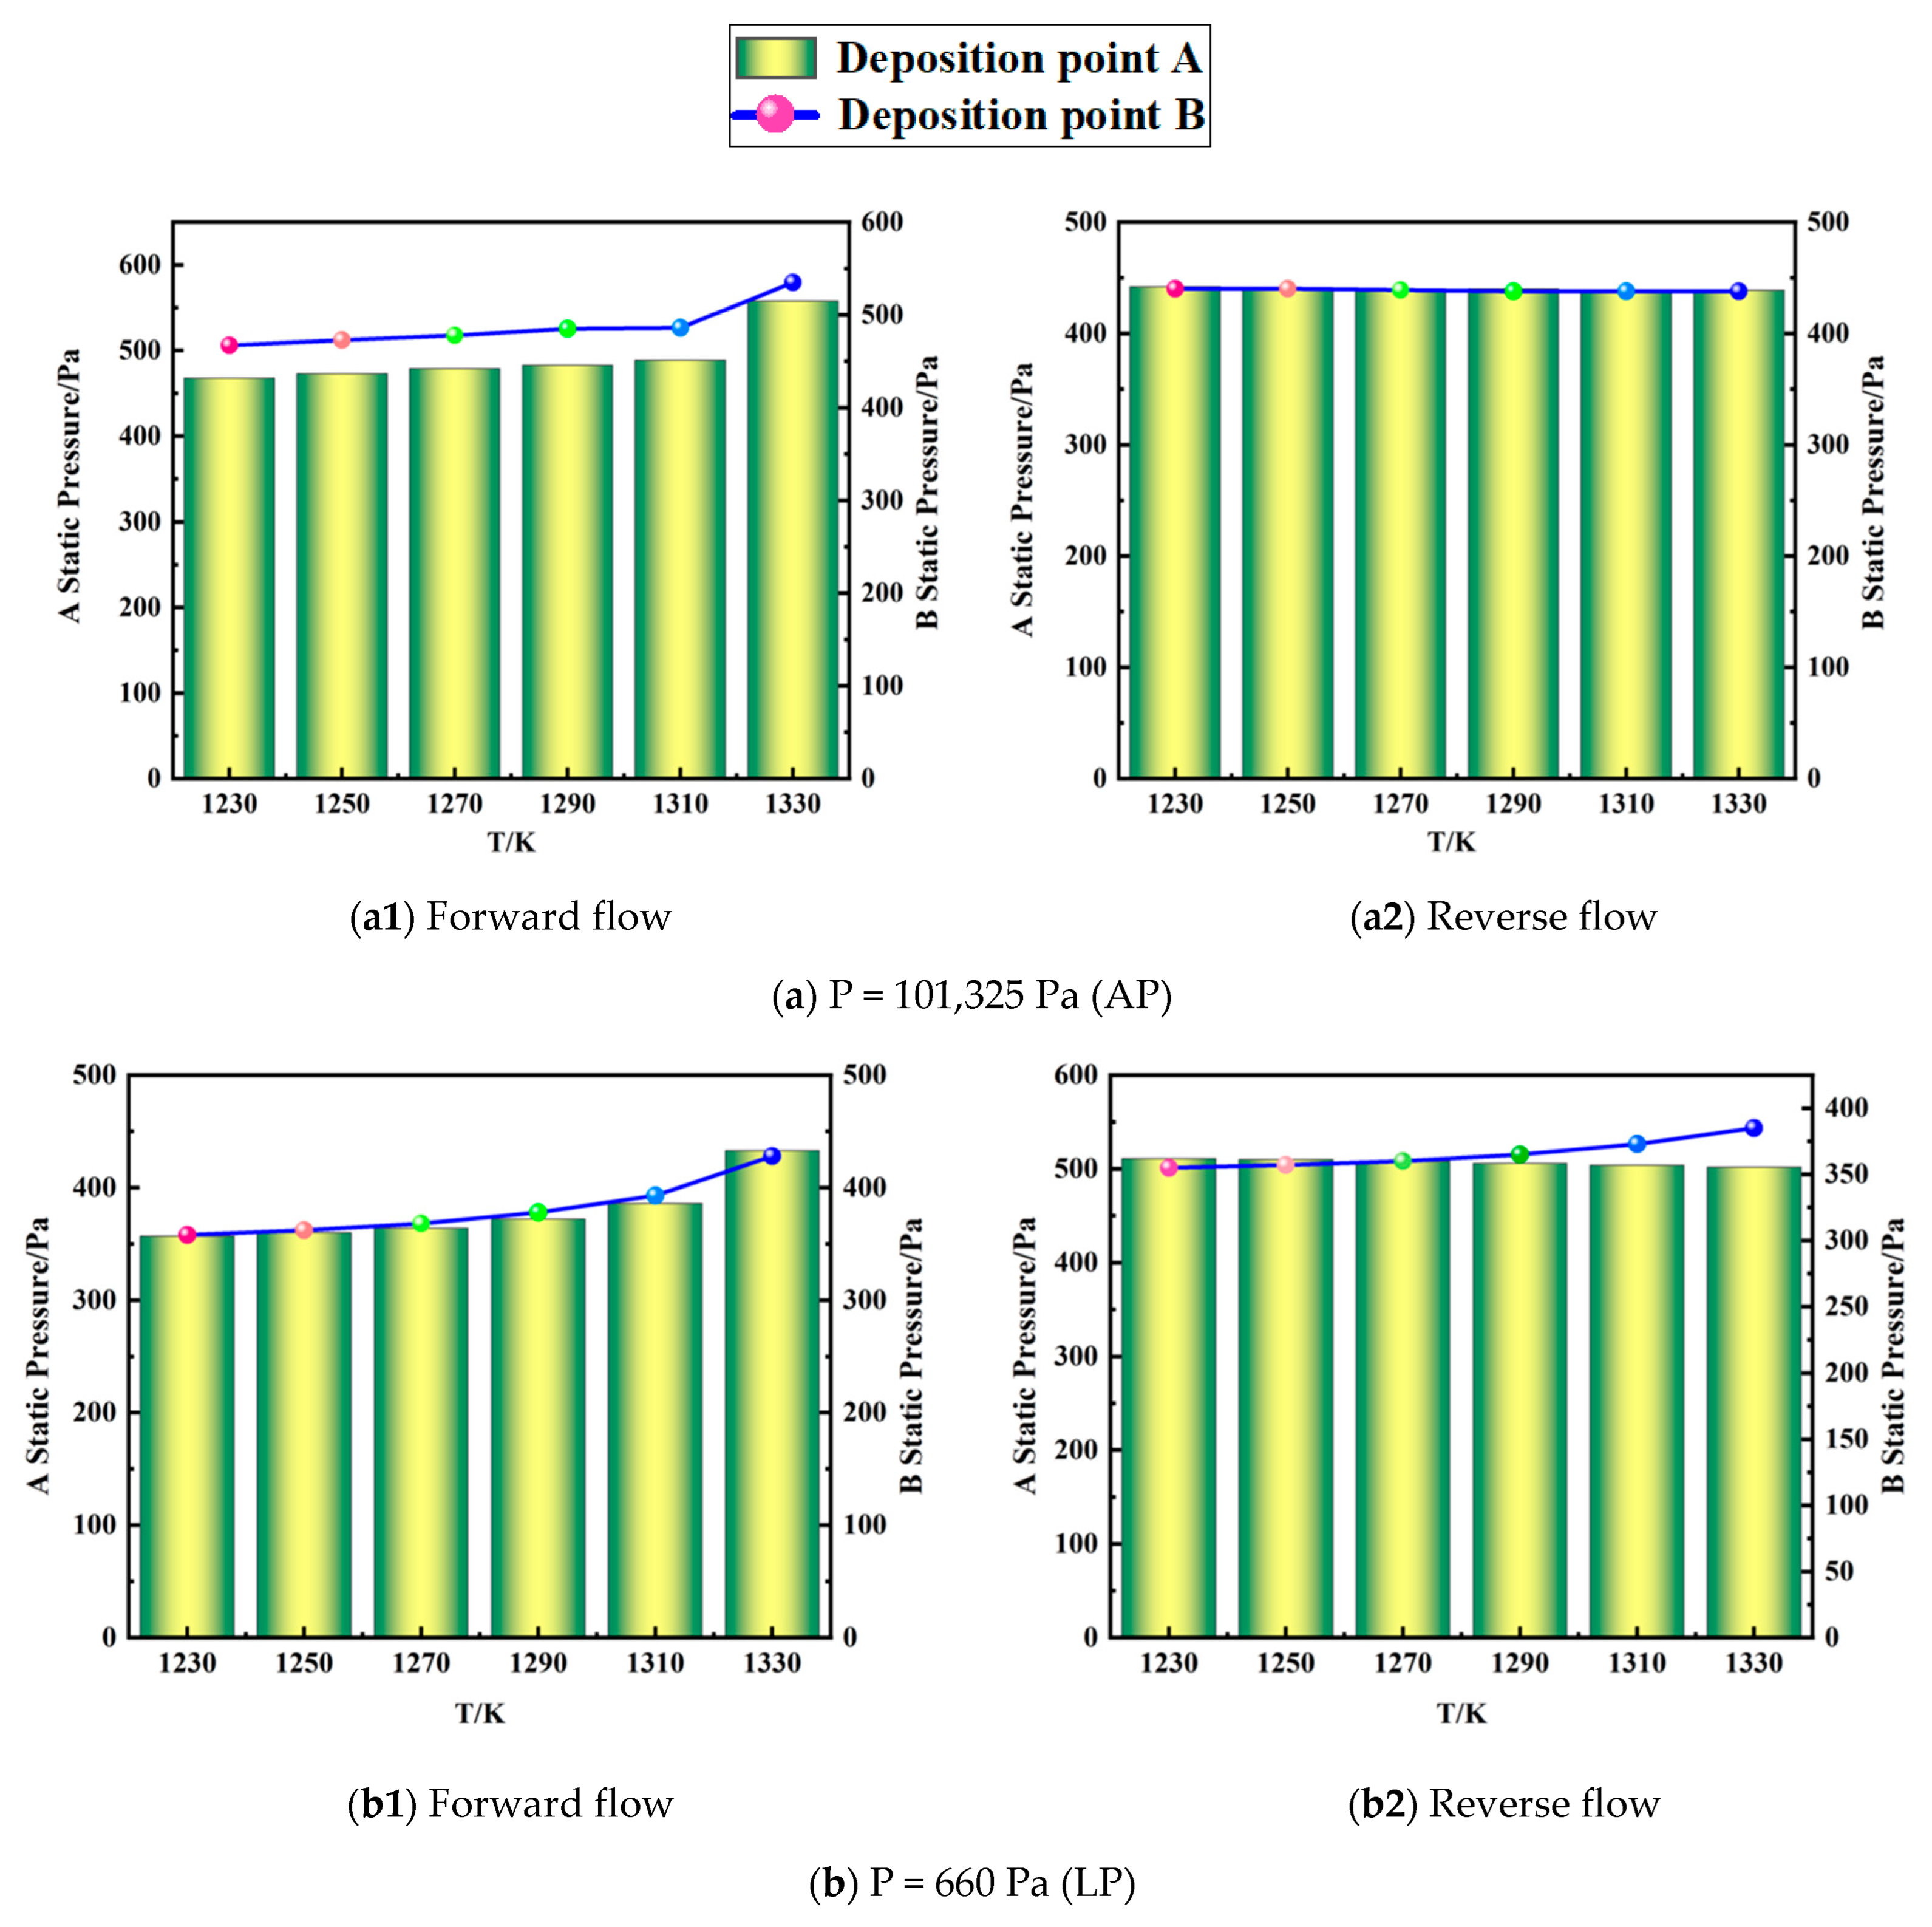
At the macro level, at the same temperature, whether the gas mixture flows forward or backward, the pressure distribution basically does not change. According to Figure 8a1,a2, in the temperature range of 1290–1310 K at atmospheric pressure, the pressure distribution is uniform, which is conducive to the smooth flow of gas in the quartz tube of the reaction chamber and the surface morphology of graphene is better and more uniform. When the temperature is higher than 1310 K, the pressure changes greatly, which has a significant influence on the gas flow. In Figure 8b1,b2, under low pressure, when the operating pressure is 660 Pa and the reaction is in steady state, the pressure growth at A and B in the Tesla valve fluctuates greatly compared with other low-pressure states, which affects the reaction flow and is not conducive to the surface morphology of graphene. At the same time, the relatively small pressure on the reaction surface is also caused by the consumption of some components in the surface reaction.
From the perspective of molecular kinematics, the static pressure (p) of a gas can be expressed by the thermal motion intensity of molecules and the number of molecules per unit volume. The relationship is as follows:
p = 2 3 n 0 m u 2 2
where p is the static pressure; m is the molecular mass of gas; u is the root mean square velocity of gas molecules; and n0 is the number of molecules per unit volume. From Equation (7), it can be seen that when the mixed gas flowed positively into the Tesla valve after the temperature rise, the static pressure of a gas was proportional to the average kinetic energy of the molecules. The higher the temperature, the faster the molecule motion, and the static pressure value increased at the same concentration of molecules. As can be seen from Equation (7), when the mixed gas flowed into the Tesla valve in the reverse direction after the temperature rise, due to the unidirectional flow of the Tesla valve [12], the molecular movement speed became slower, and the static pressure decreased at the same molecular concentration.
The simulation display was as follows: in the temperature range of 1230–1310 K, in both flow directions, the pressure at the monitoring points A and B in the valve changed with the increase of temperature. However, no matter the pressure increase or decrease, it is possible for the pressure distribution in the heating zone to be uniform under atmospheric pressure conditions, and the gas flows smoothly inside the reactor valve, which is conducive to the surface vapor deposition process. In this way, the modification and requirements of the low-pressure device used in CVD described in most of the previous literature are avoided. Thus, a large area and uniform graphene preparation can be achieved without using the low-pressure device inside the Tesla valve, reducing the cost and shortening the production cycle of graphene prepared using the CVD method.

4.2. Effect of Temperature on the Surface Deposition Rate

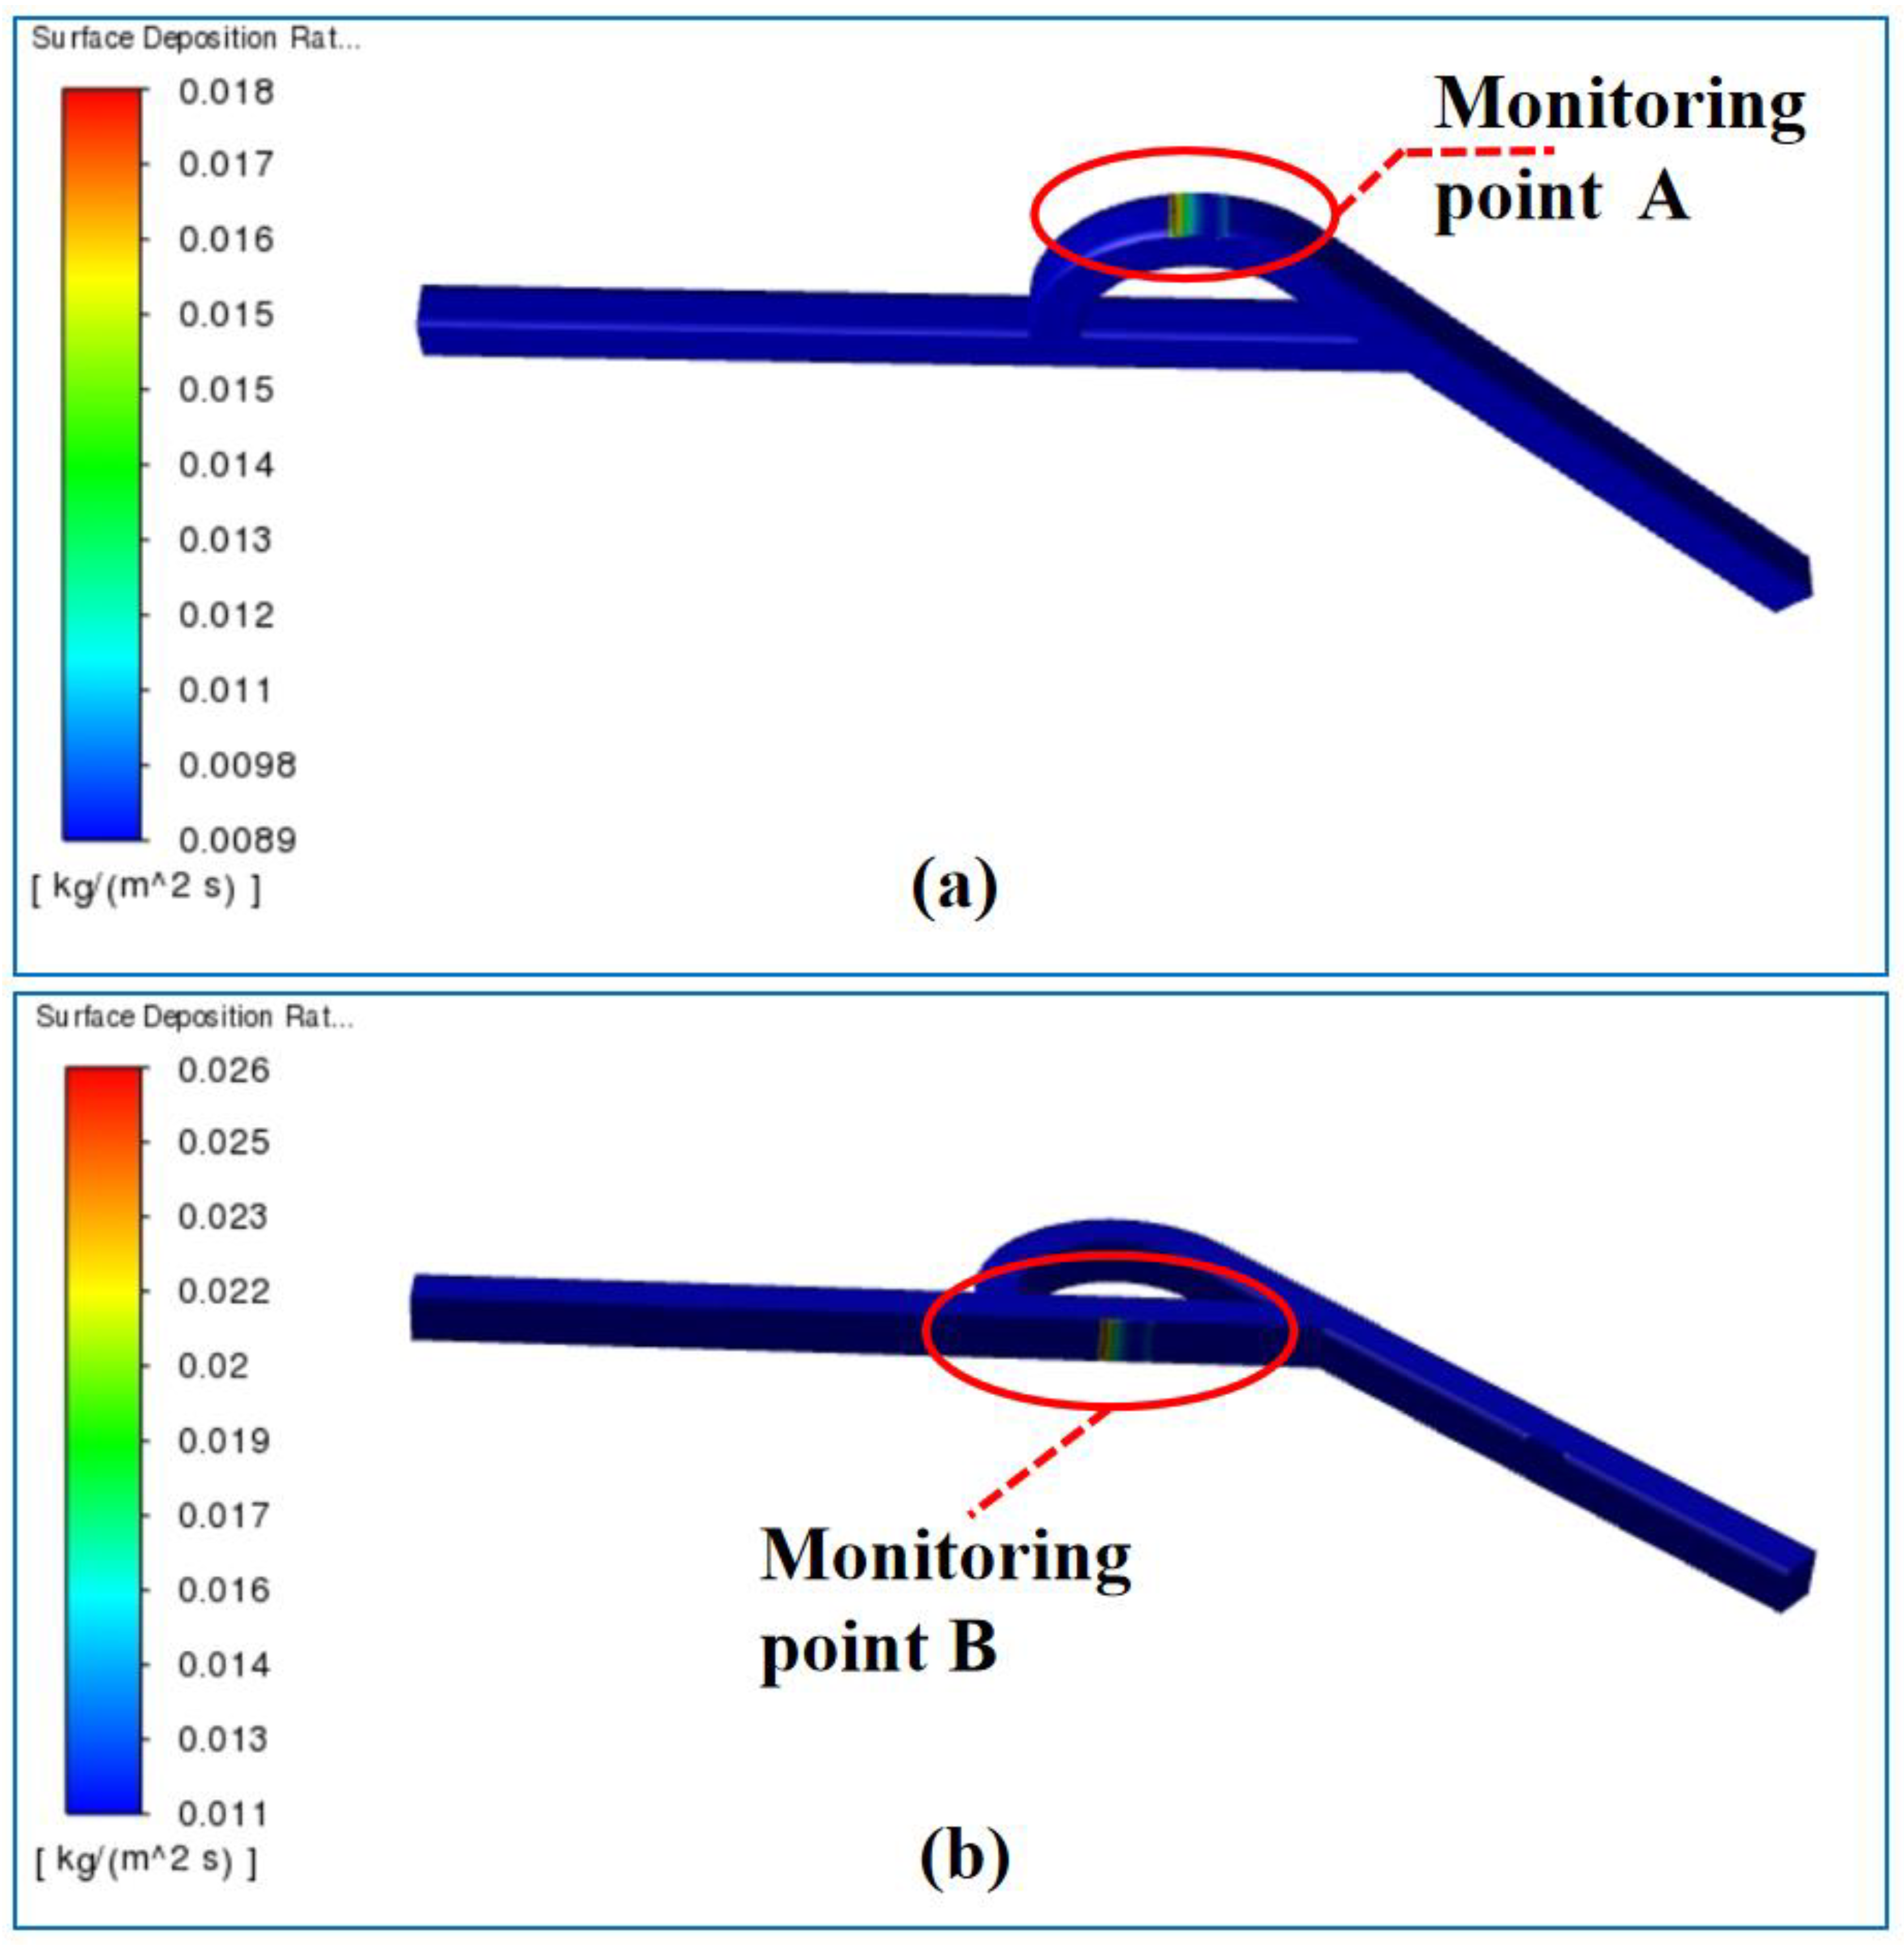
The simulation results of the variation of the graphene surface deposition rate with temperatures at monitoring positions A and B are shown in Figure 9.
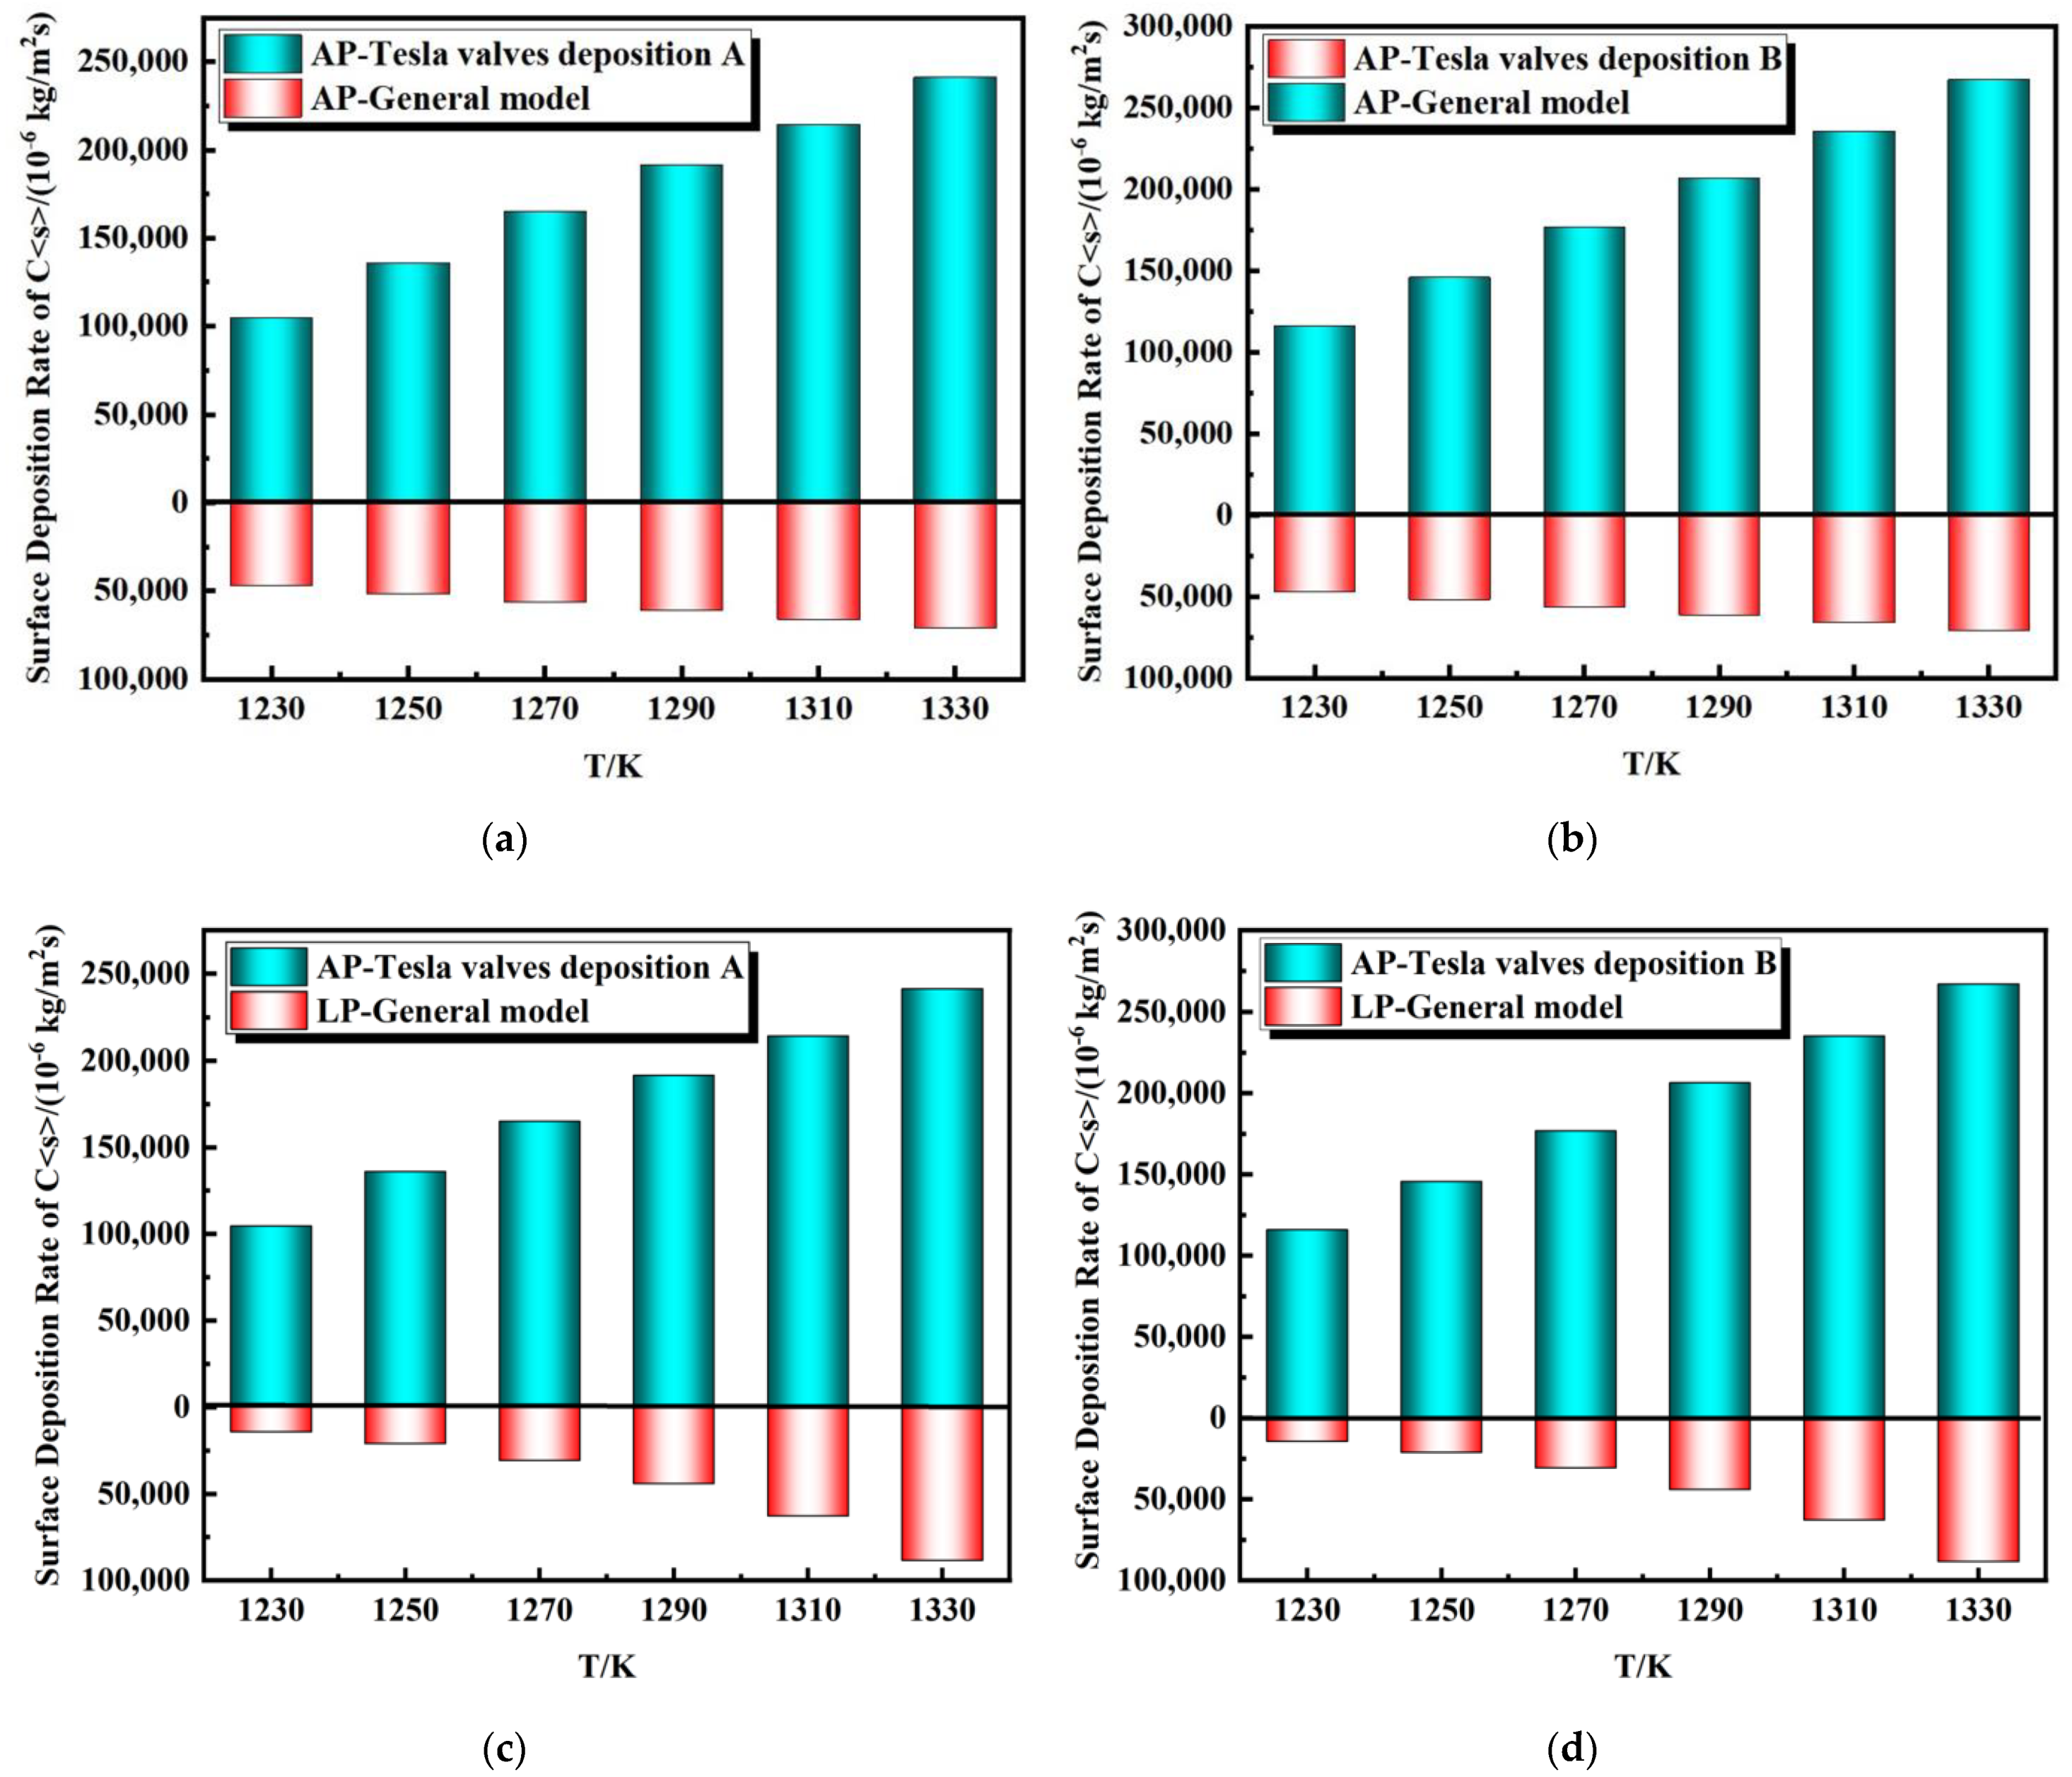
As shown in Figure 10, under different pressure conditions, the graphene surface deposition rate increased with a rise in temperature in both flow directions at both monitoring points, A and B. Although the Tesla valve at the sink point B under atmospheric pressure has a good control effect on the flow direction of nanofluids at a high temperature, the influence of temperature gradually weakens when the temperature rises to 1290 K (in Figure 11a). The results show that the gas mixture flowed in the reverse direction, and most of the fluid flowed into the curved channel, leading to the surface diffusion rate of carbon. However, generally speaking, compared with the existing straight tube model [5], the graphene surface deposition rate (see points A and B in Figure 11) increased by two orders of magnitude in the Tesla valve structure. Therefore, the application of this special structure of the Tesla valve can greatly improve the graphene surface deposition rate, which is more conducive to the generation of large-area, high-density graphene.
When the gas mixture flows forward, the graphene surface deposition rate at monitoring point B was greater than that at monitoring point A after the temperature increased under both high- and low-pressure conditions. This was because most of the fluid flowed into the through channel when the gas mixture flowed forward into the micro-scale T-45R Tesla valve [6,13,14]. The graphene surface deposition rate increased with temperature, in accordance with the Arrhenius equation:
K S = A e Δ E a R T
where KS is the chemical reaction coefficient, A is the frequency factor, R is the gas constant, T is the absolute temperature, and ∆Ea is the activation energy. According to the Arrhenius equation, the value −∆Ea/RT increases with increasing temperature, causing the deposition rate to increase with increasing temperature [15]. This process is limited by the surface chemistry, which is predominantly controlled by temperature. Therefore, the higher the temperature, the greater the graphene surface deposition rate, and the better the surface densification.
When the gas mixture flowed in the reverse direction, the graphene surface deposition rate at monitoring position A was superior to that at monitoring position B after the temperature increased under either high- or low-pressure conditions. This was because most of the fluid flowed into the curved channel when the gas mixture flowed in the reverse direction into the micro-scale T-45R type Tesla valve [6,16]. According to the Bernoulli equation [5,17]:
P + 1 2 ρ V 2 + ρ g h = C
D = D 0 ( T T 0 ) 1.81 ( P 0 P )
h s = D δ
According to Equations (9)–(11), because the diffusion coefficient D is inversely proportional to the reaction chamber pressure and proportional to the reaction chamber temperature during CVD growth, the diffusion coefficient D increased as the temperature increased and pressure decreased [18]. The boundary layer thickness δ remained unchanged, the gas transport coefficient hs increased, and the graphene surface deposition was limited by the transport of reaction gas components. Thus, the gas flow rate V increased inside the Tesla valve, and the more methane gas entering the reaction space per unit time, the greater the graphene surface deposition rate [19,20,21]. The more methane gas entering the reaction space per unit time, the higher the rate of graphene surface deposition.
Homogeneous graphene materials were prepared when the pressure of the reaction chamber was low, given that the temperature of the reaction surface inside the Tesla valve remained uniform. Controlling the reaction temperature inside the Tesla valve between 1290 and 1310 K was more favorable for the preparation of graphene by the CVD method.
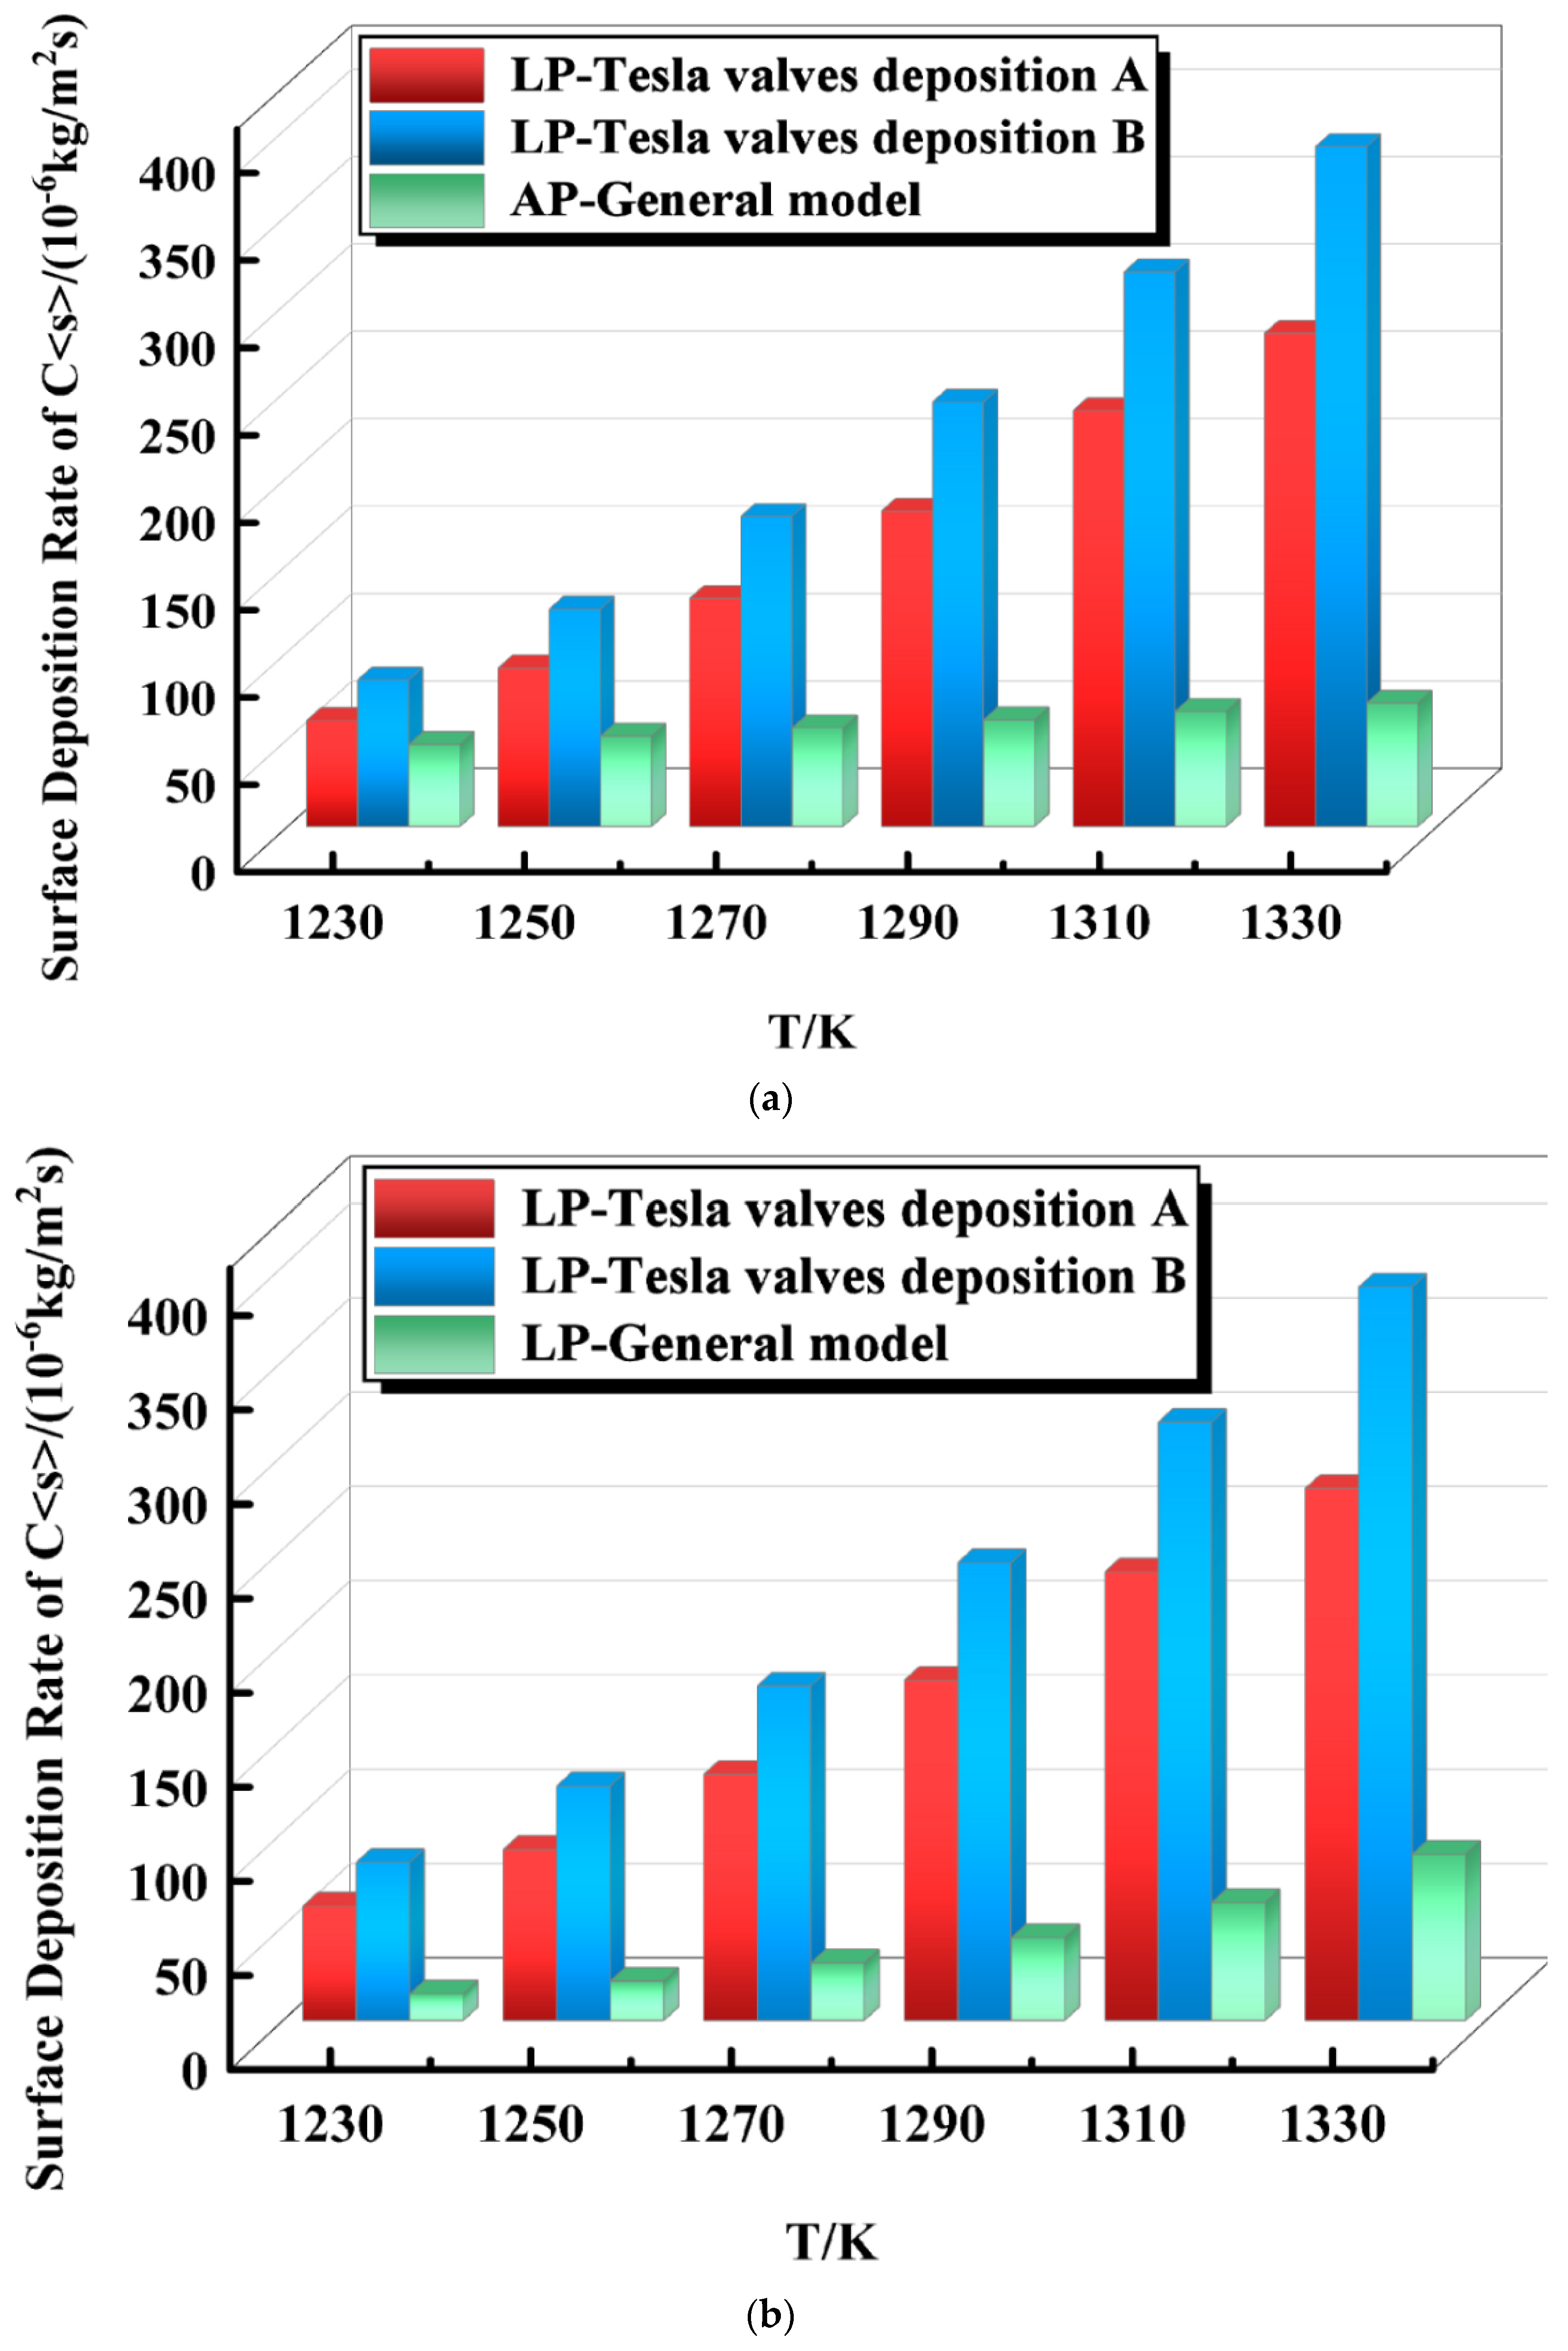
It can be seen from the comparison between the simulation results in Figure 11 and Figure 12 and the model of Li Gan et al. [5] that the new CVD reactor structure design based on the Tesla valve structure improved the graphene surface deposition rate by two orders of magnitude compared to the existing straight tube mode when the reaction temperature inside the Tesla valve remained between 1230 and 1330 K with increasing temperature, regardless of whether the fluid flowed forward or backward into the Tesla valve. Thus, the goal of a shorter growth cycle and a higher density of graphene is theoretically realized.
Meanwhile, as shown in Figure 13, the pressure drop ratio at different temperatures (as shown in Figure 7) demonstrates an increasing trend with the increase in temperature, and the Di values are all greater than or equal to 1, indicating that the reverse flow of fluid is more difficult than the forward flow, which is more consistent with the single guide pass characteristics of the Tesla valve [4,12]. In other words, when the graphene was deposited using the Tesla valve structure, the reactor was better at controlling the flow of nanofluids as the temperature increased.
In addition, although the pressure drop ratio increases with the increase of the internal temperature of the Tesla valve at both atmospheric and low pressure conditions, the pressure drop at atmospheric conditions is more stable than Di and is also more stable in controlling the flow direction of the nanofluids. Therefore, a correlation is proposed to calculate the pressure drop ratio by using the least squares method, and its expression is as follows:
Di = 0.003T + 0.6243
This formula is applicable to the calculation of Di values of graphene deposited inside the Tesla valve structure at temperatures between 1230 K and 1330 K.

5. Experimental Verification

After the copper foil was pretreated, it was loaded into a CVD tubular furnace with and without a Tesla valve structure. The graphene was grown on the surface of the copper foil using atmospheric CVD technology using tone-burning as a carbon source. A 25-μm-thick copper foil was placed in a quartz tube inside the Tesla valve. First, the copper foil was sintered in hydrogen at 1000 °C for 20 min. Then, methane, hydrogen, and hydrogen mixed atmosphere were added, and the growth time of graphene began at 90 s, 180 s, and 270 s, respectively. The comparative test design is given in Table 3.
Figure 14a shows the scanning electron microscope (SEM:FEI Quanta FEG250, Hillsboro, OR, USA) image of graphene on the copper foil after the 90 s gas mixture is passed into the Tesla valve structure. There are two areas with dark colors in the figure, and there are no graphene folds in the lighter area, indicating that the graphene grown after 90 s gas mixture is discontinuous. Figure 14a shows the SEM image of graphene on the copper foil after the 90 s gas mixture is passed into the Tesla valve structure. There are two areas with dark colors in the figure, and there are no graphene folds in the lighter area, indicating that the graphene grown after exposure to the 90-s gas mixture is discontinuous. After the gas injection time was increased to 180 s, the graphene was still relatively intact. As shown in Figure 14b, the graphene size was smaller, the graphene surface deposition rate increased, and the graphene morphology changed more regularly, which is consistent with the simulation results. Although it has a more regular shape, it is still a single layer of graphene because fewer carbon atoms cluster on the surface of the copper substrate. However, no graphene was produced in the conventional straight-tube model when the times of the gas mixture were 90 s and 180 s. When the time of gas penetration was increased to 270 s, different color shades appeared in the SEM image of graphene, as shown in Figure 14c. Unlike during the gas penetration time of 180 s, graphene folds appeared in the whole region at this time, and the clarity of the folds was also different, and the folds in the dark area are clearer and brighter. Lighter areas have darker graphene folds. This means that different areas have different layers of graphene, and the more layers there are, the more pronounced the resulting graphene folds will be. After the gas injection time was increased to 180 s, the graphene was relatively intact. As shown in Figure 14b, the graphene size was smaller, the graphene surface deposition rate increased, and the graphene morphology changed more regularly, which is consistent with the simulation results. Although it displayed a more regular shape, it still consisted of a single layer of graphene, because fewer carbon atoms clustered on the surface of the copper substrate. However, no graphene was produced in the conventional straight-tube model when the gas mixture times were 90 s and 180 s. When the gas penetration times increased to 270 s, different shades of color appear in the SEM image of the graphene, as shown in Figure 14c. Unlike the gas penetration time of 180 s, graphene folds appear in the whole region, the clarity of the folds is also different, and the folds in the dark area are clearer and brighter. This indicates that a large area of graphene can be prepared in a relatively short time after the introduction of a Tesla valve structure. This is consistent with the simulation results.
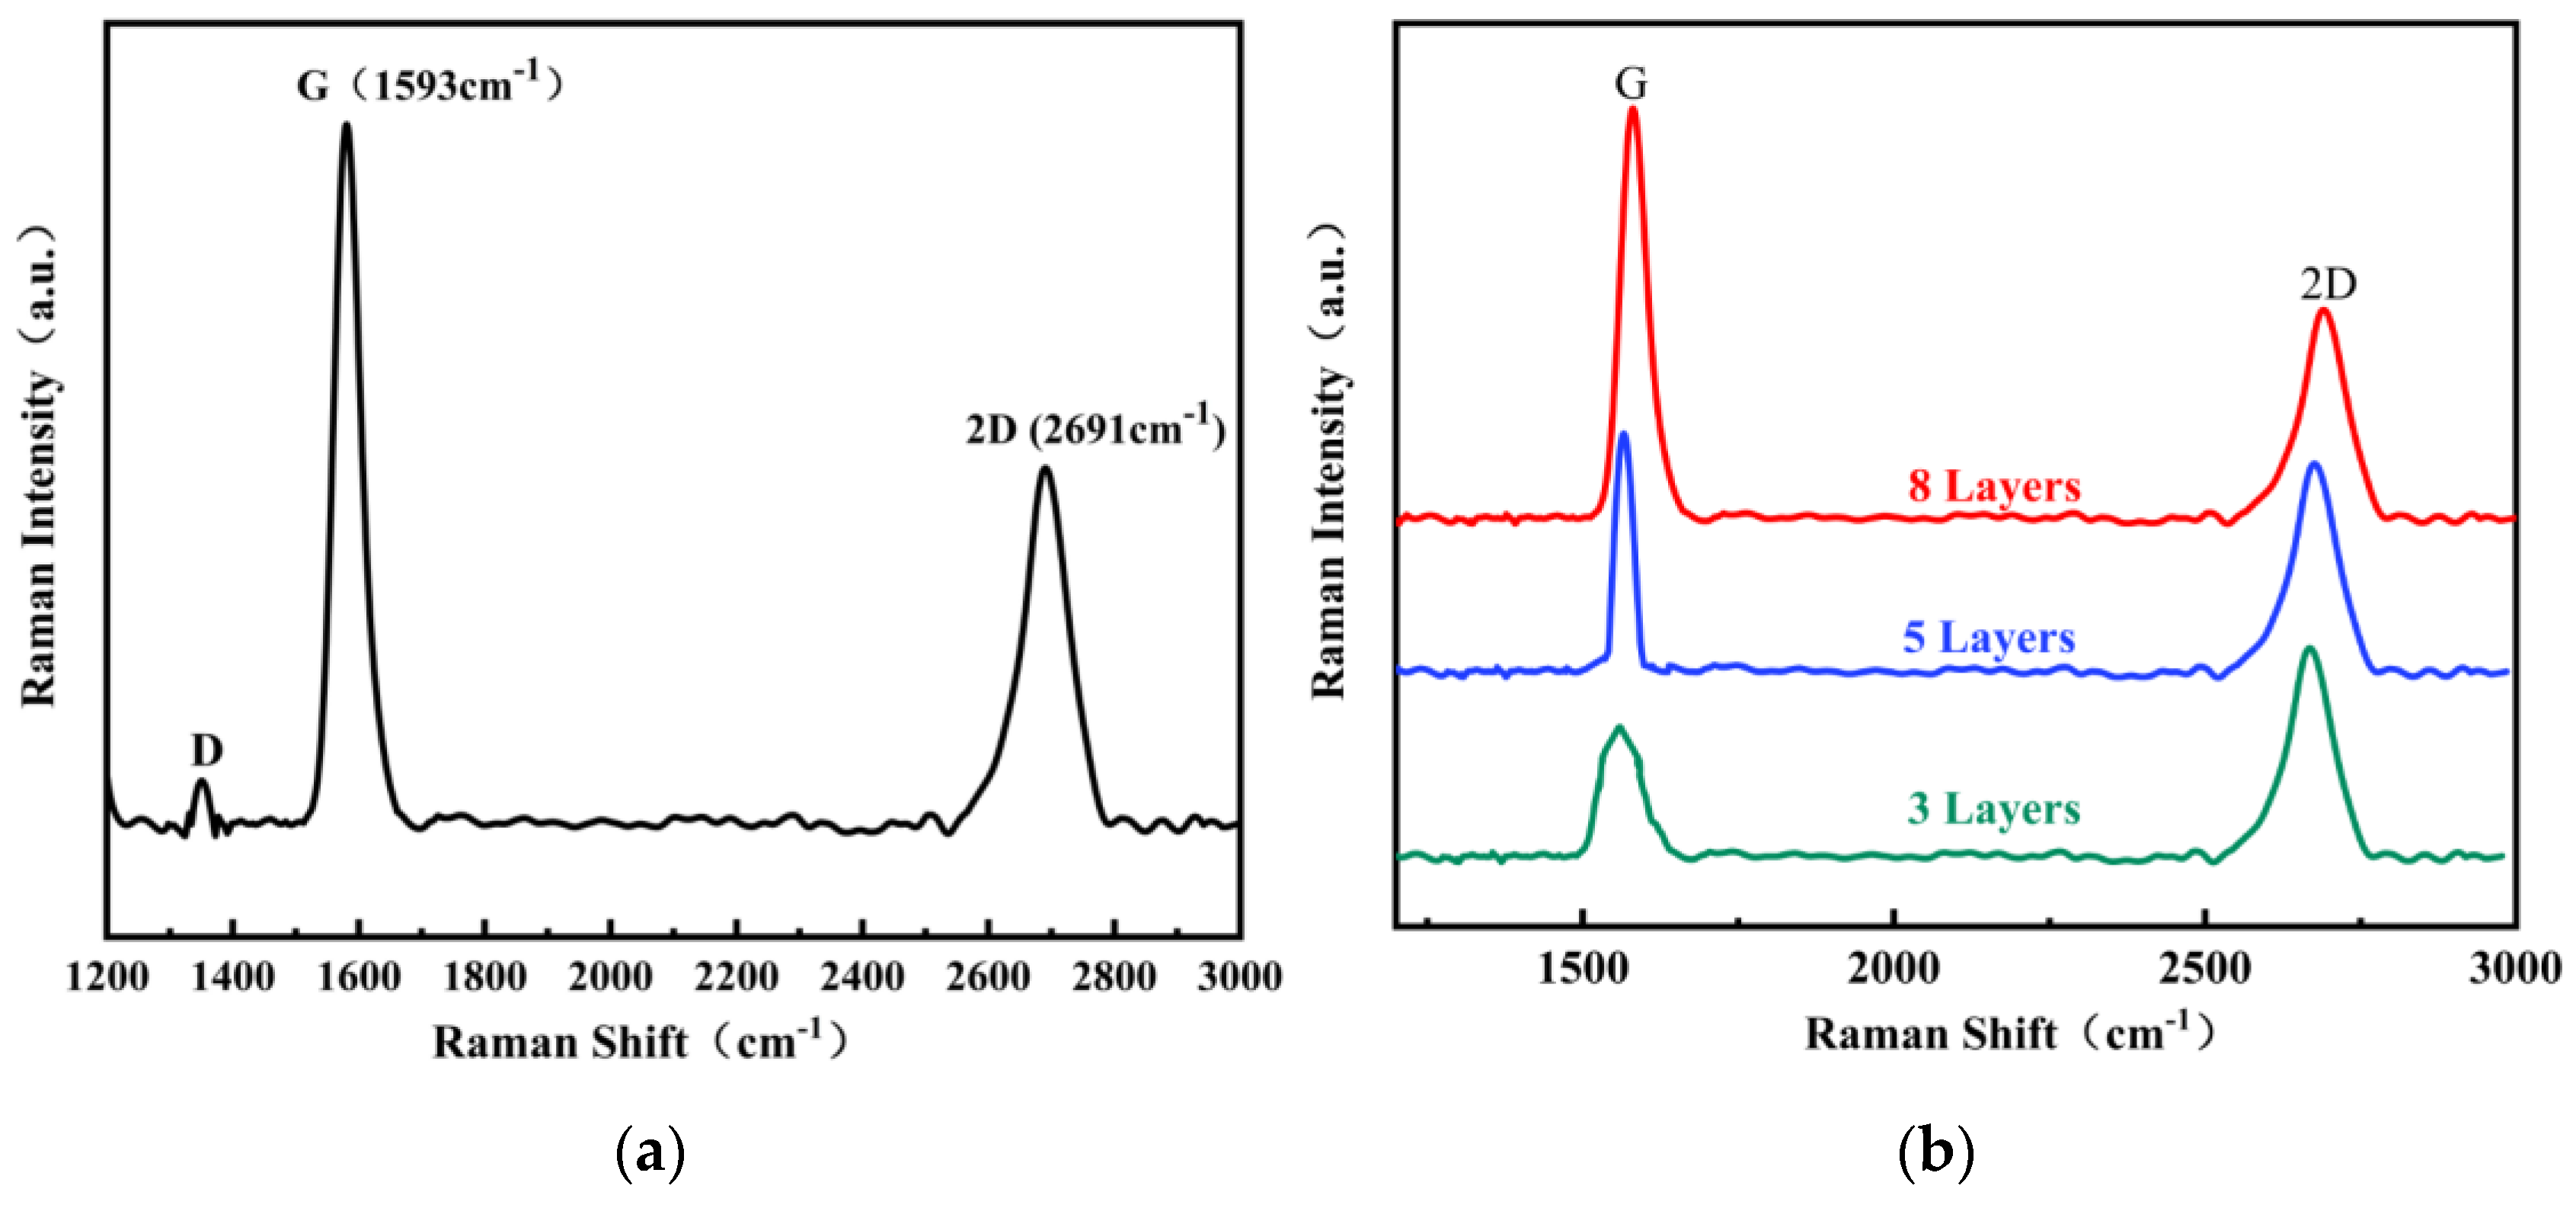
Raman characterization was performed on graphene prepared by t = 270 s, as shown in Figure 15a,b. In Figure 15a, peak D is obvious, while in Figure 15b, it can be seen that peak D is low and peak G is strong, indicating that the defect degree of graphene is low and the degree of crystallization and symmetry of graphene are good. The results indicated that the graphene layers prepared after the introduction of the Tesla valve structure were increased, the graphene growth area was larger, and the period was shorter than in those without the addition of the Tesla valve structure.
It can be seen from the atomic force microscopy (AFM:Smart SPM 4000, Parker NX10, Bruker dimension icon, Bremen, Germany) figure in Figure 16 that the graphene surface roughness (Ra) increases from 2.22 nm to 15.1 nm. The graphene folds were dimmer in the lighter areas, which means that the darker areas had different layers of graphene; and the more layers there were, the more pronounced the resulting graphene folds were. This belongs to the layered stacking structure, indicating that the introduction of the Tesla valve structure was conducive to the growth of uniform graphene over a large area.

6. Conclusions

It was found that temperature and pressure are the two important macroscopic physical quantities in CVD growth. This paper mainly discusses the influence of pressure and temperature changes on the deposition rate of CVD surfaces: (1) After adding the Tesla valve structure, when the gas mixture flows forward, the graphene surface deposition rate at monitoring point B was greater than that at monitoring point A after the temperature increased under both high- and low-pressure conditions. This was because most of the fluid flowed into the through channel when the gas mixture flowed forward into the micro-scale T-45R Tesla valve. The graphene surface deposition rate increased with temperature. Meanwhile, when the gas mixture flowed in the reverse direction, the graphene surface deposition rate at monitoring position A was superior to that at monitoring position B after the temperature increased under either high- or low-pressure conditions. This was because most of the fluid flowed into the curved channel when the gas mixture flowed in the reverse direction into the micro-scale T-45R type Tesla valve, which was examined using numerical simulation visualizations. (2) A numerical simulation method was used to determine the effect of the pressure field inside a Tesla valve on graphene synthesis at different temperatures under both atmospheric (101,325 Pa) and low (660 Pa) pressure. The structure of a miniature T45-R Tesla valve was set as the special structure for the CVD growth of graphene for this macroscopic numerical modeling. In our study, the gas flowed into the Tesla valve in both the forward and reverse directions. The pressure variation was more uniform in the atmospheric pressure state, regardless of whether the pressure in the valve increased or decreased. (3) The Di at different temperatures increased with an increase in temperature, which was consistent with the unidirectional flow of the Tesla valve. The new CVD reactor structure design based on the Tesla valve structure improved the graphene surface deposition rate by two orders of magnitude compared to the existing straight tube mode when the reaction temperature inside the Tesla valve remained between 1290 and 1330 K with increasing temperatures, regardless of whether the fluid flowed forward or backward into the Tesla valve. (4) Through the combination of simulation and experiments, it was found that through the introduction of the Tesla valve structure, the pressure distribution in the heating zone can be uniform and the gas flows smoothly inside the reactor valve at atmospheric pressure, which is conducive to the vapor deposition process on the graphene surface, thus avoiding the modification and requirements of the low-pressure device of the CVD process equipment in most of the previous literature. Thus, inside the Tesla valve, a large area and uniform graphene preparation can be achieved without the use of low-pressure devices, reducing the cost and shortening the production cycle of graphene prepared using the CVD method. (5) This provides a theoretical reference to improve the realization of graphene surface densification for future research on large-area, high-quality, and high-density graphene, especially the macroscopic numerical simulation of graphene and other related materials. Meanwhile, a new method for the synthesis of graphene using other special structures by chemical vapor deposition and the kinetics of graphene growth in the special structure of the Tesla valve using the CVD method will be the focus of our next study.

Author Contributions

Conceptualization, N.Y.; methodology, B.Y. and D.Z.; software, F.C., X.Y. and B.K.; validation, B.Y., F.C., X.Y. and B.K.; formal analysis, B.Y. and F.C.; resources, Y.H. and G.X.; data curation, D.Z., F.C. and B.Y.; writing—original draft preparation, B.Y. and N.Y.; writing—review and editing, B.Y.; supervision, Y.H. and G.X.; project administration, Y.H.; funding acquisition, B.Y. All authors have read and agreed to the published version of the manuscript.

Funding

This work was financially supported by the National Natural Science Foundation of China (Nos. 52062005 and 52074141), the Key Science and Technology Support Project of China (No. [2021]326), Science and Technology Foundation of China (Nos. [2018]1173 and [2020]1Y163), National Natural Science Foundation of China (No. 21861012), Natural Science Foundation of Education Commission (No. 2018148), Science & Technology Commission (Nos. 20201Z005 and 20191157), Science and Technology Foundation of China ([2019]1158 and ZK [2021] Common 051, and Provincial Teaching Project ([ky 2018] 016).

Institutional Review Board Statement

Not applicable.

Informed Consent Statement

Informed consent was obtained from all the subjects involved in the study.

Data Availability Statement

No new data were created or analyzed in this study. Data sharing was not applicable in this study.

Conflicts of Interest

The authors declare no conflict of interest.

References

  1. Junge, P.; Greinacher, M.; Kober, D.; Stargardt, P.; Rupprecht, C. Metastable Phase Formation, Microstructure, and Dielectric Properties in Plasma-Sprayed Alumina Ceramic Coatings. Coatings 2022, 12, 1847. [Google Scholar] [CrossRef]
  2. Truong, T.Q.; Nguyen, N.T. Simulation and Optimization of Tesla Valves. In Proceedings of the Nanotech—Nanotechnology Conference and Trade Show, San Francisco, CA, USA, 23–28 February 2003; Volume 181, p. 178. [Google Scholar]
  3. Zhang, S.; Winoto, S.H.; Low, H.T. Performance Simulations of Tesla Microfluidic Valves. In Proceedings of the 2007 First International Conference on Integration and Commercialization of Micro and Nanosystems, Sanya, China, 10–13 January 2007. [Google Scholar] [CrossRef]
  4. Thompson, S.M.; Paudel, B.J.; Jamal, T.; Walters, D.K. Numerical Investigation of Multistaged Tesla Valves. J. Fluids Eng. 2014, 136, 081102. [Google Scholar] [CrossRef]
  5. Gan, L.; Sheng-Hong, H.; Zhenyu, L. Gas-Phase Dynamics in Graphene Growth by Chemical Vapour Deposition. Phys. Chem. Chem. Phys. 2015, 17, 22832–22836. [Google Scholar]
  6. Qian, J.-Y.; Chen, M.; Liu, X.; Jin, Z. A Numerical Investigation of the Flow of Nanofluids Through a Micro Tesla Valve. J. Zhejiang Univ. Sci. A 2019, 20, 50–60. [Google Scholar] [CrossRef]
  7. Bazilah, F.F.; Ismail, E.; Bakar, S.N.S.A.; Ismail, A.F.; Mohamed, M.A.; Din, M.F.M.; Illias, S.; Ani, M.H. The Role of Gas-Phase Dynamics in Interfacial Phenomena during Few-Layer Graphene Growth Through Atmospheric Pressure Chemical Vapour Deposition. Phys. Chem. Chem. Phys. 2020, 22, 3481–3489. [Google Scholar]
  8. Pan, M.; Wang, C.; Li, H.-F.; Xie, N.; Wu, P.; Wang, X.-D.; Zeng, Z.; Deng, S.; Dai, G.-P. Growth of U-shaped Graphene Domains on Copper Foil by Chemical Vapor Deposition. Materials 2019, 12, 1887. [Google Scholar] [CrossRef] [PubMed] [Green Version]
  9. Stith, D. The Tesla Valve—A Fluidic Diode. Phys. Teach. 2019, 57, 201. [Google Scholar] [CrossRef]
  10. Shi, Y.; Wang, Y.; Ren, Y.; Sang, Z. Effects of the Oxide Layer with Different Thicknesses on Copper Substrate on Depressing Graphene Nucleation by Low Pressure Chemical Vapor Deposition. J. Cryst. Growth 2020, 541, 125682. [Google Scholar] [CrossRef]
  11. Bale, C.W.; Bélisle, E.; Chartrand, P.; Decterov, S.A.; Eriksson, G.; Hack, K.; Jung, I.H.; Kang, Y.B.; Melançon, J.; Pelton, A.D. FactSage thermochemical software and databases—Recent developments. Calphad 2009, 33, 295–311. [Google Scholar] [CrossRef]
  12. Nie, Z.; Palghat, A. Ramachandran and Yanqing Hou. Optimization of effective parameters on Siemens reactor to achieve potential maximum deposition radius: An energy consumption analysis and numerical simulation. Int. J. Heat Mass Transf. 2018, 117, 1083–1098. [Google Scholar] [CrossRef]
  13. Al-Hilfi, S.H.; Derby, B.; Martin, P.A.; Whitehead, J.C. Chemical Vapour Deposition of Graphene on Copper-Nickel Alloys: The Simulation of a Thermodynamic and Kinetic Approach. Nanoscale 2020, 12, 15283–15294. [Google Scholar] [CrossRef] [PubMed]
  14. West, N. Tesla’s Valvular Conduit. Fluid Power J. 2013, 20, 18–19. [Google Scholar]
  15. Jan, R.; Shadi, A.; David, N. An Experimental Investigation of Flow Phenomena in a Multi-stage Micro Tesla Valve. J. Fluids Eng. 2021, 143, 111205. [Google Scholar]
  16. Fauzi, F.B.; Ismail, M.E.; Hanafi, A.; Bakar, S.N.S.A.; Mohamed, M.A.; Majlis, B.Y.; Din, M.F.M.; Abid, M.A.A.M. A critical review of the effects of fluid dynamics on graphene growth in atmospheric pressure chemical vapor deposition. J. Mater. Res. 2018, 33, 1088–1108. [Google Scholar] [CrossRef]
  17. Yunhao, B.; Huanguang, W. Numerical Study on Flow and Heat Transfer Characteristics of a Novel Tesla Valve with Improved Evaluation Method. Int. J. Heat Mass Transf. 2022, 187, 122540. [Google Scholar] [CrossRef]
  18. Mishra, P.; Verma, N. A CFD Study on a Vertical Chemical Vapor Deposition Reactor for Growing Carbon Nanofibers. Chem. Eng. Res. Des. 2012, 90, 2293–2301. [Google Scholar] [CrossRef]
  19. Machac, P.; Cichon, S.; Lapcak, L.; Fekete, L. Graphene Prepared by Chemical Vapour Deposition Process. Graphene Technol. 2020, 5, 9–17. [Google Scholar] [CrossRef]
  20. Goncharov, O.; Sapegina, I.; Faizullin, R.; Baldaev, L. Tantalum chemical vapour deposition on steel and tungsten substrates in the TaBr 5-Cd-He system. Surf. Coat Technol. 2019, 377, 124893. [Google Scholar] [CrossRef]
  21. Son, M.; Ham, M.H. Low-Temperature Synthesis of Graphene by Chemical Vapor Deposition and Its Applications. Flatchem 2017, 5, 40–49. [Google Scholar] [CrossRef]
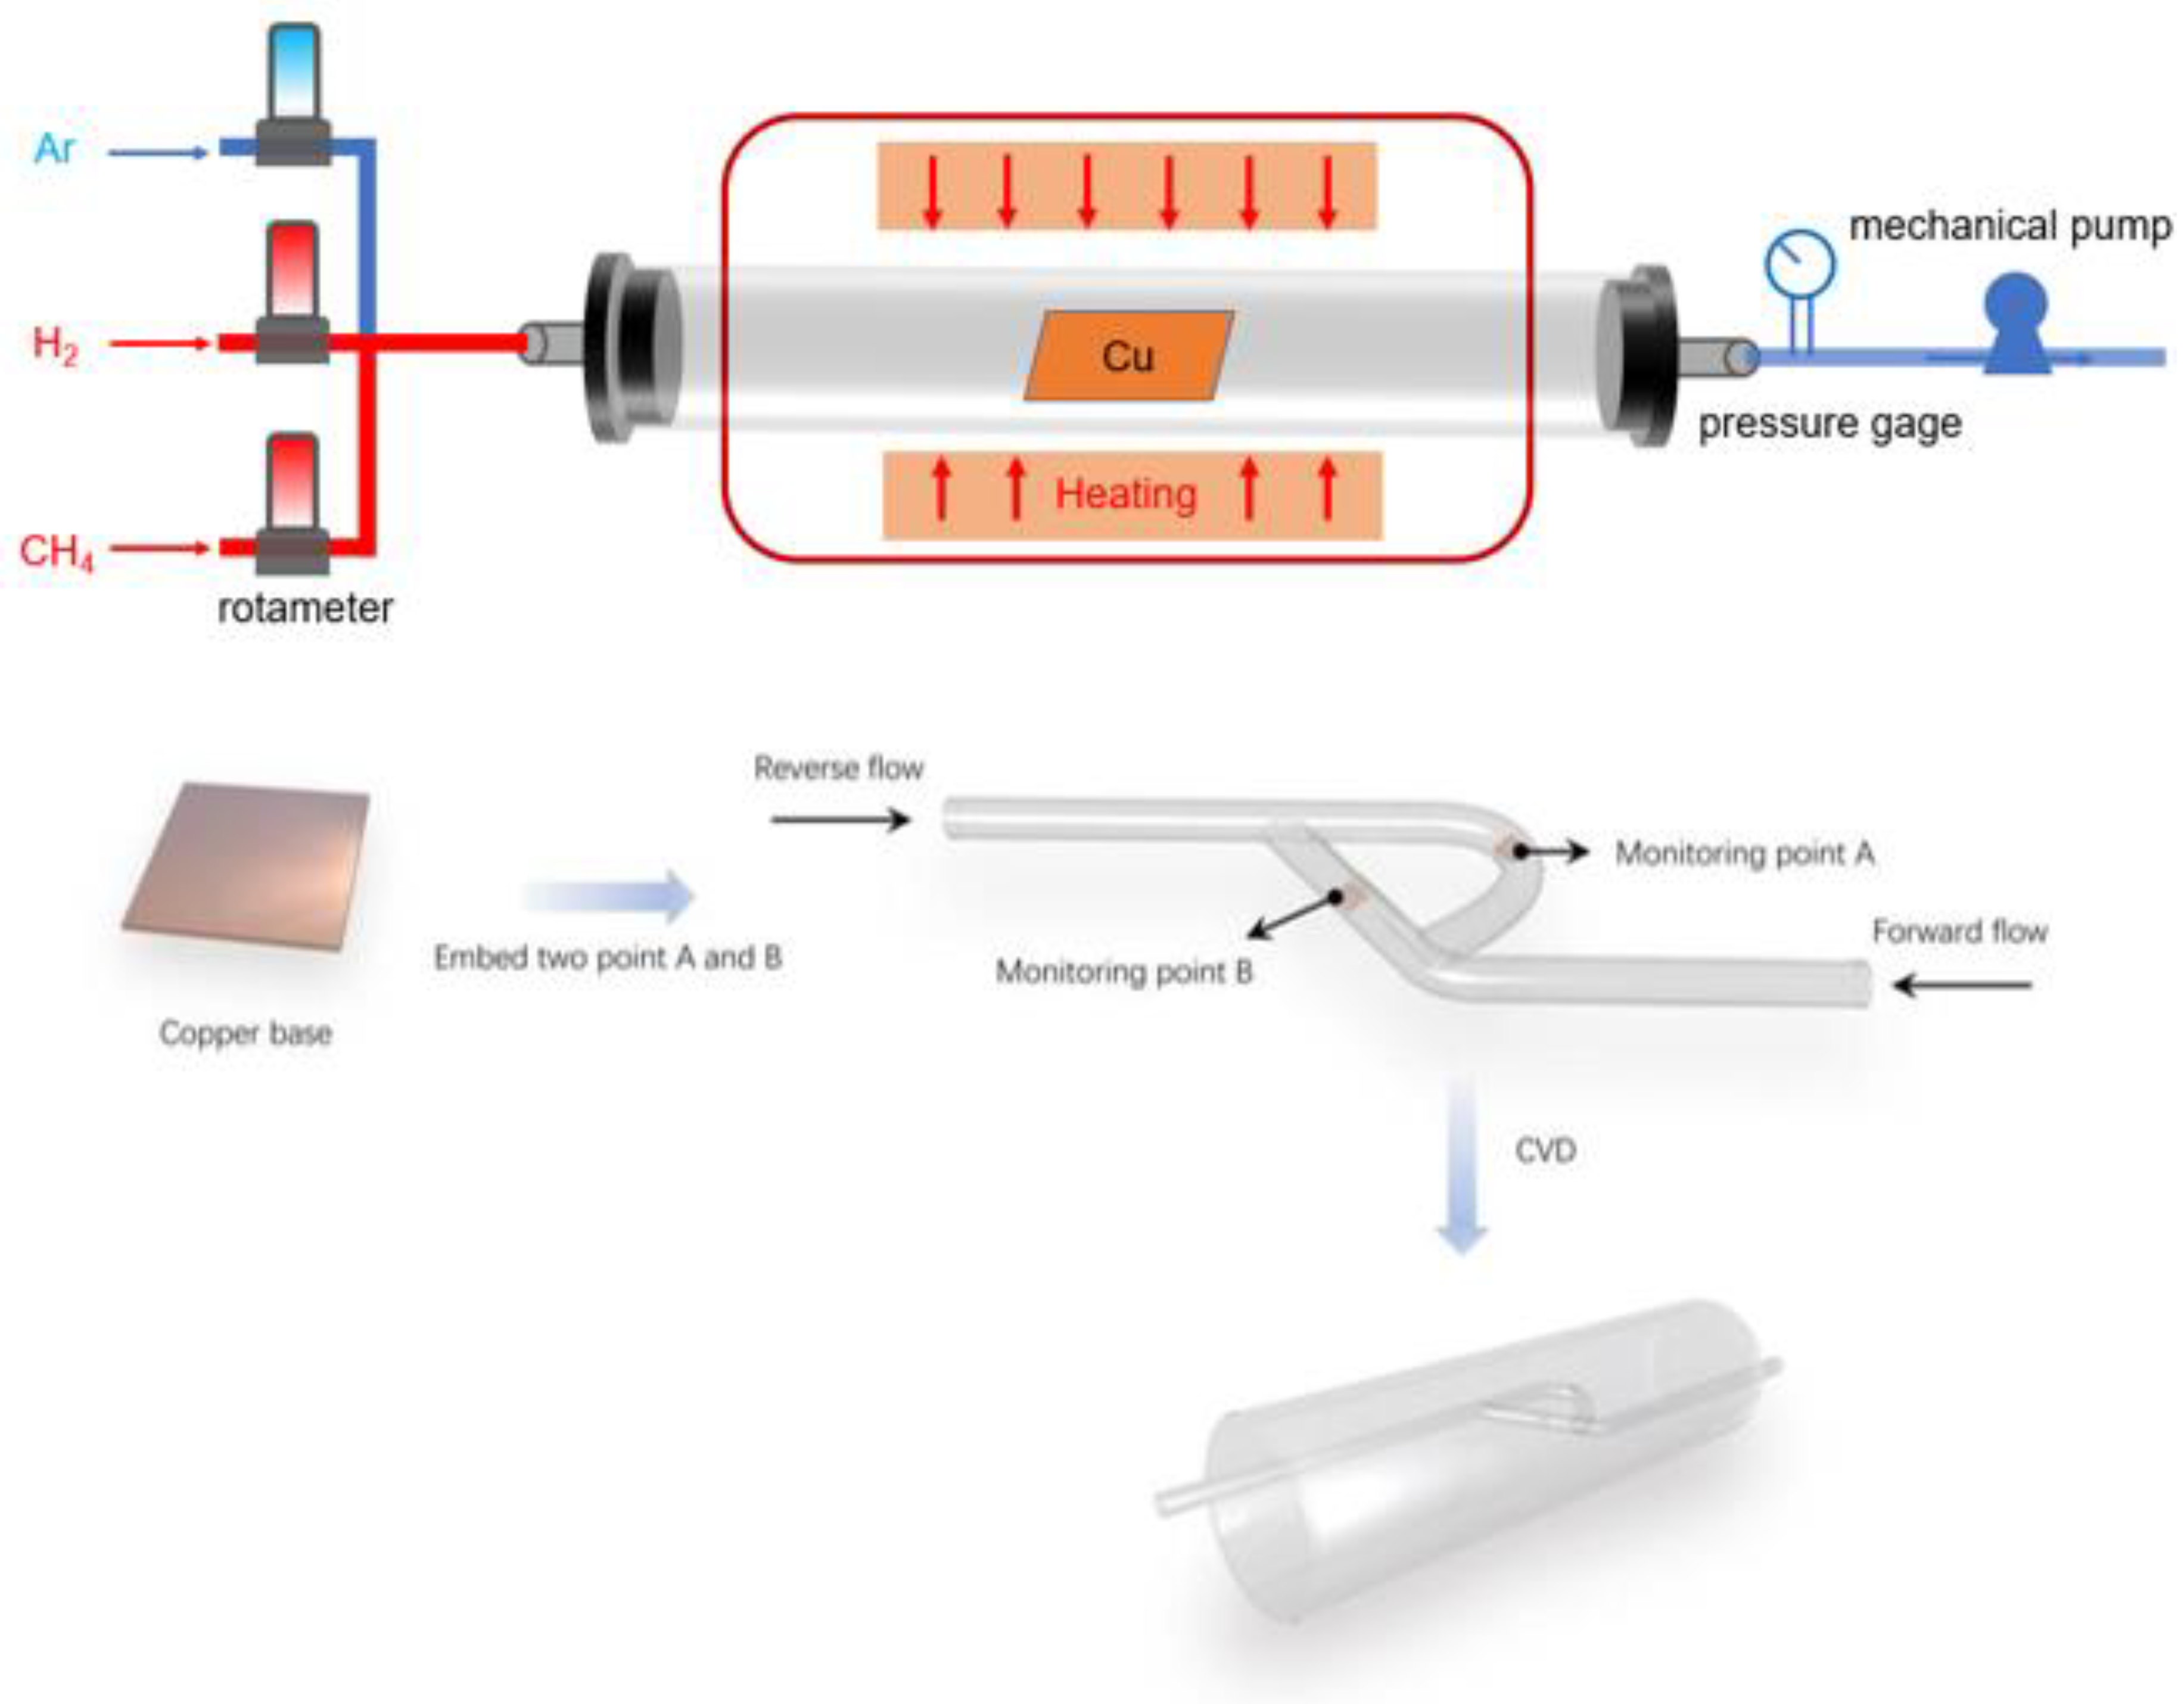
Figure 1. Schematic diagram of a CVD grown graphene system with Tesla valve structure.
Coatings 13 00564 g001
Figure 2. (a) 3D geometric model of a T45-R type Tesla valve and (b) simplified 2D micro-scale T45-R Tesla valve geometry used in this article (unit: μm). In the figure (b) Point A and B are selected deposition points.
Coatings 13 00564 g002
Figure 3. Molar reaction enthalpy of methane decomposition at different temperatures.
Coatings 13 00564 g003
Figure 4. Relationship between Gibbs free energy and temperature.
Coatings 13 00564 g004
Figure 5. (a) Forward and (b) reverse flow of the Tesla valve (unit: m/s).
Coatings 13 00564 g005
Figure 6. Graph of carbon deposition rate versus gas flow.
Coatings 13 00564 g006
Figure 7. Pressure distribution cloud map.
Coatings 13 00564 g007
Figure 8. Atmospheric and low pressure drop with different temperatures in forward (a1,b1) and reverse (a2,b2) flow: (a) AP (101,325 Pa) and (b) LP (660 Pa).
Coatings 13 00564 g008
Figure 9. Contours for the graphene surface deposition rate with temperatures at monitoring points A and B: (a) Monitoring point A and (b) monitoring point B.
Coatings 13 00564 g009
Figure 10. Atmospheric and low pressure surface deposition rate of c<s> with different temperatures in forward and reverse flow: (a) AP (101,325 Pa); (b) LP (660 Pa).
Coatings 13 00564 g010
Figure 11. Atmospheric and low surface deposition rate of c<s> with different temperature in reverse flow: (a) AP deposition A; (b) AP deposition B; (c) LP deposition A; (d) LP deposition B.
Coatings 13 00564 g011
Figure 12. Atmospheric and low surface deposition rate of c<s> with different temperature in reverse flow: (a) deposition A; (b) deposition B.
Coatings 13 00564 g012
Figure 13. Change in diodicity with temperature.
Coatings 13 00564 g013
Figure 14. Scanning electron microscope (SEM) image of graphene on copper: (a,c,e) without the Tesla valve structure; (b,d,f) with the Tesla valve structure.
Coatings 13 00564 g014
Figure 15. t = 270 s Raman spectrum of graphene: (a) without the Tesla valve structure; (b) with the Tesla valve structure.
Coatings 13 00564 g015
Figure 16. (a) Time = 180 s with the Tesla valve structure; time = 270 s Atomic Force Microscopy (AFM) topography of copper foil (b) without the Tesla valve structure and (c) with the Tesla valve structure. The blue arrows represents different layers after AFM characterization.
Coatings 13 00564 g016aCoatings 13 00564 g016b
Table 1. Governing equations.
Equation NameEquationsNo.
Continuity equation · ( ρ u ) = 0 (2)
Momentum equation · ( ρ u u ) = · ( μ e f f u ) P + F s (3)
Energy equation · ( ρ h u ) = · ( λ e f f T j h j J j ) + S h (4)
Species equation · ( ρ u m j ) = · J j (5)
Table 2. The physical properties of various materials.
Physical ParameterCH4H2ArC<S>
Density (kg/m3)0.66790.081891.62282000
Cp (j/kg·k)222214,283520.641220
Thermal conductance (w/m·k)0.03320.16720.0158
Viscosity (kg/m·s)1.087 × 10−58.411 × 10−62.215 × 10⁻⁵
ΔHm (j/kmol)−7.489518 × 1070−3117.71−101.268
ΔSm (j/kmol·k)186,040.1130,579.1154,719.35731.747
Range of temperature: 1230~1330 K; inlet velocity: 2 mL/min.
Table 3. Comparison test setup.
Normal CVD Straight Pipe without Tesla Valve
NumberT (K)CH4 (mL/min)H2 (mL/min)Ar (mL/min)Growth Time (s)
11310102510090, 180, 270
Add the CVD Tube of the Tesla Valve
NumberT (K)CH4 (mL/min)H2 (mL/min)Ar (mL/min)Growth Time(s)
213101.63.915.590, 180, 270
Disclaimer/Publisher’s Note: The statements, opinions and data contained in all publications are solely those of the individual author(s) and contributor(s) and not of MDPI and/or the editor(s). MDPI and/or the editor(s) disclaim responsibility for any injury to people or property resulting from any ideas, methods, instructions or products referred to in the content.