Article

Numerical Simulation of a Simplified Reaction Model for the Growth of Graphene via Chemical Vapor Deposition in Vertical Rotating Disk Reactor

1
Faculty of Metallurgy and Energy Engineering, Kunming University of Science and Technology, Kunming 650093, China
2
School of Materials and Architectural Engineering, Guizhou Normal University, Guiyang 550014, China
3
Kunming Metallurgical Research Institute, Kunming 650093, China
*
Authors to whom correspondence should be addressed.
These authors contributed equally to this work.
Coatings 2023, 13(7), 1184; https://doi.org/10.3390/coatings13071184
Submission received: 13 June 2023 / Revised: 27 June 2023 / Accepted: 29 June 2023 / Published: 30 June 2023
(This article belongs to the Special Issue Chemical Vapor Deposition (CVD) of Coatings and Films)

Abstract

:
The process of graphene growth by CVD involves a series of complex gas-phase surface chemical reactions, which generally go through three processes, including gas phase decomposition, surface chemical reaction, and gas phase diffusion. The complexity of the CVD process for growing graphene is that it involves not only chemical reactions but also mass, momentum, and energy transfer. To solve these problems, the method of numerical simulation combined with the reactor structure optimization model provides a good tool for industrial production and theoretical research to explore the influencing factors of the CVD growth of graphene. The objective of this study was to establish a simplified reaction model for the growth of graphene by chemical vapor deposition(CVD) in a vertical rotating disk reactor (VRD). From a macroscopic modeling perspective, computational fluid dynamics (CFD) was used to investigate the conditions for the growth of graphene by chemical vapor deposition in a high-speed rotating vertical disk reactor on a copper substrate surface at atmospheric pressure (101,325 Pa). The effects of gas temperature, air inlet velocity, base rotation speed, and material ratio on the surface deposition rate of graphene in a VRD reactor were studied, and the technological conditions for the preparation of graphene via the CVD method in a VRD reactor based on a special structure were explored. Compared with existing models, the numerical results showed the following: the ideal growth conditions of graphene prepared using a CVD method in a VRD reactor involve a growth temperature of 1310 K, an intake speed of 470 mL/min, a base speed of 300 rpm, and an H2 flow rate of 75 sccm; thus, more uniform graphene with a better surface density and higher quality can be obtained. The effect of the carbon surface deposition rate on the growth behavior of graphene was studied using molecular dynamics (MD) from a microscopic perspective. The simulation showed that the graphene surface deposition rate could control the nucleation density of graphene. The combination of macro- and microsimulation methods was used to provide a theoretical reference for the production of graphene.

1. Introduction

At present, the main preparation methods of graphene include the micromechanical stripping method [1], redox process method [2], silicon carbide epitaxial growth method [3], chemical vapor deposition method [4,5], segregation growth method [6], and bottom-up synthesis method [7]. Among them, the chemical vapor deposition (CVD) method has the advantages of high quality, large area, controllable layer number, good repeatability, and low cost, which is expected to achieve large-scale industrial preparation of graphene and has obtained the continuous attention and exploration of scientific research workers. The CVD process of graphene growth involves a series of complex gas-phase surface chemical reactions, generally through three processes [8,9]: gas phase decomposition, surface chemical reaction, and gas phase diffusion. The complexity of graphene growth by CVD is that it involves not only chemical reactions but also mass, momentum, and energy transfer. In particular, it is rare to study the growth of graphene by combining macroscopic and microscopic simulations.
To solve these problems, the method of numerical simulation combined with a trial-and-error model provides a good tool for industrial production and theoretical research to explore the factors influencing the growth of graphene by CVD. In these studies, most of the simulation and chemical reaction models were carried out based on horizontal reactor structures. Vertical rotary disk (VRD) reactors have also been used in semiconductor material processing in recent years, according to research reports. By combining experimental and numerical simulation, Habuka et al. studied the silicon epitaxial growth process of a single-wafer high-speed substrate rotation reactor in an SiHCl3–H2 system while considering the transfer phenomenon and surface chemical reactions [10]. The study showed that the epitaxial growth rate of Si in a VRD reactor only depended on the concentration of hydrogen on the surface of the silicon substrate. Mitrovic [11,12] and Kadinski [13] et al. used numerical models to study the process parameters and reactor structure that affect the GaN/InGaN deposition rate and compactness in VRD reactors. Habuka et al. used numerical calculations to study the effect of base surface rotation speeds on gas transport near the base surface and simulated the deposition process of Si in a SiHCl3–H2 system in a single-wafer VRD reactor [14]. Makino developed a simplified reaction model for the deposition of Si from the SiHCl3–H2 gas mixture and investigated the effect of gas flow on the deposition of Si in a VRD reactor [15]. The results showed that when the inlet gas flow is insufficient, the deposition thickness of Si film decreases from the center of the wafer to the periphery, and the effect of the concentration of HCl on the deposition rate of Si is indicated.
The interaction between three-dimensional (3D) gas flow and surface chemical reactions (e.g., graphene deposition on the copper substrate) in VRD reactors has not been studied in detail. It has been reported that various materials with high deposition rates have been grown in vertical rotary reactors with a single-wafer high-speed substrate [16,17,18,19,20,21,22]. However, the use of chemical vapor deposition to grow graphene in VRD reactors has been reported less often. There are relatively few researches on the growth behavior of graphene using the simulation method combining macro and micro to provide theoretical reference for the preparation of graphene.
In this study, a simplified model of a high-speed vertical rotating disk (VRD) reactor was established for the growth of graphene by CVD in a mixed atmosphere of methane as a precursor gas, hydrogen, and argon as a carrier gas, and the effect of gas flow on the deposition of graphene in a vertical rotating disk (VRD) reactor was investigated. At the same time, the coupling effect of computational fluid dynamics (CFD) and chemical reactions were used to investigate the growth conditions of the chemical vapor deposition of graphene in a single-substrate (copper as substrate) high-speed rotating vertical reactor under atmospheric pressure (101,325 Pa). The effects of temperature, air inlet velocity, hydrogen flow rate, and different rotational speeds of the VRD reactor on graphene surface deposition rate were investigated, and macroscopic modeling was used to explore the technological conditions of graphene preparation by the CVD method in a VRD reactor based on a special structure, which is different from the existing straight tube reactor for graphene growth, using the simulation method combining macro and micro to improve the growth density of a CVD reactor based on special structures in the future, and to provide more references for homogeneous graphene.

2. Reaction Model and Numerical Calculation Method

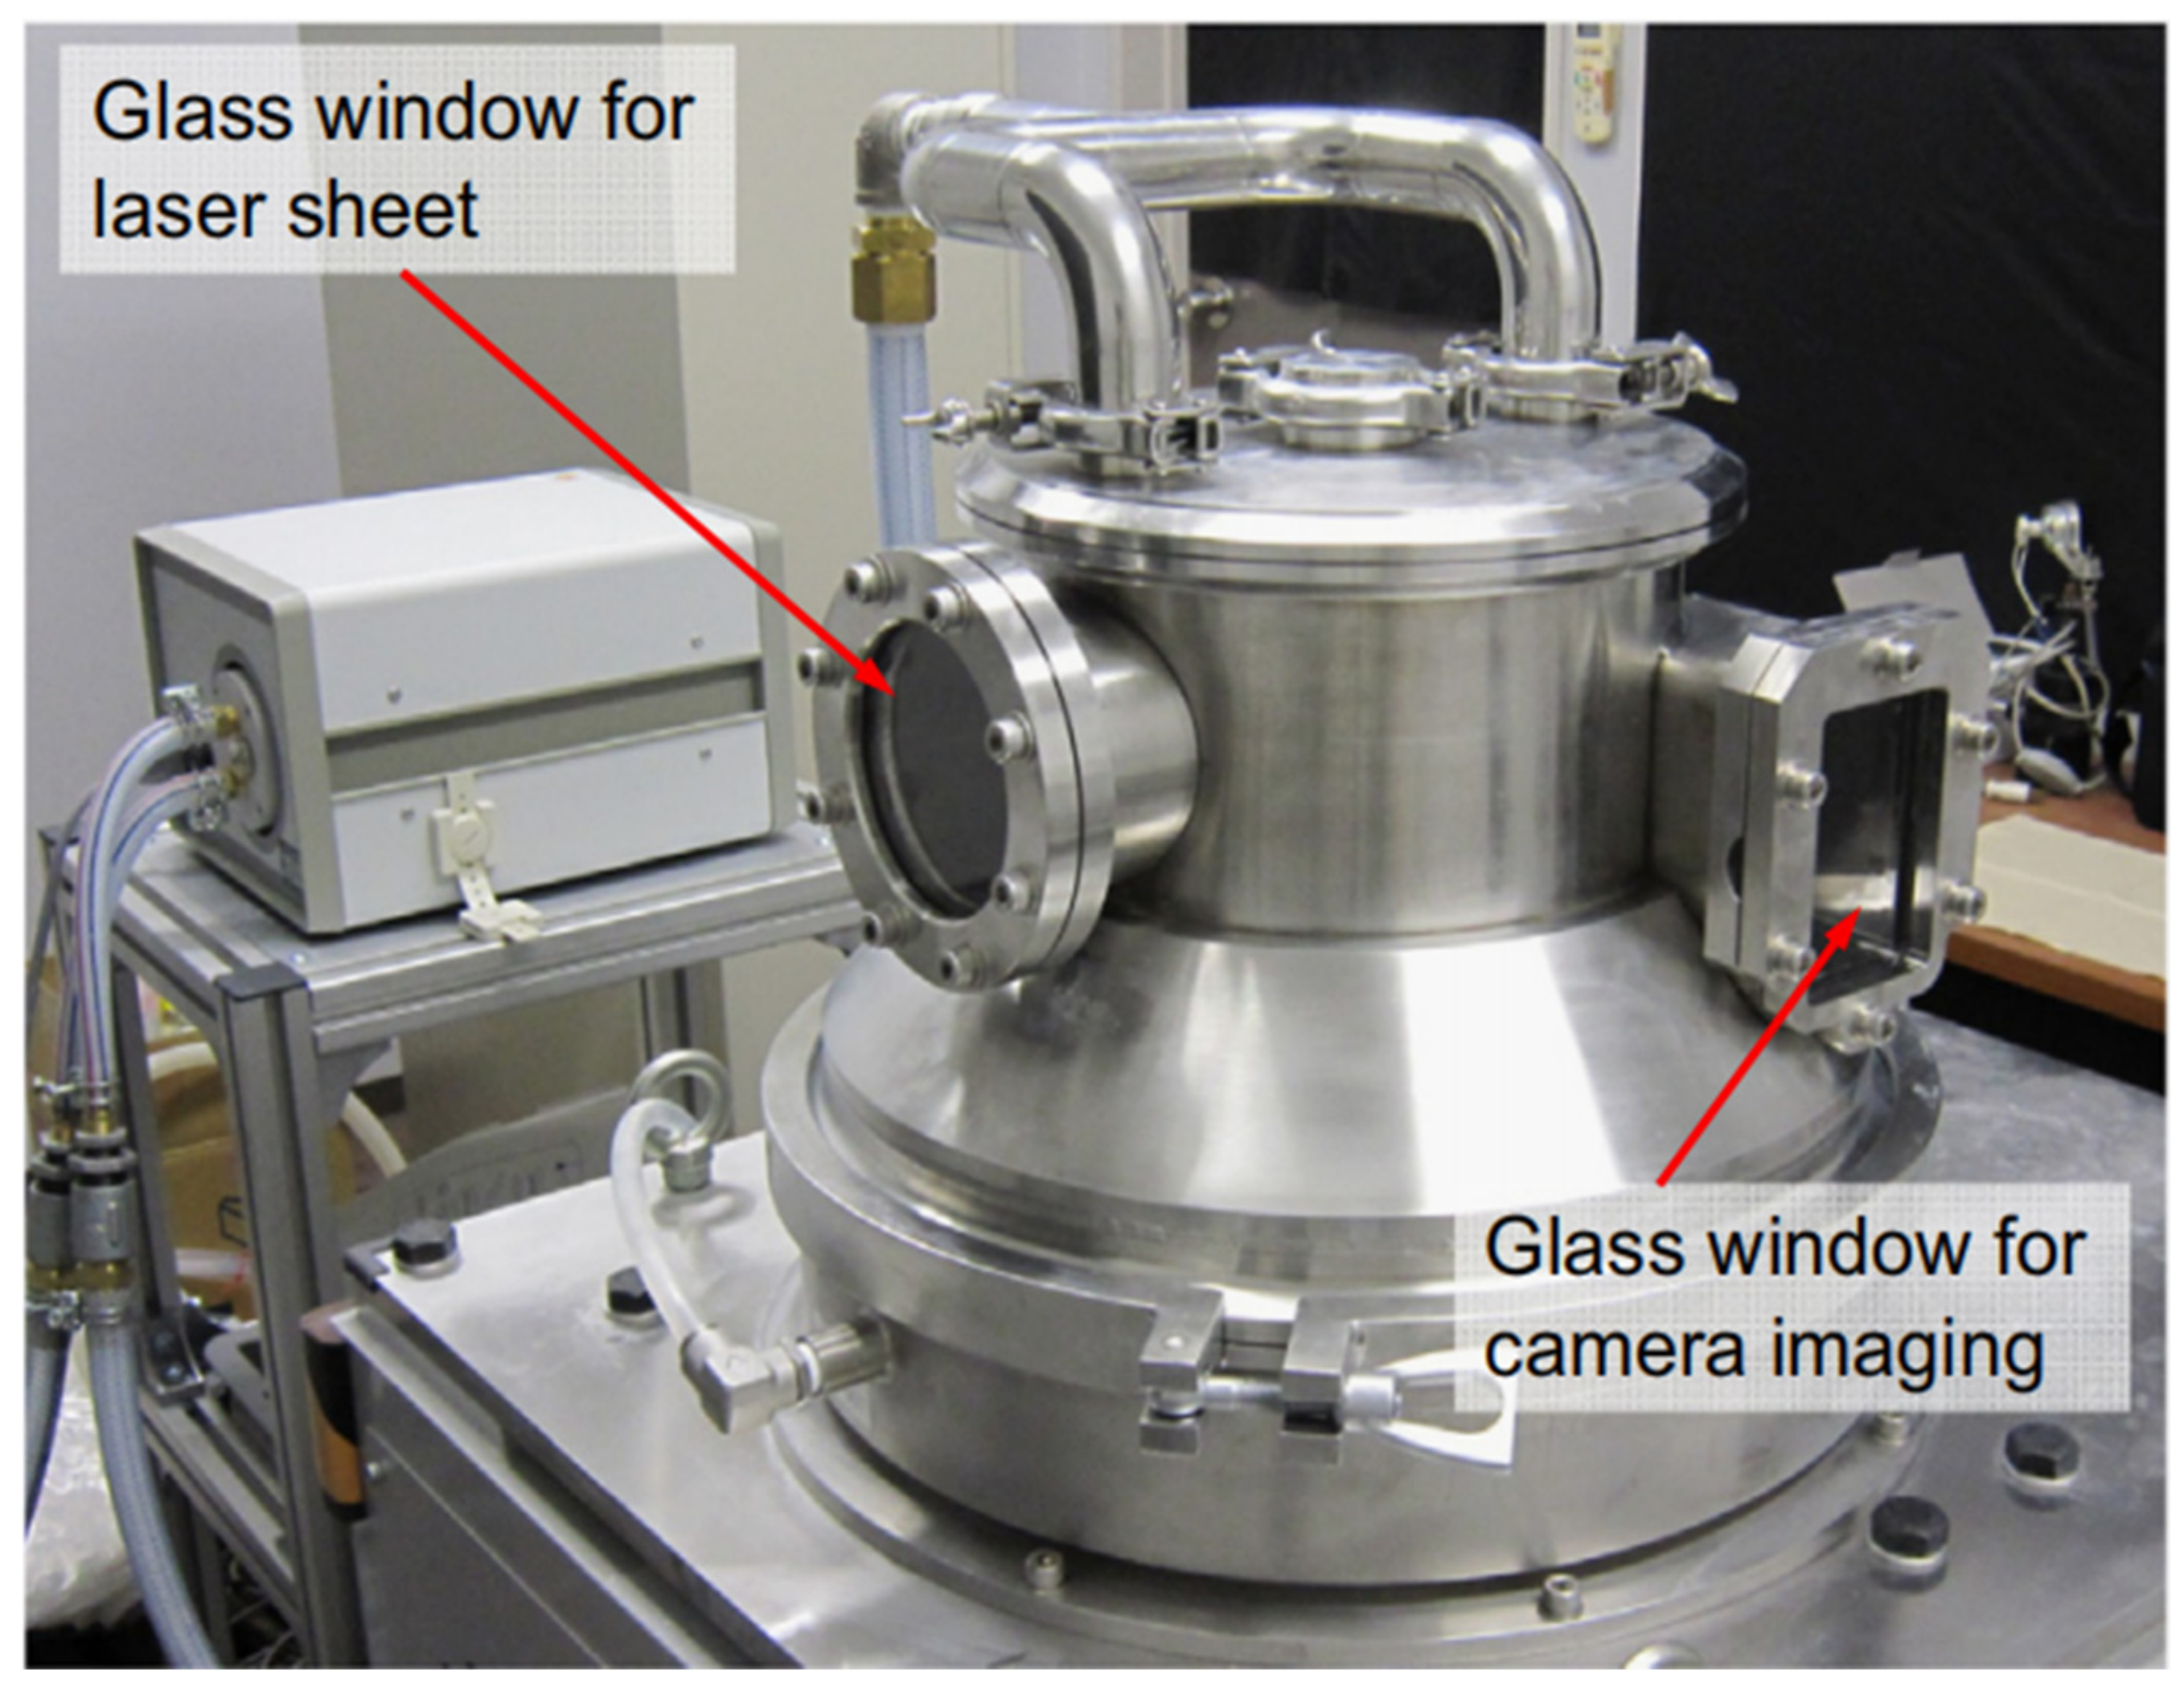
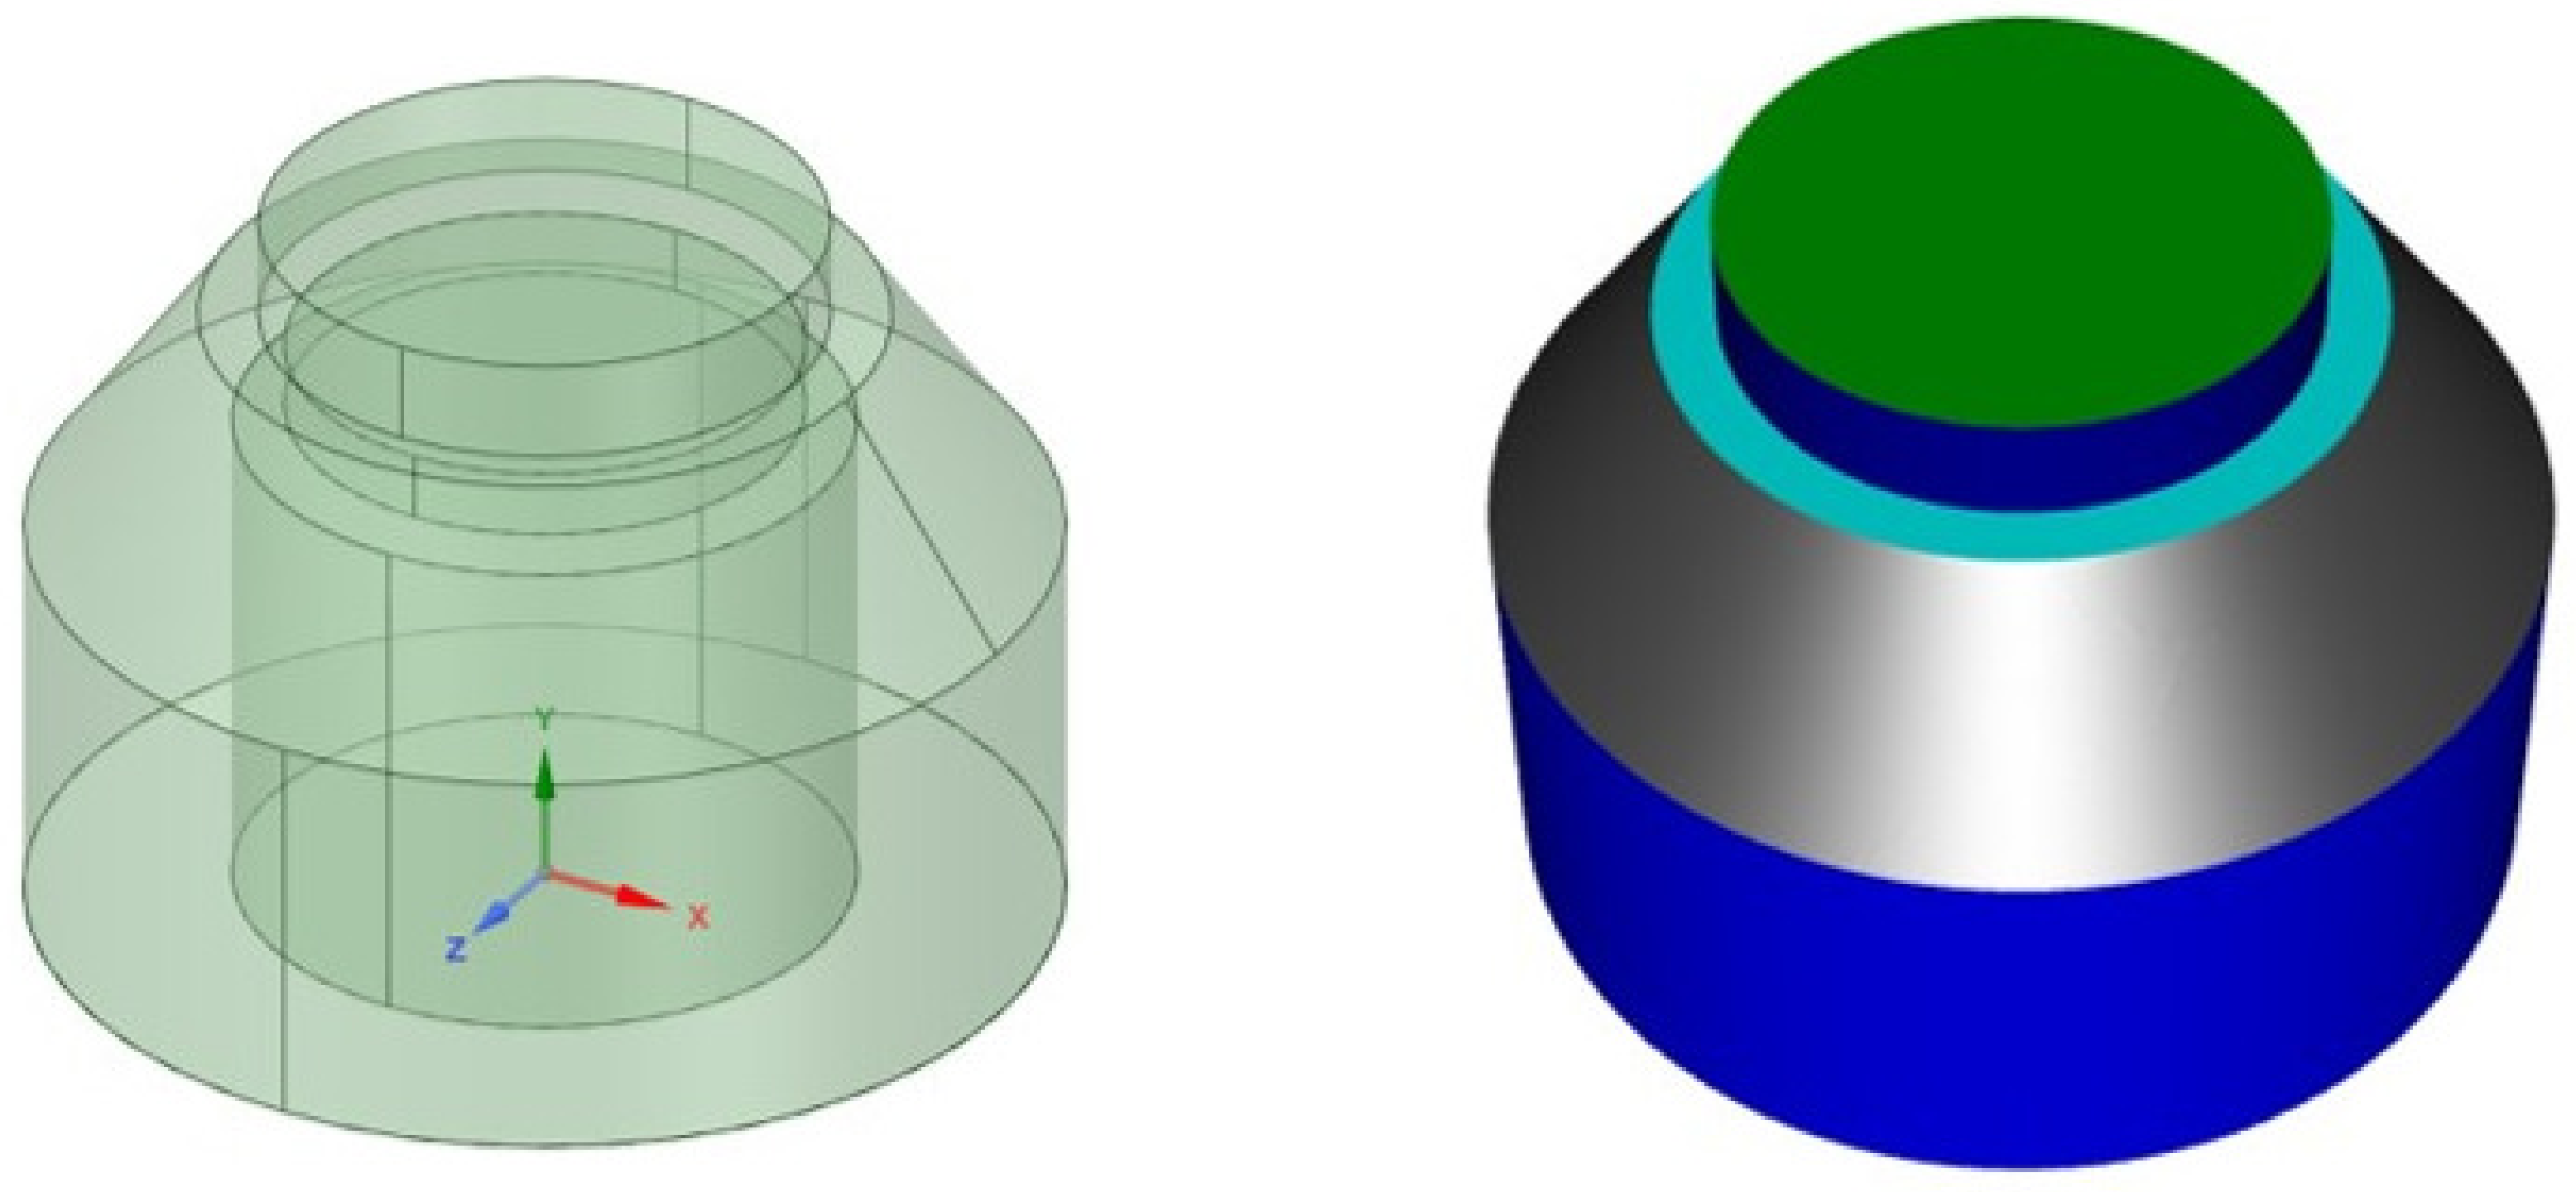
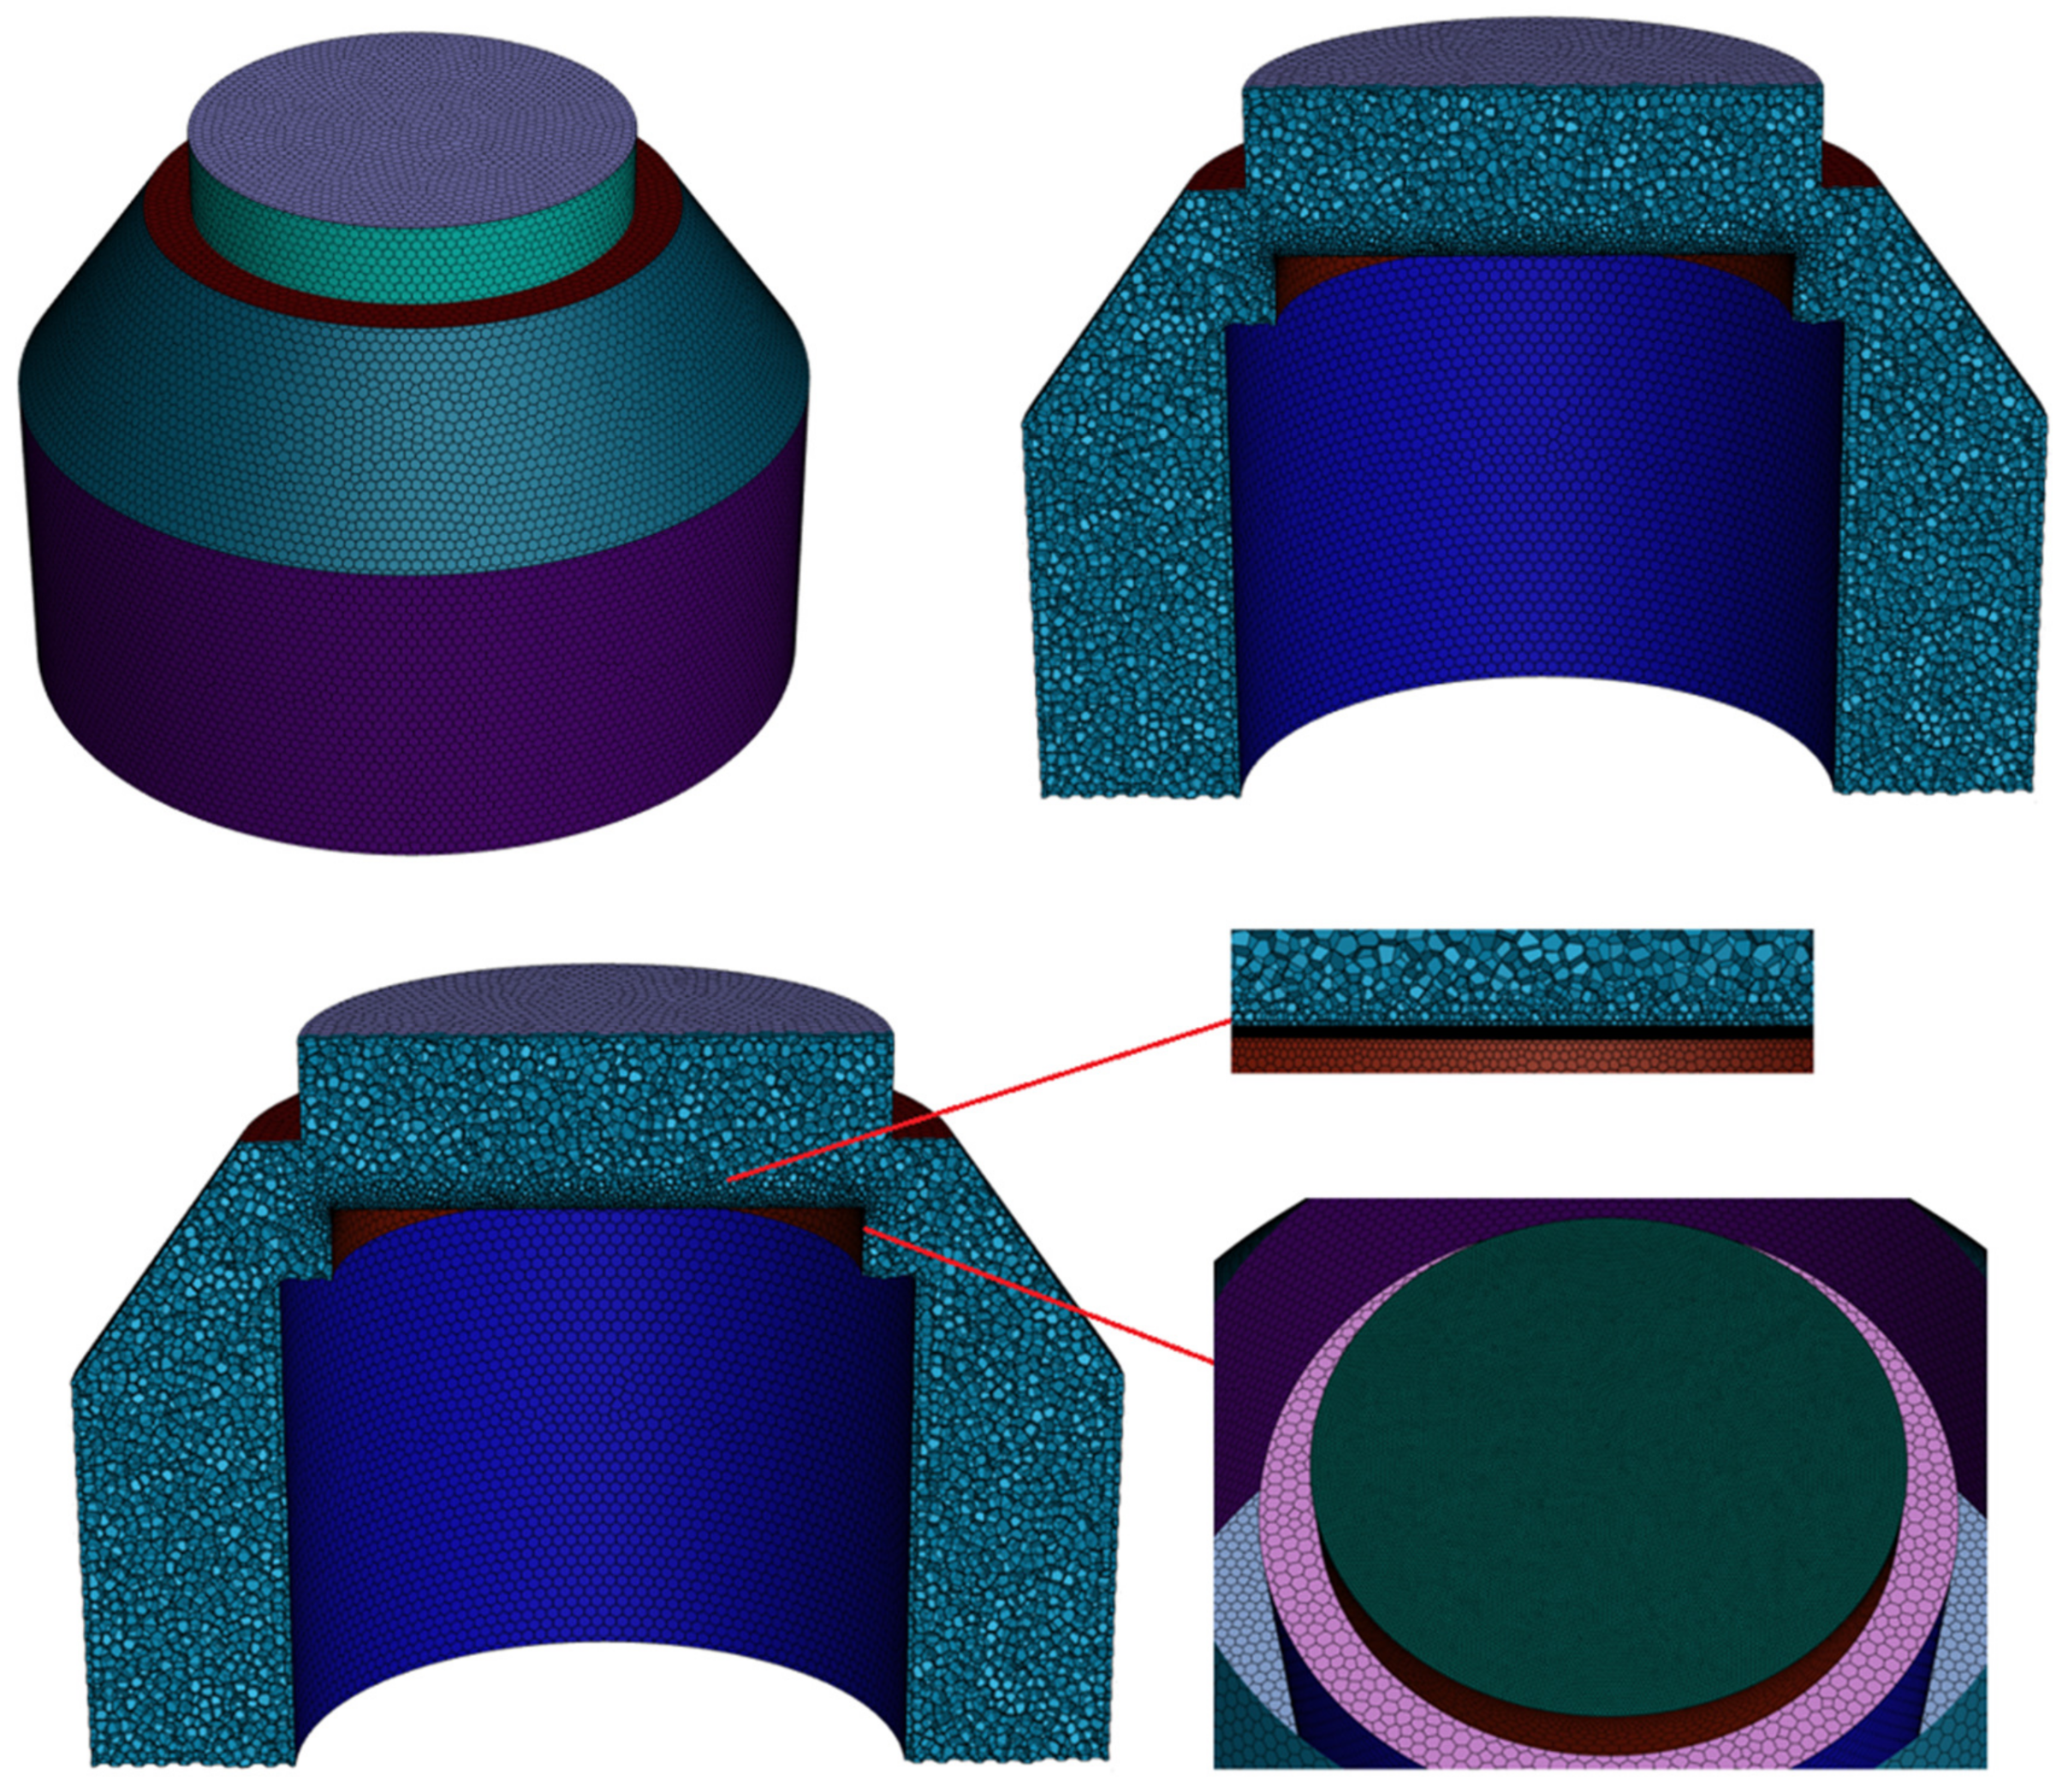
2.1. Reactor Geometric Model and Grid Division

The physical diagram of the atmospheric single-substrate VRD reactor is shown in Figure 1 [15]. A round copper foil with a diameter of 220 mm is placed on a rotating base surface that is heated to between 1230 K and 1330 K and rotates at a speed set between 300 rpm (revolutions per minute, rpm) and 1500 rpm. The inlet temperature is 423 K.
In order to reduce calculation time, the reactor in Figure 1 was simplified. The simplified diagram of the model is shown in Figure 2: in the figure, r is the radial direction, θ is the circumference, and z is the vertical direction. In order to eliminate the influence of mesh size on the precision of numerical simulation, the grid independence check is carried out. The grid profile of the simplified VRD reaction model is shown in Figure 3.

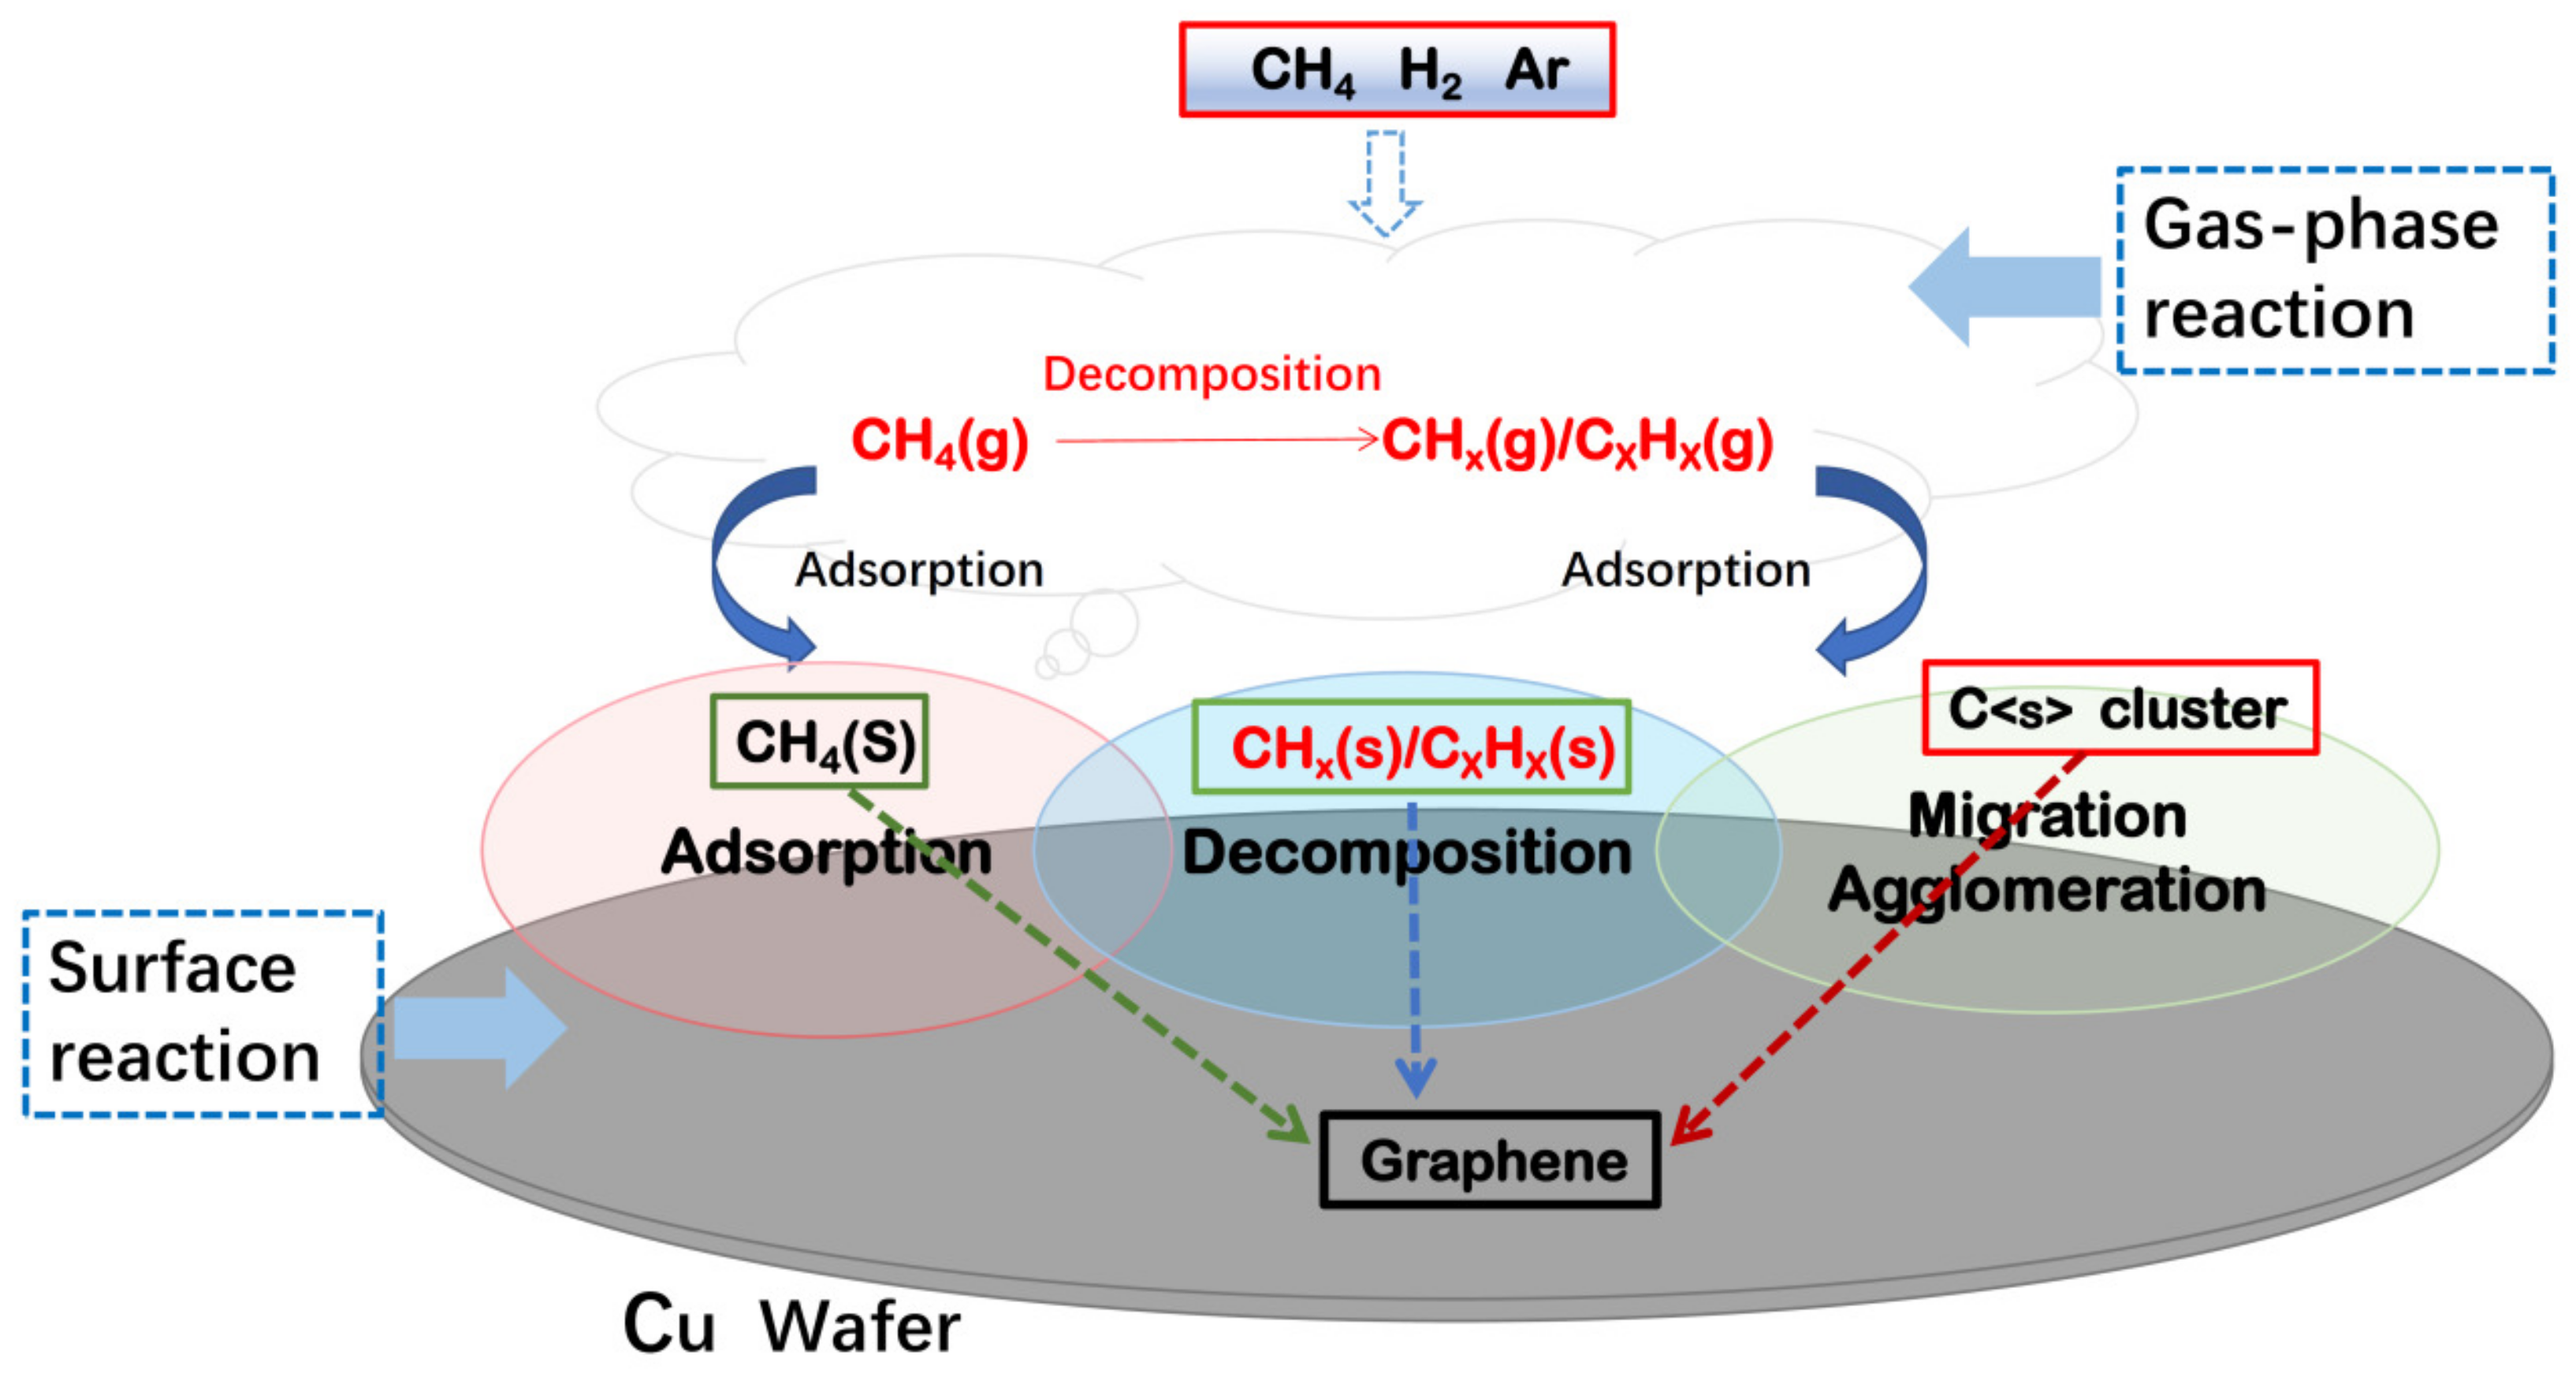
2.2. Chemical Reaction Model

In the macro simulation, the general theory is that the gaseous decomposition of methane is negligible in the whole process because the barrier for the first phase dehydrogenation of methane is about 4.8 eV [9]. So in this research, we did not consider the gas phase decomposition of the shell burning but only studied the chemical reaction of the waste surface and simulated the change of the surface deposition rate on the rotating base surface under atmospheric pressure. We only considered the influence of atmospheric pressure changes in the CVD reaction chamber on the gas flow and surface deposition rate. Therefore, we only studied the total inclusion reaction of carbon deposition on the surface of methane pyrolysis in the macroscopic modeling:
CH4→C<s> + 2H2
The CVD process discussed in this study involves mainly gas component transport and a surface decomposition reaction. The main processes of CVD are as follows: participating in the surface chemical reaction, gas components enter the reaction chamber with the main airflow, and gas components diffuse to the metal substrate surface through the boundary layer. The gas takes part in the chemical reaction on the surface to form the sediment, and then the gas product diffuses into the main gas flow to discharge the reaction chamber. Therefore, there are two main processes limiting the growth of CVD: (1) the transport process of the gas reactants; and (2) the surface chemical reaction process of the gas reaction. Among them, the surface chemical reaction of the gas reaction is the key to the whole CVD process, and the chemical reaction mechanism of graphene prepared by rotating CVD is shown in Figure 4.
The mathematical expression of the amount of methane gas consumed in the chemical reaction on the surface of the copper substrate is the following:
F s u r f a c e       r e a c t i o n = M C H 4 k s C s
The deposition rate of carbon on the reaction substrate of the copper substrate can be expressed as follows:
V D = M C k s C s
where Cs is the molar concentration of the copper substrate surface reactant CH4; MCH4 and MC are the molar masses of methane and carbon, respectively; and ks is the chemical reaction coefficient.
In the formula, the mathematical expression of the chemical reaction coefficient ks is generally given by reaction kinetics theory [23]:
k s = A T β i exp ( E a R T )
where A is the pre-exponential factor (also known as the frequency factor);
Here, A = 1.0 × 10⁹ [9]
βi is the temperature index, which is generally zero (dimensionless); here, βi = 0 [9]
Ea is the activation energy of the surface reaction (J/mol); here, Ea = 2.5086 × 10⁵ J/mol [9]
R is the universal gas constant (J/mol·k).

2.3. Governing Equation of Rotational CVD Reaction Model

Growing graphene by rotating CVD is a complex process involving momentum, heat, material transport, and chemical reactions. Before establishing the model, the following assumptions are made: the gas in the reactor is regarded as an ideal gas, and the reactants and products form dilute solutions in an argon atmosphere; the flows follow the convection–diffusion equation; the heat of diffusion and reaction between materials is negligible; changes in the shape and size of the flowing space can be ignored during the simulation. Considering the aforementioned assumptions, the momentum, energy, and component transport equations can be constructed in the following form [24,25]:
(1) 
Radial momentum equation:
x ( μ V x ) ρ u V x ρ ( V 2 W 2 ) 1 r d p m d r = 0
where the variable x represents the axial coordinates.
(2) 
Axial momentum equation:
x ( μ W x ) ρ u W x 2 ρ V W = 0
where μ is the mixture viscosity, u is the axial velocity, V = v / r , W = w / r , and v and w are the chassis linear velocity and angular velocity, respectively.
(3) 
Energy equation:
x ( λ T x ) ρ c p T t k = 1 k g ( c p k ρ Y k V k c p k T ξ + ω k h k M k ) + S q = 0
where Cp and λ are the heat capacity and thermal conductivity of the mixture, respectively; Mk and hk are the molecular mass and specific enthalpy of substance k, respectively; T is the gas temperature; ω k is the reaction formation rate of substance Yk is the mass fraction of the gas phase; Sq is the source term related to the surface reaction rate, unit: kg/m3/s; and Vk is the diffusion rate of substance, as shown below:
V k = 1 X k M ¯ j = 1 k g M j D k , j d X j d x D k T ρ Y k 1 T T d x
Xk is the mole fraction of substance k; Dk,j is the diffusion coefficient of two substances; and k, j, as in Equation (8) above, is the thermal diffusion coefficient of substance D k T
(4) 
The transport equation components:
ρ Y k V k x ρ u Y k x + M k ω k = 0

2.4. Boundary Conditions and Parameter Settings

The inlet and outlet boundaries were set as the velocity and pressure inlet conditions. All the physical parameters of the materials used in this study were obtained from Li Gan et al. [9] (as shown in Table 1).
According to Governing Equations (5)–(9), take the air intake as the initial condition, and under atmospheric pressure conditions (101,325 Pa), inlet temperature T = 423 K, select the appropriate model. The SIMPLEC numerical algorithm was selected for the calculation method, the second-order upwind format was selected for the discrete format, and the appropriate relaxation factor was adjusted for the setting. The reactor inlet was defined as the mass inlet, the outlet as the pressure outlet, the reference pressure as 0 Pa, and the inner wall was set as the no-slip wall. The whole process does not consider the gas phase decomposition of methane but simply thinks that methane is dehydrogenated on the surface of the metal catalyst to form graphene.

3. Simulation Results and Analysis

The temperature of graphene prepared by chemical vapor deposition on the surface of the copper substrate is about 1273 K, and the melting point of copper is 1353 K. Since the simulation deposition rate varies with temperature, six temperature points of 1230 K, 1250 K, 1270 K, 1290 K, 1310 K, and 1330 K were selected for simulation calculations. Based on the above conditions, in this study, the main research was conducted under atmospheric pressure conditions (101,325 Pa), with methane as a carbon source; the CVD method in the VRD reactor was used to grow graphene on the surface of copper foil by changing the copper substrate reaction surface temperature, air intake speed, substrate speed, with H2 flow rate simulation of the graphene deposition rate. The results are described in the sections that follow.

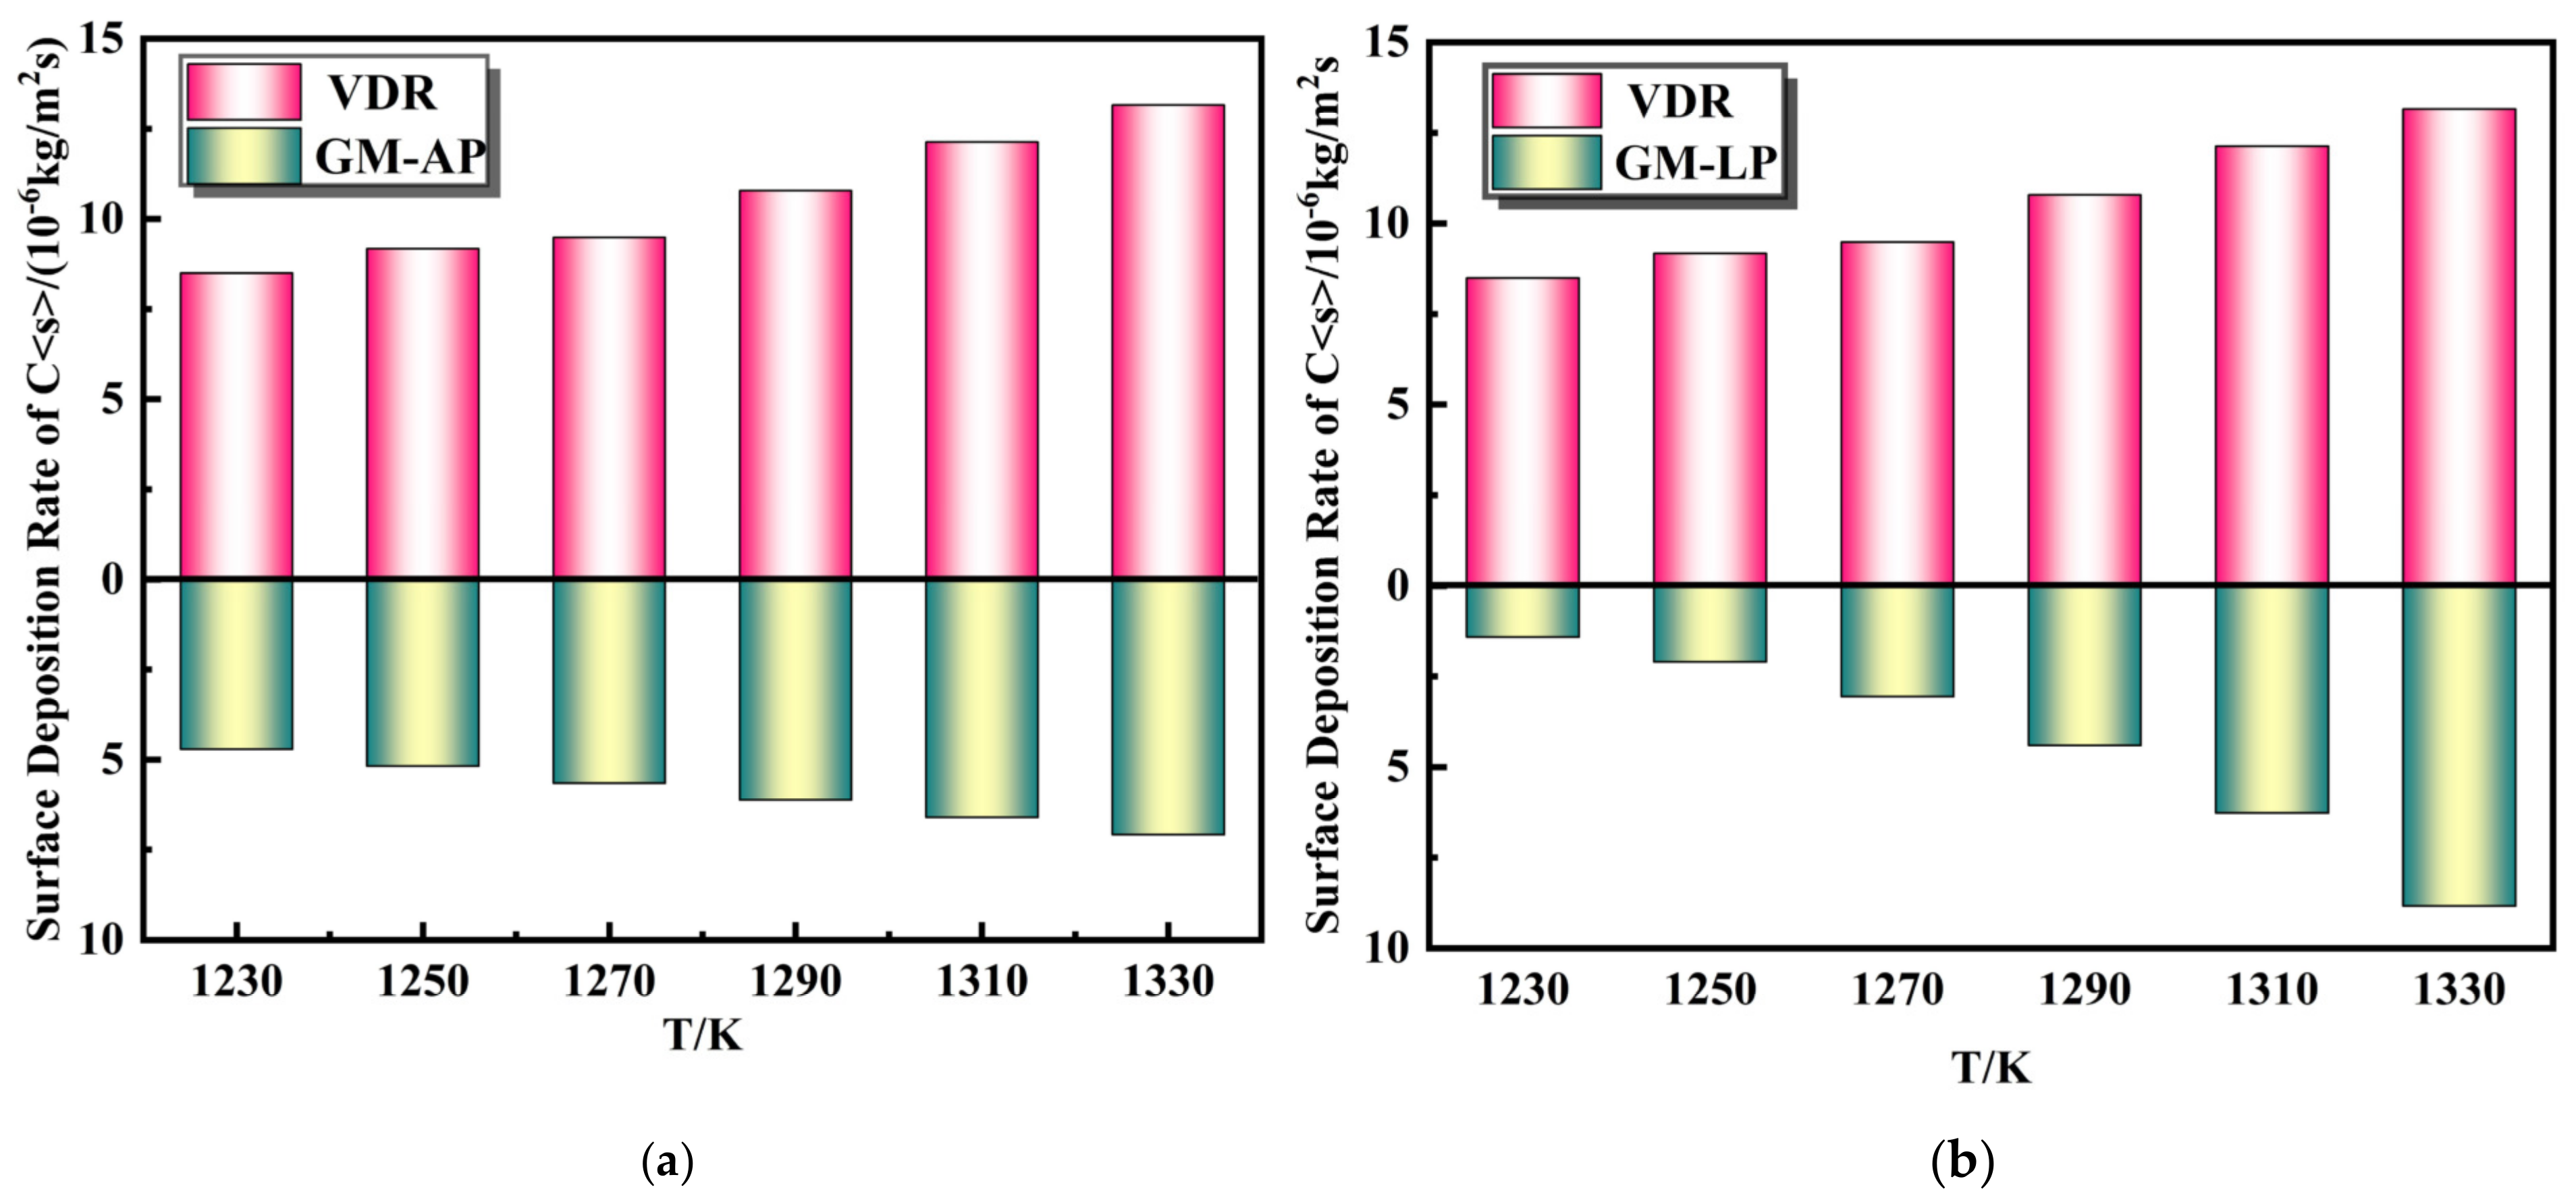
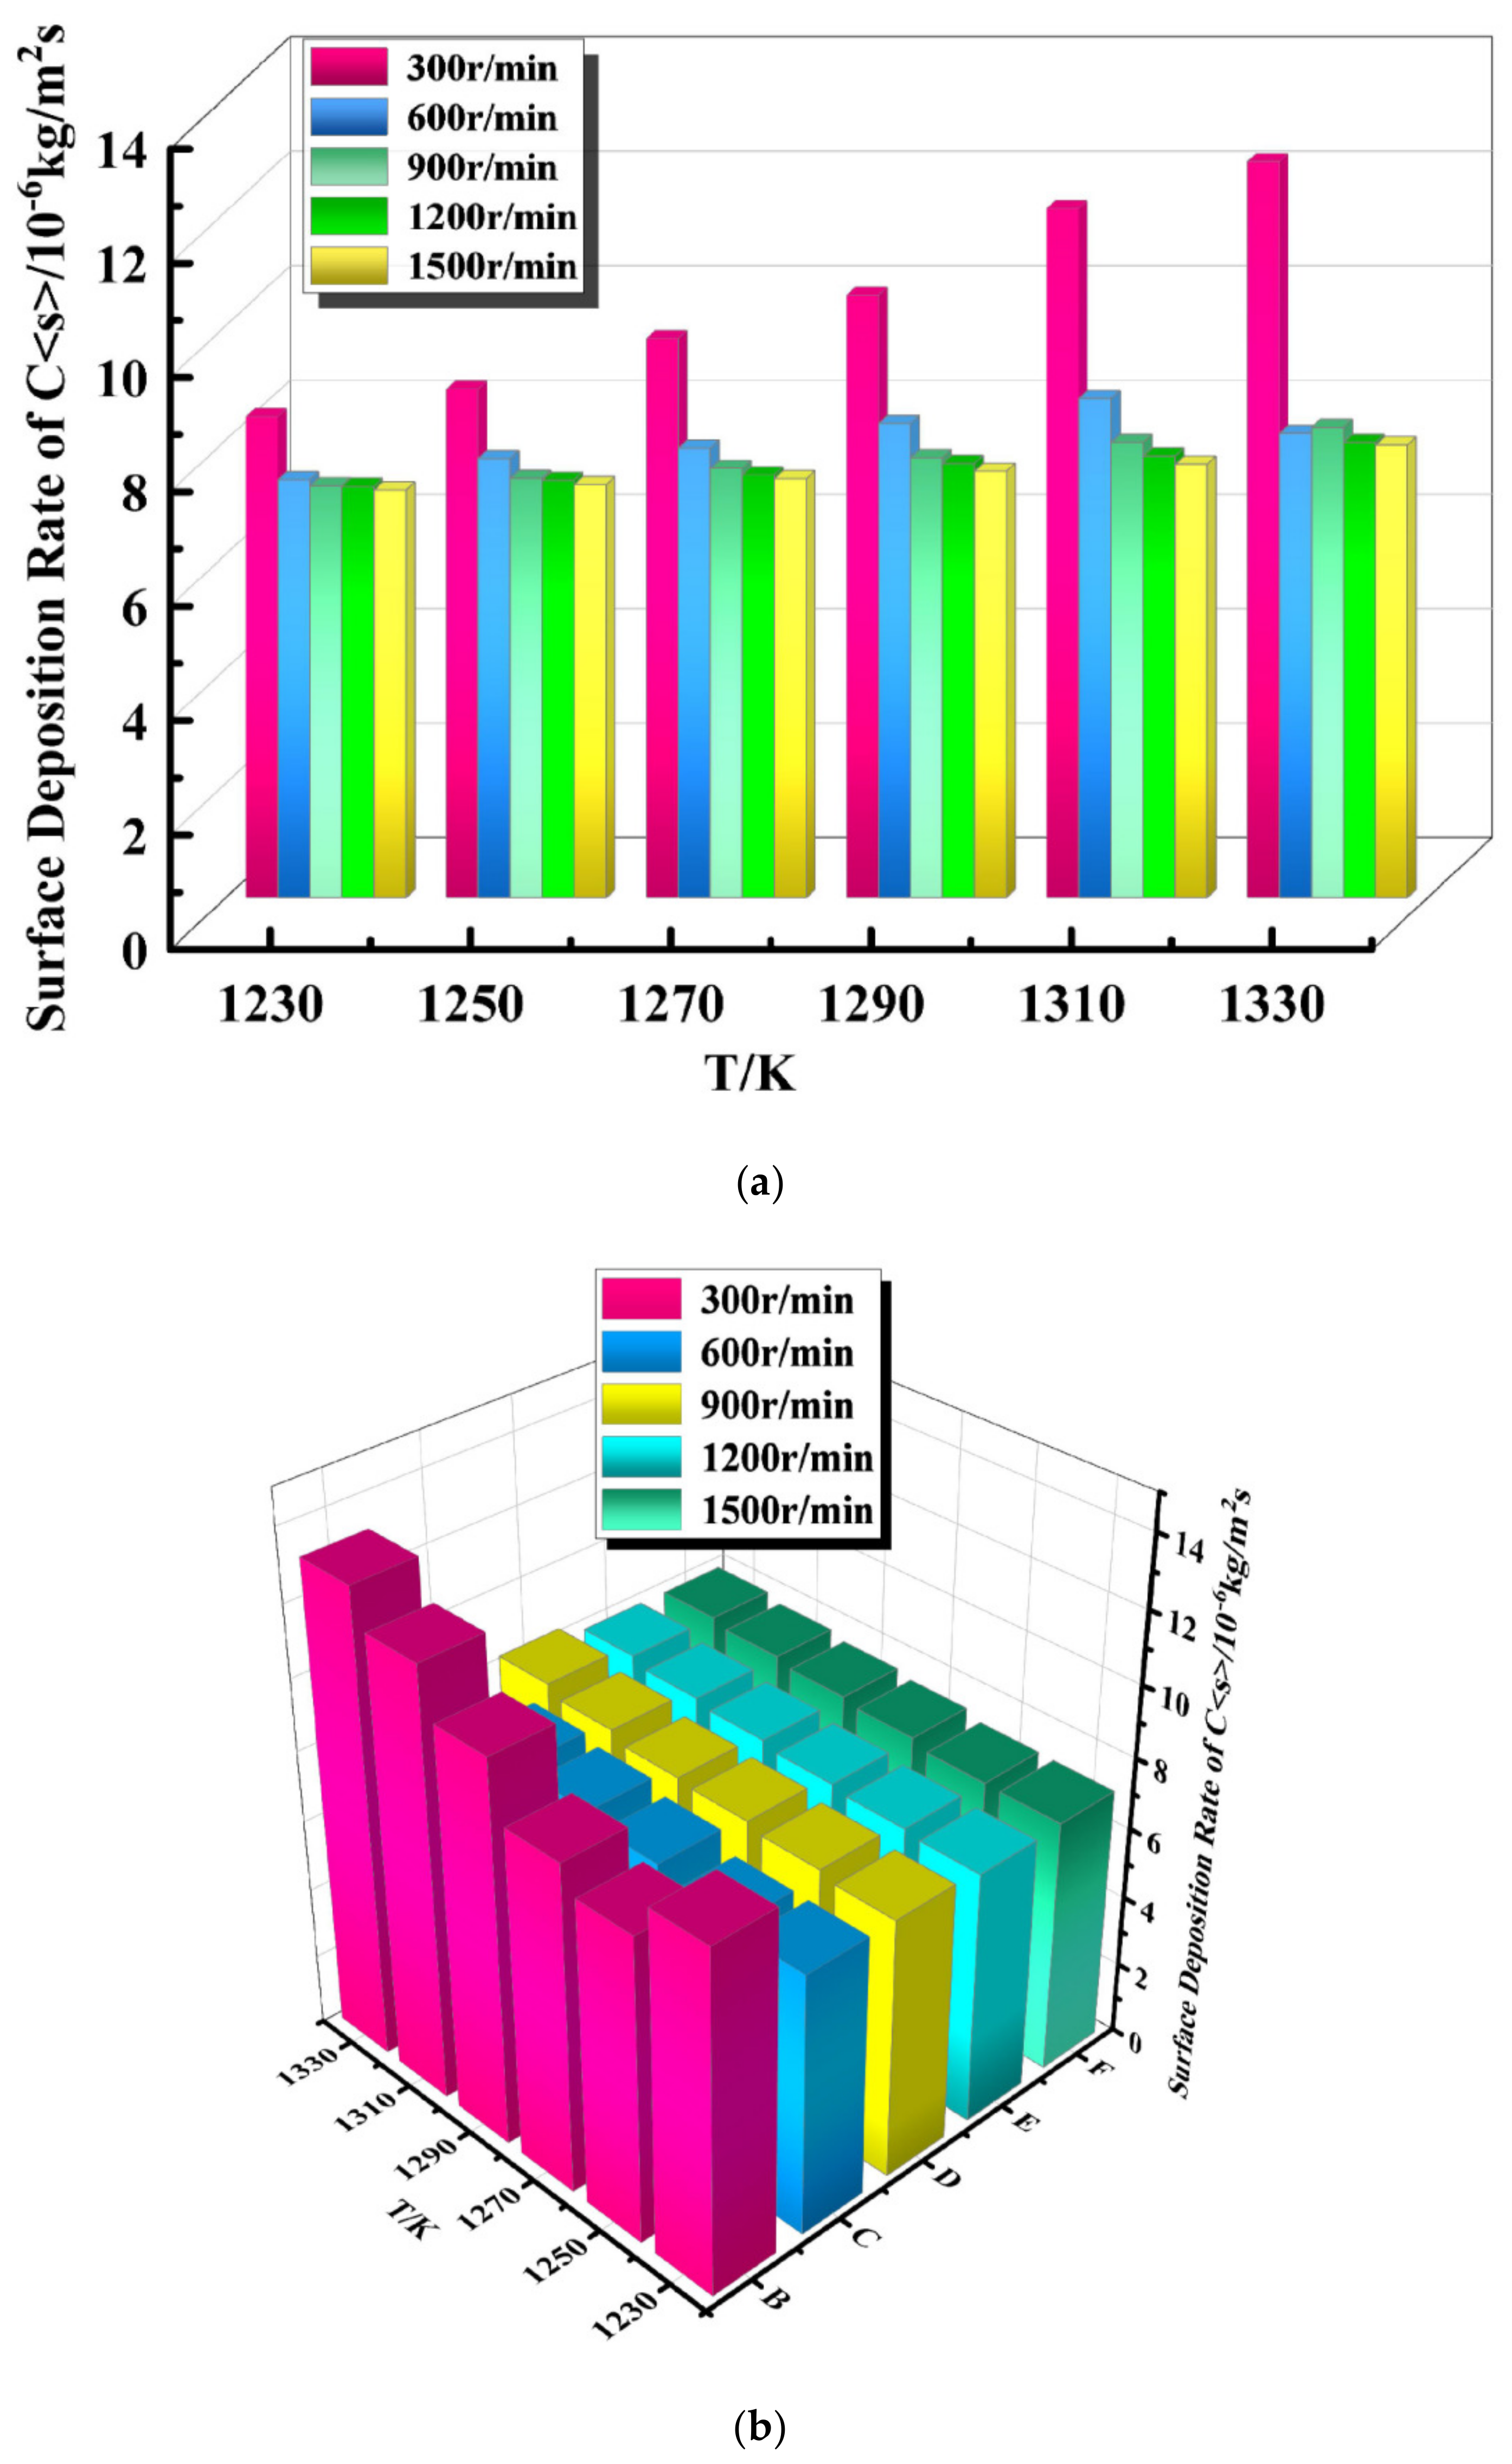
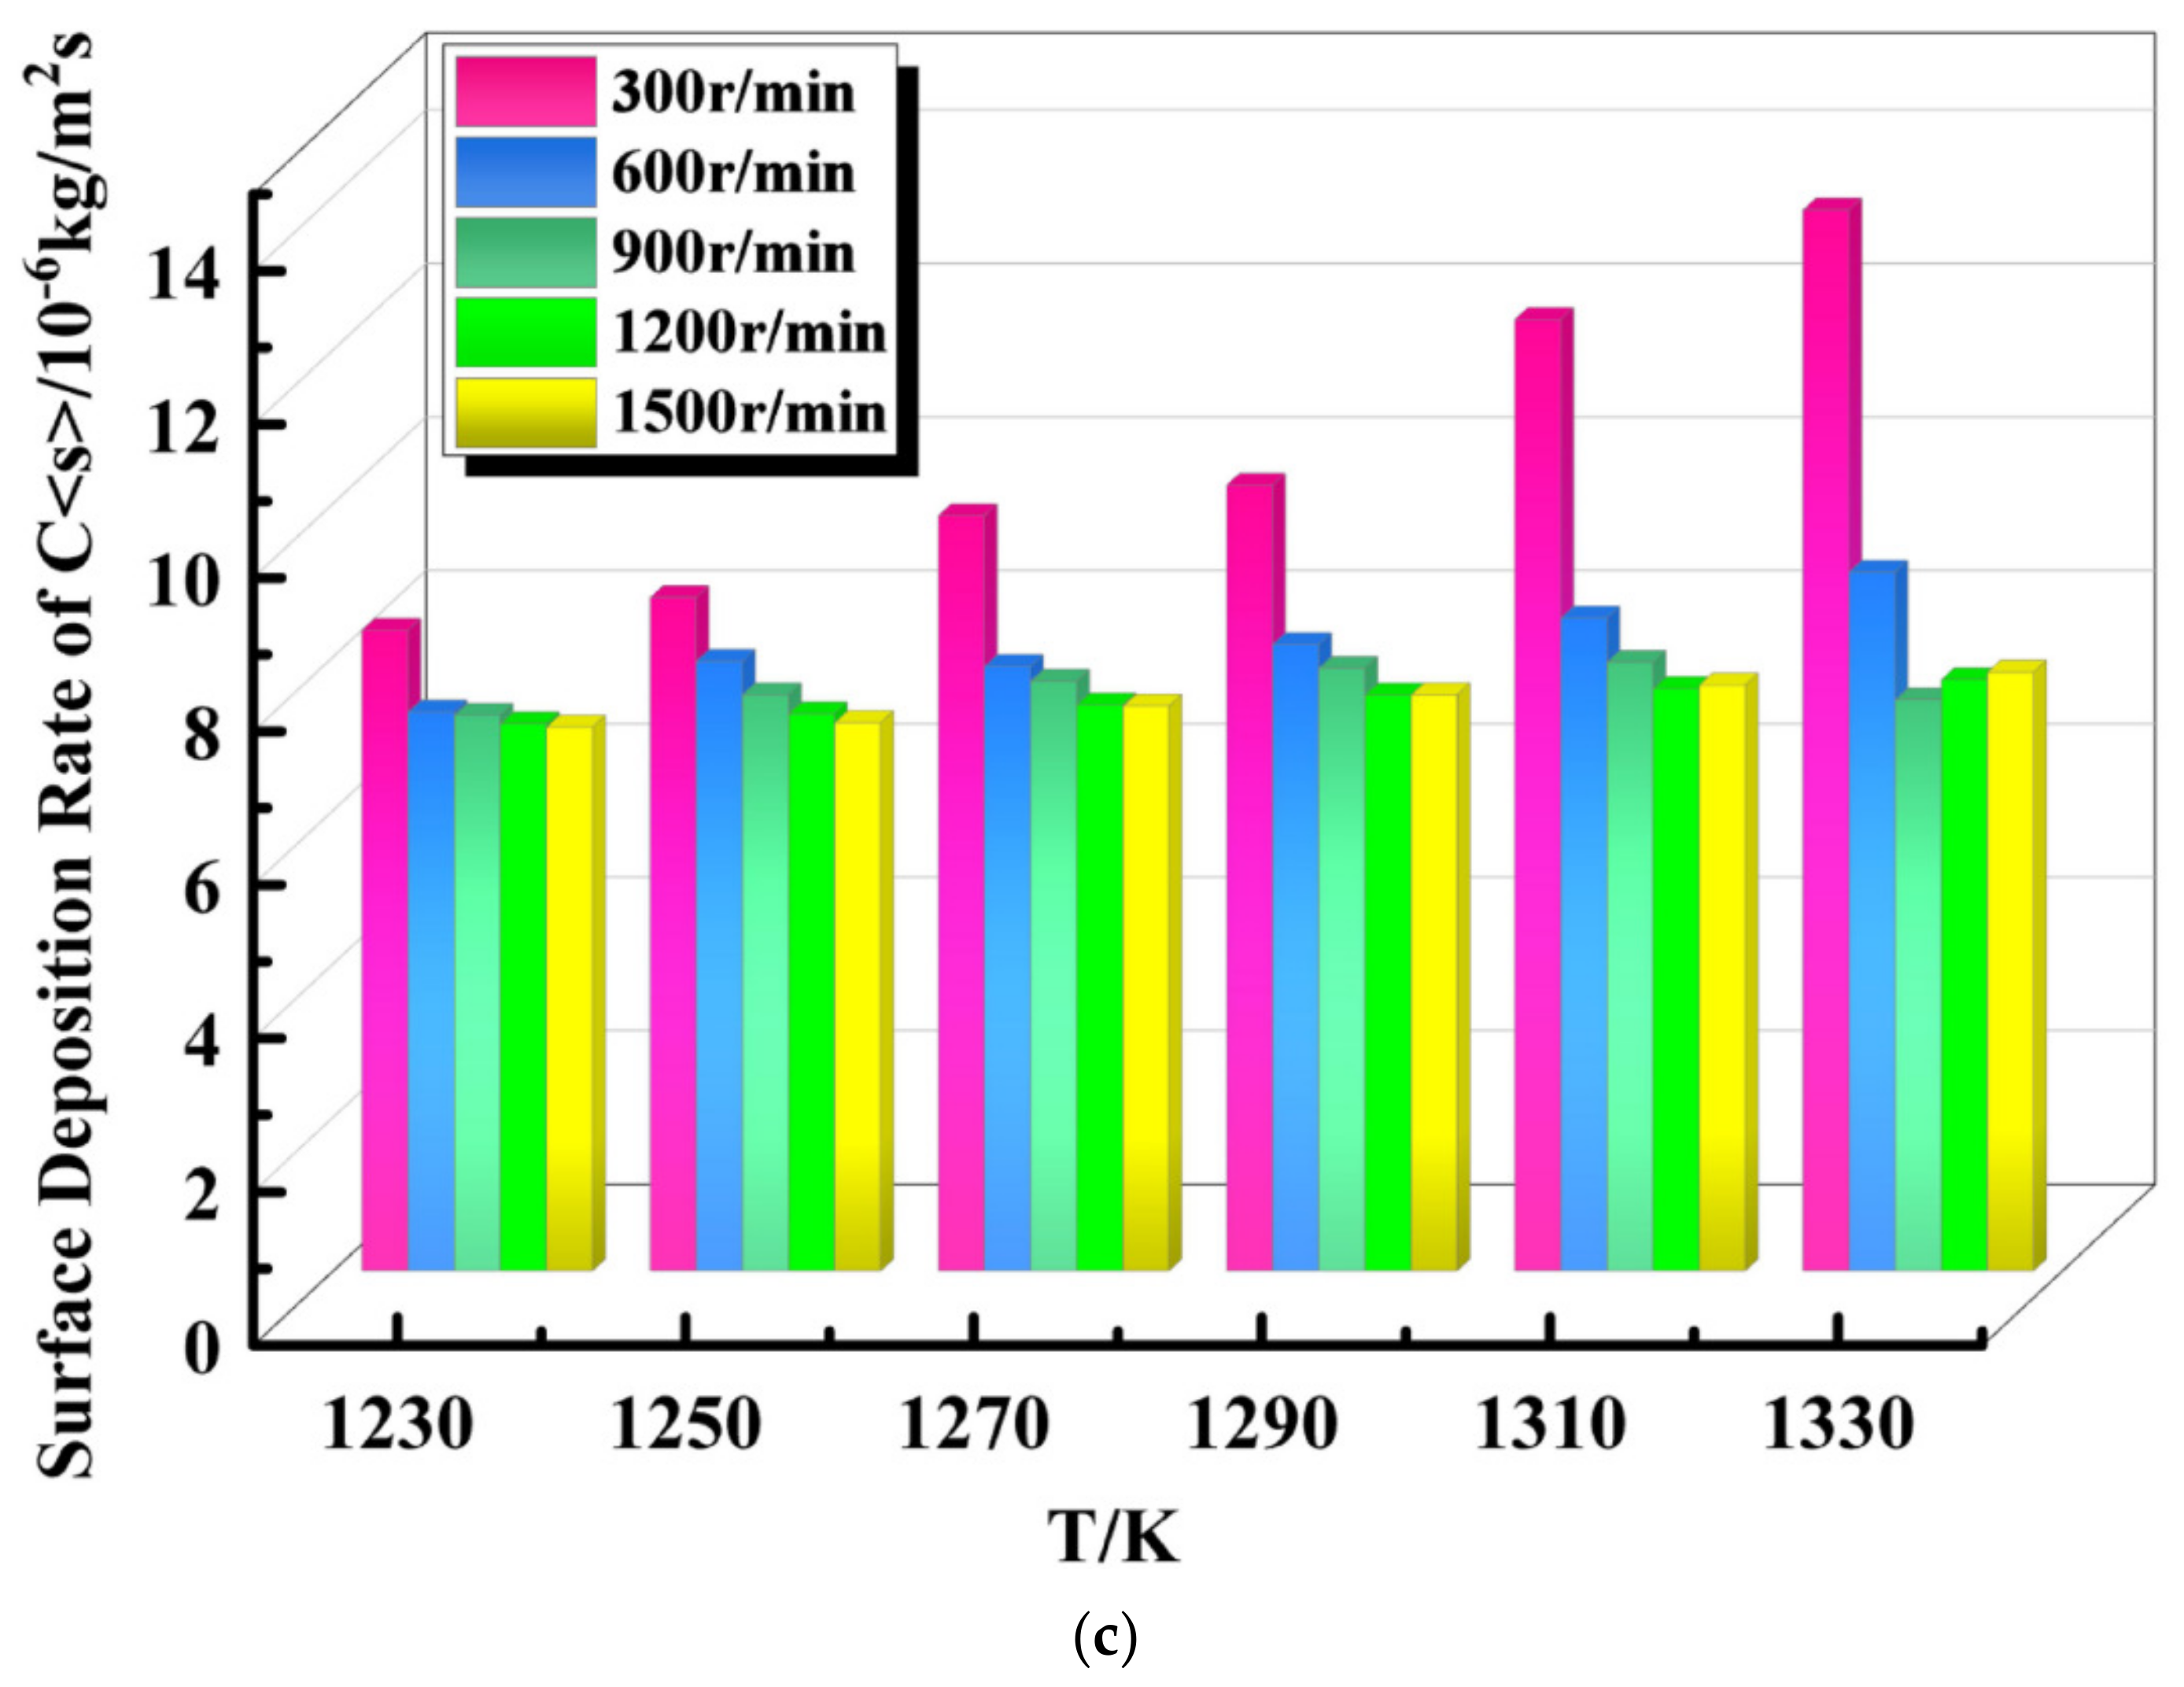
3.1. Influence of Temperature on Graphene Deposition Rate

Figure 5a–f show the surface deposition rate nephogram of carbon at different reaction temperatures. It can be clearly seen from Figure 5 that the carbon surface deposition rate on the VRD reactor base surface generally increased with the increase in temperature. It can be seen from Figure 5 that the variation in the carbon deposition rate with temperature was consistent with the following equation, between 1230 K and 1330 K:
v = A exp ( Δ E a R T )
According to Formula (10), both the value of −ΔEa/RT and the deposition rate increase with the temperature increase, which conforms to the Arrhenius formula.
Figure 5. Cloud map of carbon surface deposition rate at different reaction temperatures. (a) T = 1230 K. (b) T = 1250 K. (c) T = 1270 K. (d) T = 1290 K. (e) T = 1310 K. (f) T = 1330 K.
Coatings 13 01184 g005
As can be seen from Figure 5, the distribution of the graphene surface deposition rate is not strictly uniform with the increase in temperature because the interface rotation causes a slight disturbance of the deposition surface, which strengthens heat and mass transfer and leads to an uneven interface deposition rate. But the simulation data in Figure 6 show that, compared with the traditional straight-tube model [9], graphene was prepared by the CVD method in a VRD reactor. The surface deposition rate of graphene in the VRD reactor structure is much higher under both normal pressure and low pressure. The simulation shows that the growth of graphene using the special structure of the VRD reactor not only improves the deposition rate of the graphene surface but also shows that the use of the VRD reactor can realize the need to add low-pressure equipment under normal pressure conditions, and can save costs while growing large area and high-density graphene. Meanwhile, If only the change in carbon deposition rate was considered, the above simulation results show that when the temperature was at the stage of 1230 K–1310 K, the carbon deposition rate increased with the increase in temperature, so the graphene yield increased. However, when the temperature was higher than 1330 K, the graphene yield decreased with the increase in temperature. This is due to the continuous consumption of the reactants; as the reaction continues, the amount of the reactants continues to decrease from the beginning. Therefore, if only the change in graphene yield with temperature is considered in industrial production, the optimal temperature is around 1310 K.
T ≥ 1310 K, although the graphene surface deposition rate increases correspondingly, the growth rate is slower, indicating that the carbon conversion rate also decreases gradually.
At the same time, from the microscopic level, when the reaction temperature T ≤ 1310 K in the VRD reactor, the reactor contains a large amount of amorphous carbon, according to the relationship between the solid diffusion coefficient and temperature:
D = D 0 exp ( Q R T )
where D0 and Q represent the diffusion coefficient and diffusion activation energy, respectively. According to Equation (11), when the temperature of the reactor is low (T ≤ 1310 K), the surface diffusion rate D of carbon and catalyst is relatively low, which not only prevents the carbon clusters inside the VRD reactor but also prevents the regrowth of deposited carbon on the catalyst surface, resulting in the formation of a large amount of amorphous carbon. When the reactor temperature is too high (T > 1330 K), according to Equation (11), the diffusion rate D of carbon and catalyst surface is relatively high, and the rate of carbon species formation may exceed the diffusion rate and the rate of carbon clusters, resulting in the formation of a continuous graphene film on the copper sheet; this deactivates the catalyst and hinders the whole reaction process. When the temperature in the VRD reactor is between 1230 K and 1310 K, the formation of amorphous carbon is significantly reduced, which is conducive to the formation of high-quality graphene.
Therefore, in the process of production, we should not only consider the increase in the carbon deposition rate at a certain temperature but also ensure the growth conditions of graphene at this temperature.

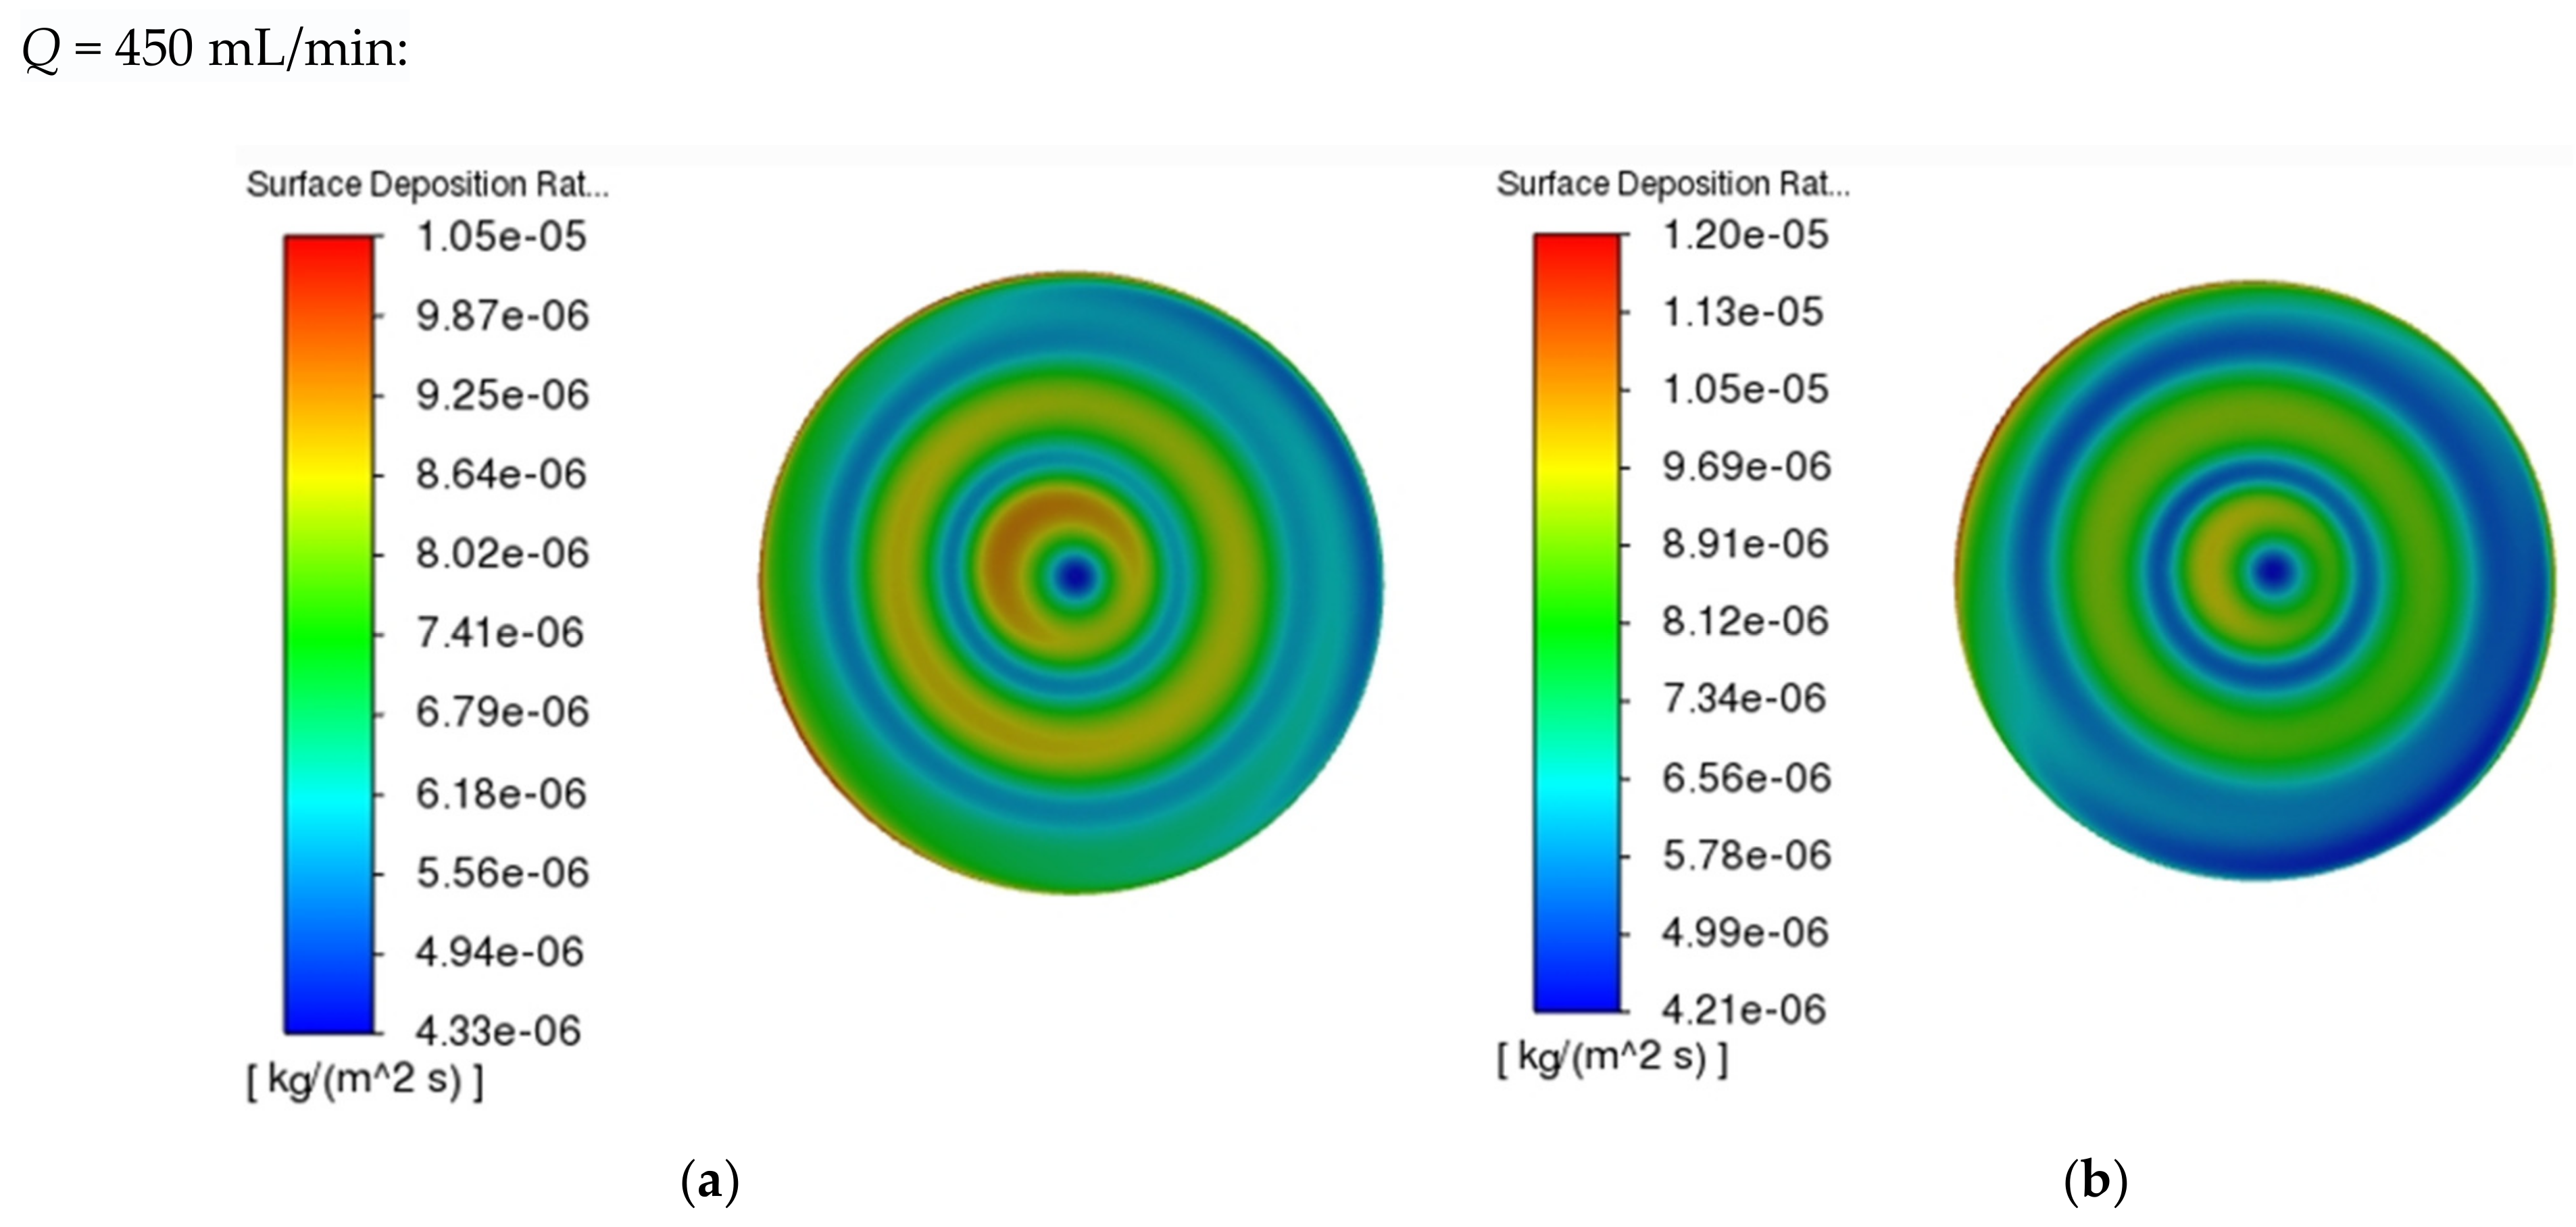
3.2. Influence of Intake Flow Rate on Graphene Deposition Rate

In some previous studies on VRD reactors, it was reported that the inlet flow affected the film deposition rate and film thickness uniformity [26]. A simplified rotation model was developed by Makino et al.; from the reaction model of deposition of Si in a gas mixture of SiHCl3–H2, the effect of gas flow on the deposition rate of silicon in a VRD reactor was studied according to the method of the normalized central moment [8]. Both Coltrin and Makino proposed a moderate flow rate (about 90 SLM (standard liters per minute)) as “the ideal inlet velocity of the disk” [27].
Therefore, in this section, when the temperatures of the rotating base surface were set at T = 1290 K and 1310 K, and the base speeds were 300 rpm, 600 rpm, 900 rpm, 1200 rpm, and 1500 rpm, the surface deposition rates of graphene deposited by the rotating base surface radial in the VRD reactor were set according to the total inlet air flow Q = 450 mL/min, 470 mL/min, and 490 mL/min, respectively. In order to more accurately reflect the surface deposition rates of graphene at different base surface rotational speeds, the simulation results were expressed in the form of a weighted average calculation. Figure 7 shows the simulation results.
As can be seen from Figure 7, the distribution of the graphene surface deposition rate is not strictly uniform with the increase of inlet air flow rate. This is because the radial velocity is different, leading to the difference between the center of the rotating base surface and the surface velocity; meanwhile, the interface updating speed is different, leading to the difference between the center of the rotating base surface and the deposition rate of the graphene surface on both sides. With the increase of base surface rotation speed, the nucleation number of graphene coating increases, and the grain size decreases gradually. The deposition rate of the graphene surface decreases, and the deposition thickness of graphene gradually decreases. Especially when the intake flow rate reaches a certain critical value, the fine grains are prone to agglomerate growth, resulting in the coating densification, grain cohesion, and film-base binding force increasing first and then decreasing. So, the representation of the result here is introduced into the area-weighted average in Figure 8. As shown in Figure 8, when the air inlet velocity was higher than the moderate flow rate of 470 mL/min, the graphene surface deposition rate increased, and the compactness increased. However, when the inlet gas flow rate was less than 470 mL/min, the graphene surface deposition rate and the compactness decreased, and the surface deposition rate decreased from the center of the rotating base plane to the outer edge. The simulation results show that the average carbon deposition rate increases relatively quickly when the air inlet velocity ranges from 450 mL/min to 490 mL/min, while the average carbon deposition rate tends to increase gently when the air inlet velocity is higher than 470 mL/min. This indicates that 470 mL/min is the optimal speed point, and when the intake speed keeps increasing, although the carbon deposition rate is in the increasing stage, the growth rate is low. This is because as the intake speed keeps increasing, the concentration of the reactants in the VRD reactor gradually increases, and the gas retention time in the reaction zone becomes longer. However, when the reaction rate inside the VRD reactor was equal to the reactant supply rate in the reactor, the growth curve of the carbon deposition rate tended to be flat. If the air inlet supply rate continued to increase, the CH4 into the reactor would not be completely consumed and would be discharged along with the outlet tail gas, resulting in a gradual reduction in the carbon conversion rate and a decrease in the graphene surface deposition rate.
Based on the research method of Tao et al. [28], in order to quickly evaluate the homogeneity of graphene and avoid the adverse impact on the evaluation of surface deposition rate due to the large amount of calculation caused by the problem of collection point setting in simulation work, a new evaluation method is proposed in this paper: flow uniformity evaluation index based on area-weighted average velocity Va and mass-weighted average velocity Vm. This study adopted the evaluation indexes of the flow uniformity of the area-weighted average velocity Va and mass-weighted average velocity Vm to quantitatively reflect the flow uniformity degree of different velocity distributions on the base surface and proposed the flow uniformity correlation formula based on Vm and Va, as follows:
I = [ 1 | V a V m | V m ] × 100 %  
Since VmVa, it can be simplified into the following Equation (13):
I = V a V m × 100 %
In the simulation process, it can be seen from Equation (13) that the Vm and Va of the fluid on the reaction base surface can be directly given by the simulation results, so the ratio I can be directly used to analyze the flow uniformity of the simulation results. At the same time, considering the fluid flow rate, the simulated results were expressed by the area-weighted average:
1 A V d A = 1 A i = 1 n V i | A i |
It can be seen from Equation (14) that the area-weighted average is calculated by multiplying a parameter in each grid (such as temperature and velocity) by the grid area and then dividing it by the total grid area. The influence of different intake flow rates on the uniformity of the graphene surface deposition rate is shown in Figure 9.
As shown in Figure 9, under the same rotational speed condition, the deposition rate of the graphene surface is larger and more uniform at T = 1310 K than at T = 1290 K, indicating that at T = 1310 K, the VDR reactor is more conducive to the generation of homogeneous graphene. Meanwhile, when the rotating base surface temperature was T = 1310 K, and the base surface rotation speed was 900 rpm, the carbon deposition rate increased with the increase in the intake speed. However, as the intake speed continued to increase to 470 mL/min, the carbon deposition rate slowed down, and even the growth rate showed a decreasing trend.

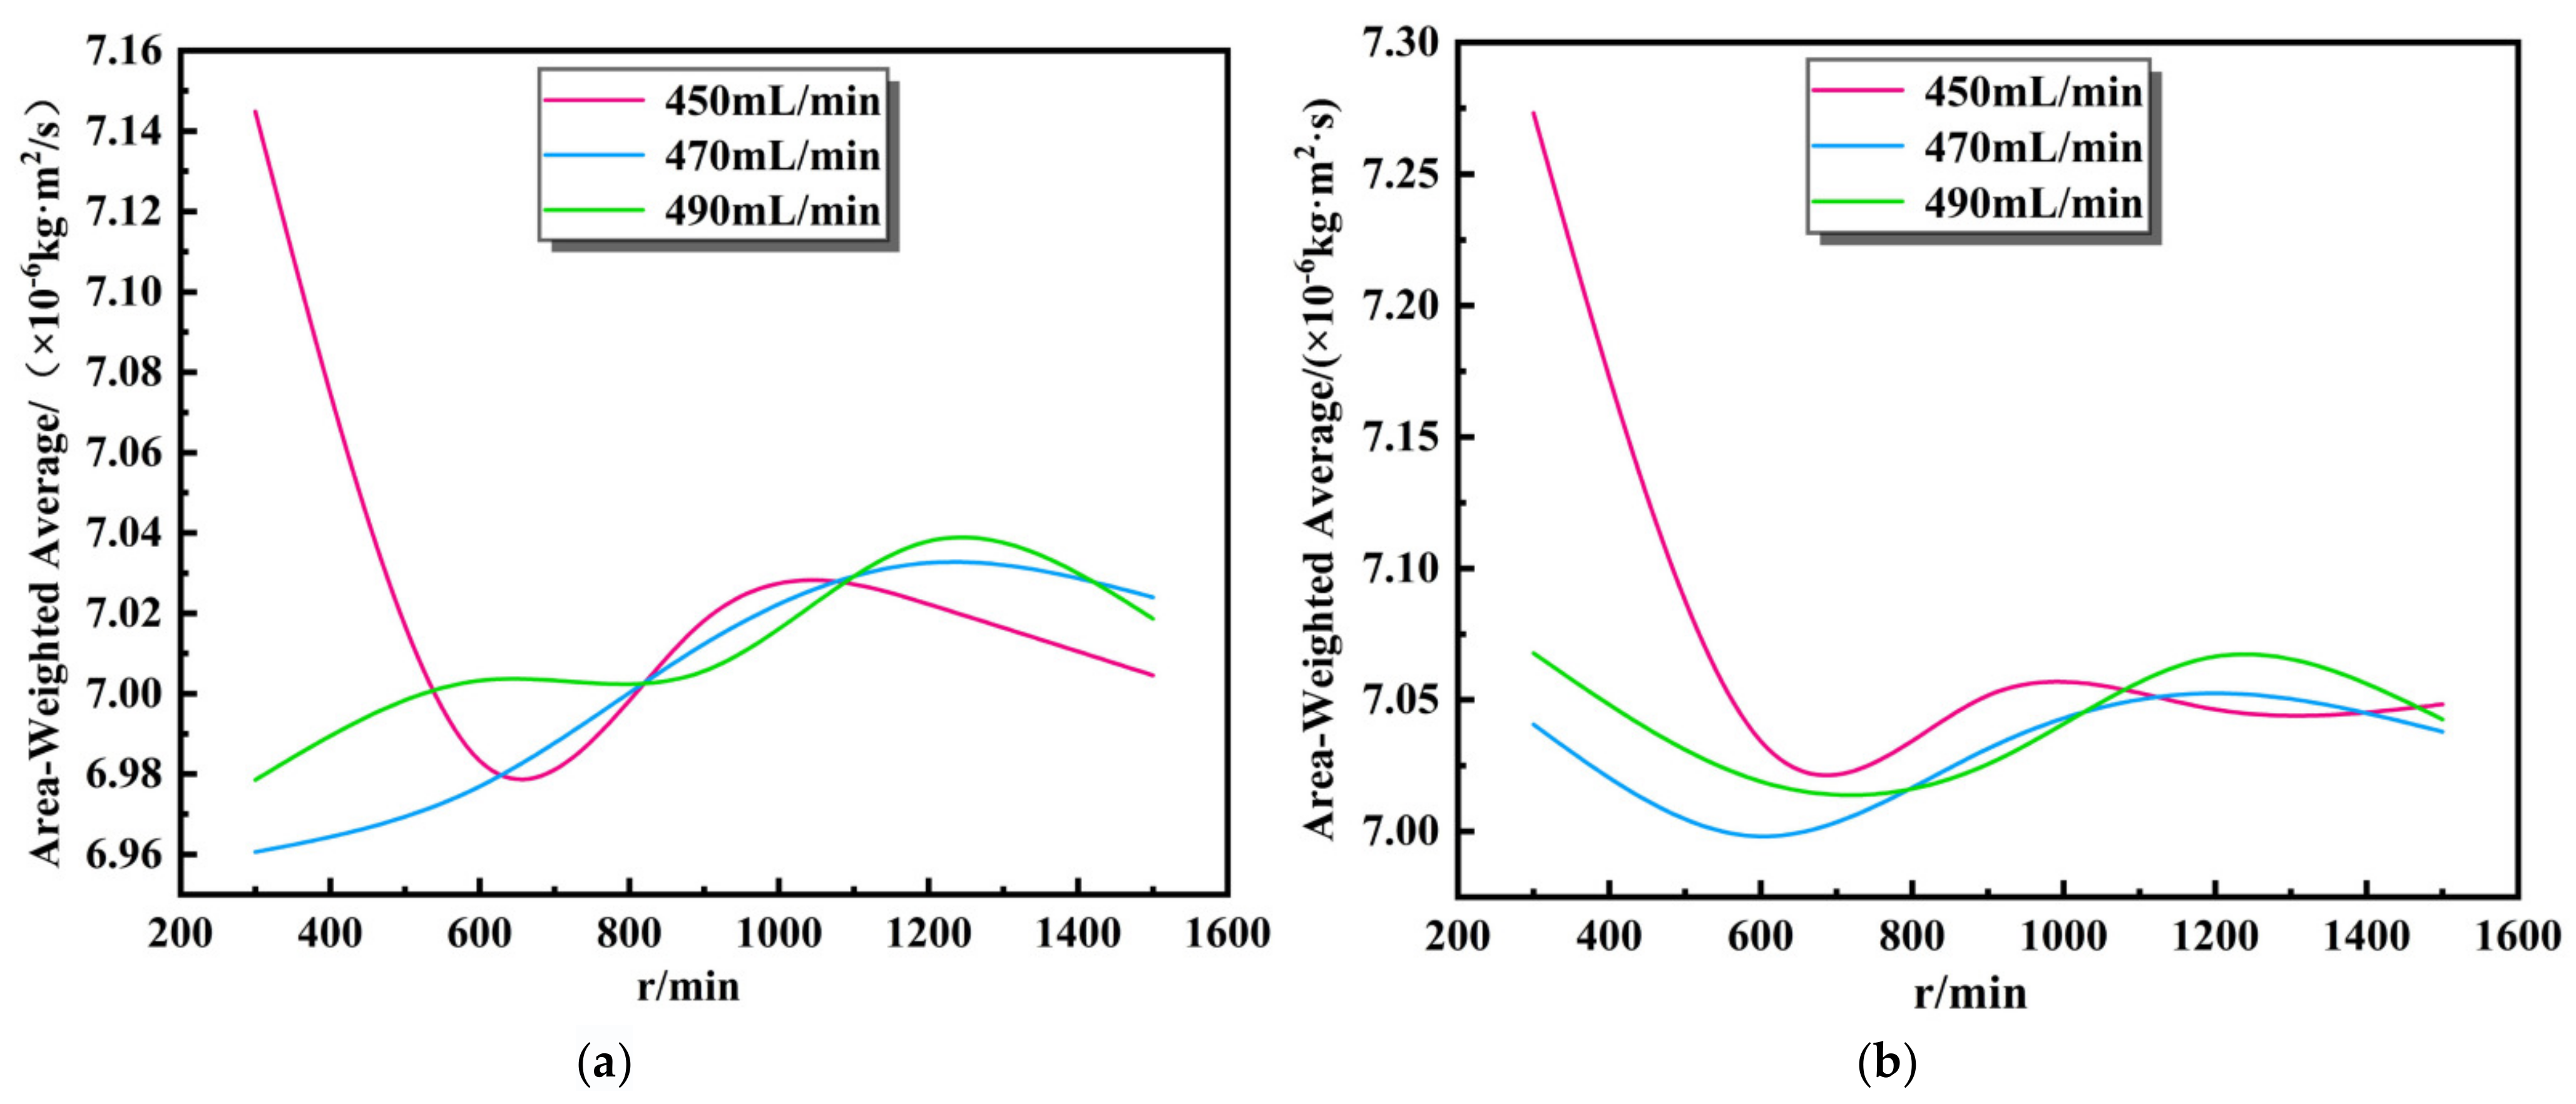
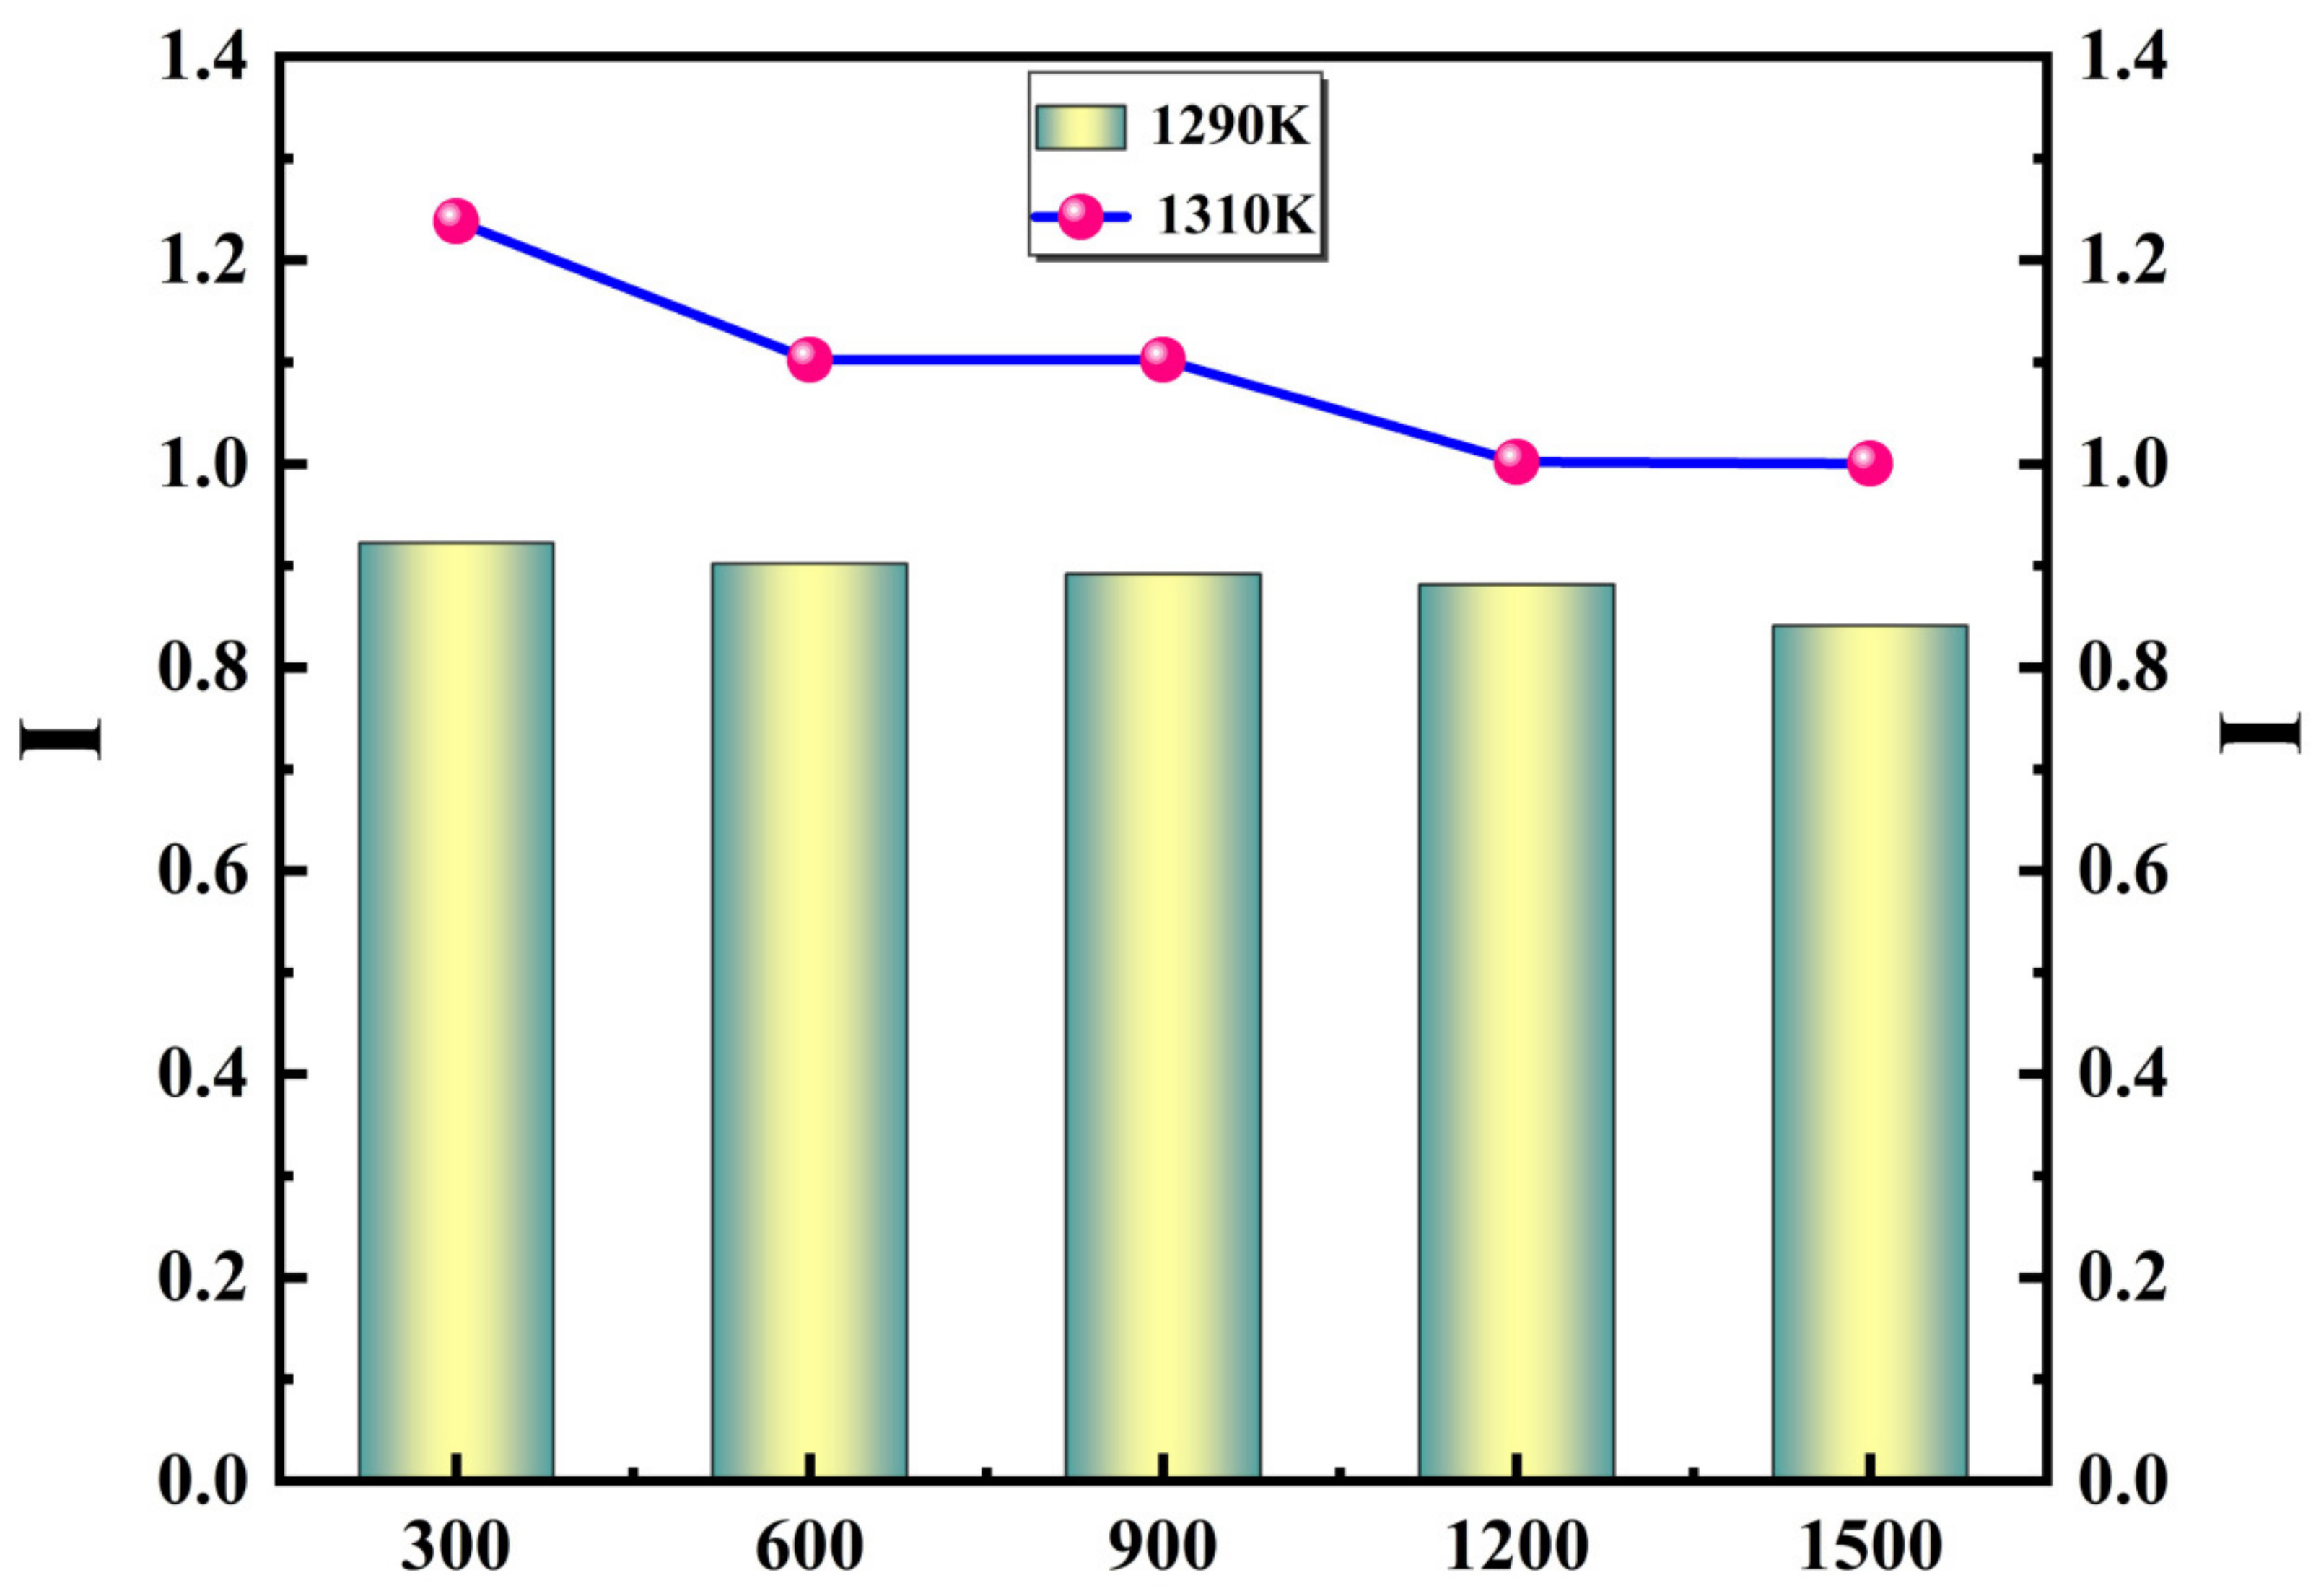
3.3. Influence of Substrate Rotation Speed on Graphene Deposition Rate

When the inlet gas flow rate V = 470 mL/min and the reaction base surface temperature was 1230 K–1330 K, the rotating base surface speeds were set as 300 rpm, 600 rpm, 900 rpm, 1200 rpm, and 1500 rpm. The simulation results are shown in Figure 10.
Figure 10 shows the graphene surface growth rate obtained using a VRD reactor. It was found that when the substrate speed was greater than 900 rpm, the graphene surface deposition rate was less than 8 × 10⁻⁶ kg/m2 s, which was not much different from the graphene growth rate in the conventional straight tube CVD reactor. However, the deposition rate increased with a decrease in the substrate rotation rate. When the substrate rotation speed was less than 900 rpm, the graphene deposition rate was more than 8 × 10⁻⁶ kg/m2 s, and when the substrate rotation speed was less than 300 rpm, the graphene deposition rate was about twice 1500 rpm. When the rotational speed continued to increase to 1500 rpm, the changing trend of the graphene surface deposition rate slowed down with increasing substrate rotation speed. This is because when the rotational speed was too high, the CH4 entering the VRD reactor was not completely consumed and discharged along with the exhaust gas, and the reaction time between the gas entering the VRD reactor and the reaction base surface was short. The molar concentration (Cs) of methane at the rotating base decreased, and the deposition rate of the graphene surface decreased when the rotational speed was higher than 1500 rpm.
It can be seen from the simulation that when the rotational speed of the substrate in the VRD reactor is greater than 900 rpm, the rotational speed of the substrate keeps increasing, which gradually breaks the initial growth environment of the graphene grains, and leads to the growth of the grains. When the rotational speed is reduced to 900 rpm, the new gas phase environment reaches equilibrium again, and the secondary nucleation growth is re-achieved on the grown graphene crystal surface. At this point, the rotation of the VRD reactor made the gas phase environment of graphene growth more uniform, and the deposition rate of the graphene surface increased. Therefore, under the same deposition conditions, when the substrate rotation speed is r ≤ 900 rpm, the graphene film density is better.

3.4. Effects of Material Ratio on Graphene Deposition Rate

When graphene is synthesized by the CVD method, the hydrogen flow rate has a significant impact on the quality, size, and morphology of the graphene [29,30,31]. The main performances are as follows: (1) hydrogen, as a cocatalyst, promotes the adsorption of methane on the metal to achieve the pyrolysis of methane to obtain the target product [31]; (2) hydrogen, as an etching agent; etched graphene and restricted the growth of graphene [31]; (3) hydrogen inhibits the cracking of methane, thus limiting the growth of graphene [31,32]; (4) on the surface of the copper foil at high temperature, hydrogen can remove impurities on the surface of the copper foil in advance, and ensure that the copper foil substrate is not oxidized, which is conducive to reducing the nucleation density and improving the quality of graphene [32].
When studying the influence of the hydrogen flow rate on graphene, the growth temperatures T = 1230 K, 1250 K, 1270 K, 1290 K, 1310 K, and 1330 K were set in this experiment. The rotation base speeds were set as 300 rpm, 600 rpm, 900 rpm, 1200 rpm, and 1500 rpm; the methane flow rate was 25 sccm; the argon flow rate was 100 sccm; and the flow rates of H2 were set as 60 sccm, 75 sccm, and 90 sccm; the rest remained unchanged. The simulation results are shown in Figure 11.
It can be seen from Figure 11 that when the hydrogen flow rate Q ≤ 75 sccm, the graphene surface deposition rate increases with the increase in the hydrogen flow rate, indicating that the increase in the hydrogen flow rate is favorable for the decomposition of methane gas and conducive to the growth of graphene. As shown in Figure 11, when the hydrogen flow rate was greater than 75 sccm, the graphene surface deposition rate decreased with the increase in the hydrogen flow rate. This indicates that the increase in the hydrogen flow rate inhibits the pyrolysis of methane, resulting in a reduction in carbon atoms and further inhibits the generation of graphene. Therefore, when the hydrogen flow rate in the VRD reactor is Q ≤ 75 sccm, the surface growth of graphene is favorable. When the hydrogen flow Q was >75 sccm, the graphene surface deposition rate changed little and decreased with the increase in the hydrogen flow rate, which was not conducive to the growth of graphene.
This is because there is a balance between growth and etching regulated by hydrogen gas during the growth of graphene [33]. When the graphene growth rate was higher than the etching rate in the VRD reactor, the graphene nucleated and grew. When the graphene growth rate was similar to the etching rate, the growth of graphene stopped. When the graphene etching rate is faster, graphene will be significantly etched by hydrogen gas. Therefore, when the carbon source supply is sufficient relative to the hydrogen content, increasing the hydrogen flow at this time is equivalent to increasing the concentration of the reactant, which speeds up the graphene growth. On the contrary, when the carbon source supply is insufficient relative to the hydrogen content, increasing the hydrogen concentration is equivalent to increasing the number of products, which speeds up the reverse reaction of graphene growth, namely, the graphene etching rate; thus, the graphene growth rate gradually decreases, and the surface deposition rate decreases. At the same time, the simulation demonstrated that in the growth process of growing graphene, the role of CH4 is to provide a C source, and the role of H2 is to provide H atoms to promote the adsorption of methane on the metal to achieve methane cracking and promote the decomposition of amorphous carbon on the surface of graphene, thus improve the quality of graphene; however, excess H atoms will also etch graphene and destroy the integrity of the graphene lattice, resulting in poor-quality graphene. Therefore, the quality of graphene can be improved by optimizing the flow of CH4 and H2 intake during growth.
When the reaction temperature was between 1290 K and 1310 K and the H2 flow rates were set as 60 sccm, 75 sccm, and 90 sccm, the graphene surface deposition rate results were obtained, as shown in Figure 12:
As shown in Figure 12, when the reaction temperature is between 1290 K and 1310 K, the higher the temperature is, the higher the deposition rate of the graphene surface on the reaction base surface is. At the same time, the deposition rate decreased with the increase in inlet H2 flow at both temperatures. Therefore, in the VRD reactor, the rotation speed of the rotating base was 300 rpm, and the temperature was between 1290 K–1310 K. A methane flow rate of 25 sccm, an argon flow rate of 100 sccm, and a hydrogen flow rate of 75 sccm were the best conditions for graphene growth.

4. Effect of Carbon Surface Deposition Rate on the Growth Behavior of Graphene

Molecular dynamics (MD) simulation has become an important means to analyze the effects of graphene deposition parameters and study its growth behavior. MD simulation is one of the most effective methods to realize the direct combination and complementation with experiments [34,35,36]. Therefore, it is an effective and rapid approach to choose the MD simulation method to study deposition and growth mechanisms when the experimental or observation conditions cannot be realized. In this study, MD can effectively reflect the microscopic behavior of atomic motion during deposition and growth under the condition of setting reasonable potential functions as an ensemble.

4.1. Establishment of Simulation System

The established base copper crystal model contains 10 layers of copper atoms with a cross-sectional area of 3.10 nm × 3.58 nm. Due to the limitations of the simulation system and the thermal fluctuation of the surface of the copper substrate under high temperatures, the influence of the roughness and surface defects of the copper substrate model on the deposition quality was not taken into account. Therefore, a single crystal of copper with a complete and smooth surface was set as the simplified copper substrate model. In order to prevent flow on the bottom surface of the substrate in the deposition simulation, the face of a copper (111) crystal was selected as the sedimentary surface to simulate deposition growth, and the boundaries of the copper crystal model were set as periodic boundary conditions. A two-dimensional simulation model of deposition growth on the copper substrate was established, as shown in Figure 13.
In order to improve the efficiency of the simulation calculations, pyrolysis carbon atoms were used to replace the simplified model for the gas mixture. The carbon deposition rate was used as a representation of the gas mixture flow rate, which was expressed by the number of atoms deposited by 1 ps, expressed in ps−1. The system was controlled as a canonical ensemble (NVT), the temperature of the simulation system was controlled as 1290 K and 1310 K, and the time step was set as 0.001 ps. In the LAMMPS simulation environment, based on empirical potential, the time step was set to 1 fs.

4.2. Selection of Simulation Potential Function

The potential function determines the effect of the MD simulation and is the key problem to be solved in the simulation. There were Cu and C atoms in the simulation system in this study. Since the simulation assumes that graphene deposition on the copper surface does not grow by segregation, Morse potential was used in the simulation experiment. During actual deposition, there may also be a non-ideal state in which the substrate is not absolutely pure copper. The Morse potential function introduced in this simulation plays an important role in reducing the influence of the non-ideal state in the actual deposition of copper substrate elements and reduces the error of theoretical simulation and practical verification.
The Morse empirical potential function is the following:
E m o r s e ( r i j ) = D 0 [ e 2 α ( r i j r 0 ) 2 e α ( r i j r 0 ) ] . · ( r < r e ) .
where denotes the depth of the potential well, denotes the “width” of the potential well, denotes the equilibrium distance between the two nearest adjacent carbon atoms in the crystal, i.e., the distance where the interaction force is zero, units, Å. r is the distance between two atoms i and j, and r e is the truncation distance. In this simulation, r0 = 3.3 Å, and re = 6 Å. Bringing the data into (15), the Morse potential function expression becomes the following:
E m o r s e ( r i j ) = D 0 [ e 2 α ( r i j 3.3 ) 2 e α ( r i j 3.3 ) ]
The energy of interactions between all atoms is defined as follows:
E m ( r 0 ) = 1 2 j ( j i ) E m o r s e ( r i j )
Among them, d E m ( r 0 ) d r 0 = 1 2 j ( j i ) E m o r s e ( r i j ) r i j = 0 .
By substituting Equation (16) into Equation (17), we can obtain the following:
E m ( r 0 ) = 1 2 j ( j i ) { D 0 [ e 2 α ( r i j 3.3 ) 2 e α ( r i j 3.3 ) ] }
Since r = tijr0, take the first derivative of the above equation with respect to r0 and obtain the following:
d E m ( r 0 ) d r 0 = 1 2 j ( j i ) { 2 α t i j D 0 exp [ 2 α ( r i j 3.3 ) ] + 2 α t i j D 0 exp [ α ( r i j 3.3 ) ] } = 0
Take the second derivative of Equation (19) with respect to r0 and then obtain the following:
d 2 E m ( r 0 ) d r 0 2 = 1 2 j ( j i ) { 4 α 2 t i j 2 D 0 exp [ 2 α ( r i j 3.3 ) ] 2 α 2 t i j 2 D 0 exp [ α ( r i j 3.3 ) } ]
In the calculation, only 1~10 layers of copper atoms interact with carbon atoms. In this way, D0 = 0.15 eV and α = 2.244/Å can be obtained according to Equations (19) and (20), and the Morse potential function of the interaction between copper and carbon atoms is the following:
E m o r s e ( r i j ) = 0.15 exp [ 4.488 ( r i j 3.3 ) ] 0.3 exp [ 2.244 ( r i j 3.3 ) ]
In Equation (21), the unit of energy of Emorse is eV, and the unit of r is Å.

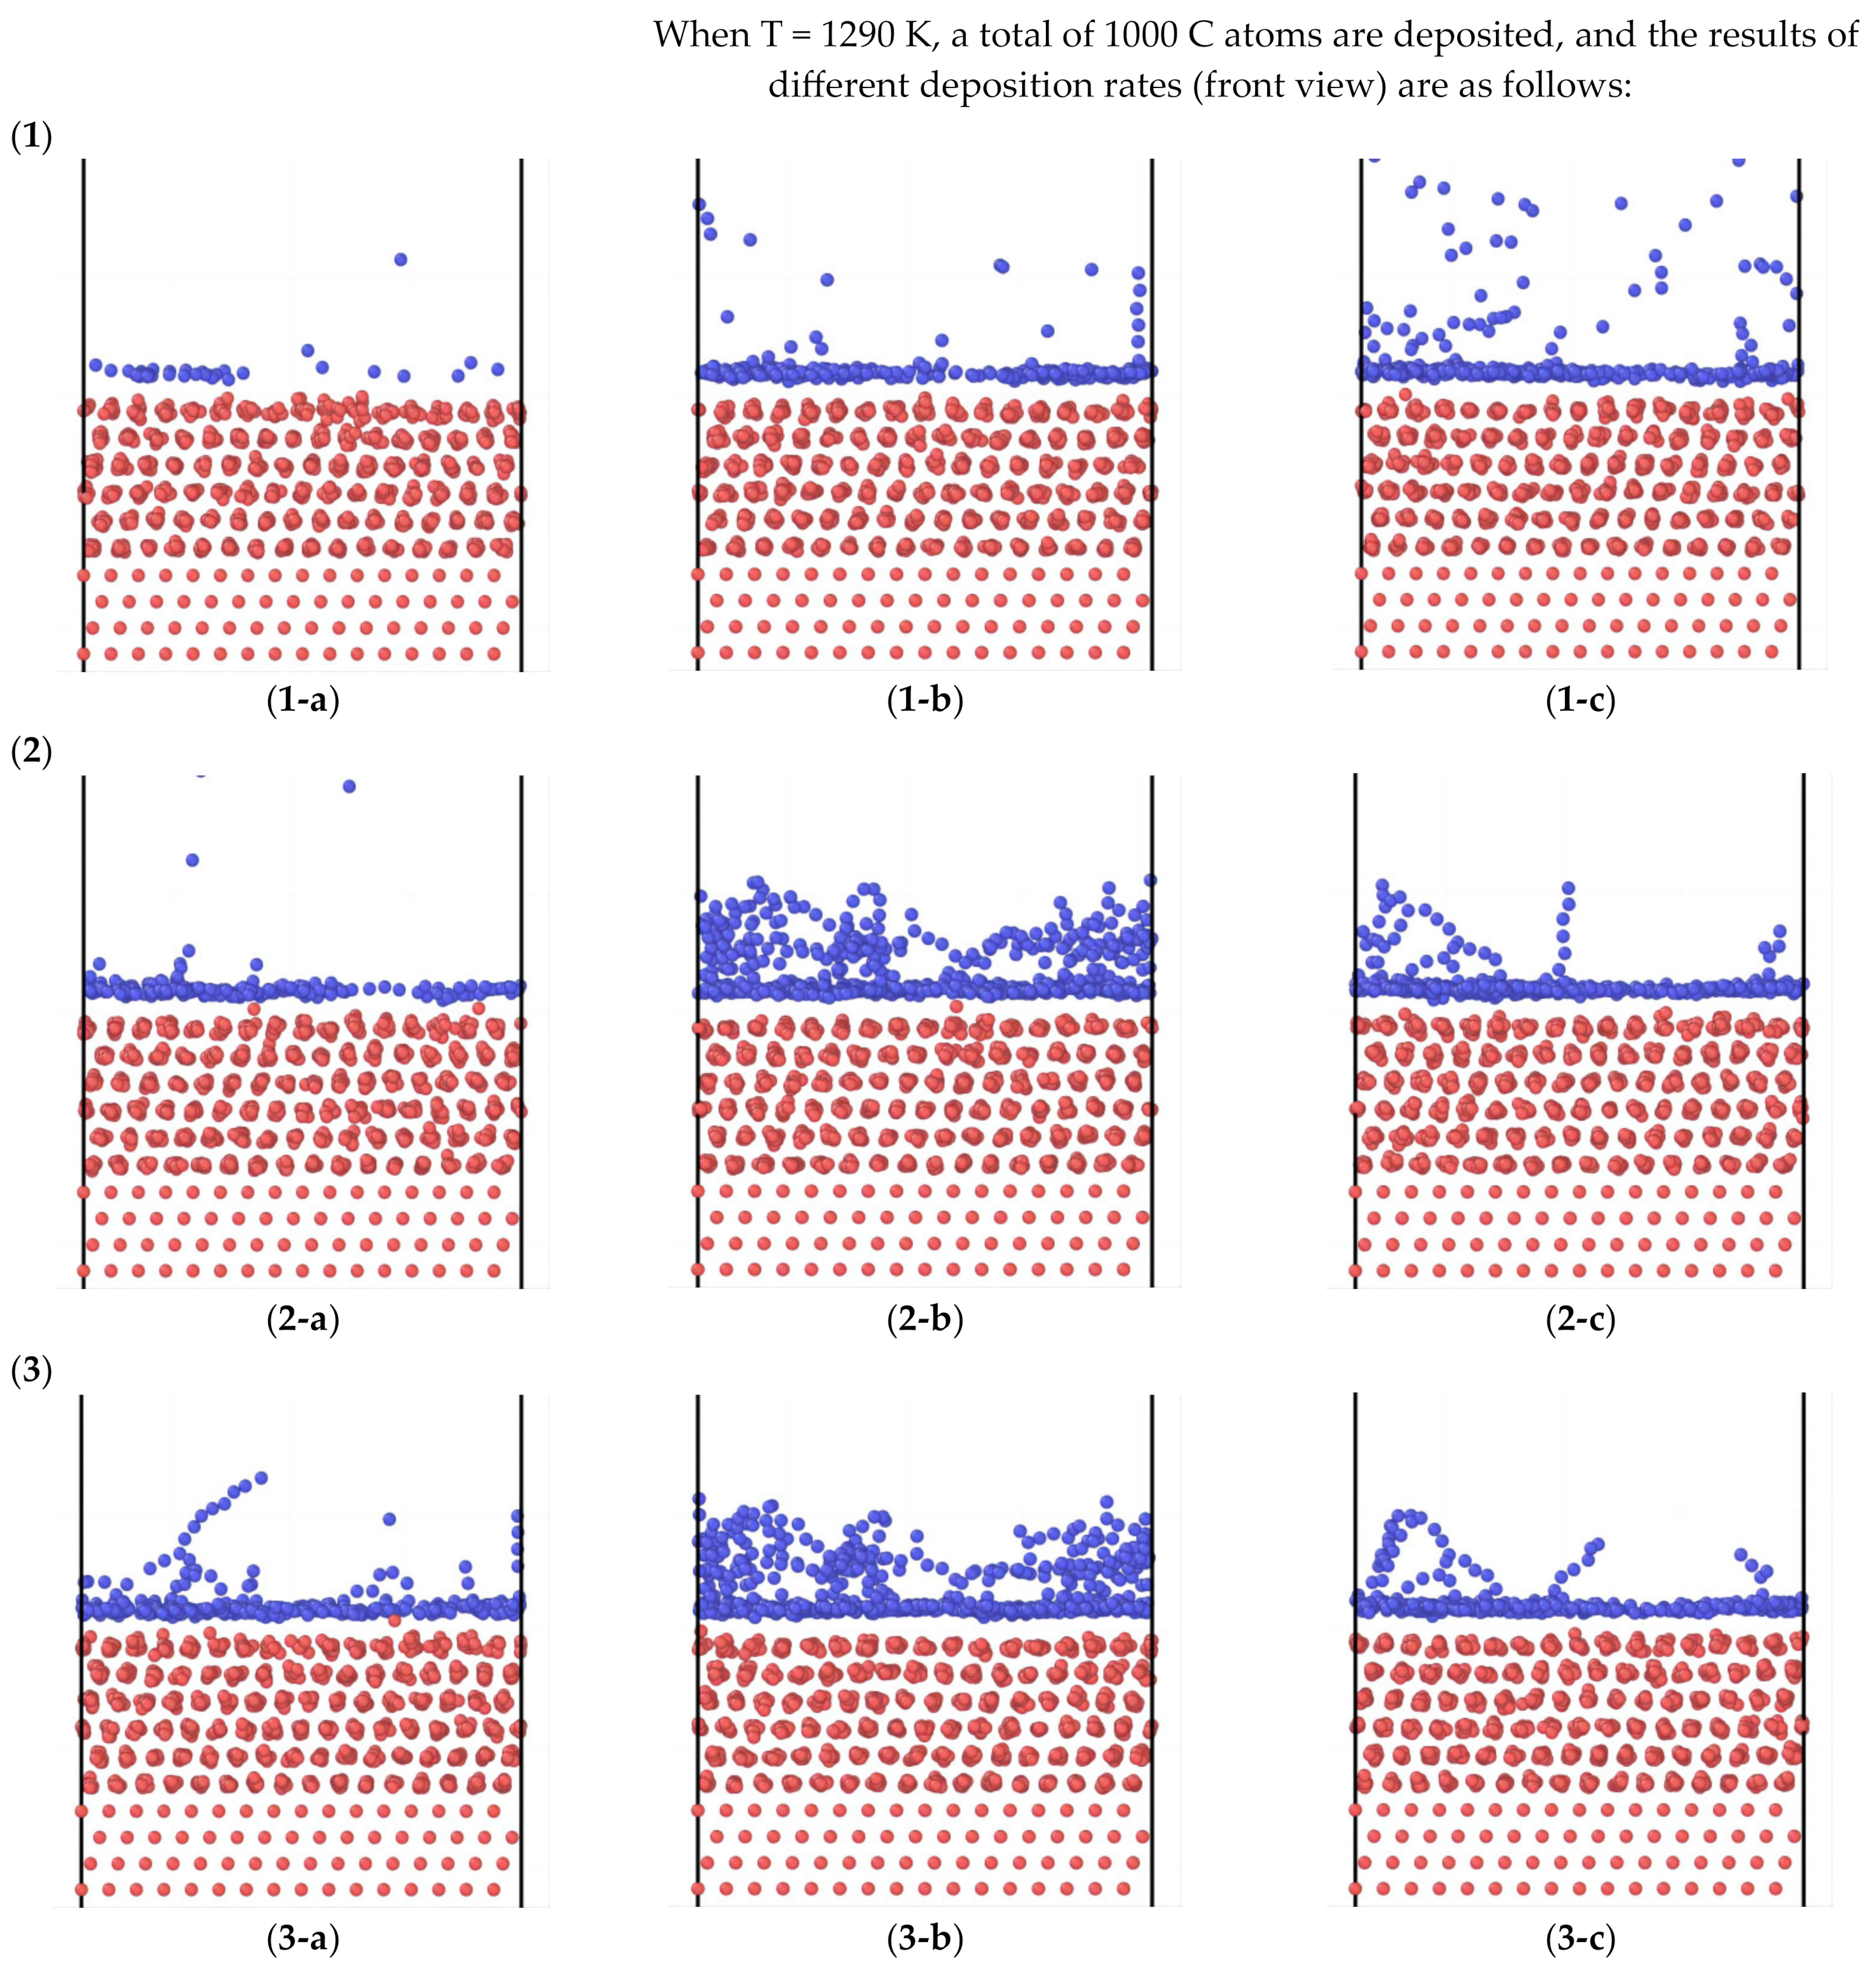
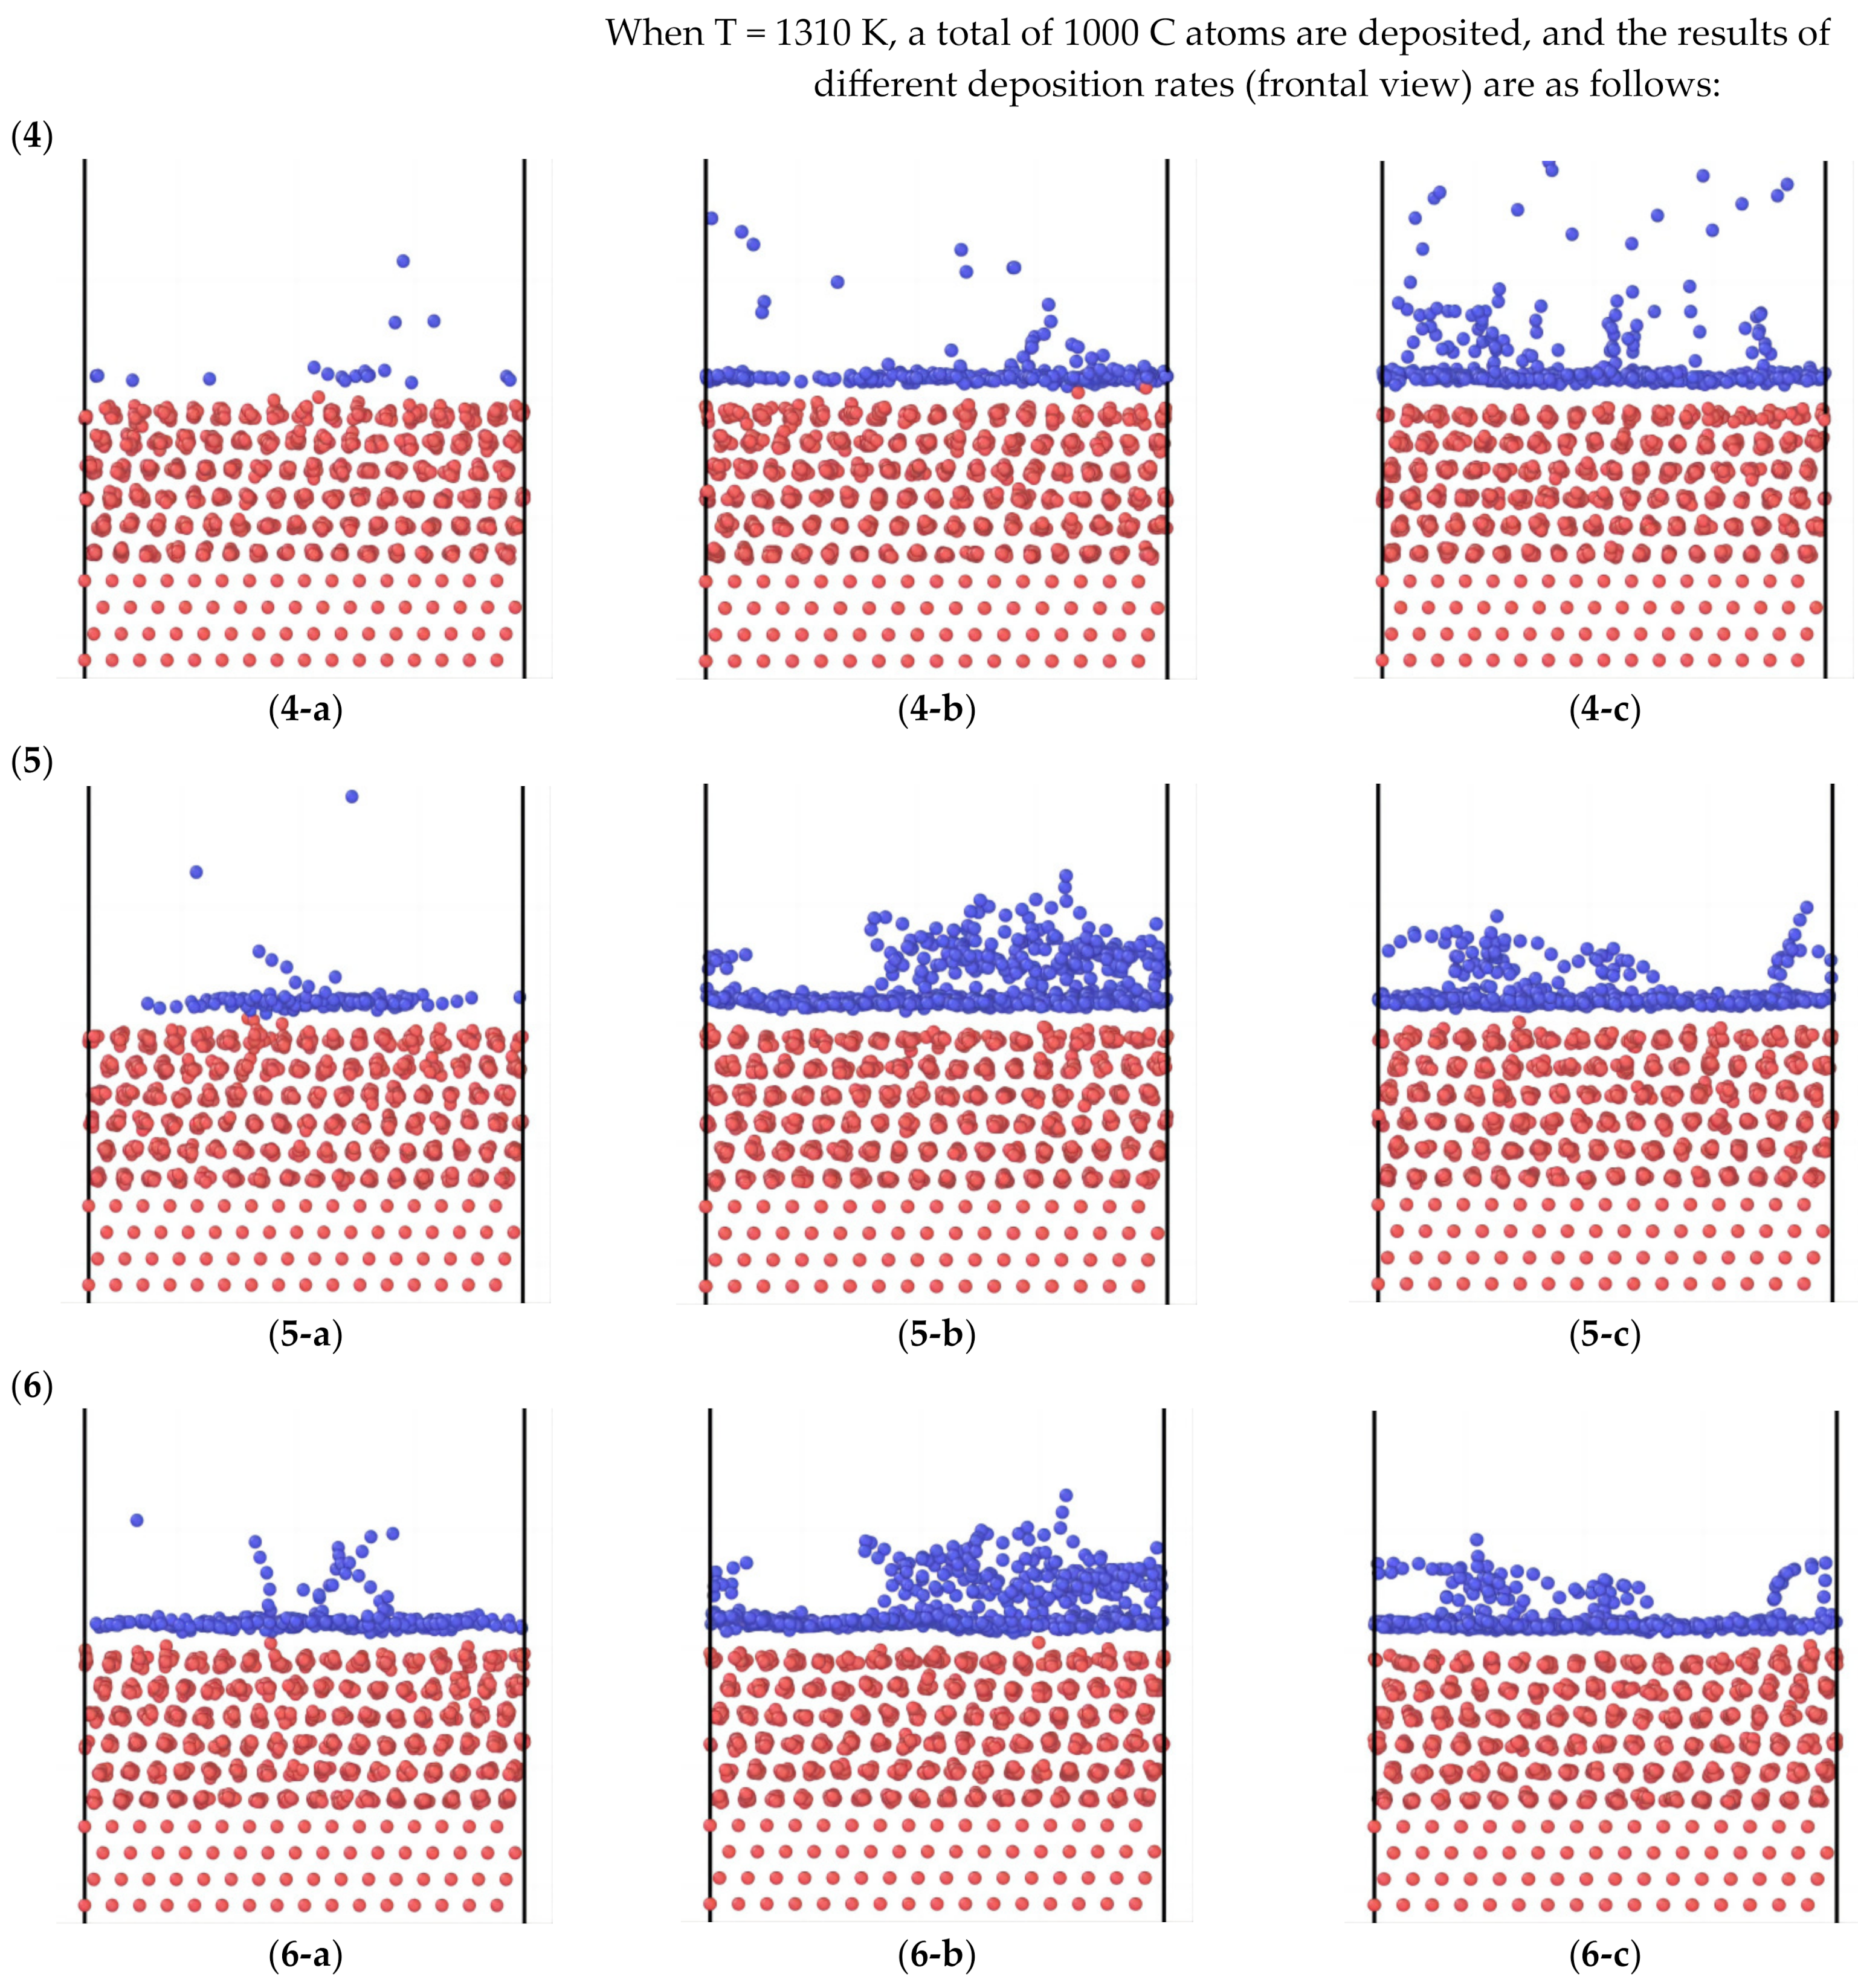
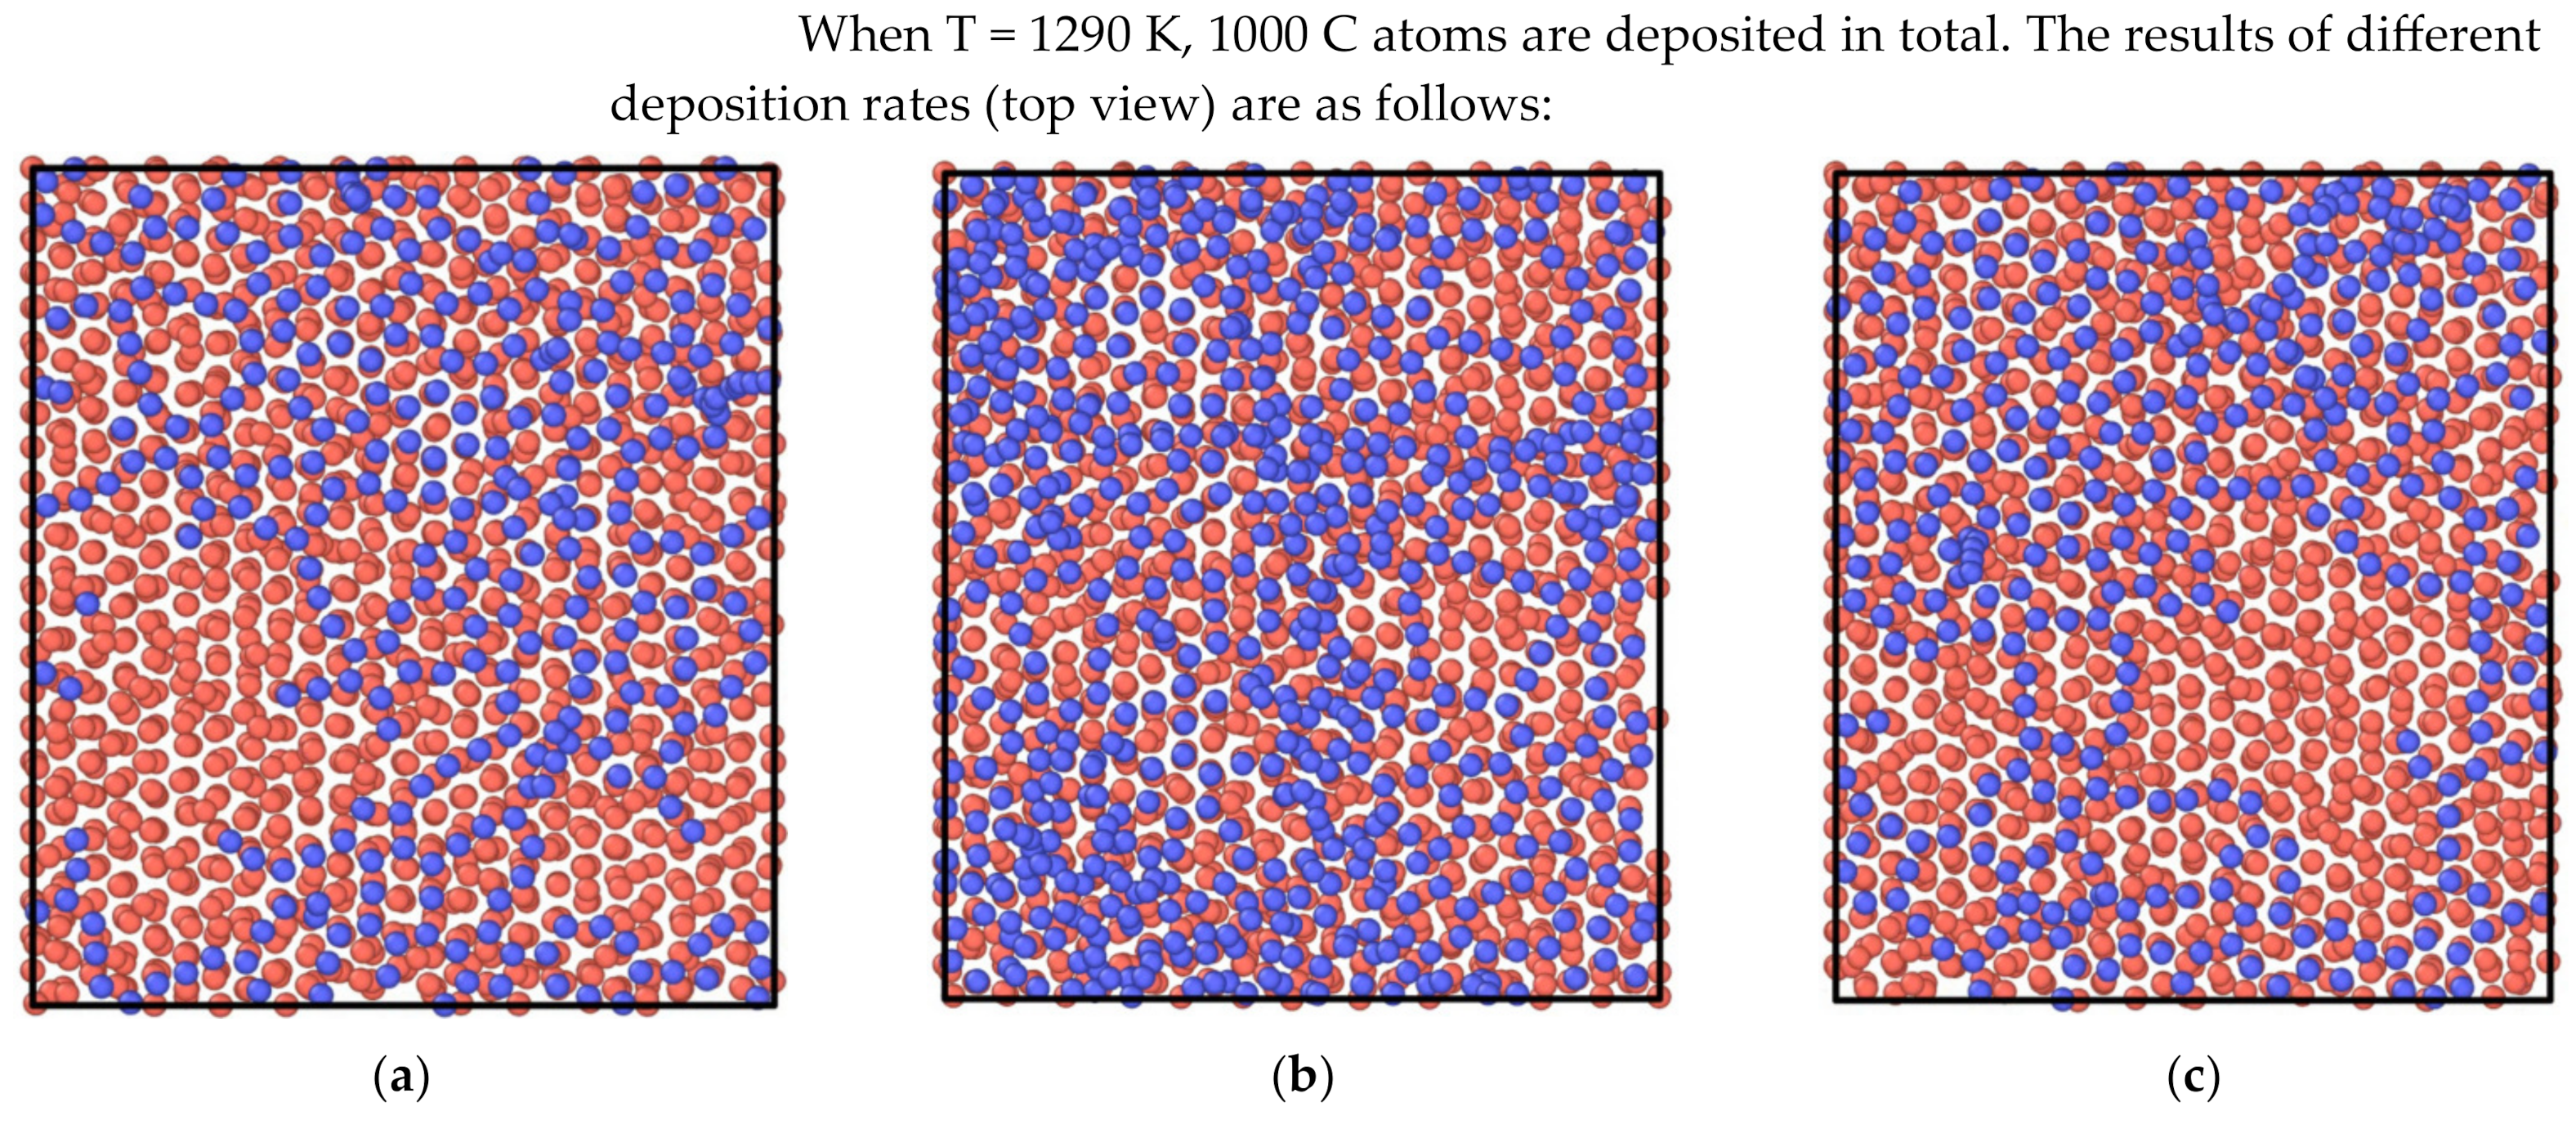
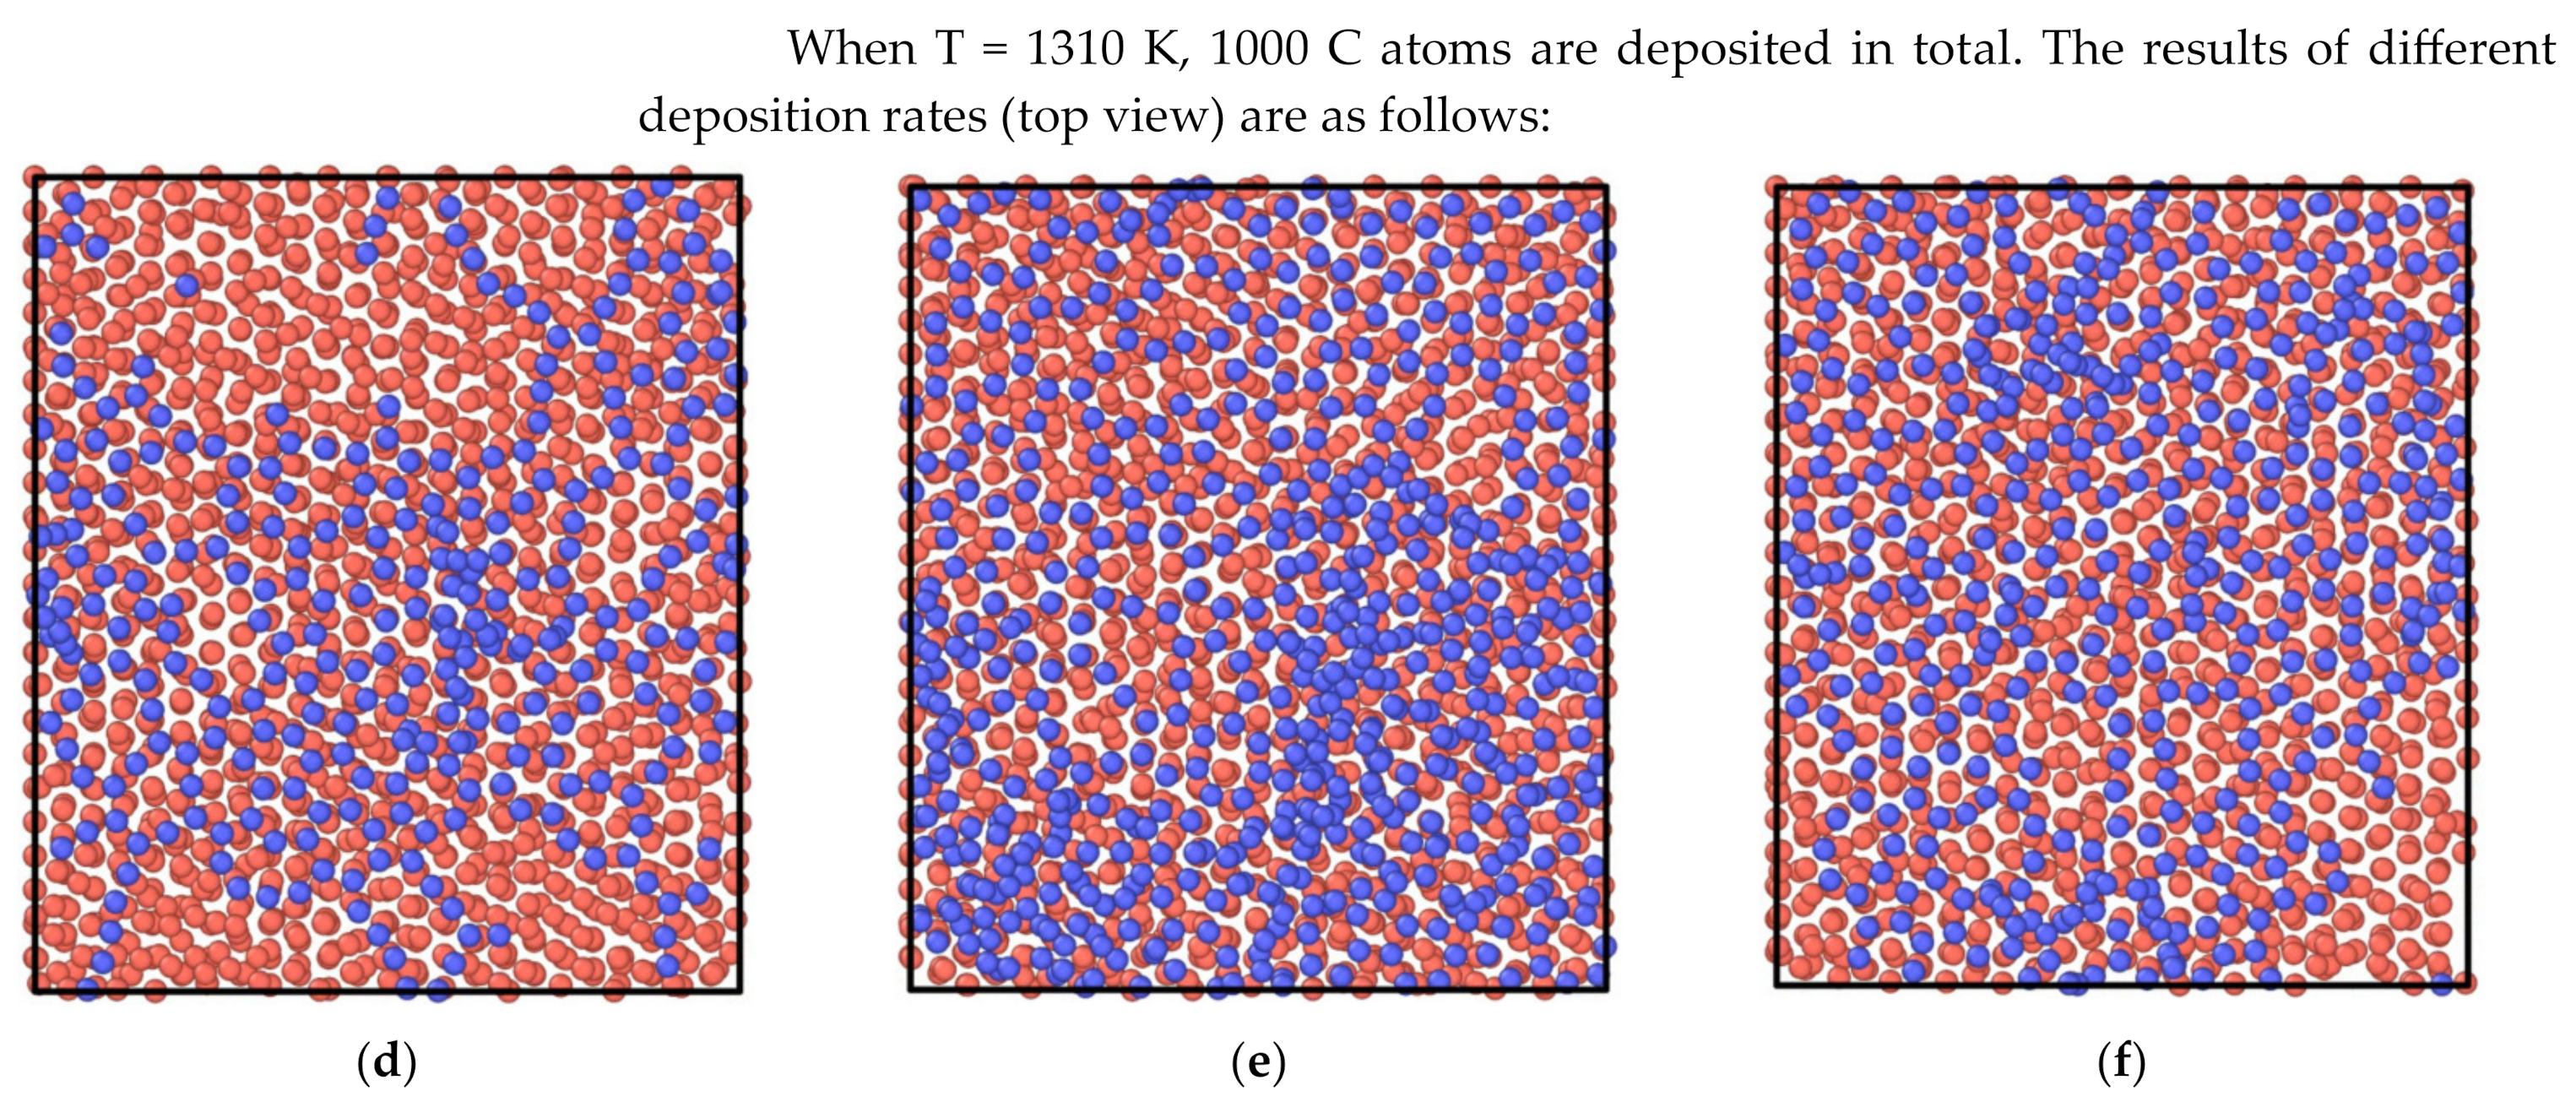
4.3. Influence of Carbon Surface Deposition Rate

In the simulation, the deposition growth temperature of graphene was set at 1290 K and 1310 K to study the effect of the carbon deposition rate on graphene growth. During the deposition growth simulation, the deposition time interval of two adjacent carbon atoms was changed to adjust the specific value of the carbon deposition rate for simulation. The simulation results are shown in Figure 14 and Figure 15 (In the figures, red atoms are Cu atoms, and blue atoms are C atoms).
Figure 14 shows the growth of graphene at different carbon deposition rates (top view). From the top view, it can be seen that graphene does not have a single layer of flat structure but appears as a two-layer or multilayer growth state.
At the same time, the temperature range varies from 1290 K to 1310 K, which affects the pyrolysis of the input gas mixture, resulting in a change in the rate of carbon deposition. When the temperature rises, the carbon atoms produced by gas pyrolysis increase, and the carbon deposition rate accelerates. This indicates that the increase in temperature changes the migration and diffusion of carbon atoms on the surface of copper, resulting in changes in the rate and mass of graphene generation. High temperatures will make carbon atoms quickly diffuse on the surface of copper, which helps carbon atoms to be adsorbed to the carbon chain; thus, the surface quality of graphene is higher when the temperature is 1310 K, compared with 1290 K.
In the process of graphene deposition preparation, a single graphene structure is preferentially formed when carbon atoms are deposited. As the nuclear density gradually increases, the deposited carbon atoms extend in the direction perpendicular to the substrate to form graphene side chains. According to this, it can be concluded that the double layer and multilayer graphene on the copper surface are formed on the basis of the original monolayer deposition. This mechanism of graphene deposition also explains the experimental results of graphene bilayer and multilayer growth, layer by layer, after the completion of monolayer deposition and verifies the results of the macroscopic simulation. The effect of the carbon deposition rate on graphene during the deposition and growth simulation also further revealed the mechanism of graphene deposition and growth on the surface of the copper (111) crystal.
When T = 1290 K, 1000 C atoms were deposited. The results of different deposition rates (top view) are described below.
Figure 15 shows the growth states of graphene under different carbon deposition rates; the results from the top view also show significant differences. As can be seen from Figure 15, no matter if the temperature is 1290 K or 1310 K, when the carbon deposition rate is 1 ps−1 and 10 ps−1, the surface of graphene is relatively coarse; when the carbon deposition rate is 5 ps−1, the surface of the graphene is relatively flat, and the carbon atoms are more evenly distributed; hence, the surface quality is higher. On the one hand, when the carbon deposition rate is relatively low, the nucleation density of graphene at this time is relatively small. For the free carbon atoms, the nucleation density of graphene is more inclined to bond with the formed carbon chains, which leads to the local growth of graphene in the initial stage. On the other hand, when the carbon deposition rate value is relatively high, the nucleation density on the substrate is also high. However, due to temperature fluctuations on the copper surface, its free energy is not uniformly distributed, which leads to different absorption capacities of carbon atoms in different regions, resulting in an uneven distribution on the local area of the deposition surface.
The number of five- and six-membered carbon rings under different carbon deposition densities is also an important reflection of the molecular dynamics simulation results to judge the density of the graphene surface. As can be seen from Figure 15, when the temperature is 1310 K, and the carbon deposition rate is 5 ps−1, the number of five- and six-membered carbon rings is the largest, indicating that the deposited graphene has good quality and high surface density. When the carbon deposition rate is less than 5 ps−1, the number of stable carbon rings also increases with the increase of the carbon deposition rate, indicating that the quality of graphene is improving. However, when the carbon deposition rate is increased to 10 ps−1, the number of stable carbon rings decreases, and the quality of graphene decreases, indicating that too high a carbon deposition rate is not conducive to the surface growth quality of graphene. Therefore, the carbon deposition rate can control the nucleation density of graphene, hence preventing the homogeneity and density of the graphene surface from being affected by too high or too low a nucleation density. It is consistent with the results of Bai et al. [27].

5. Conclusions

In this research, the conditions for graphene growth at temperatures between 1230 K to 1330 K were simulated by chemical vapor deposition in a simplified model of a vertical rotary reactor. The effects of the graphene growth temperature, air intake rate, substrate base rotation rate, and material ratio on the graphene surface deposition rate in a VRD reactor were obtained, and the growth parameters of high-quality and highly compact graphene prepared in the VRD reactor structure were obtained. The effects of growth parameters on the surface deposition rate of graphene in a VRD reactor were simulated. From the macro simulation level, compared with the existing common model, the ideal growing conditions of graphene prepared by the CVD method in the VRD reactor are as follows: growth temperature 1310 K, intake speed 470 mL/min, substrate rotation speed 300 rpm. With a flow rate of H2 at 75 sccm, more uniform graphene with a better surface density and higher quality was obtained under these experimental conditions. Based on the results of the macroscopic simulation, the temperature was controlled within the range of 1290 K to 1310 K; from the perspective of microscopic simulation, molecular dynamics was used to simulate the effect. The simulation showed that the temperature affected the pyrolysis of the input gas mixture from 1290 K to 1310 K, and the result was that the carbon deposition rate was changed. When the temperature rises, the carbon atoms produced by gas cracking will increase, and the carbon deposition rate will accelerate. When the temperature was 1310 K, and the carbon deposition rate was 5 ps−1, the number of five- and six-membered carbon rings on the copper substrate surface was the largest, indicating that the deposited graphene had good quality and high surface density. When the carbon deposition rate was less than 5 ps−1, the number of stable carbon rings increased with the increase in the carbon deposition rate, indicating that the quality of graphene improved. However, when the carbon deposition rate increased to 10 ps−1, the number of stable carbon rings decreased, and the quality of graphene decreased. It would not be conducive to the surface growth quality of graphene. Therefore, the graphene surface deposition rate can control the nucleation density of graphene to prevent the homogeneity and compactness of the graphene surface from being affected by too high or too low a nucleation density of graphene. The preparation of graphene by CVD method using a VRD reactor under atmospheric pressure can not only reduce the equipment requirements reduce the preparation cost but also be safer.

Author Contributions

Conceptualization, N.Y.; methodology, B.Y. and D.Z.; software, F.C., X.Y. and B.Y.; validation, B.Y., F.C., X.Y. and B.Y.; formal analysis, B.Y. and F.C.; resources, Y.H. and G.X.; data curation, D.Z., F.C. and B.Y.; writing- original draft preparation, B.Y. and N.Y.; writing review and editing, B.Y.; supervision, Y.H. and G.X.; project administration, Y.H.; funding acquisition, B.Y. All authors have read and agreed to the published version of the manuscript.

Funding

This work was financially supported by the National Natural Science Foundation of China (Nos. 52062005 and 52074141), the Key Science and Technology Support Project of Guizhou Province (No. [2021]326), Science and Technology Foundation of Guizhou Province, China (Nos. [2018]1173 and [2020]1Y163), National Natural Science Foundation of China (No. 21861012), Natural Science Foundation of Guizhou Education Commission (No. 2018148), Guizhou Science & Technology Commission (Nos. 20201Z005 and 20191157), Science and Technology Foundation of Guizhou Province, China ([2019]1158 and ZK[2021] Common 051), and Guizhou Provincial Teaching Project ([KY 2018] 016).

Institutional Review Board Statement

Not applicable.

Informed Consent Statement

Informed consent was obtained from all the subjects involved in the study.

Data Availability Statement

No new data were created or analyzed in this study. Data sharing was not applicable in this study.

Conflicts of Interest

The authors declare no conflict of interest.

References

  1. Novoselov, K.S.; Geim, A.K.; Morozov, S.V.; Jiang, D.E.; Zhang, Y.; Dubonos, S.V.; Grigorieva, I.V.; Firsov, A.A. Electric field effect in atomically thin carbon films. J. Sci. 2004, 306, 666–669. [Google Scholar] [CrossRef] [PubMed] [Green Version]
  2. Marcano Daniela, C.; Kosynkin, D.V.; Berlin, J.M.; Sinitskii, A.; Sun, Z.; Slesarev, A.; Alemany, L.B.; Lu, W.; Tour, J.M. Improved synthesis of graphene oxide. J. ACS Nano 2010, 4, 4806–4814. [Google Scholar] [CrossRef] [PubMed]
  3. Tromp, R.M.; Hannon, J.B. Thermodynamics and Kinetics of Graphene Growth on SiC(0001). J. Phys. Rev. Lett. 2009, 102, 106104. [Google Scholar] [CrossRef] [PubMed]
  4. Yoo, M.S.; Lee, H.C.; Lee, S.; Lee, S.B.; Lee, N.S.; Cho, K. Chemical Vapor Deposition of Bernal-Stacked Graphene on a Cu Surface by Breaking the Carbon Solubility Symmetry in Cu Foils. J. Adv. Mater. 2017, 29, 1700753.1–1700753.8. [Google Scholar] [CrossRef]
  5. Gao, Z.; Zhang, Q.; Naylor, C.H.; Kim, Y.; Abidi, I.H.; Ping, J.; Ducos, P.; Zauberman, J.; Zhao, M.Q.; Rappe, A.M.; et al. Crystalline Bilayer Graphene with Preferential Stacking from Ni–Cu Gradient Alloy. J. ACS Nano 2018, 12, 2275–2282. [Google Scholar] [CrossRef]
  6. Liu, N.; Fu, L.; Dai, B.; Yan, K.; Liu, X.; Zhao, R.; Zhang, Y.; Liu, Z. Universal Segregation Growth Approach to Wafer-Size Graphene from Non-Noble Metals. J. Nano Lett. 2011, 11, 297–303. [Google Scholar] [CrossRef]
  7. Cai, J.; Ruffieux, P.; Jaafar, R.; Bieri, M.; Braun, T.; Blankenburg, S.; Muoth, M.; Seitsonen, A.P.; Saleh, M.; Feng, X.; et al. Atomically precise bottom-up fabrication of graphene nanoribbons. J. Nat. 2010, 466, 470–473. [Google Scholar] [CrossRef]
  8. Giovanni, C.; Letizia, S.; Luca, V. Influence of Defects and Heteroatoms on the Chemical Properties of Supported Graphene Layers. Coatings 2022, 12, 397. [Google Scholar]
  9. Li, G.; Huang, S.-H.; Li, Z. Gas-phase dynamics in graphene growth by chemical vapour deposition. Phys. Chem. Chem. Phys. 2015, 17, 22832–22836. [Google Scholar] [CrossRef]
  10. Habuka, H.; Suzuki, J.; Takai, Y.; Hirata, H.; Mitani, S.-I. Silicon epitaxial growth process using trichlorosilane gas in a single-wafer high-speed substrate rotation reactor. J. Cryst. Growth 2011, 327, 1–5. [Google Scholar] [CrossRef]
  11. Mitrovic, B.; Parekh, A.; Ramer, J.; Merai, V.; Armour, E.A.; Kadinski, L.; Gurary, A. Reactor design optimization based on 3D modeling of nitrides deposition in MOCVD vertical rotating disc reactors. J. Cryst. Growth 2006, 289, 708–714. [Google Scholar] [CrossRef]
  12. Mitrovic, B.; Gurary, A.; Quinn, W. Process conditions optimization for the maximum deposition rate and uniformity in vertical rotating disc MOCVD reactors based on CFD modeling. J. Cryst. Growth 2007, 303, 323–329. [Google Scholar] [CrossRef]
  13. Kadinski, L.; Merai, V.; Parekh, A.; Ramer, J.; Armour, E.A.; Stall, R.; Gurary, A.; Galyukov, A.; Makarov, Y. Computational analysis of GaN/InGaN deposition in MOCVD vertical rotating disk reactors. J. Cryst. Growth 2004, 261, 175–181. [Google Scholar] [CrossRef]
  14. Habuka, H.; Tsuji, M. Silicon Epitaxial Growth Rate and Transport Phenomena in a Vertical Stacked-Type Multi-Wafer Reactor. Jpn. J. Appl. Phys. 2012, 51, 6701. [Google Scholar] [CrossRef]
  15. Makino, S.; Inagaki, M.; Nakagawa, M. Laminar-Turbulence Transition over the Rotor Disk in an Enclosed Rotor-Stator Cavity. Flow Turbul. Combust. 2015, 95, 399–413. [Google Scholar] [CrossRef]
  16. Santen, H.V.; Kleijn, C.R.; Van den Akker, H.E.A. Computational Technologies for Fluid/Thermal Structure/Chemical Systems with Industrial Applications; Kudriavtsev, V.V., Cheng, W., Kleijn, C.R., Wano, S., Souli, M., Eds.; ASME International: New York, NY, USA, 1989; p. 211. [Google Scholar]
  17. Evans, G.; Greif, R. Forced flow near a heated rotating disk: A similarity solution. Numer. Heat Transf. 1988, 14, 373. [Google Scholar] [CrossRef]
  18. Mazaev, K.M.; Lobanova, A.V.; Yakovlev, E.V.; Talalaec, R.A.; Galyukov, A.O.; Makarov, Y.N.; Gotthold, D.; Albert, B.; Kadinski, L.; Peres, B. Modeling and experimental analysis of AlGaN MOVPE in commercial vertical high-speed rotating-disk reactors. J. Cryst. Growth 2004, 261, 190–196. [Google Scholar] [CrossRef]
  19. Lobanova, A.; Mazaev, K.; Yakoviev, E.; Talalaev, R.; Galyukov, A.; Gotthold, Y.M.D.; Albert, B.; Kadinski, L.; Peres, B. Parametric studies of III-nitride MOVPE in commercial vertical high-speed rotating disk reactors. J. Cryst. Growth 2004, 266, 354–362. [Google Scholar] [CrossRef]
  20. Kataoka, T.; Sato, Y.; Ohmine, T. Chemical Vapor Deposition: Proceedings of the Fourteenth International Conference and EUROCVD-11. 1997, p. 1319. Available online: https://searchworks.stanford.edu/view/3769748 (accessed on 27 June 2023).
  21. Sato, Y.; Ohmine, T. Extended Abstracts of the 1991 International Conference on Solid State Devices and Materials. 1991, p. 717. Available online: https://confit.atlas.jp/guide/organizer/ssdm/ssdm1991/top?initFlg=true (accessed on 27 June 2023).
  22. Kremer, D.M.; Davis, R.W.; Moore, E.F.; Maslar, J.E.; Burgess, D.; Ehrman, S.H. An Investigation of Particle Dynamics in a Rotating Disk Chemical Vapor Deposition Reactor. J. Electrochem. Soc. 2003, 150, G127–G139. [Google Scholar] [CrossRef]
  23. ANSYS, Inc. ANSYSFluentTheory Guide; ANSYS, Inc.: Canonsburg, PA, USA, 2021; pp. 235–237. [Google Scholar]
  24. Coltrin, M.E.; Kee, R.J.; Evans, G.H. A Mathematical Model of the Fluid Mechanics and Gas-Phase Chemistry in a Rotating Disk Chemical Vapor Deposition Reactor. J. Electrochem. Soc. 1989, 136, 819–829. [Google Scholar] [CrossRef]
  25. Fan, Y.W. Silane pyrolysis vapor deposition reaction model and numerical simulation of fluidized bed CVD reactor. East China Univ. Sci. Technol. 2017, 28–29. (In Chinese) [Google Scholar]
  26. Wauters, S.; Marin, G.B. Kinetic Modeling of Coke Formation during Steam Cracking. Ind. Eng. Chem. Res. 2002, 41, 2379–2391. [Google Scholar] [CrossRef]
  27. Becker, A.; Hüttinger, K. Chemistry and kinetics of chemical vapor deposition of pyrocarbon—IV pyrocarbon deposition from methane in the low temperature regime. Carbon 1998, 36, 213–224. [Google Scholar] [CrossRef]
  28. Tao, H.; Chen, H.; Xie, J.; Shu, Z.; Hu, Y.; Lu, H. Fluid Flow Uniformity Index Based on area weighted average velocity and mass Weighted average Velocity. J. Chem. Eng. 2010, 61, 116–120. [Google Scholar]
  29. Brüggert, M.; Hu, Z.; Hüttinger, K.J. Chemistry and kinetics of chemical vapor deposition of pyrocarbon—VI. influence of temperature using methane as a carbon source. Carbon 1999, 37, 2021–2030. [Google Scholar] [CrossRef]
  30. Hu, Z.; Hüttinger, K.J. Chemistry and kinetics of chemical vapor deposition of pyrocarbon: VIII. Carbon deposition from methane at low pressures. Carbon 2001, 39, 433–441. [Google Scholar] [CrossRef]
  31. Vlassiouk, I.; Regmi, M.; Fulvio, P.; Dai, S.; Datskos, P.; Eres, G.; Smirnov, S. Role of hydrogen in chemical vapor deposition growth of large single-crystal graphene. ACS Nano 2011, 5, 6069–6076. [Google Scholar] [CrossRef]
  32. Zou, Z.; Dai, B.; Liu, Z. Growth and process engineering of graphene by chemical vapor deposition. Sci. China Chem. 2013, 17. (In Chinese) [Google Scholar]
  33. Zi, J.H.; Hüttinger, K.J. Mechanisms of carbon deposition—A kinetic approach. Carbon 2002, 40, 624–628. [Google Scholar]
  34. Chen, Q.; Song, Q.; Yi, X.; Chen, Q.; Wu, W.; Huang, M.; Zhao, C.; Wang, S.; Zhu, H. Growth of high quality bilayer graphene on softened copper foils by atmospheric chemical vapor deposition. Sci. China Mater. 2020, 63, 1973–1982. [Google Scholar] [CrossRef]
  35. Bai, Q.; Dou, Y.; He, X.; Zhang, A.; Guo, Y. Deposition and growth mechanism of graphene on copper crystal surface based on molecular dynamics simulation. Acta Phys. Sin. 2020, 69, 348–356. (In Chinese) [Google Scholar] [CrossRef]
  36. Poorsargol, Z. The role of hydroxyl and carboxyl functional groups in adsorption of copper by carbon nanotube and hybrid graphene-carbon nanotube: Insights from molecular dynamic simulation. Adsorption 2020, 26, 397–405. [Google Scholar] [CrossRef]
Figure 1. Physical diagram of the monolithic high-speed base vertical rotary disk (VRD)reactor used in the study. Copyright © 2016 Elsevier B.V. and Journal of Crystal Growth.
Coatings 13 01184 g001
Figure 2. Schematic diagram of a simplified VRD reactor.
Coatings 13 01184 g002aCoatings 13 01184 g002b
Figure 3. Grid profile of simplified VRD reactor model.
Coatings 13 01184 g003
Figure 4. Simplified chemical reaction mechanism of graphene prepared by rotating CVD.
Coatings 13 01184 g004
Figure 6. Comparison of carbon surface deposition rates between a rotating CVD reactor and a conventional reactor model at different reaction temperatures. (a) Comparison of surface deposition rate between VRD and general straight tube model under atmospheric pressure and (b) Comparison of surface deposition rate between VRD and general straight tube model under low pressure.
Coatings 13 01184 g006
Figure 7. Cloud map of the influence of different intake flow rates on deposition rates. (a) T = 1290 K. (b) T = 1310 K. (c) T = 1290 K. (d) T = 1310 K. (e) T = 1290 K. (f) T = 1310 K.
Coatings 13 01184 g007aCoatings 13 01184 g007b
Figure 8. Effect of different intake flow rates on graphene surface deposition rates. (a) T = 1290 K and (b) T = 1310 K.
Coatings 13 01184 g008
Figure 9. Effects of different intake flow rates on graphene surface deposition rate uniformity.
Coatings 13 01184 g009
Figure 10. Influence of different substrate speeds on deposition rate. (a) w = 300 rpm. (b) w = 600 rpm. (c) w = 900 rpm. (d) w = 1200 rpm. (e) w = 1500 rpm.
Coatings 13 01184 g010
Figure 11. Effect of different H2 flows on deposition rate. (a) Q(H2) = 60 sccm. (b) Q(H2) = 75 sccm. (c) Q(H2) = 90 sccm.
Coatings 13 01184 g011aCoatings 13 01184 g011b
Figure 12. The effect of H2 flow rate on graphene surface deposition rate at T = 1290 K–1310 K.
Coatings 13 01184 g012
Figure 13. Two-dimensional model of graphene deposition on copper substrate surface. (Copper atoms are shown in red).
Coatings 13 01184 g013
Figure 14. Growth of graphene at different carbon deposition rates (front view). (1) 100 ps: (1-a) 1 ps−1. (1-b) 5 ps−1. (1-c) 10 ps−1. (2) 300 ps: (2-a) 1 ps−1. (2-b) 5 ps−1. (2-c) 10 ps−1. (3) 500 ps: (3-a) 1 ps−1. (3-b) 5 ps−1. (3-c) 10 ps−1. (4) 100 ps: (4-a) 1 ps−1−1. (4-b) 5 ps−1. (4-c) 10 ps−1. (5) 300 ps: (5-a) 1 ps−1. (5-b) 5 ps−1. (5-c) 10 ps−1. (6) 500 ps: (6-a) 1 ps−1. (6-b) 5 ps−1. (6-c) 10 ps−1.
Coatings 13 01184 g014aCoatings 13 01184 g014b
Figure 15. Growth of graphene at different carbon deposition rates (top view). (a) 1 ps−1. (b) 5 ps−1. (c) 10 ps−1. (d) 1 ps−1. (e) 5 ps−1. (f) 10 ps−1.
Coatings 13 01184 g015aCoatings 13 01184 g015b
Table 1. The physical properties of various materials.
Physical ParameterCH4H2ArC <S>
Density (kg/m3)0.66790.081891.62282000
Cp (j/kg·k)222214,283520.641220
Thermal conductance (w/m·k)0.03320.16720.0158
Viscosity (kg/m·s)1.087 × 10−58.411 × 10−62.215 × 10⁻⁵
△Hm (j/kmol)−7.489518 × 1070−3117.71−101.268
△Sm (j/kmol·k)186,040.1130,579.1154,719.35731.747
Range of temperature: 1230~1330 K; inlet velocity: 450~490 mL/min.
Disclaimer/Publisher’s Note: The statements, opinions and data contained in all publications are solely those of the individual author(s) and contributor(s) and not of MDPI and/or the editor(s). MDPI and/or the editor(s) disclaim responsibility for any injury to people or property resulting from any ideas, methods, instructions or products referred to in the content.

