Article

A Computational Study of Particle Mass Transport during Melting of NePCM in a Square Cavity with a Single Adiabatic Side

by
Yousef M. F. El Hasadi
Frederik Hendrikstraat, 2628 SX Delft, The Netherlands
Coatings 2023, 13(4), 739; https://doi.org/10.3390/coatings13040739
Submission received: 16 January 2023 / Revised: 19 March 2023 / Accepted: 27 March 2023 / Published: 5 April 2023
(This article belongs to the Special Issue Nanostructure-Enhanced Phase Change Materials for Energy Storage)

Abstract

:
Nanostructured phase change materials (NePCM) are phase change materials that contain different types and sizes of colloidal I removed the word sizes particles. Many investigations in the literature assess those type of phase change materials to investigate their thermal performance. However, there is a discrepancy between the experimental observations and numerical results of the melting process of the NePCM because most numerical models do not count for the mass transfer of the particles. In the current work, we will investigate the melting process of NePCM that consists of copper nanoparticles suspended in water for the geometry of a square cavity, heated from the two sides, cooled from one side, and the remaining side is thermally insulated. Our numerical model will account for the mass transfer of the particles using a one-fluid mixture and the enthalpy porosity model for accounting for the phase change process. We found that adding the particles will lead to the deceleration of the melting process, as described by the experiments, because of the reduction of the convection intensity. We found that for NePCM suspension containing 10% of nanoparticles by mass, the deceleration of melting will be about 2.2% compared to pure water. Most of the particles are convected away by the flow cells toward the bottom side of the cavity, especially near the isolated right side of the cavity. Our findings indicate that incorporating mass transport of particles leads to a significantly improved prediction of the melting behavior of the NePCM.

1. Introduction

To mitigate the negative impacts of climate change on the welfare of countries around the world, a global transition to a sustainable, fossil fuel-free economy is necessary [1]. Solar energy is a crucial component of this transition and offers a carbon-free energy source. However, to make solar energy viable for large-scale industrial applications, efficient thermal storage systems must be developed [2]. One promising storage solution is the use of phase change materials (PCMs) to store thermal energy from various sources, including solar and waste heat [2,3,4]. By incorporating PCMs into solar energy systems, we can ensure a reliable and sustainable energy source for industry and reduce our reliance on fossil fuels.
Phase change materials (PCMs) store and release energy during their phase change process of melting and solidification. However, their low thermal conductivity can significantly slow thermal energy’s charging and discharging cycle [2]. To enhance the performance of the phase change materials, various methods have been proposed, including adding high-conductivity additives or using finned tubes [2,5,6,7,8]. Another approach is to fill phase change materials into a porous, highly conductive structure to improve their melting performance. However, ensuring that the porous medium has substantial porosity is essential to accommodate a large quantity of PCM [2]. With these enhancements, PCMs can become a more efficient and effective method of storing and utilizing thermal energy in various industrial applications.
Li et al. [9] conducted a study on the melting process of nano-enhanced phase change materials (NePCM) in a rectangular cavity experimentally. They analyzed two cavity geometries with different aspect ratios and examined NePCM samples prepared by adding graphene nanoplatelets (GNP) into 1-tetradecanol. The investigation results showed that increasing the GNP loading leads to the deterioration of both the heat storage and heat transfer rates during melting due to a significant increase in viscosity that negatively impacted natural convective heat transfer. These findings suggest that using NePCM in rectangular cavity geometry may not enhance heat storage rates as the viscosity growth outweighs thermal conductivity enhancement. Additionally, the investigation indicates that previous numerical predictions on melting accelerations and heat transfer enhancements reported in the literature may be overestimated due to underestimating the harmful effects of viscosity growth [9].
The literature contains several studies that investigate the numerical simulations of Nano-Enhanced Phase Change Materials (NePCMs) in different geometries [10,11,12,13,14,15,16]. For instance, Feng et al. [10] focused on NePCM melting within a rectangular cavity heated from the bottom side, resulting in the formation of convection cells due to density differences between the bottom and top fluid. This particular model accounts only for the effect of nanoparticles on transport properties such as viscosity and thermal conductivity and does not consider the mass transport of the particles. The authors used two nanoparticle loadings of ϕ = 5 and 10%. They found that the melting time for NePCM decreases as the volume fraction of particles increases, which is in contrast to experimental observations [17].
On the other hand, Faraji et al. [16] present a numerical study on the melting process of NePCM that contains Cu nanoparticles suspended in n-eicosane paraffin. They investigated the effect of adding nanoparticles and their shape on the melting rate using the enthalpy-porosity method to solve the Navier-Stokes and energy equations. The finite volume method was used to discretize the governing equations, and the SIMPLE algorithm was employed for velocity and pressure coupling. The results indicate that suspending nanoparticles with a volume fraction of 4% reduces the maximum operating temperature of an electronic component by 2.9 C, and the melting time decreases from 8630 s to 8290 s. Moreover, suspending nanoparticles into eicosane with a shape factor of 16.1 reduces the maximum operating temperature by 2.5 C. However, the enhancements that the authors report could be an artificial result of their model due to the ignorance of the mass transport of the particles in their model.
Experiments show that particles tend to agglomerate and cluster during the phase change process of melting. Agglomeration affects their performance significantly and can be the source of the discrepancy between experiments and simulations. For this reason, a model that counts for the mass transport of the particles is necessary to obtain a broader understanding of the complex process of melting of NePCM. The only model that counts for the mass transport of particles during the freezing and melting process of colloidal suspensions ( NePCM is considered a form of colloidal suspensions ) is that proposed by El Hasadi, and Khodadadi [18]. Which is a special version of the one fluid mixture model used by the material science community for alloy casting simulations [19]. El Hasadi and Khodadadi used the one fluid mixture model to investigate the freezing process of the NePCM [20,21,22,23], and El Hasadi for melting of NePCM [24]. There are a few other investigations that used a similar model developed by El Hasadi and Khodadadi [18] to model the freezing process of the NePCM [25,26,27] they showed the extreme importance of the redistribution of the particles in the overall performance of the NePCM.
Due to the significant lack of investigations that consider the transport of particles, which would provide a more realistic picture of the melting behaviour of NePCM. In this study, we will focus on the melting process of a NePCM consisting of copper nanoparticles with a diameter of 2 nm suspended in water. The NePCM will be confined within a square cavity and subjected to heating from the left and bottom sides, while the top side will be cooled, and the remaining sides will be thermally insulated. To investigate the effect of adding particles during the melting process, we will compare the thermal performance of the NePCM with that of pure water. Our simulations will be conducted with a single particle loading of 10% by mass, which will allow us to evaluate the impact of the nanoparticles on the melting process.

2. Mathematical Model

One of the fundamental assumptions that we have made in this study is that the NePCM will behave like a binary mixture, which significantly simplifies the complexity of the mathematical model we are using. This assumption allows us to disregard direct interaction forces between the particles and the fluid, as well as between the particles themselves. These interactions, however, are still accounted for in the thermo-physical properties of the mixture. The current model is developed by the author, and has undergone rigorous testing and validation for various cases of solidification and melting of NePCM suspensions [18,20,21,22,24]. The basic governing equations are the following:
Continuity:
· U = 0 ,
Momentum
ρ U t + ρ ( U · ) U = p + μ 2 U ρ C m ( 1 λ ) 2 λ 3 U + ( ρ β ) g T T ref e y ,
Energy:
ρ c p T t + ρ c p U · T = · ( k T ) ρ L λ t ,
Species:
ϕ w t + U · ϕ w = · D B ϕ w + D T T T
The variables U , T, ϕ w represent the velocity vector, temperature, and mass fraction of the particles, respectively. The Darcy term in the momentum equations plays a critical role in regulating the velocity values during the melting process, as noted by Voller et al. [28]. This term acts as a damping mechanism that reduces the flow rate in the presence of high porosity or permeability, thereby preventing instabilities and maintaining a stable and controlled melting process. In the mushy zone, the local mass fraction is determined using a simple mixture formula, given by:
ϕ w = λ ϕ w l + ( 1 λ ) ϕ w s ,
The variable λ represents the liquid fraction, while the subscripts l, s denote the liquid and solid states, respectively. The momentum equations include terms based on the Darcy law, for which we have set the porosity constant C m to a value of 10 5 kg/m 3 s. In addition, we have disregarded particle diffusion in the heat flux vector due to the low value of the diffusion coefficient for nano-particles [29].

2.1. Initial and Boundary Conditions

The geometry under consideration in this study is a square cavity with the right side thermally insulated. For the other three sides, we are imposing constant temperature boundary conditions, with the temperature on the left and bottom sides set at 300 K, and the temperature on the top side set at 270 K. We are using a single value for the mass concentration of the particles, ϕ w = 10%, and set the initial temperature within the cavity at T i n = 272 K, the geometry of the cavity used in the current investigation is show in Figure 1.
In this study, we have used 10,000 grid points distributed uniformly throughout the cavity and have employed the finite volume numerical method for our simulation. For more information about the specific details of the numerical method used and the mixture models employed for transport properties, there is extensive information in the following references [18,24].

2.2. Effective Thermo-Physical Properties

We will assume that the suspension in the liquid form consists of hard-sphere particles that prevent the particles from clustering. We will also assume that the properties of the solid and the liquid phases are constant for simplification. While, those properties change with the concentration of the particles, which is a typical property of colloidal particles. We obtain the density, heat capacity, and part of the Boussinesq term from the following equations.
ρ = ( 1 ϕ ) ρ f + ϕ ρ p ρ c p = ( 1 ϕ ) ρ c p f + ϕ ρ c p p , ρ β = ( 1 ϕ ) ( ρ β ) f + ϕ ( ρ β ) p .
where ϕ , ρ , and β , are the volume fraction of the particles, the density, and the thermal expansion coefficient, while the subscripts of f, and p refers to the liquid (solid), and particle phases respectively. The relation between the volume fraction of the particles and their mass fraction is the following:
ϕ = ρ f ϕ w ρ f ϕ w + ρ p 1 ϕ w
The thermal conductivity of the NePCM is calculated as the following:
k = k 1 + k 2
where k 1 is the Maxwell contribution to the thermal conductivity:
k 1 = k f k p + 2 k f 2 ϕ k f k p k p + 2 k f + ϕ k f k p
and k 2 is the contribution due to the dispersion:
k 2 = C k ρ c p | U | ϕ d p
The redistribution of the particles will affect the mass diffusivity of the particles significantly. For this reason, we will define a compressibility factor as a function of the volume fraction recommended by Peppin et al. [30]. The constant C k is a constant obtained from Wako, and Kaguei [31]. The compressibility equation is the following:
z ( ϕ ) = 1 + 4 1 0.64 ϕ + 10 4 0.64 ϕ 2 + 18 10 0.64 ϕ 3 1 ϕ 0.64
The mass diffusivity of the particles can be calculated from the following equation:
D B = D o ( 1 ϕ ) 6 d ( ϕ z ) d ϕ
where D 0 is the Einstein diffusivity:
D 0 = T k B 3 π d p μ
The theromophoretic diffusivity is evaluated from the following relation:
D T = β k μ ρ ϕ
where β k is a non-dimensional parameter that is a function of the thermal conductivities described by [29], the variation of the latent heat of fusion of the NePCM is given as the following:
ρ L = ( 1 ϕ ) ( ρ L ) f
To account for the change of the liquid and solidus temperatures of the NePCM as a function of the volume fraction of the particles, we will utilize the following simple linear phase diagram:
T Liq = T m m l ϕ w T Sol = T m m l k 0 ϕ w
where T Liq , and T Sol is the solidus and the liquidus temperatures of the the NePCM suspension. The k 0 is the segregation coefficient, which controls the ratio of the mass fraction of the particles on the solid and liquid sides of the interface. We will use the value of 0.1 for the segregation coefficient in our simulations. We will utilize the following equation to calculate the melting temperature:
m l = k B T m 2 v p ρ L f
The relation that relates the liquid fraction λ with the T Liq , and T Sol temperatures is the following:
λ = 0 for T < T Sol λ = T T Sol T Liq T Sol for T Sol < T < T Liq λ = 1 for T > T Liq
The thermophysical properties of the water, and the NePCM are listed in Table 1, and for more information, I listed the properties of the NePCM at the maximum mass fraction of particles ϕ w = 10% in Table 2.
The comparison of the current numerical results with the results of experiments is difficult due to several reasons. The most obvious reason is that we do not have any experimental results according to our knowledge for the redistribution of the nano-particles during the NePCM melting process, because it is a difficult process to measure the mass distribution of the particles, since all the NeCPM suspensions are difficult to see through them, and thus estimating the particle redistribution. Not knowing the particle redistribution, makes it very difficult to obtain an estimation for the values of the thermal physical properties of the NePCM, which makes the interpretation of either the values of the velocity, and the temperature distributions non physical. We will make a compression with our previous publication [24] results for the case of melting of NePCM from the vertical side, with mass fraction of particles of ϕ w = 10%, the results of the compression is shown in Table 3.

3. Results

We will present our results for the two distinct cases of pure water ( ϕ = 0.0), and that of NePCM with ϕ w = 10% ( ϕ = 1.22% by volume), the thermal Rayleigh number ( R a = ρ g β ( T h T c ) H 3 μ k ρ c p ) for the two cases is 6 ×   10 4 , and 5.61 ×   10 4 respectively. The results will include the evolution of the solid-liquid interface, temperature, and the concentration of the particles.
Figure 2 shows the solid-liquid interface evolution for the case of pure water ( ϕ w = 0). For a better understanding of the role of the flow field in the development of the melting process, we superimposed the streamlines with the liquid fraction field. At the start of the melting process (t = 1 s) the solid-liquid interface evolves from the left, and the bottom sides. The interface evolves from the two sides in the shape of straight lines, which indicates that the main active heat transfer mechanism is conduction. However, as the time proceeds further (t = 6 s), the melting portion of frozen water is increased. At the same time, a clockwise flow cell is evolved near the cavity’s left side, indicating the start of the thermal convection away from the vertical wall. As the time proceeds to times t = 25 s and 50 s, the solid-liquid interface takes the curved shape both in the vertical and bottom sides due to the high intensity of the convection cells generated. The clock-wise large cell near the vertical wall grows in size, and starts to occupy a big portion of the duct. In the meantime, the two flow cells are formed in the bottom side of the cavity, with one rotating counter-clockwise and the other rotating clockwise, which will intensify the mixing of the warm water layers at the bottom with cooler layers from the top.
The temperature profile evolution is shown in Figure 3. At the begging of the melting process, the layers of hot temperature from both the left and bottom sides are advancing nearly at the same rate due to the dominance of the conduction heat transfer mechanism. While as the melting process proceeds further, the hot layers of water attached to the vertical side penetrate more considerable distances into the centre of the cavity compared to those from the bottom, this is due to the higher intensity of the convection near the vertical wall compared to the area near the bottom wall.
For the case of the NePCM colloid with a mass fraction of particles ϕ w = 10%, the evolution of the solid-liquid interface is shown in Figure 4. The development of the interface at the early stages of the melting t = 2, and 6 s is similar to the case of pure water ( ϕ w = 0). However, at the later stages, where the convection mechanism is the dominant heat transfer mechanism, there is a difference in the fluid recirculation cell intensity compared with the pure water case ( ϕ w = 0). This difference is obvious for the two counter-rotating cells near the bottom wall; their size is smaller compared to the pure water case. The shape of the solid-liquid interface for NePCM is similar in general to that of pure water case ( ϕ w = 0).
The temperature profiles for the NePCM with ϕ w = 10% are shown in Figure 5. The intensity of mixing of the cold and hot layers is lower than the pure water case, especially in the duct sector near the bottom wall. We can explain the deterioration of thermal mixing for the case of the NePCM compared to the pure water case by the reduction of the value of the Rayleigh number by 6.67% due the increase of the viscosity of the mixture. Adding the particles helped enhance the thermal conductivity of NePCM compared to the pure water case by 3.83%, which was not sufficient to make a significant difference in the melting rate of the NePCM compared to the water, especially during the dominance of conduction. To illustrate further the thermal performance of the NePCM, we will plot the average liquid fraction at different time intenseness as shown in Figure 6. The average liquid fraction for both pure water and NePCM at the beginning of the melting process is identical, indicating that the melting speed for both cases is similar. The increase of the thermal by 3.83%, for the NePCM suspension was not sufficient enough to influence the heat transfer rate during the dominance of conduction, in which the thermal conductivity is the main transport property that controls the process. The concept of the NePCM is to increase thermal conductivity by suspending high conductive particles. However, the current investigation shows that we need to use a high volume fraction of particles to speed up melting and freezing times. However, increasing the volume fraction will lead to the agglomeration of the particles, leading to a substantial change in the viscosity and the melting temperature, which are not desired properties for an efficient thermal storage process. An alternative solution to non-active particles, such as the cooper particles we used in the current investigation, is the use of self-propelled particles instead that can reduce the viscosity and increase the thermal conductivity as described by El Hasadi, and Crapper [32,33]. As time progresses, we can see that the melting process of the NePCM is decelerating compared to pure water. This is consistent with several experimental observations in the literature, such as those of Zeng et al. [17].
One key element that plays a significant role in NePCM performance is how the particles will redistribute during the melting process. Because in multi-phase systems such as NePCM, A single non-dimensional parameter such as the Rayleigh number can not only be used to make accurate predictions about the system. Because of the system’s multi-dimensional nature, you need to take into account other influential variables, such as the distribution of the nanoparticles in our case. The distribution of the particles during the melting process of the NePCM with ϕ w = 10% is shown in Figure 7. One of the parameters that control the process is the segregation coefficient k 0 we set its numerical value to 0.1, which is suitable for phase change problems as we showed in our previous works [18,20]. At the early stages of the melting, the particles are rejected from the frozen NePCM due to thermodynamic constraints [34]. For the t = 1, 2 s, the particles accumulate at the melted part of the NePCM near the bottom wall. Also, the particles in the area near the left vertical wall are sedimentatiing and diffusing toward the lower part of the duct. The sedimentation of the particles can be explained by the high-density ratio between the copper particles and that of water which is 898.51%. At later times t = 25 and 50 s, there is an apparent accumulation of the particles at the lower part of the duct. In contrast, at the upper part of the cavity, a thin zone with depleted particle concentration is formed. The high concentration of the particles near the wall at the bottom is responsible for reducing the flow intensity of the two counter-rotating cells we described previously.
To further illustrate our findings, we will plot the variation of various output field quantities and thermo-physical properties along a vertical line connecting the two middle points of the horizontal sides of the cavity, at t = 50 s. Figure 8 depicts the variation of the liquid fraction. At the bottom of the cavity, both cases of ϕ w = 10% (NePCM) and 0 (pure water) melt with the same rate. However, as we move further away from the bottom side of the cavity, a clear trend emerges in which pure water melts faster than the NePCM suspension. This deceleration has also been observed in the experiments of Zeng et al. [17], and Li et al. [9]. The temperature profile corroborates the slowdown observed in the liquid fraction profiles, as it shows that the temperature for pure water is higher, especially at higher portions of the duct, as illustrated in Figure 9.
The analysis of the velocity profiles will give a better insight of the evolution of the melting process. Notably, the velocity magnitude is zero at the duct walls due to the non-slip boundary condition and in the upper part of the duct where the solid phase dominates, as shown in Figure 10. In the middle section of the duct, where the convective heat transfer mechanism is active, the velocity profiles of pure water and NePCM exhibit distinct functional forms. For instance, the velocity profile of pure water displays two maxima, while NePCM has only one maximum value. Our results demonstrate that particle redistribution plays a vital role in generating convective cells during the melting process. Furthermore, pure water attains a higher maximum velocity value, indicating a higher convective intensity of the flow. Neglecting the transport of particles while considering NePCM as a single fluid can lead to significant overestimations, such the enhancement of the melting process of NePCM with ϕ = 10% reported by Feng et al. [10]. The reported enhancements are inconsistent with the experimental observations of Zeng et al. [17], and Li et al. [9]. which show an explicit declaration of the melting front with the increase of the volume fraction of the particles. On the other hand, our model accurately captures a significant number of experimental observations such as the reported declarations of the melting front reported above, and is the only one of its kind in the literature.
To gain a deeper understanding of the melting process of the NePCM, we analyzed the thermal conductivity and viscosity variations along a vertical line passing through the midpoint of the cavity’s horizontal sides at time t = 50 s. Figure 11 illustrates the thermal conductivity variation, where we observed that for pure water ( ϕ w = 0), the thermal conductivity remained constant with a value of 0.6 W/m K. However, for NePCM ( ϕ w = 10%), we noticed a variation in thermal conductivity along the vertical line. This variation can be attributed to the redistribution of particles that occurs during the melting process. At the lower side of the cavity where the NePCM has completely melted, the thermal conductivity is slightly higher than that of the solid phase of the NePCM due to the concentration of particles being marginally more elevated in the melted phase. Comparing the thermal conductivities of the melted phase of NePCM and pure water, we observed a difference of 4%, which is an acceptable value for thermal conductivity enhancement in a dispersed colloidal solution. The fluctuations in the thermal conductivity value are due to the formation of a mushy zone where solid and liquid phases co-exist.
Moving towards the upper part of the duct, where the NePCM did not melt and remained in a solid phase, the thermal conductivity value corresponds to the initial thermal conductivity value of the NePCM suspension before the melting process began. Figure 11 depicts that for a significant part of the cavity, the thermal conductivity values are even higher than the initial thermal conductivity value of NePCM due to the redistribution of particles.
Figure 12 shows the variation in viscosity under the same conditions as that for thermal conductivity. For pure water, the viscosity remains constant with a value of 8.9 × 10 4 Pa s. In contrast, for NePCM ( ϕ w = 10%), the viscosity is increased due to the redistribution of particles. The difference between the viscosity of the suspension at the melting part and that of pure water is 3.37%. We observed that the enhancement of viscosity is lower than that of thermal conductivity by about a percent. This result indicates that for our case, the NePCM had better thermal transport properties than pure water and did not suffer a significant increase in viscosity, as experimental investigation reports. However, even with enhanced therm-physical properties, the NePCM melted slower than pure water.

4. Conclusions

In the current investigation, for the first time, we investigated numerically the melting process of NePCM, consisting of water and copper nanoparticles with a size of 2 nm. The main conclusions are the following:
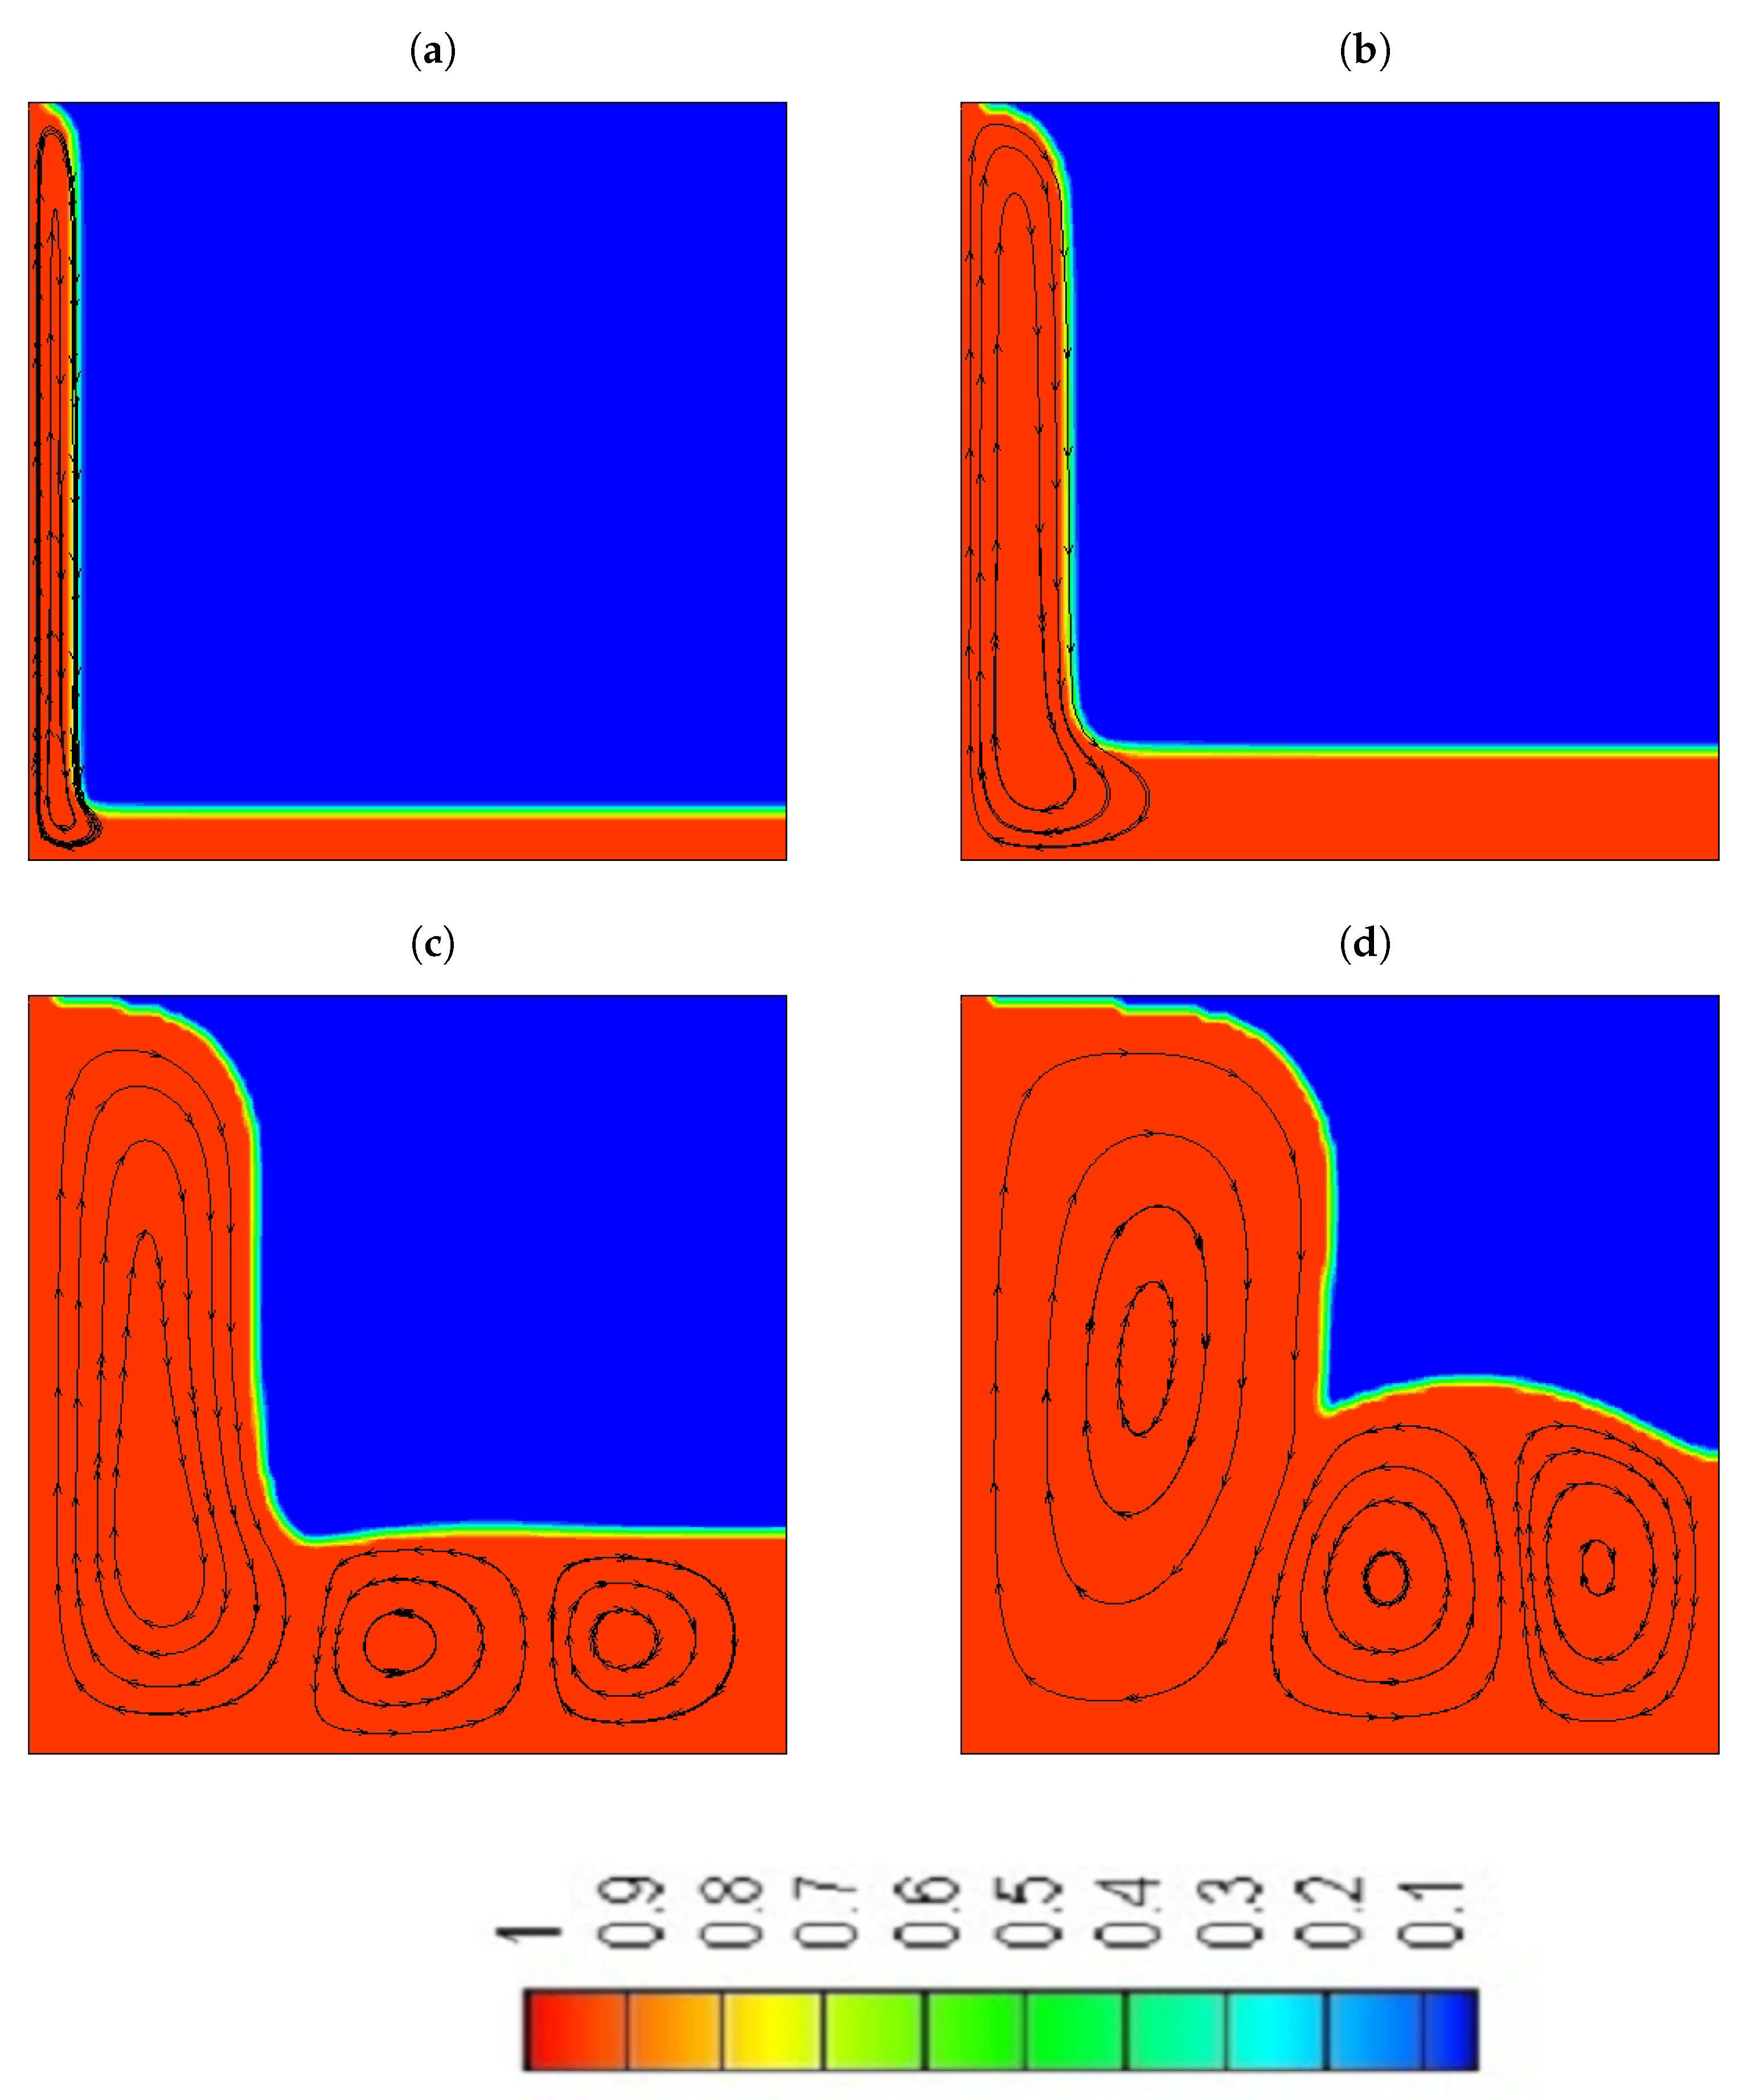
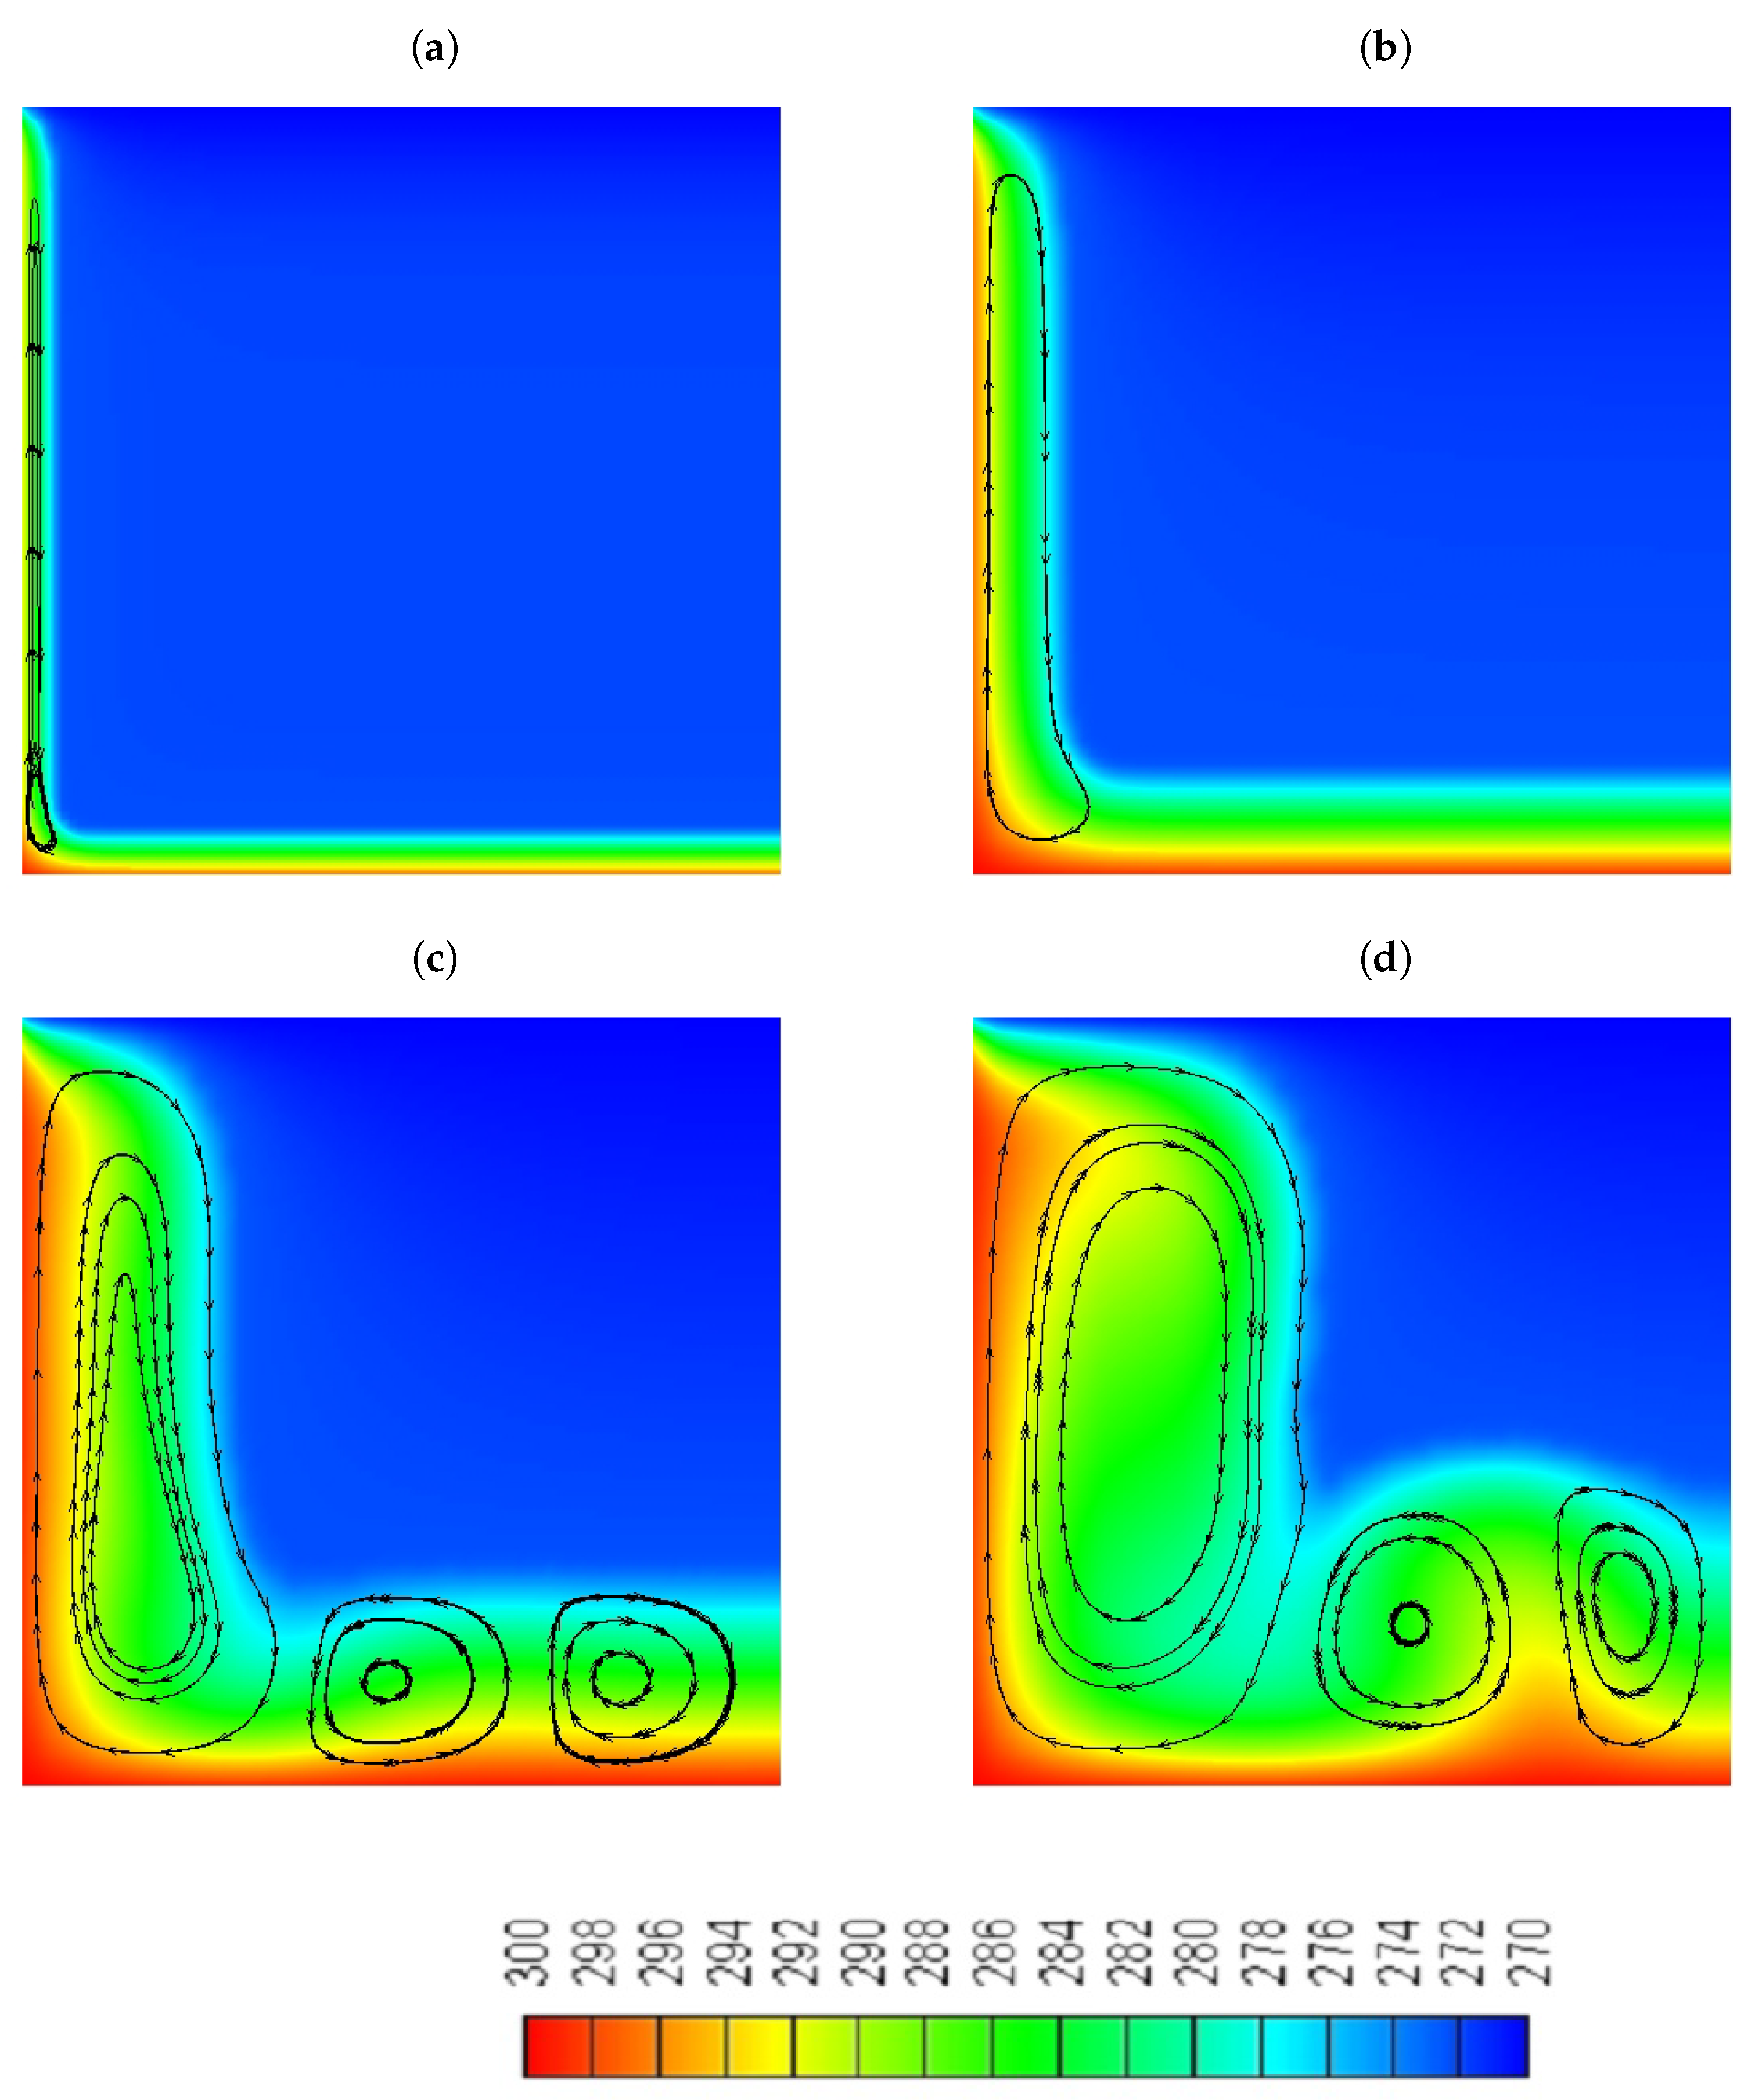
  • For pure water and the NePCM, a large recirculating flow and two smaller counter-rotating cells are formed during the melting process.
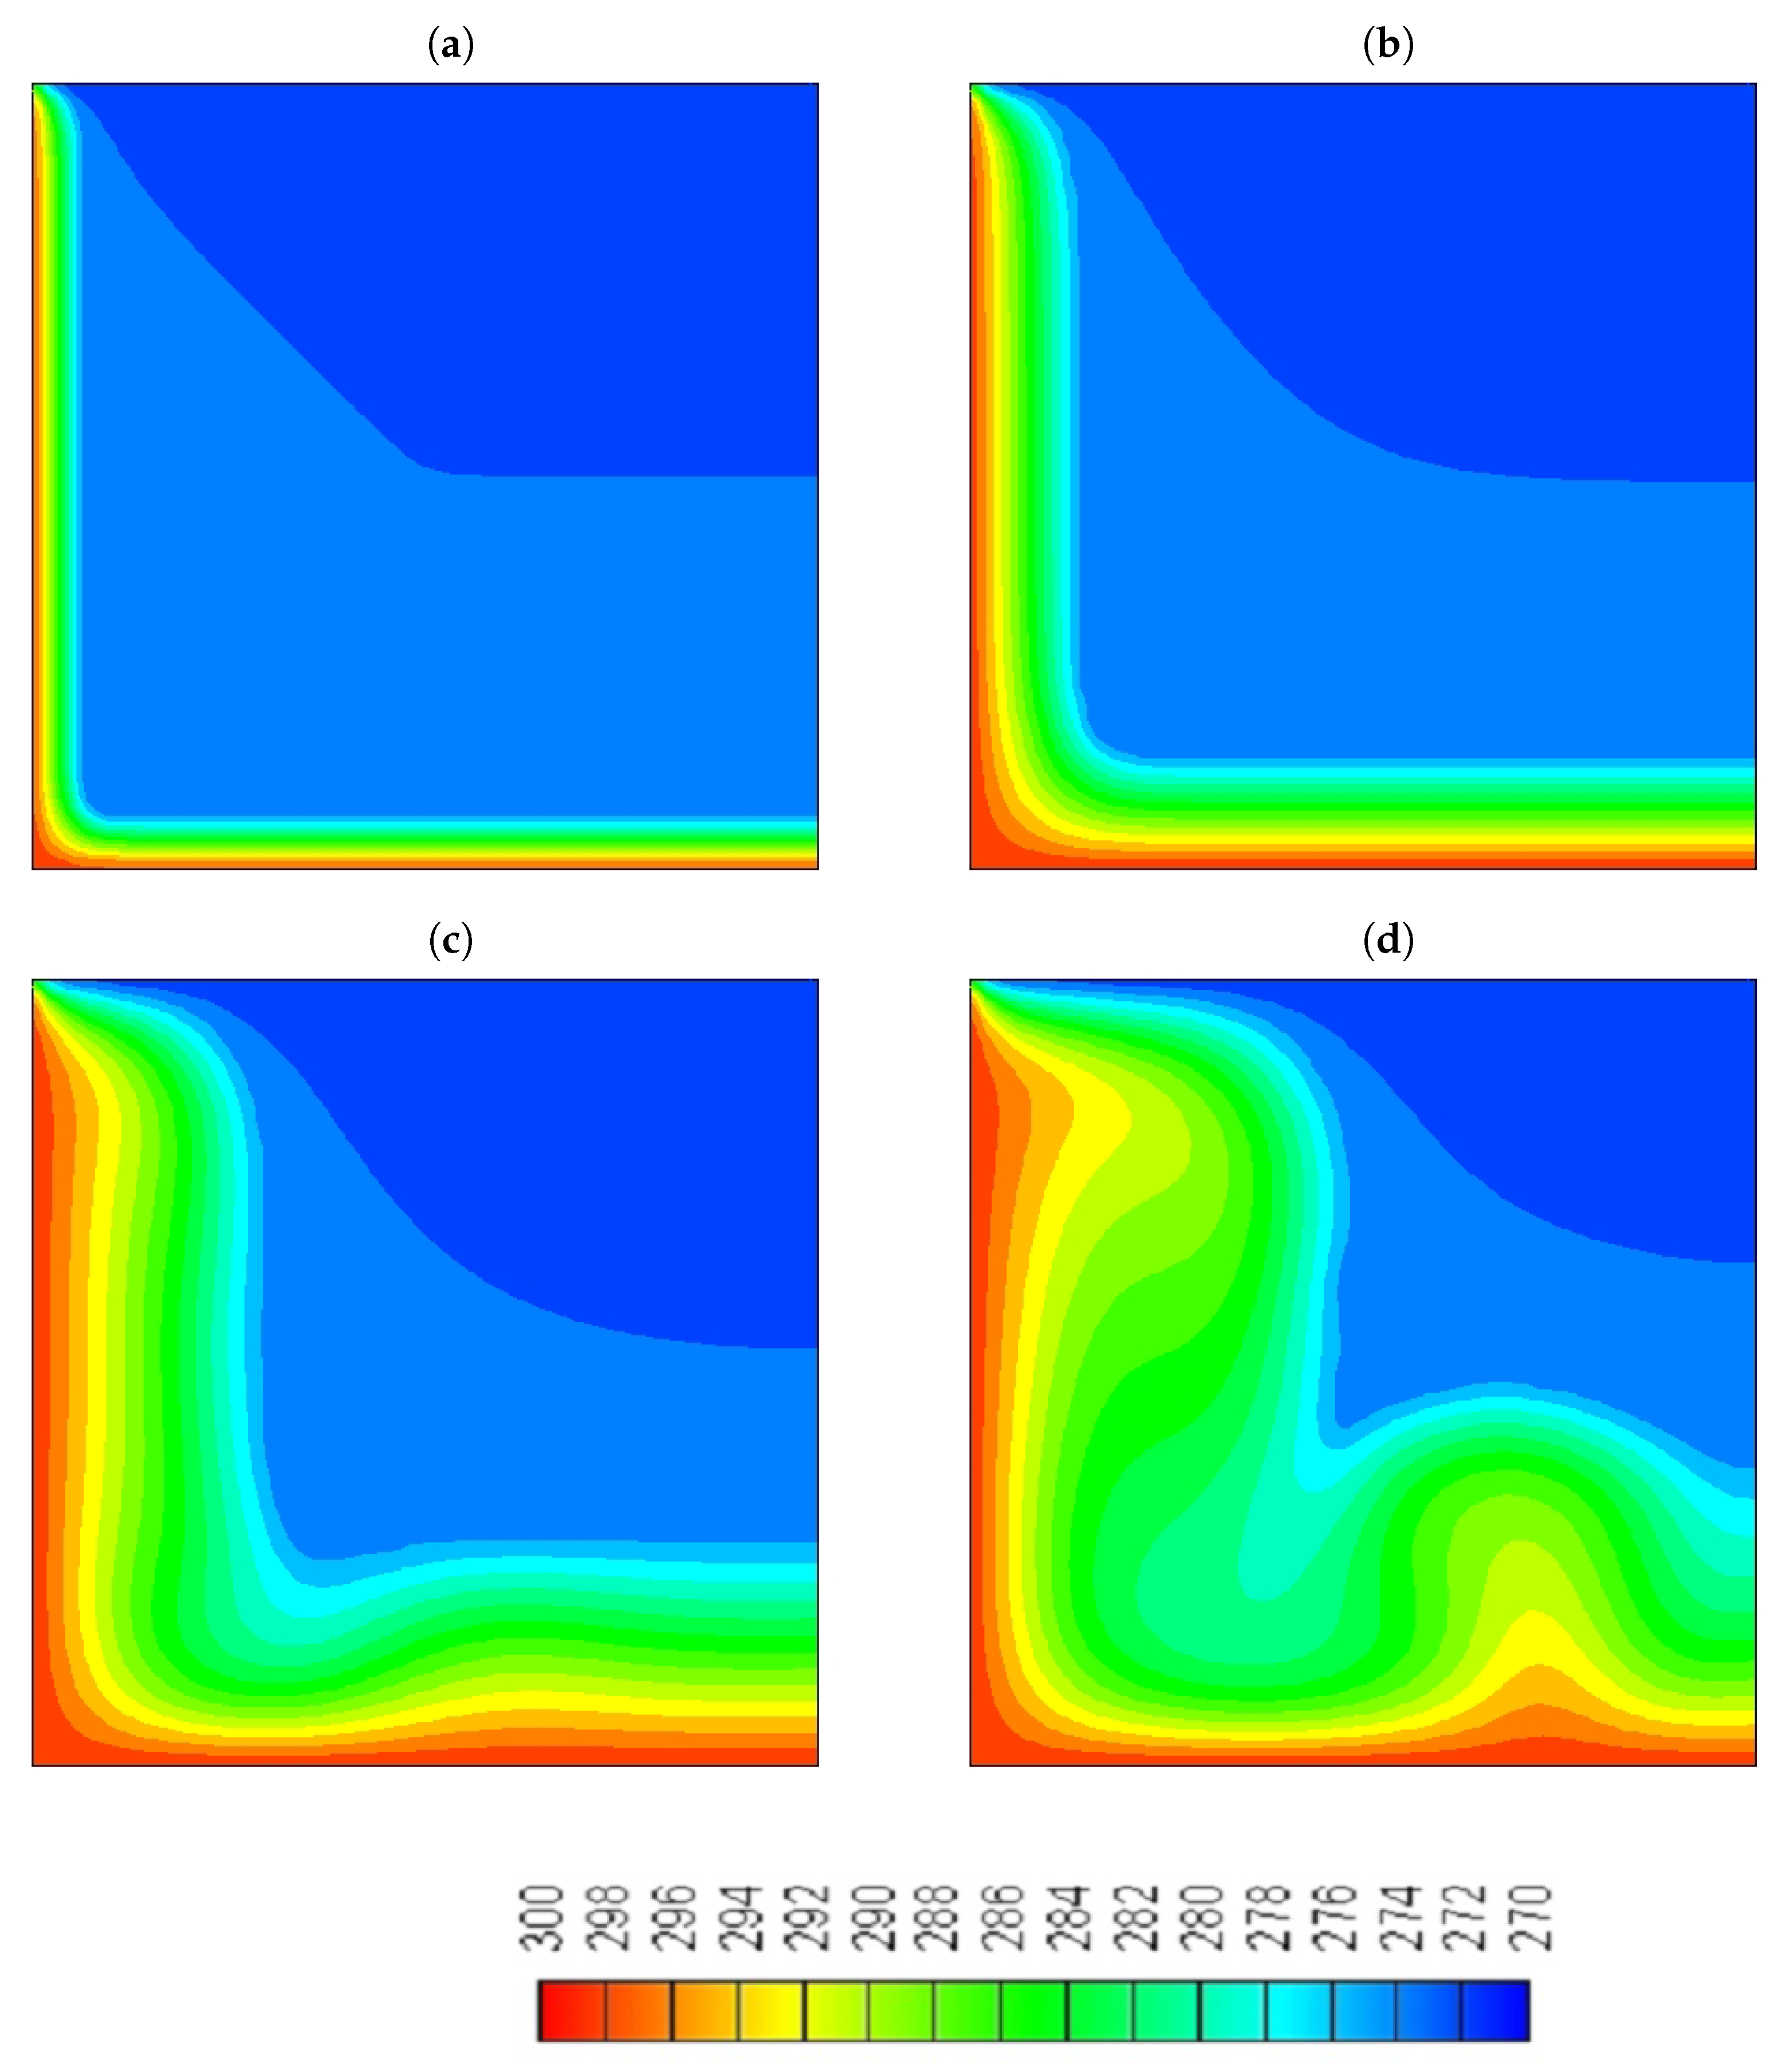
  • At the early stages, where the heat transfer is controlled by conduction, both water and the NePCM are melting at the same rate, which shows that the increase in the thermal conductivity of the NePCM did not play a significant role in the enhancement of its performance.
  • Adding particles reduces the intensity of the convection cells.
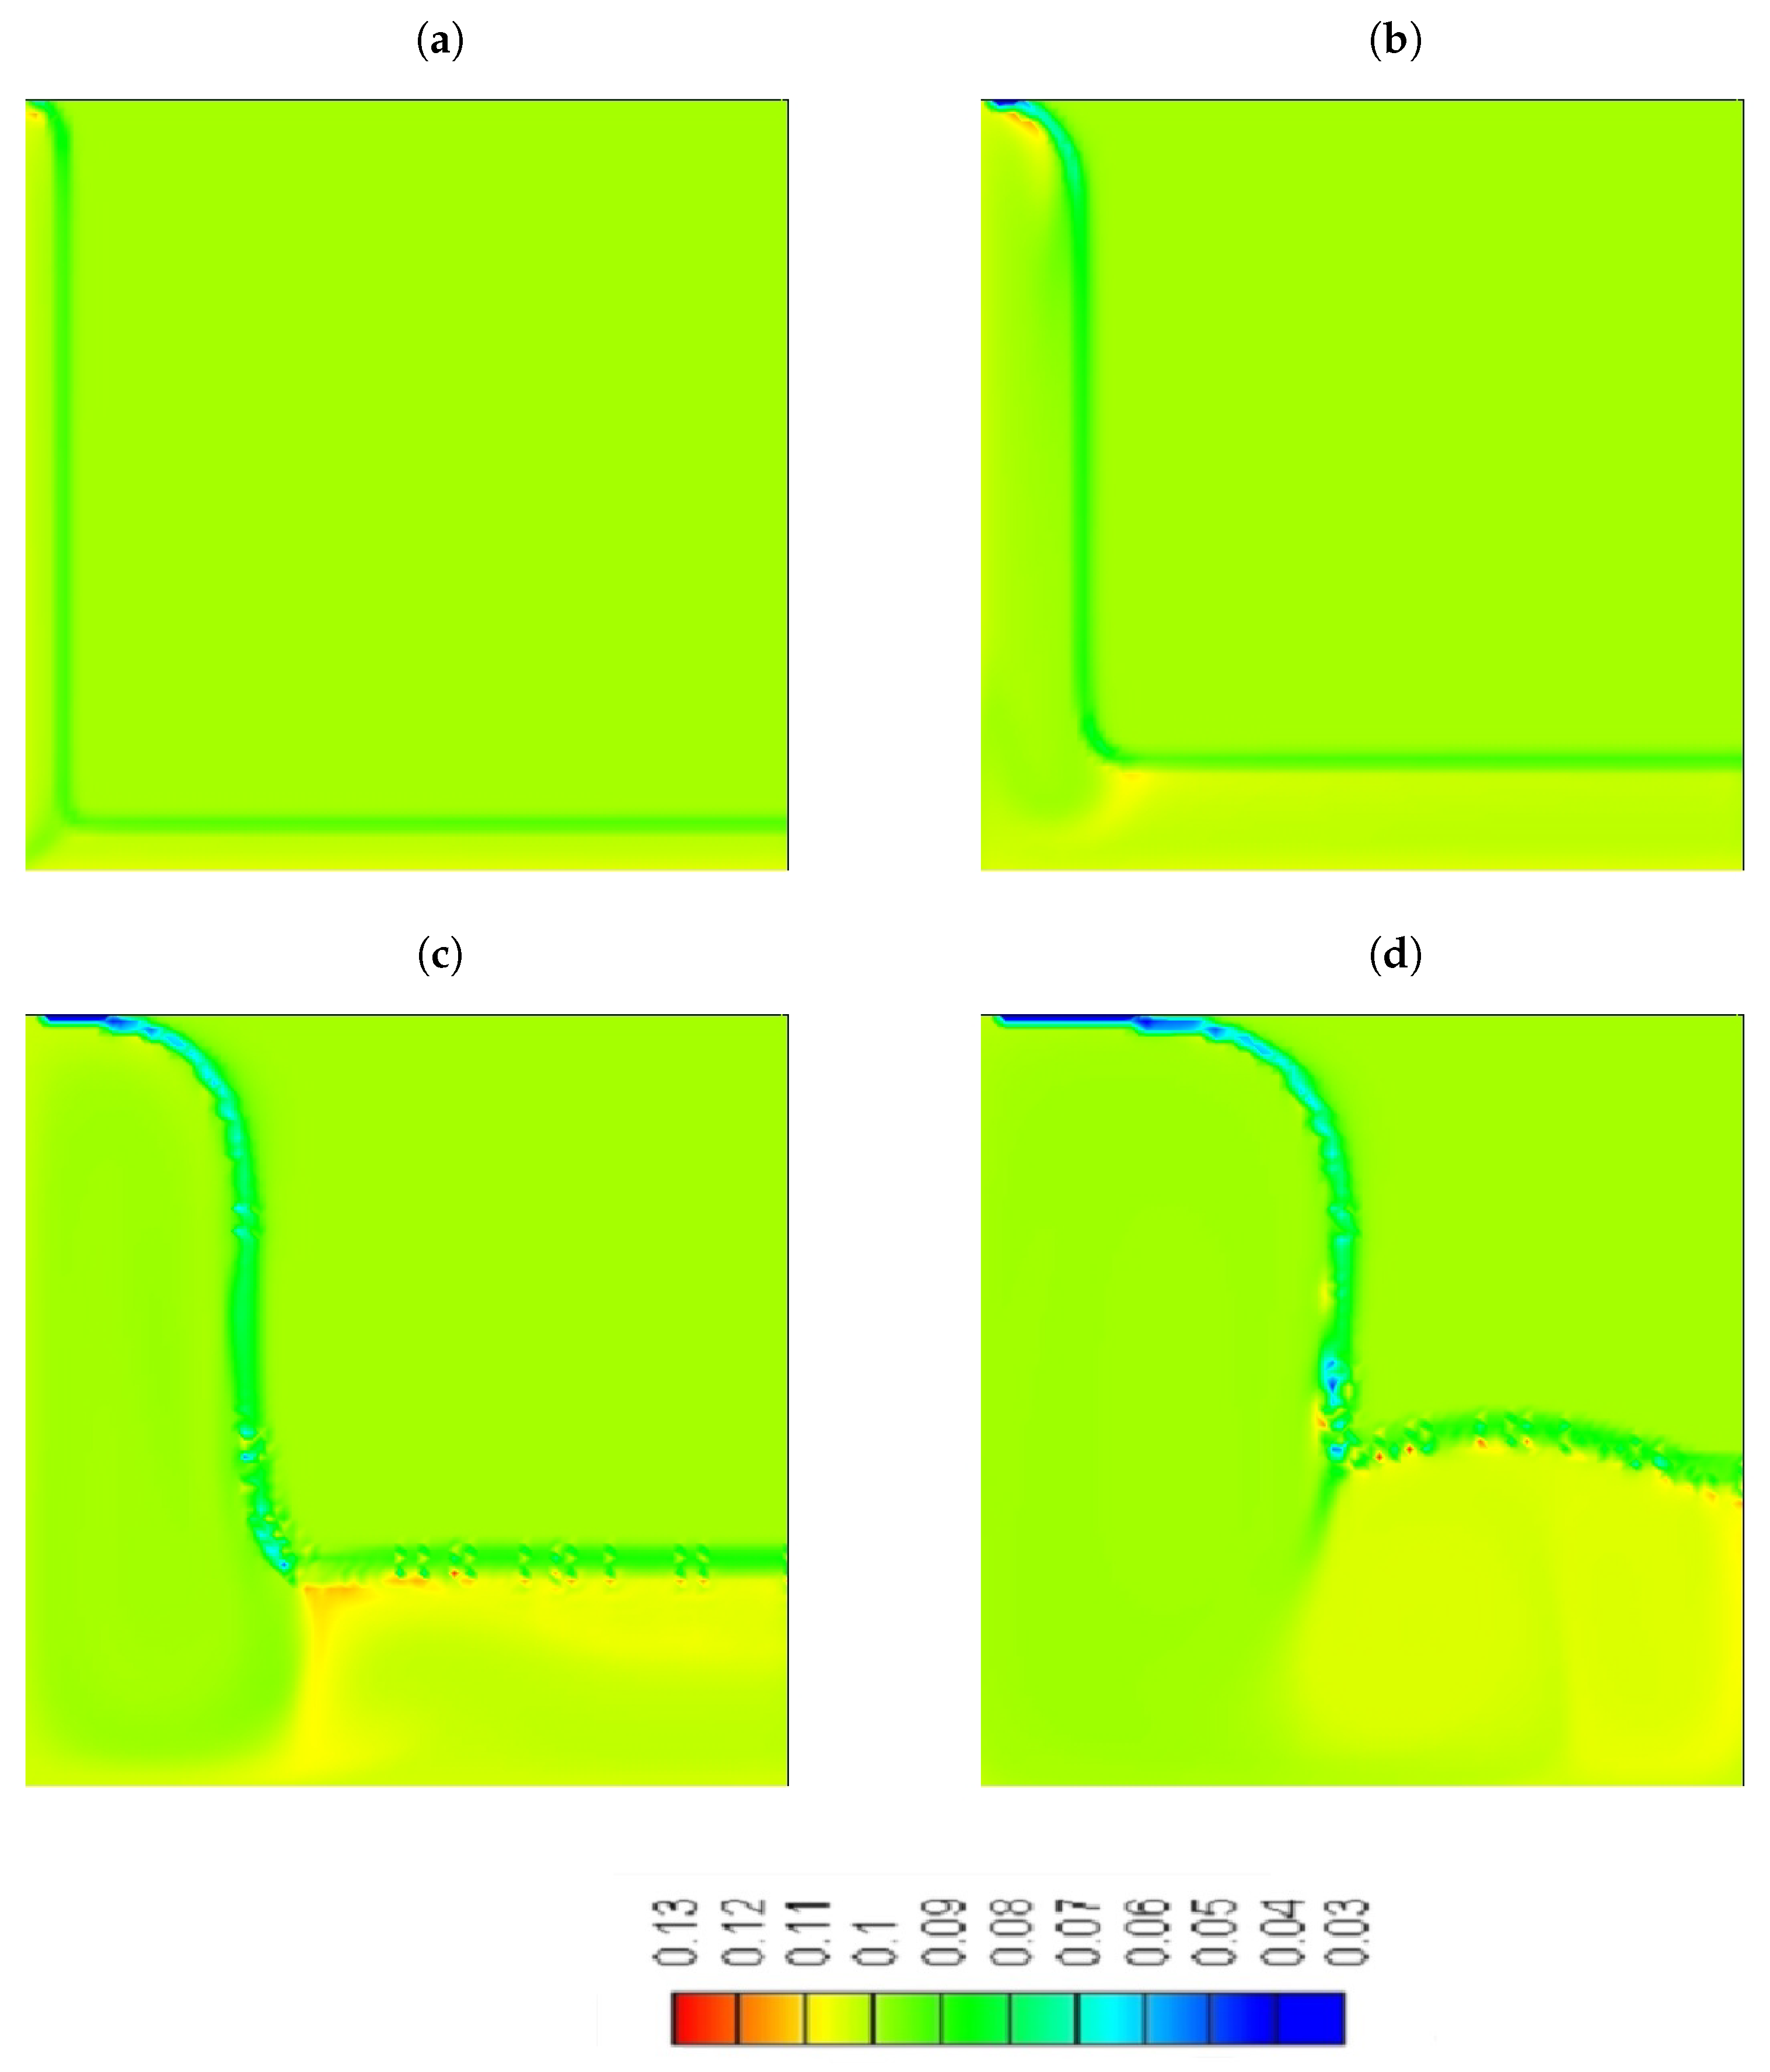
  • A significant concentration of particles is located in the bottom side of the cavity.
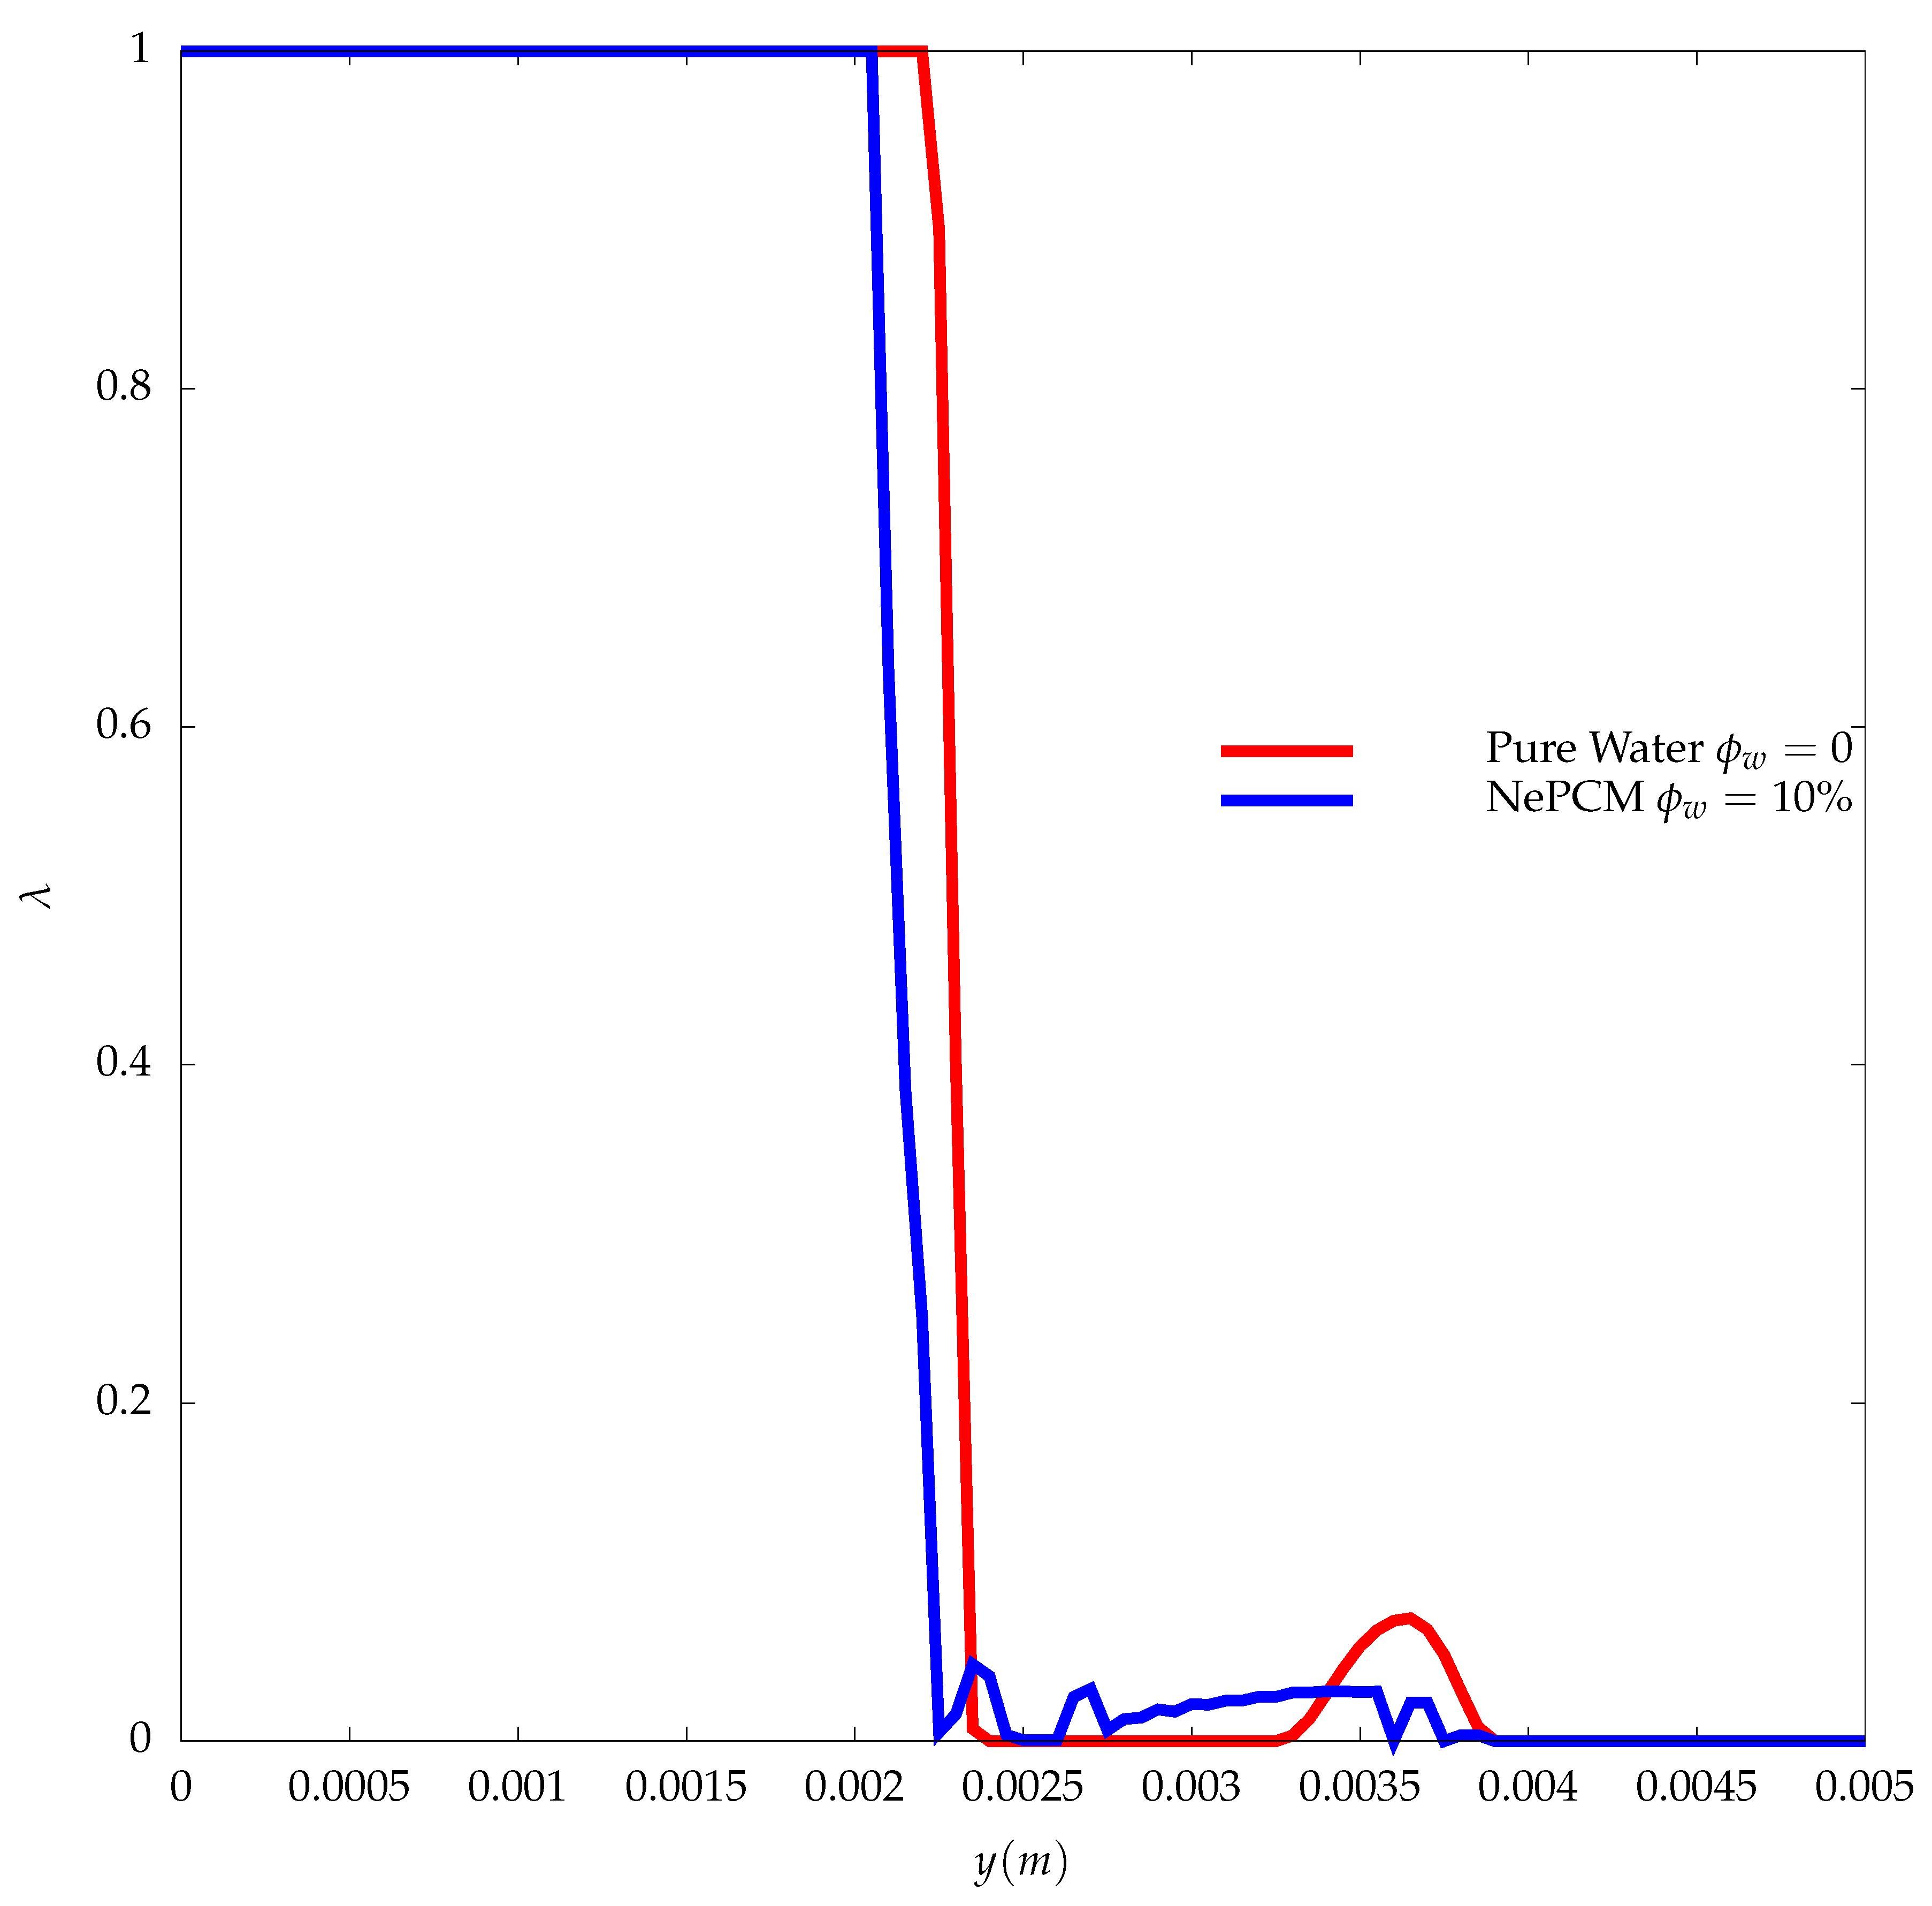
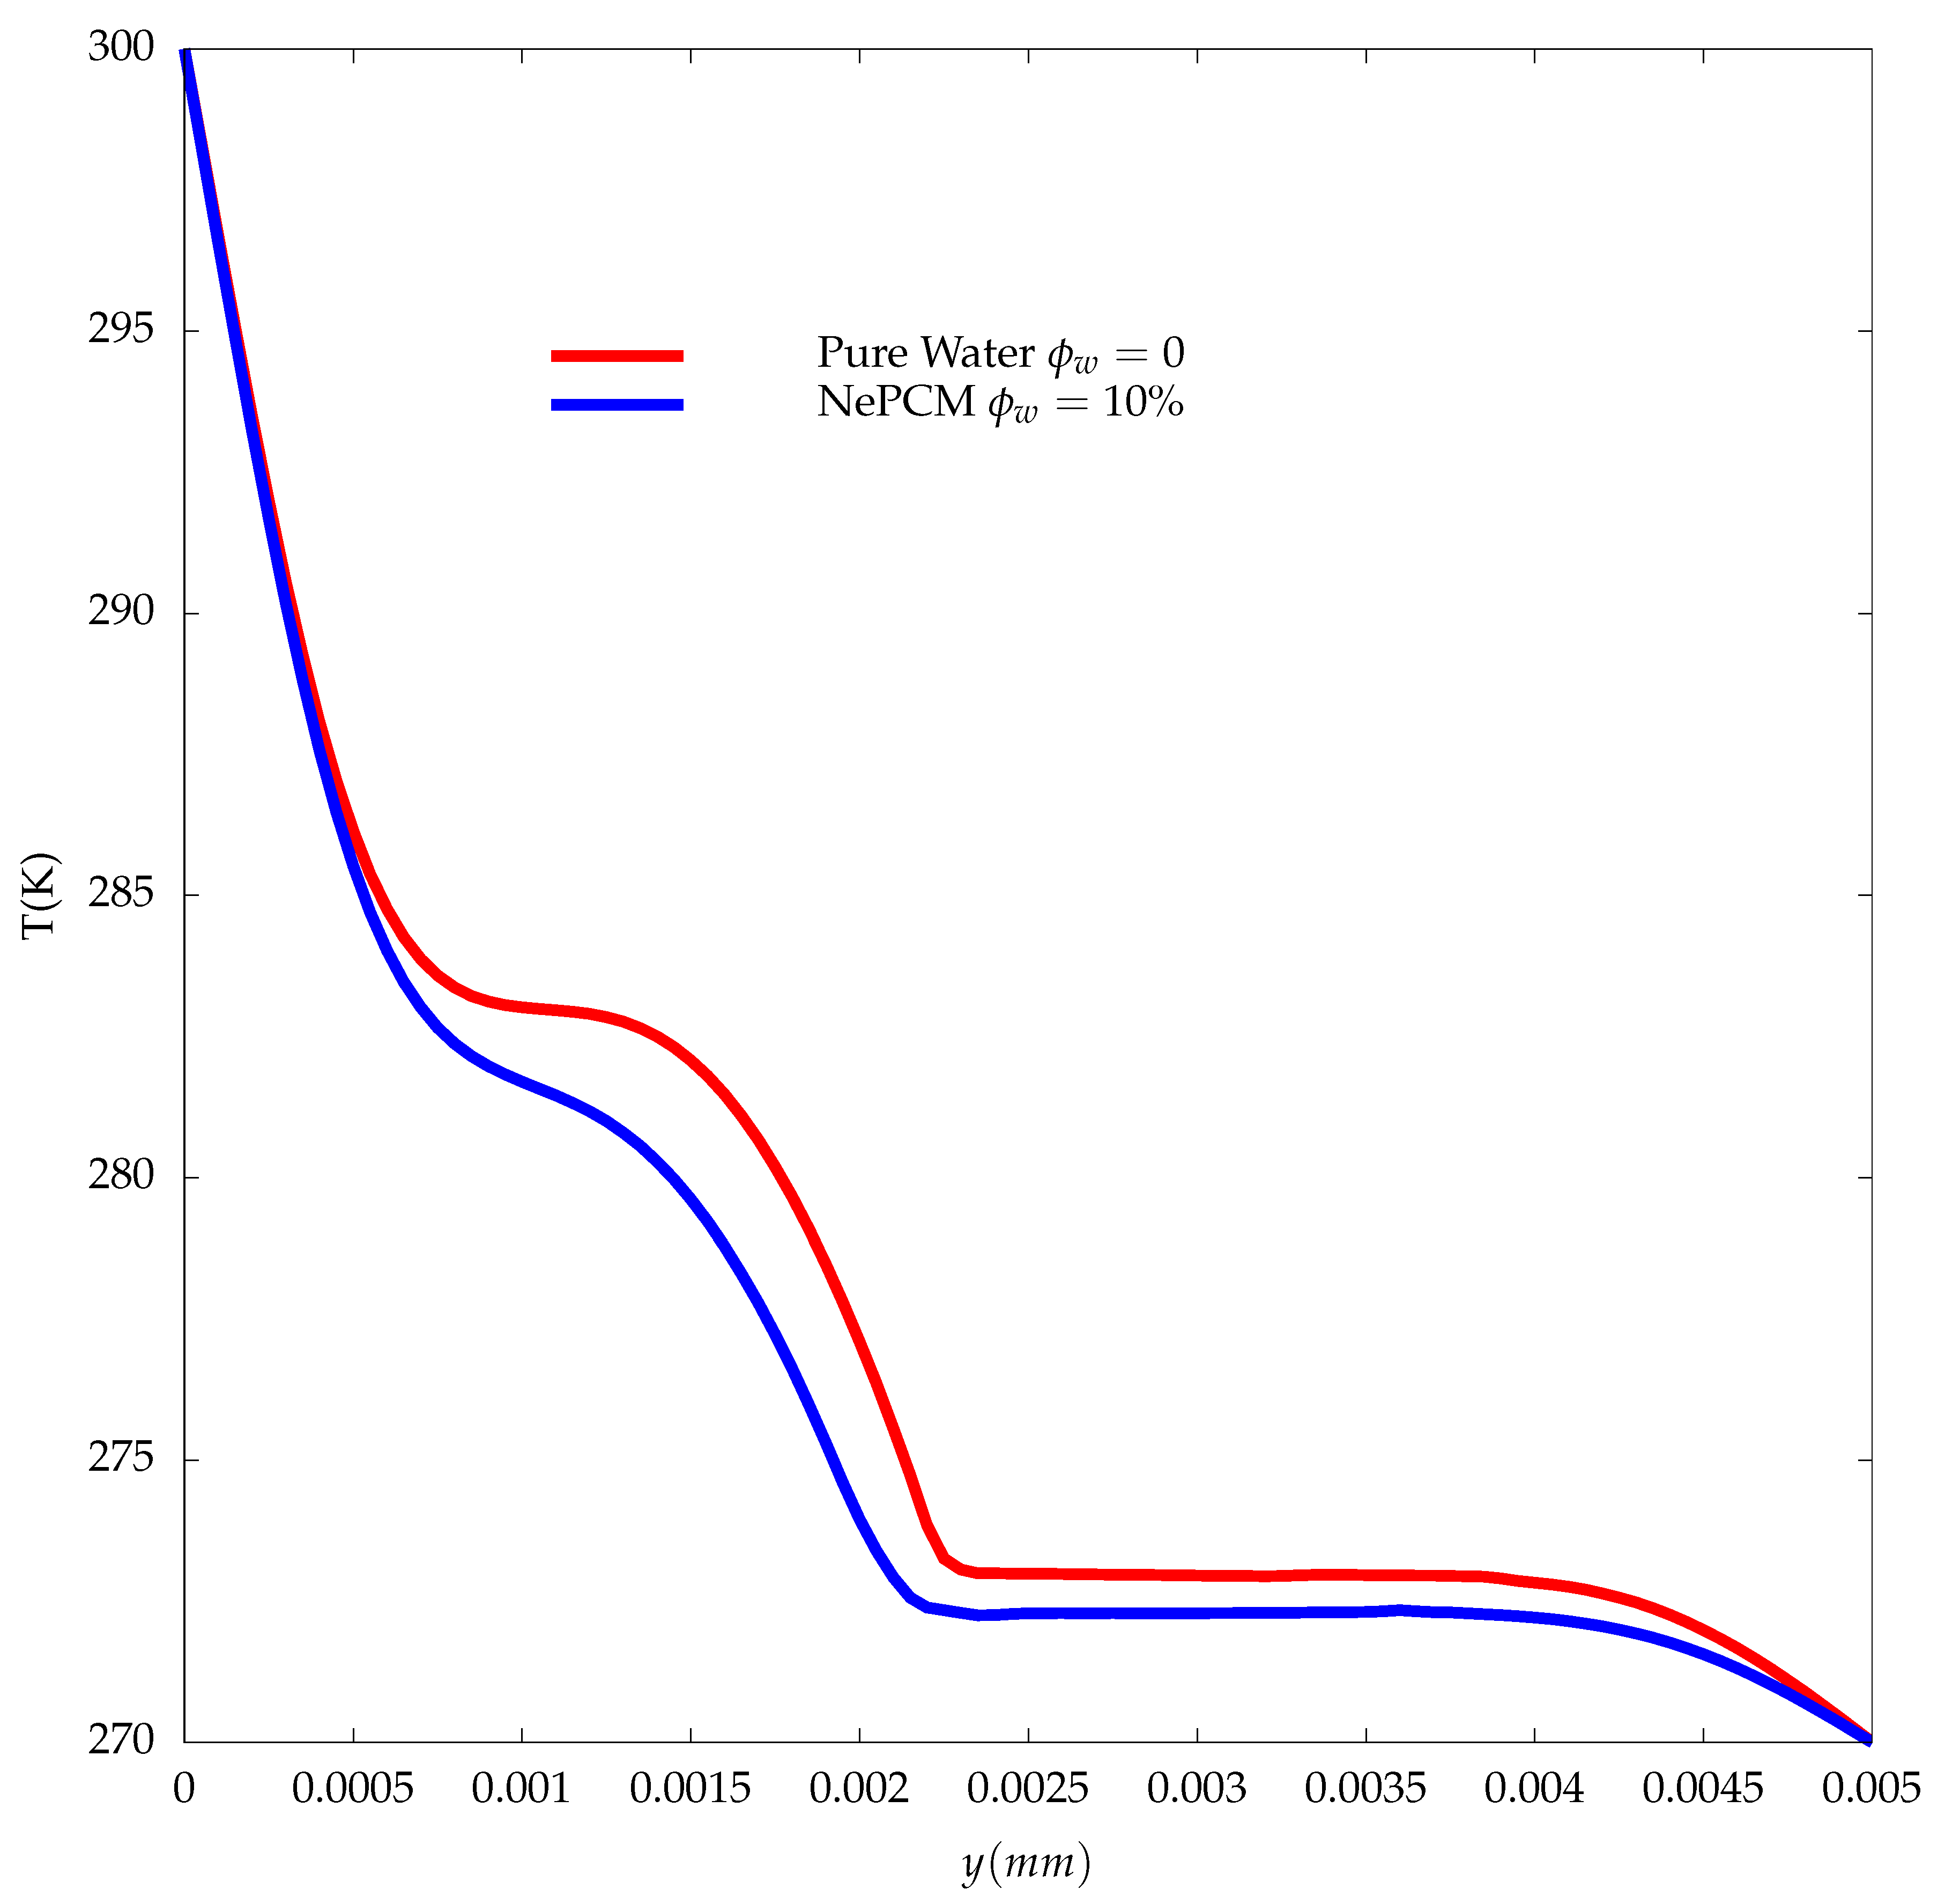
  • At the later stages of the melting process, when convection is the primary mechanism that controls the heat transfer, the NePCM will melt slower compared to the pure water as described by experiments.
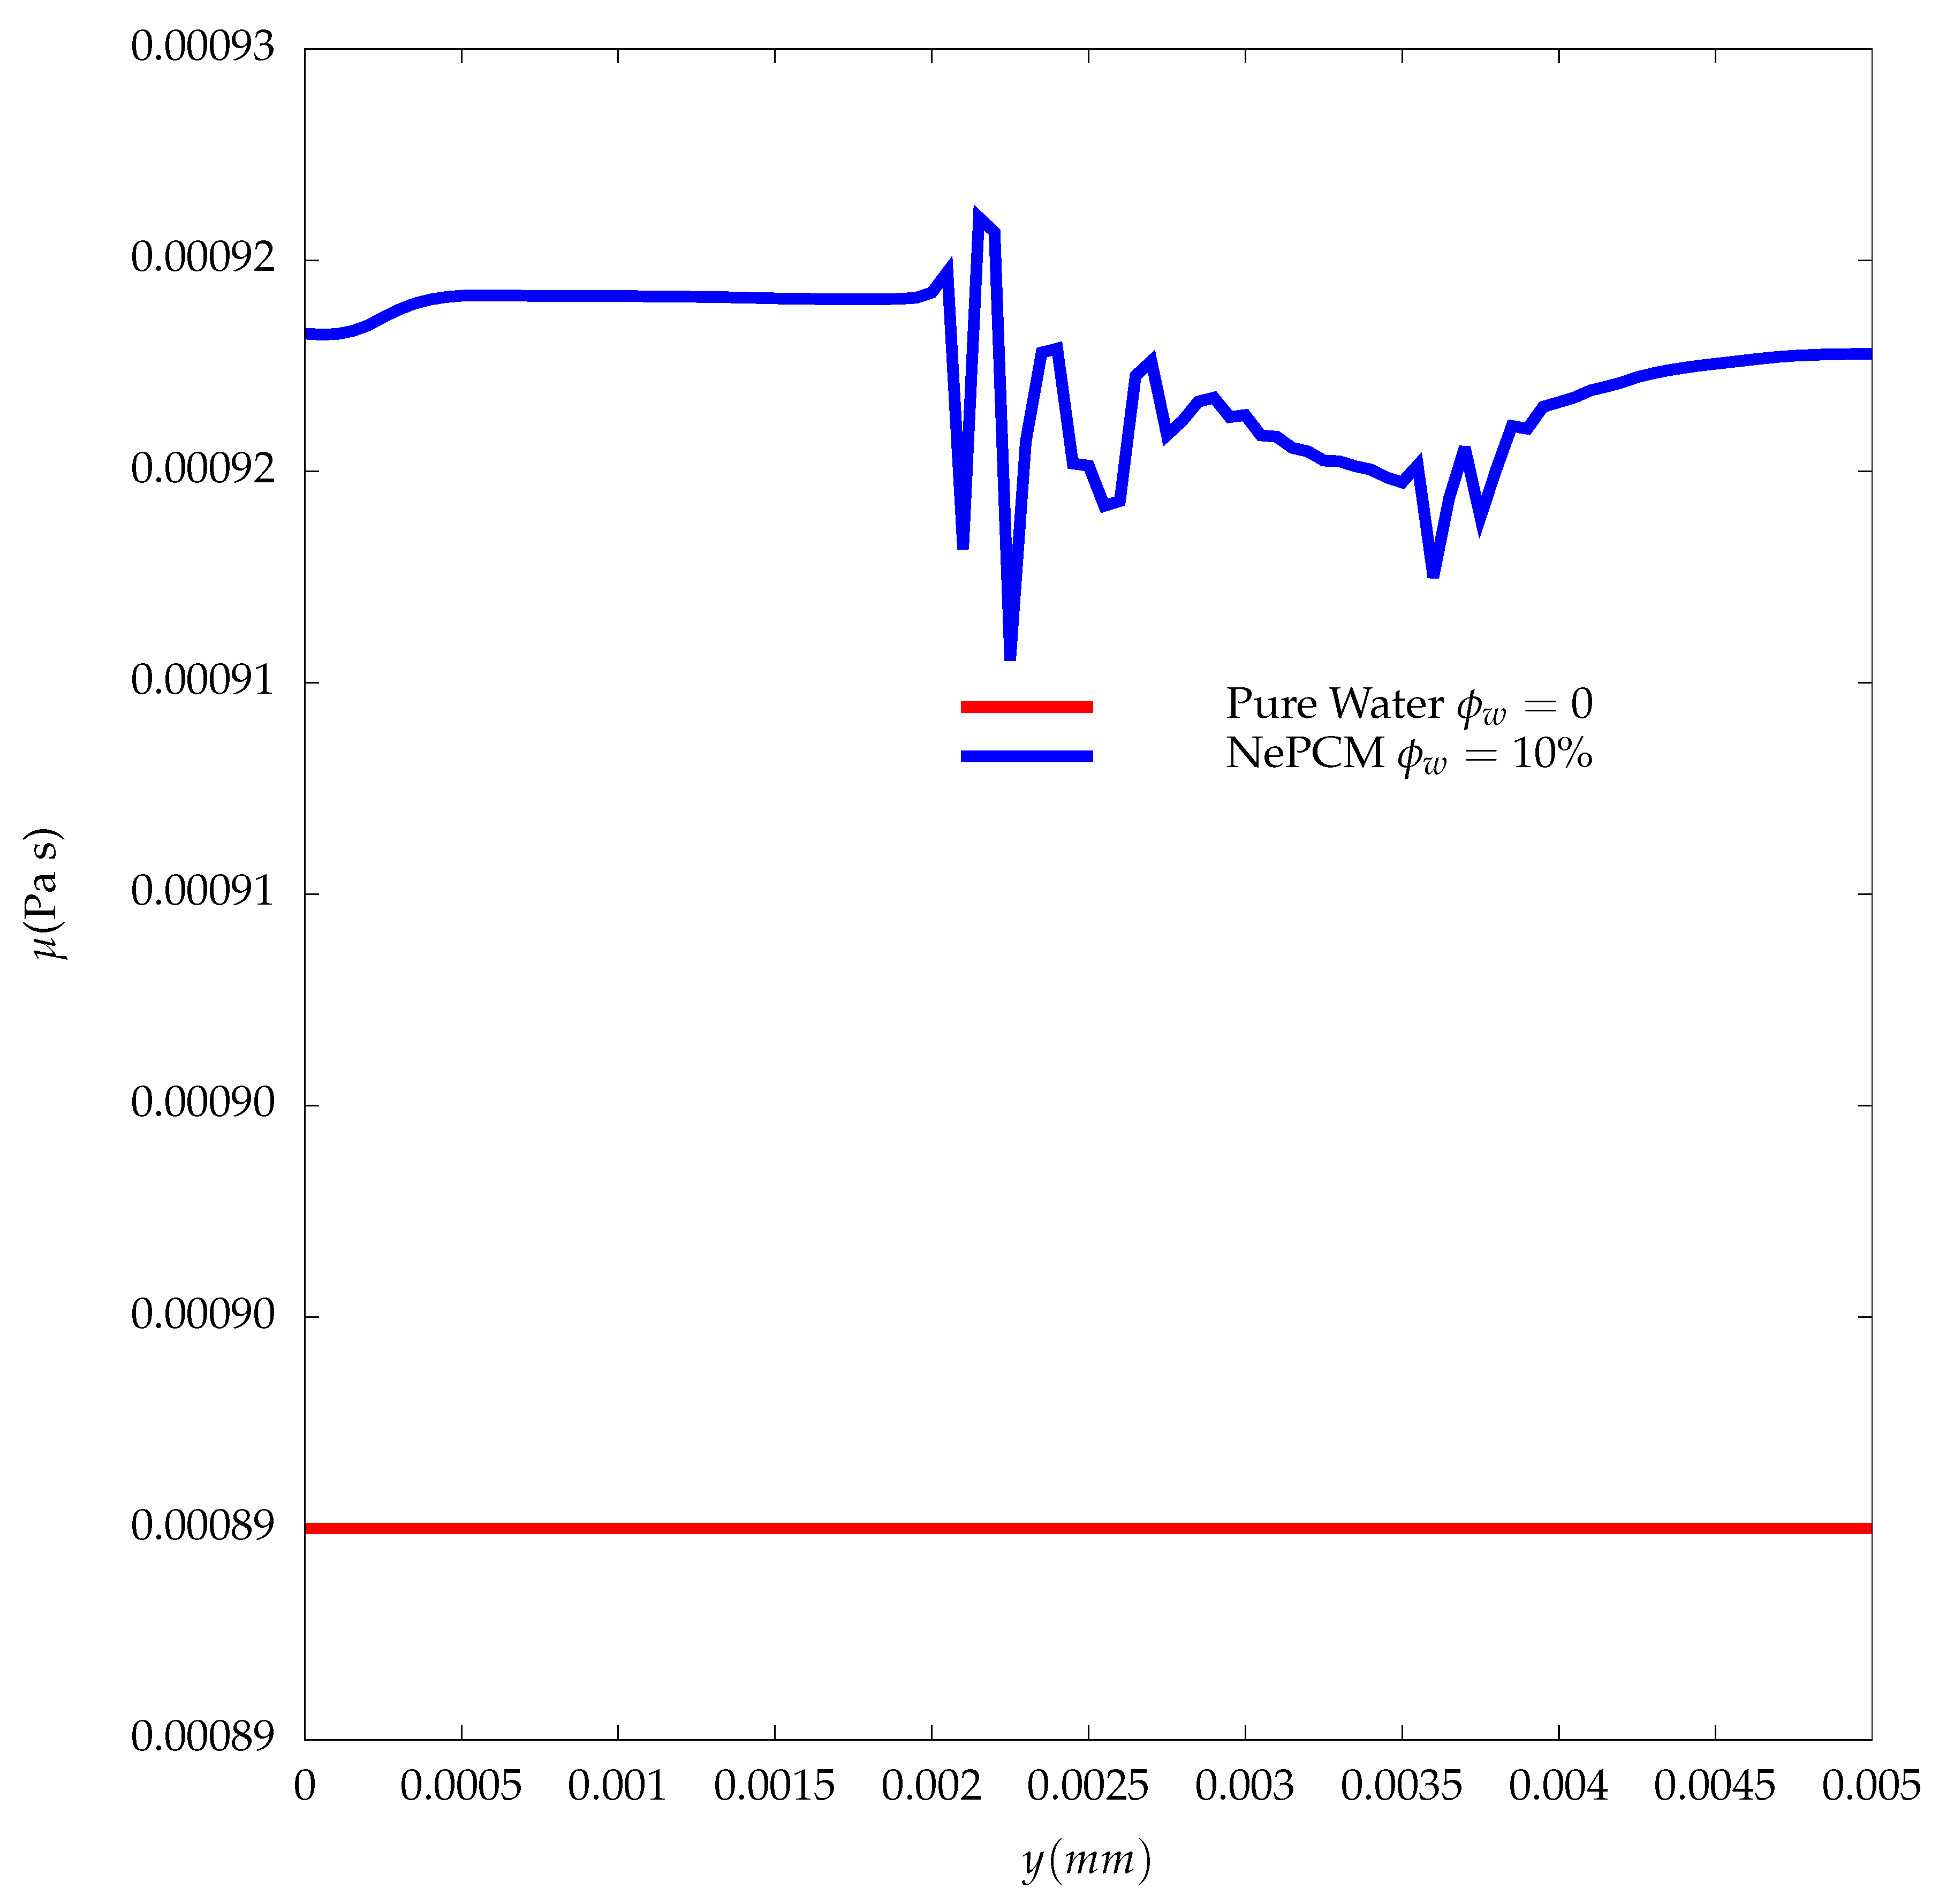
  • Although we were able to achieve a higher percentage increase in thermal conductivity (4%) compared to viscosity (3.37%) in the melting region of the NePCM, with the addition of particles with a mass fraction of ϕ w = 10% still resulted in a deceleration of the solid-liquid interface.

Funding

This research received no external funding.

Institutional Review Board Statement

Not applicable.

Informed Consent Statement

Not applicable.

Data Availability Statement

Data are available upon request from the author.

Conflicts of Interest

The author declares no conflict of interest.

Nomenclature

TTemperature (K)
U Velocity vector (m/s)
ϕ w Mass fraction of nanoparticels
λ Liquid fraction
D B Brownian Diffusion ( m 2 / s )
k 0 Segregation coefficient
pPressure (Pa)
d p Particle diameter (nm)
T L i q Liquids temperature (K)
T S o l Solidus temperature (K)
R a Rayleigh number

References

  1. Tol, R.S. The economic effects of climate change. J. Econ. Perspect. 2009, 23, 29–51. [Google Scholar] [CrossRef] [Green Version]
  2. Tao, Y.; He, Y.L. A review of phase change material and performance enhancement method for latent heat storage system. Renew. Sustain. Energy Rev. 2018, 93, 245–259. [Google Scholar] [CrossRef]
  3. Pássaro, J.; Rebola, A.; Coelho, L.; Conde, J.; Evangelakis, G.; Prouskas, C.; Papageorgiou, D.; Zisopoulou, A.; Lagaris, I. Effect of fins and nanoparticles in the discharge performance of PCM thermal storage system with a multi pass finned tube heat exchange. Appl. Therm. Eng. 2022, 212, 118569. [Google Scholar] [CrossRef]
  4. Wang, L.; Guo, L.; Ren, J.; Kong, X. Using of heat thermal storage of PCM and solar energy for distributed clean building heating: A multi-level scale-up research. Appl. Energy 2022, 321, 119345. [Google Scholar] [CrossRef]
  5. Izadi, M.; Hajjar, A.; Alshehri, H.M.; Saleem, A.; Galal, A.M. Analysis of applying fin for charging process of phase change material inside H-shaped thermal storage. Int. Commun. Heat Mass Transf. 2022, 139, 106421. [Google Scholar] [CrossRef]
  6. Patel, J.R.; Rathod, M.K.; Elavarasan, R.M.; Said, Z. Influence of longitudinal fin arrangement on the melting and solidification inside the triplex tube latent heat thermal storage system. J. Energy Storage 2022, 46, 103778. [Google Scholar] [CrossRef]
  7. Liu, Z.; Liu, Z.; Liu, G.; Yang, X.; Yan, J. Melting assessment on the effect of nonuniform Y-shaped fin upon solid–liquid phase change in a thermal storage tank. Appl. Energy 2022, 321, 119330. [Google Scholar] [CrossRef]
  8. Barthwal, M.; Rakshit, D. No fins attached? Numerical analysis of internal–external fins coupled PCM melting for solar applications. Appl. Therm. Eng. 2022, 215, 118911. [Google Scholar] [CrossRef]
  9. Li, Z.; Hu, N.; Tu, J.; Fan, L. Experimental investigation of heat storage and heat transfer rates during melting of nano-enhanced phase change materials (NEPCM) in a differentially-heated rectangular cavity. J. Therm. Sci. 2020, 29, 503–511. [Google Scholar] [CrossRef]
  10. Feng, Y.; Li, H.; Li, L.; Bu, L.; Wang, T. Numerical investigation on the melting of nanoparticle-enhanced phase change materials (NEPCM) in a bottom-heated rectangular cavity using lattice Boltzmann method. Int. J. Heat Mass Transf. 2015, 81, 415–425. [Google Scholar] [CrossRef]
  11. Han, Y.; Yang, Y.; Mallick, T.; Wen, C. Nanoparticles to Enhance Melting Performance of Phase Change Materials for Thermal Energy Storage. Nanomaterials 2022, 12, 1864. [Google Scholar] [CrossRef]
  12. Zhang, J.; Cao, Z.; Huang, S.; Huang, X.; Liang, K.; Yang, Y.; Zhang, H.; Tian, M.; Akrami, M.; Wen, C. Improving the melting performance of phase change materials using novel fins and nanoparticles in tubular energy storage systems. Appl. Energy 2022, 322, 119416. [Google Scholar] [CrossRef]
  13. Zhang, J.; Cheng, Z.; Zhou, Y.; Lu, B.; Zhang, Y. Numerical study using lattice Boltzmann method on melting and solidification of NEPCM placed inside a rectangular cavity with a new double-fin arrangement. Appl. Therm. Eng. 2023, 219, 119619. [Google Scholar] [CrossRef]
  14. Izadi, M.; Sheremet, M.; Hajjar, A.; Galal, A.M.; Mahariq, I.; Jarad, F.; Hamida, M.B.B. Numerical investigation of magneto-thermal-convection impact on phase change phenomenon of Nano-PCM within a hexagonal shaped thermal energy storage. Appl. Therm. Eng. 2023, 223, 119984. [Google Scholar] [CrossRef]
  15. Younis, O.; Abderrahmane, A.; Laidoudi, H.; Akkurt, N.; Fadhl, B.M.; Guedri, K. Buoyancy-driven flow and thermal activity of nano-enhanced phase change material in inversed U-shaped chamber. J. Energy Storage 2023, 61, 106705. [Google Scholar] [CrossRef]
  16. Faraji, H.; El Alami, M.; Arshad, A.; Faraji, M. Numerical simulation of the melting of a NePCM for cooling of electronic components. Therm. Sci. Eng. Prog. 2021, 21, 100766. [Google Scholar] [CrossRef]
  17. Zeng, Y.; Fan, L.W.; Xiao, Y.Q.; Yu, Z.T.; Cen, K.F. An experimental investigation of melting of nanoparticle-enhanced phase change materials (NePCMs) in a bottom-heated vertical cylindrical cavity. Int. J. Heat Mass Transf. 2013, 66, 111–117. [Google Scholar] [CrossRef]
  18. El Hasadi, Y.M.; Khodadadi, J. Numerical simulation of the effect of the size of suspensions on the solidification process of nanoparticle-enhanced phase change materials. J. Heat Transf. 2013, 135, 052901. [Google Scholar] [CrossRef]
  19. Beckermann, C.; Viskanta, R. Double-diffusive convection during dendritic solidification of a binary mixture. PhysicoChemical Hydrodyn. 1988, 10, 195–213. [Google Scholar]
  20. El Hasadi, Y.M.; Khodadadi, J. One-dimensional Stefan problem formulation for solidification of nanostructure-enhanced phase change materials (NePCM). Int. J. Heat Mass Transf. 2013, 67, 202–213. [Google Scholar] [CrossRef]
  21. EL Hasadi, Y.M.; Khodadadi, J. Numerical simulation of solidification of colloids inside a differentially heated cavity. J. Heat Transf. 2015, 137, 072301. [Google Scholar] [CrossRef]
  22. El Hasadi, Y.M.; Khodadadi, J. Numerical Simulation of Solidification of Colloidal Suspensions Inside a Differentially-Heated Cavity. In Proceedings of the ASME 2013 Heat Transfer Summer Conference collocated with the ASME 2013 7th International Conference on Energy Sustainability and the ASME 2013 11th International Conference on Fuel Cell Science, Engineering and Technology, Minneapolis, MN, USA, 14–19 July 2013; Volume 55485, p. V002T07A038. [Google Scholar]
  23. El Hasadi, Y.; Khodadadi, J.M. Numerical Simulation of Solidification of Nanoparticle-Enhanced Phase Change Materials (NEPCM) Considering Transport of Suspensions. In Proceedings of the TMNN-2010 International Symposium on Thermal and Materials Nanoscience and Nanotechnology, Antalya, Turkey, 29 May–3 June 2011. [Google Scholar]
  24. El Hasadi, Y.M. Numerical simulation of the melting process of nanostructured based colloidal suspensions phase change materials including the effect of the transport of the particles. J. Mol. Liq. 2019, 287, 110886. [Google Scholar] [CrossRef]
  25. Jegatheesan, M.; Bhattacharya, A. A model for predicting the effects of buoyancy driven convection on solidification of binary alloy with nanoparticles. Int. J. Heat Mass Transf. 2022, 182, 121916. [Google Scholar] [CrossRef]
  26. Patil, S.; Kataria, C.; Kumar, A.; Kumar, A. Effect of segregation and advection governed heterogeneous distribution of nanoparticles on NEPCM discharging behavior. J. Energy Storage 2023, 57, 106230. [Google Scholar] [CrossRef]
  27. Soni, V. Nanoadditive Particles segregation and mobility in phase change materials. Int. J. Heat Mass Transf. 2021, 165, 120676. [Google Scholar] [CrossRef]
  28. Voller, V.R.; Cross, M.; Markatos, N. An enthalpy method for convection/diffusion phase change. Int. J. Numer. Methods Eng. 1987, 24, 271–284. [Google Scholar] [CrossRef]
  29. Buongiorno, J. Convective transport in nanofluids. J. Heat Transf. 2006, 128, 240–250. [Google Scholar] [CrossRef]
  30. Peppin, S.; Elliott, J.; Worster, M.G. Solidification of colloidal suspensions. J. Fluid Mech. 2006, 554, 147–166. [Google Scholar] [CrossRef] [Green Version]
  31. Wakao, N.; Kagei, S. Heat and Mass Transfer in Packed Beds; Taylor & Francis: Thames, UK, 1982; Volume 1. Available online: https://books.google.co.in/books?hl=zh-CN&lr=&id=Ya5hzOgC05wC&oi=fnd&pg=PR9&dq=Heat+and+Mass+Transfer+in+Packed+Beds&ots=73DN4U0GwS&sig=R0HNk3bRzE-Ti-ya8tt0VSblMJc&redir_esc=y#v=onepage&q=Heat%20and%20Mass%20Transfer%20in%20Packed%20Beds&f=false (accessed on 15 January 2023).
  32. El Hasadi, Y.M.; Crapper, M. Self-propelled nanofluids a path to a highly effective coolant. Appl. Therm. Eng. 2017, 127, 857–869. [Google Scholar] [CrossRef] [Green Version]
  33. El Hasadi, Y.M.; Crapper, M. Self-propelled nanofluids a coolant inspired from nature with enhanced thermal transport properties. J. Mol. Liq. 2020, 313, 113548. [Google Scholar] [CrossRef]
  34. Rappaz, M.; Dantzig, J.A. Solidification; EPFL Press: Lausanne, Switzerland, 2009. [Google Scholar]
Figure 1. The geometry of the cavity.
Coatings 13 00739 g001
Figure 2. The evolution of solid-liquid interface profiles for the case of pure water ϕ w = 0. (a) t = 1 s, (b) t = 2 s, (c) t = 25 s, (d) t = 50 s.
Coatings 13 00739 g002
Figure 3. The evolution of temperature profiles for the case of pure water ϕ w = 0. (a) t = 2 s, (b) t = 6 s, (c) t = 25 s, (d) t = 50 s.
Coatings 13 00739 g003
Figure 4. The evolution of solid-liquid interface profiles for the case of ϕ w = 10%. (a) t = 1 s, (b) t = 2 s, (c) t = 25 s, (d) t = 50 s.
Coatings 13 00739 g004
Figure 5. The evolution of temperature profiles for the case of ϕ w = 10%. (a) t = 2 s, (b) t = 6 s, (c) t = 25 s, (d) t = 50 s.
Coatings 13 00739 g005
Figure 6. The temporal variation of the average liquid fraction for the case of pure water ( ϕ w = 0.0), and NePCM with ϕ = 10%.
Coatings 13 00739 g006
Figure 7. The evolution of concentration profiles for the case of ϕ w = 10%. (a) t = 1 s, (b) t = 6 s, (c) t = 25 s, (d) t = 50 s.
Coatings 13 00739 g007
Figure 8. Compression between the Liquid fraction evolution along vertical line located at x = 0.005 mm, and a long the y-axis for the case of ϕ w = 0, and 10%.
Coatings 13 00739 g008
Figure 9. Compression between the Temperature evolution along vertical line located at x = 0.005 mm, and a long the y-axis for the case of ϕ w = 0, and 10%.
Coatings 13 00739 g009
Figure 10. Compression between the Velocity evolution along vertical line located at x = 0.005 mm, and a long the y-axis for the case of ϕ w = 0, and 10%.
Coatings 13 00739 g010
Figure 11. Compression between the thermal conductivity evolution along vertical line located at x = 0.005 mm, and a long the y-axis for the case of ϕ w = 0, and 10%.
Coatings 13 00739 g011
Figure 12. Compression between the viscosity evolution along vertical line located at x = 0.005 mm, and a long the y-axis for the case of ϕ w = 0, and 10%.
Coatings 13 00739 g012
Table 1. Thermophysical and transport properties for the solvent and the nanoparticles.
WaterCopper Nanoparticles
Density 997.1 kg / m 3 8954 kg / m 3
Viscosity 8.9 × 10 4 Pa s
Specific heat 4179 J / kg K 383 J / kg K
Thermal conductivity 0.6 W / m K 400 W / m K
Thermal expansion coefficient 2.1 × 10 4 K 1 1.67 × 10 5 K 1
Heat of fusion 3.35 × 10 5 J / kg
Table 2. The values of the transport properties of the NePCM at different nano-particle volume fractions.
Transport Property ϕ w = 10% ( ϕ = 1.22%)
Thermal Conductivity6.23 ×   10 1   W / m K
Density1.10 ×   10 3   kg / m 3
Dynamic viscosity9.18 ×   10 4   Pa s
Specific heat3.8 ×   10 3   J / kg K
Thermal expansion coefficient1.9 ×   10 4   K 1
Table 3. A comparison of the current results and those of El Hasadi [24].
Time (s)( λ ϕ w = 10 % λ ϕ w = 0 )( λ ϕ w = 10 % λ ϕ w = 0 ) El Hasadi [24]
t = 111.0181.019
t = 501.0211.0203
Disclaimer/Publisher’s Note: The statements, opinions and data contained in all publications are solely those of the individual author(s) and contributor(s) and not of MDPI and/or the editor(s). MDPI and/or the editor(s) disclaim responsibility for any injury to people or property resulting from any ideas, methods, instructions or products referred to in the content.

