Article

High-Temperature Solid Particle Erosion of Environmental and Thermal Barrier Coatings

1
National Aeronautics and Space Administration Glenn Research Center, Cleveland, OH 44135, USA
2
HX-5, LLC., Cleveland, OH 44135, USA
*
Author to whom correspondence should be addressed.
Coatings 2023, 13(5), 902; https://doi.org/10.3390/coatings13050902
Submission received: 12 April 2023 / Revised: 28 April 2023 / Accepted: 4 May 2023 / Published: 10 May 2023

Abstract

:
Solid particle erosion (SPE) is a common phenomenon observed in gas turbine engines. Particles entrained in the gas flow impact engine hardware, resulting in micro-scale damage that leads to deleterious effects such as material removal. For protective coatings, damage due to SPE is a key concern, since it can negatively affect the durability of the coating and subsequently the life of the underlying component. In this work, the high-temperature SPE behavior of two state-of-the-art environmental barrier coatings (EBCs) deposited via air plasma spray (APS) is investigated using alumina erodent to understand the effect of particle kinetic energy, impingement angle, and temperature. The SPE behavior of the EBCs is also compared to APS and electron beam–physical vapor deposition (EB-PVD) thermal barrier coatings (TBCs) to elucidate similarities and differences in the erosion response. The EBCs were more susceptible to SPE than the EB-PVD TBC but had greater SPE resistance compared to the APS TBC. Coating microstructure and porosity were shown to have a strong influence on the observed behavior.

1. Introduction

Ceramic matrix composites (CMCs) are prime candidates for hot-section components in gas turbine engines due to their high-temperature capability, high strength, and toughness. In addition, CMCs are approximately one-third the density of metallic hot-section components made of Ni-based superalloys. As such, the use of CMCs can lead to increased thermal and propulsive efficiency [1,2]. However, for silicon carbide (SiC)-based CMCs, the protective silica (SiO2) scale responsible for oxidation resistance at high temperature reacts with water vapor that is produced as a by-product of combustion and forms a volatile silicon hydroxide species [1,2,3,4,5,6,7,8,9,10]. The competing reactions of SiO2 scale growth and SiO2 volatilization result in surface recession and a loss of structural integrity. Consequently, environmental barrier coatings (EBCs) were developed to protect SiC-based CMC components from the combustion environment and are critical for the durability and long-life requirements of CMC components [1,2,3,4,5,6,7,8,9,10].
EBCs and CMCs are slowly being introduced in hot-section components of gas turbine engines. The first EBC/CMC component, a high-pressure turbine shroud, entered service on the LEAP engine designed by CFM International for the Airbus A320neo in 2016 and the Boeing 737 MAX in 2017 [1,2]. Today, EBC/CMC systems continue to advance, with the goal of extending the technology to combustion liners, nozzles, vanes, and blades [1,2]. As the desire grows for further implementing EBC/CMC technology into gas turbine engines, it becomes crucial to develop a fundamental understanding of the various environmental degradation modes that may be encountered in service.
In addition to water-vapor-induced oxidation and recession, EBCs need to be resilient against thermal and thermo-mechanical stress/strain [11,12,13,14,15,16], calcium-magnesium-aluminosilicate (CMAS) deposits [17,18,19,20,21,22], foreign object damage (FOD) [23,24], and solid particle erosion (SPE) [25,26,27]. While many of the aforementioned degradation modes have been investigated, there is still a gap in the characterization and fundamental understanding of the SPE behavior of EBCs. Conversely, the SPE behavior of thermal barrier coatings (TBCs) used to protect hot-section metallic materials has been characterized more rigorously [28,29,30,31,32,33,34,35,36,37,38,39,40,41,42,43]. Moreover, several studies have investigated the SPE behavior of gas-turbine-grade CMCs [44,45,46,47]. Therefore, the primary focus of this study is to investigate the SPE behavior of two EBCs deposited via air plasma spray (APS). Erosion testing is performed at elevated temperature using alumina (Al2O3) erodent to understand the effect of particle kinetic energy, impingement angle, and temperature. The SPE behavior of the APS EBCs is also compared to APS and electron beam–physical vapor deposition (EB-PVD) 7YSZ TBCs that are tested under similar erosion conditions to elucidate similarities and differences. Furthermore, the results of this study are compared to other erosion studies reported in the literature on EBCs and TBCs.

2. Materials and Methods

The EBC systems used in this study were 100 wt.% ytterbium disilicate (Yb2Si2O7) and modified Yb2Si2O7 (Praxair Specialty Ceramics, Woodinville, WA, USA). The modified system consisted of balance Yb2Si2O7 with additions of 1.39 wt.% mullite (3Al2O3·2SiO2) and 2.33 wt.% YAG (Y3Al5O12). For simplicity, the 100 wt.% Yb2Si2O7 will herein be referred to as YbDS and the modified system as M2Y. More detail on modified EBCs can be found in [3], where it was shown that the addition of modifiers improved oxidation performance. The YbDS and M2Y topcoat layers, along with a Si bond coat, were deposited via APS onto 25.4 mm diameter by 3 mm thick SiC Hexoloy® (Saint-Gobain Ceramics, Niagara Falls, NY, USA) SA monolithic substrates. The target thickness of the YbDS and M2Y topcoats was 380 µm, and the Si bond coat thickness was 127 µm. The APS deposition parameters of the bond coat and topcoat are proprietary to NASA. Scanning electron microscopy (SEM) (Phenom ProX, ThermoFisher Scientific, Waltham, MA, USA) images of the as-deposited EBCs are shown in Figure 1a,b. From image analysis [48], the porosity in the YbDS coating was estimated as 5.5%, and the porosity was estimated as 3.1% for the M2Y coating.
Two TBC systems were also characterized to compare the SPE behavior of TBCs and EBCs under similar test conditions. One set of TBC samples were deposited via APS, and the other via EB-PVD. The APS 7YSZ system was deposited on 25.4 mm diameter CMSX-4 superalloy substrates and had a 7YSZ topcoat thickness of 254 µm and a nickel-chromium-aluminum-yttrium (NiCrAlY) bond coat thickness of 127 µm. The EB-PVD 7YSZ samples were deposited on 25.4 mm diameter Rene N5 superalloy samples with a 7YSZ topcoat thickness of 175 µm and a platinum-aluminide (Pt-Al) bond coat thickness of 50 µm. The TBC deposition parameters are also proprietary.
SEM images of the as-deposited TBCs are shown in Figure 2a,b. The porosity for the APS 7YSZ was estimated to be 10%. Porosity measurements in the EB-PVD 7YSZ were more complex. The EB-PVD microstructure exhibits high intra-columnar density, while most of the porosity of the bulk coating is inter-columnar. A global or bulk porosity measurement of the topcoat, which naturally considers both the inter-columnar gaps and intra-columnar pores, was estimated to be 14%. A measurement of just the intra-columnar porosity was determined to be 5.3%.
SPE testing was performed in a jet fuel (Jet-A) pre-heated air atmospheric burner rig modified to incorporate particle injection [27,41]. An image of the rig during operation is shown in Figure 3a, and a schematic of the burner is shown in Figure 3b. Erodent is injected into the combustion chamber using a screw-driven powder feeder (HA 5000F-SA, Hardface Alloys, Inc., Placentia, CA, USA), where it exits the burner through a 19 mm exit nozzle and accelerates downstream through a 19 mm diameter, 305 mm long unattached duct to the sample. A high-temperature, spring-loaded clamshell fixture is used to hold the sample during testing. The standoff distance between the exit of the duct and the center of the sample was set to 30 mm.
The samples were heated to the desired surface temperature as measured by an Ircon Modline (Fluke Process Instruments, Everett, WA, USA) 7.9 µm pyrometer. Three surface temperatures, T, were used: 800, 1200, and 1316 °C. The sample temperature was allowed to stabilize for 5 minutes before being exposed to alumina (Al2O3) particles that were injected into the burner at a rate of 2 g/min. Al2O3 was chosen as the erodent, since it has been shown to produce erosion damage similar to that observed in engine hardware [30] and it is readily available. Three different mean particle sizes, d, were used in this study: 27, 60, and 150 µm. The particles exhibit a sharp, angular morphology, as shown by the SEM images in Figure 4.
This study was performed in three separate phases. Phase 1 was performed at a fixed impingement angle, α = 90°, using d = 27, 60, and 150 µm sized particles to investigate the effect of particle kinetic energy, UK, at T = 1316 °C. A constant fuel/air ratio was used to reach the desired surface temperature. The corresponding velocity, v, for each particle size was measured using a high-temperature-capable double-disk velocimeter [46]. Phase 2 of this study investigated the effect of impingement angle, α. The surface temperature and particle size were kept constant at T = 1316 °C and d = 60 µm, respectively. Phase 3 investigated the effect of temperature on the erosion rate. Surface temperatures of T = 800, 1200, and 1316 °C were used, while α and d were fixed at 90° and 60 µm, respectively. Finally, Phase 4 measured the erosion rate of APS and EB-PVD 7YSZ TBCs. The TBCs were tested at T = 1200 °C and α = 90° using d = 27, 60, and 150 µm particles. A surface temperature of T = 1200 °C was chosen instead of T = 1316 °C, since 1200 °C is generally recognized as the upper use temperature of 7YSZ TBCs [49,50]. The results obtained in this study on EBCs and TBCs are also compared to existing data available in the literature. Table 1 summarizes the erosion conditions used in the four phases. For each phase and erosion condition, the samples were subjected to multiple exposures of 30 s each (1 g of erodent) and the sample mass was measured before and after each exposure. Three samples were tested at each erosion condition.
The steady-state erosion rate, E, in units [mg/g] was determined from the slope of the linear region of the cumulative mass loss, mL, versus cumulative mass erodent curve, me, as follows:
E   mg g = d m L d m e .
An exemplary cumulative mass loss versus cumulative mass erodent curve is shown in Figure 5 for the M2Y EBC at T = 1316 °C, d = 60 µm, v = 135 m/s, and α = 90°. The cumulative mass loss versus cumulative mass erodent curve is characterized by a high initial slope/erosion rate, E’ (transient region), followed by a decrease in slope until a well-defined linear region representing the steady-state erosion rate, E, is achieved. The higher initial erosion rate is generally associated with the initial surface roughness of the coating where asperities are easily fractured and removed. This phenomenon has been observed and described in other studies reported in the literature for both EBCs and TBCs [27,29,32]. While the effect of surface roughness was not investigated in this study, all samples tested in each phase and erosion condition exhibited similar behavior to the curve shown in Figure 5. Lastly, the eroded surfaces and polished cross-sections were analyzed using SEM (Phenom ProX, ThermoFisher Scientific, Waltham, MA, USA) to study the damage morphology and identify the operative erosion mechanisms.

3. Results and Discussion

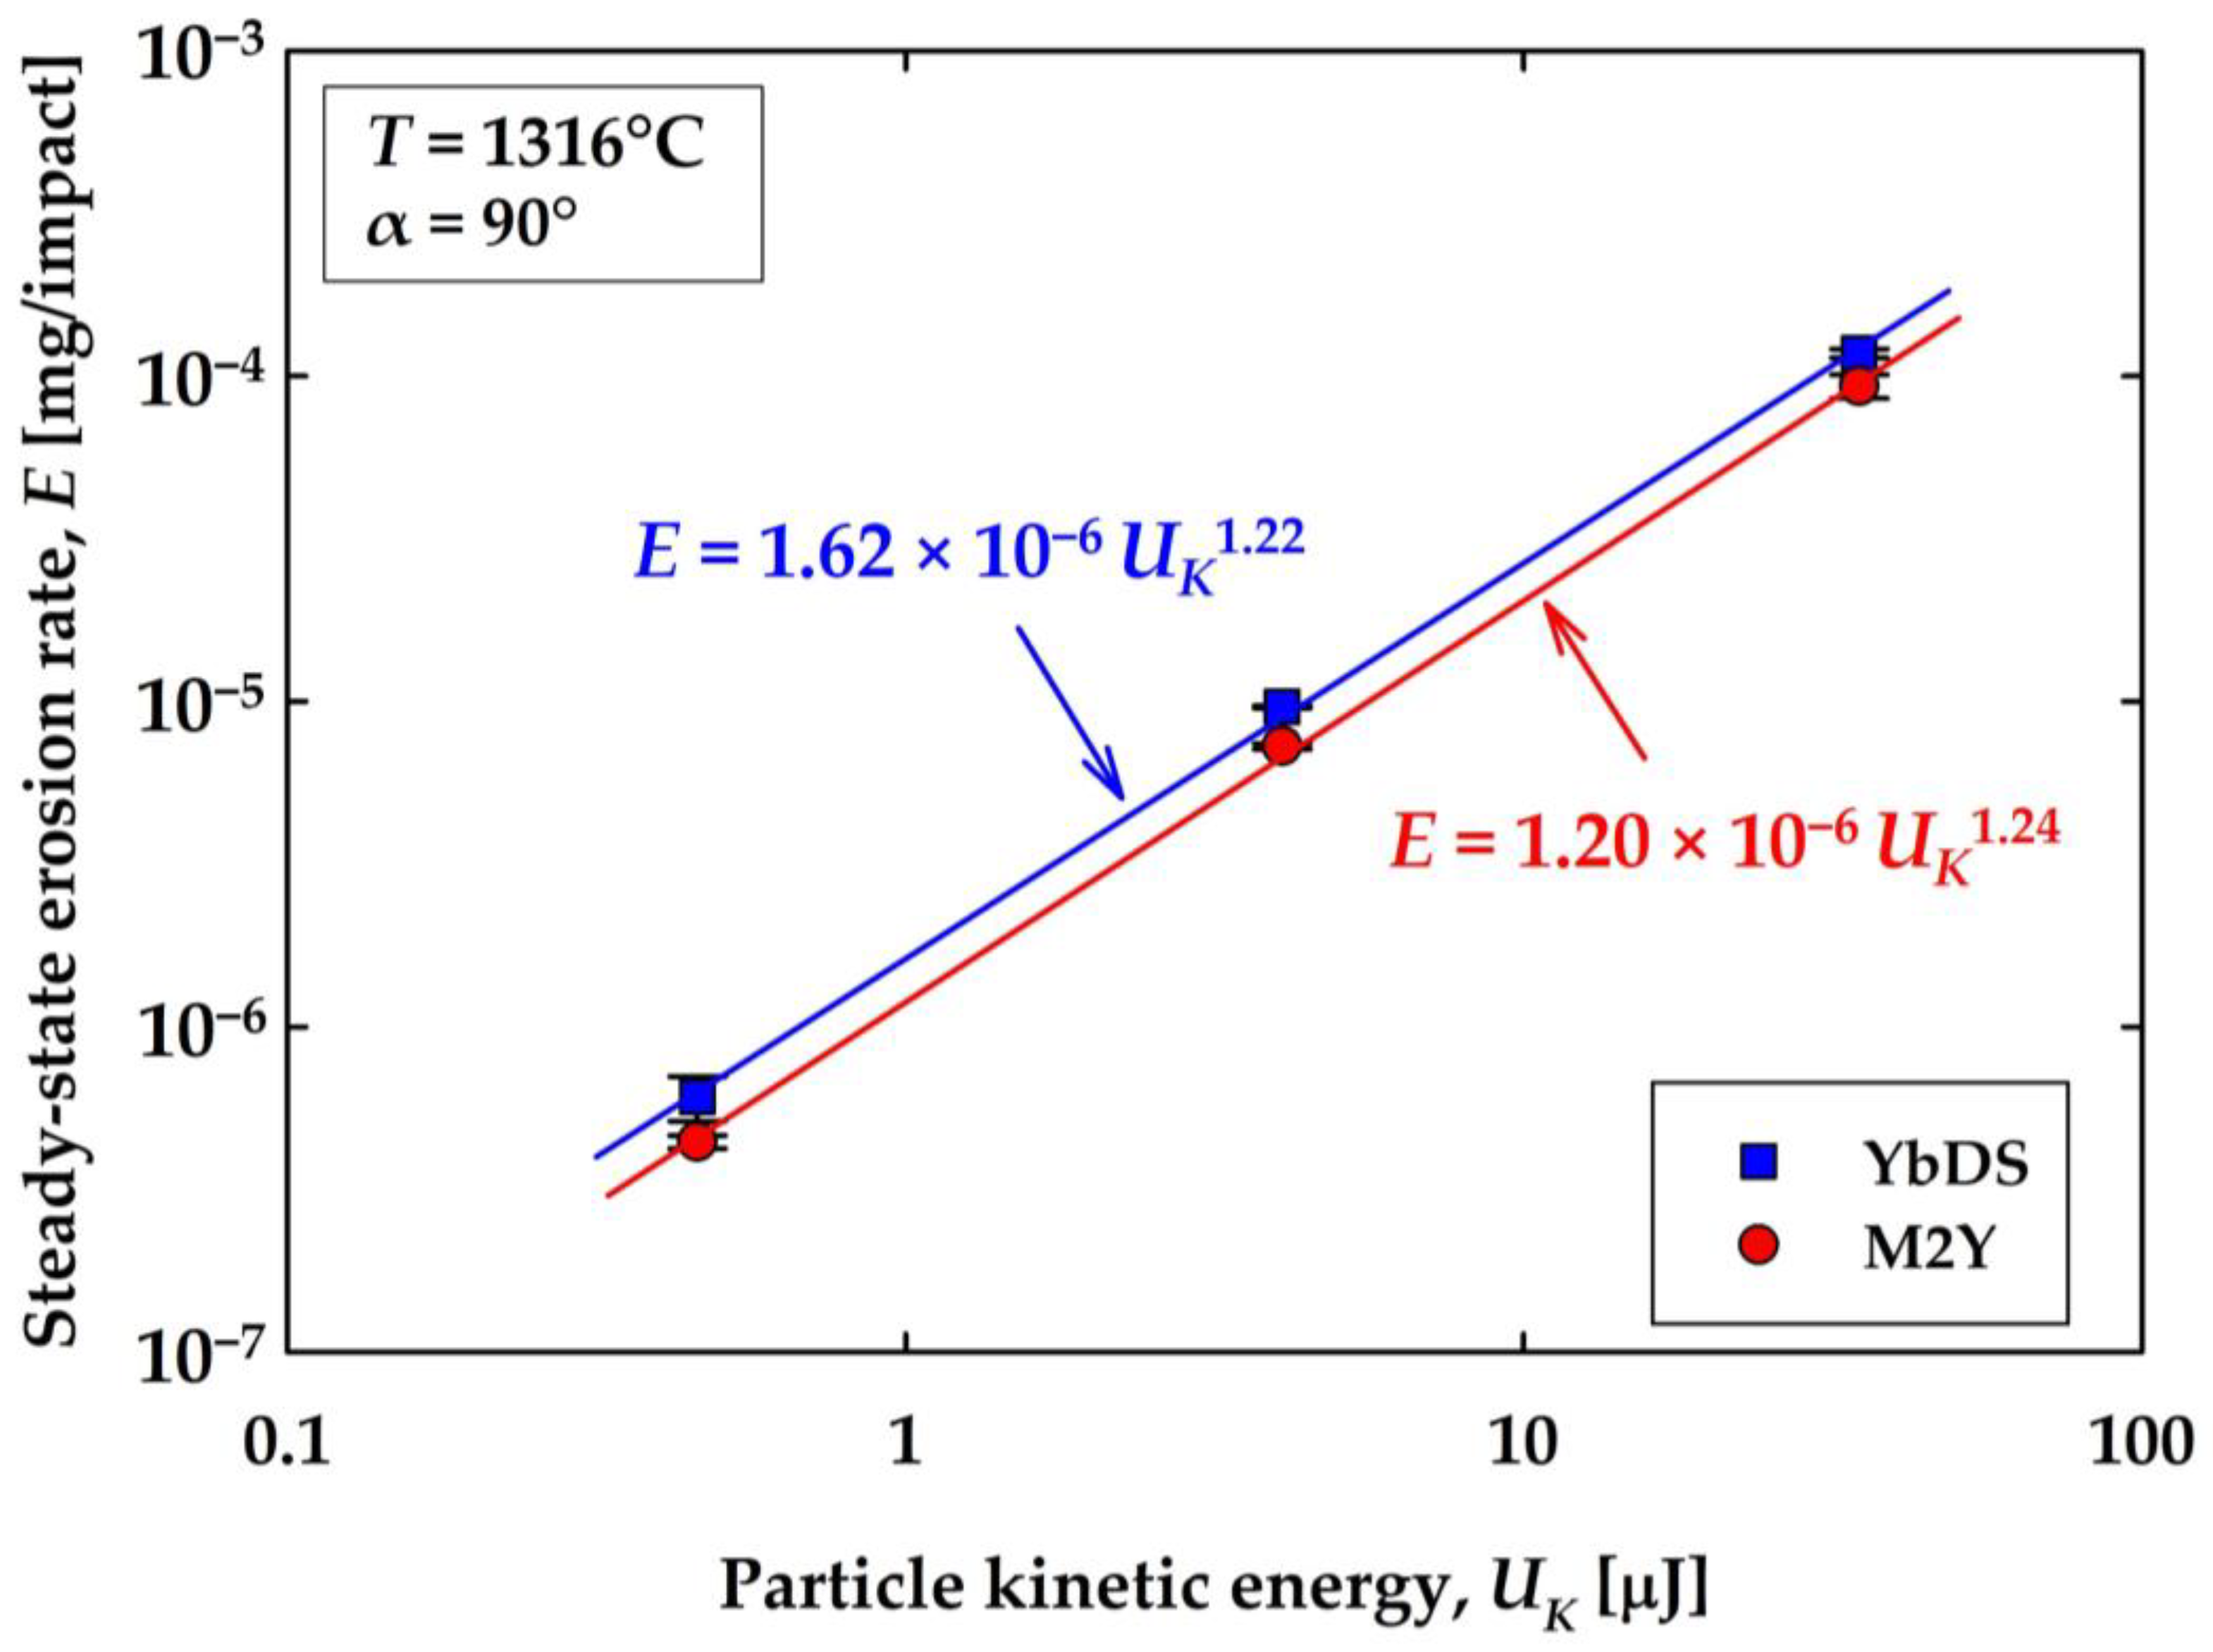
3.1. Phase 1—Particle Kinetic Energy (EBCs)

The steady-state erosion rate, E, for brittle materials has been shown to exhibit a power law functional dependence with respect to particle kinetic energy, UK, of the form
E = γ U K b
where γ is a constant of proportionality that is a function of target and particle properties and erosion conditions such as temperature and impingement angle, and b is the kinetic energy exponent. When analyzing the erosion rate dependence with respect to kinetic energy with the use of different particle sizes, a conversion of the erosion rate from mass loss per gram of erodent [mg/g] to mass loss per particle impact [mg/impact] is required. This conversion accounts for the fact that the total number of particles, and therefore the total number of impact events, per gram of erodent is different for 27, 60, and 150 µm particle sizes. As a result, the steady-state erosion rate defined by Equation (1) is multiplied by the mass of an individual particle, mp to obtain the steady-state erosion rate in units [mg/impact] as follows:
E   mg impact = d m L d m e m p .
Figure 6 shows the steady-state erosion rate for the YbDS and M2Y EBCs as a function of particle kinetic energy, where γ = 1.62 × 10⁻⁶ and b = 1.22 for YbDS, and γ = 1.20 × 10⁻⁶ and b = 1.24 for M2Y. This shows that the M2Y EBC is approximately 25% more resistant to erosion damage compared to the YbDS EBC.
The kinetic energy dependence observed in this work is also in line with that observed in the literature from other erosion studies on EBCs. Singh et al. [25] observed an exponent b = 1.35 for a barium-strontium-aluminosilicate (BSAS) EBC deposited via plasma spray and tested under vacuum at α = 90° using d = 63 µm Al2O3. Moreover, in a previous study by two of the authors [27] on the high-temperature SPE behavior of YbDS deposited via plasma spray-physical vapor deposition (PS-PVD), a kinetic energy exponent of b = 1.26 was observed. The dependence observed here is also comparable to that predicted by erosion models based on indentation fracture mechanics for bulk, monolithic brittle materials, where b = 1.22 for a quasi-static model developed by Weiderhorn and Lawn [54], and b = 1.16 for a modified quasi-static model derived by Marshall et al. [55].

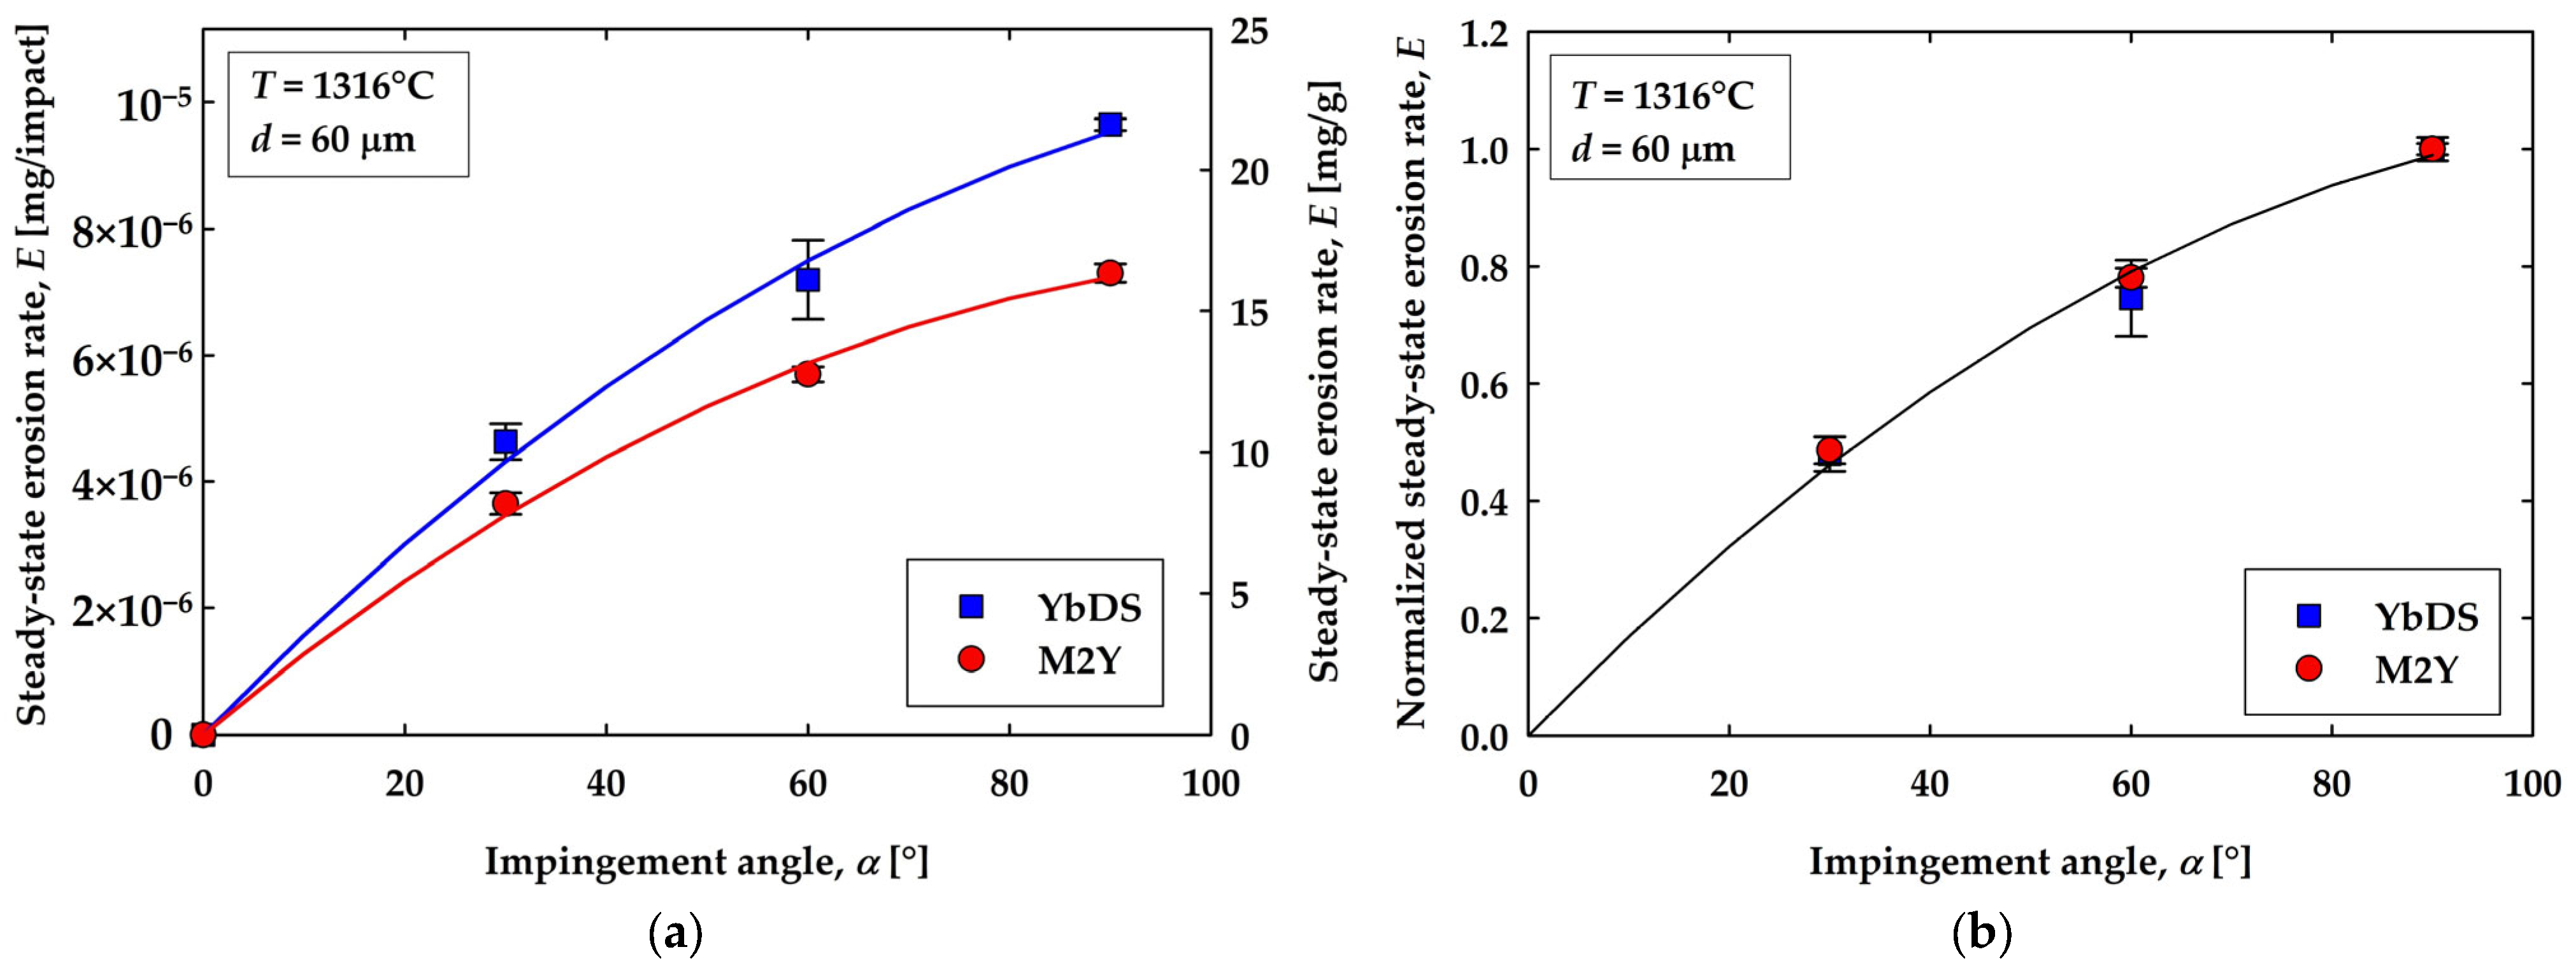
3.2. Phase 2—Impingement Angle (EBCs)

The effect of impingement angle, α, is shown in Figure 7a,b. Since a single particle size was used in Phase 2, the steady-state erosion rate, E, can also be expressed in units [mg/g], as shown by the secondary y-axis in Figure 7a. For both the YbDS and M2Y, the steady-state erosion rate is observed to increase as α increases from 30° to 90°. This is characteristic of brittle-dominated erosion behavior, where the maximum occurs at 90°. The M2Y is observed to have a lower erosion rate, by ~25%, compared to the YbDS EBC at all impingement angles, as shown in Figure 7a. Although the M2Y EBC has a lower absolute erosion rate, normalizing the data with respect to 90°, as displayed in Figure 7b, shows that the M2Y exhibits the same functional dependence with respect to α as YbDS.
Previous work on the addition of modifiers to improve the oxidation resistance of EBCs showed that the oxidation rate under the EBC can be significantly reduced, leading to an overall improvement in EBC life [3]. The M2Y EBC was shown to improve EBC life by ~60× compared with the baseline YbDS EBC [3]. As such, the critical observation from Phase 1 and Phase 2 of this study is that the modifications in the M2Y EBC for improved oxidation do not appear to be detrimental to the SPE resistance.

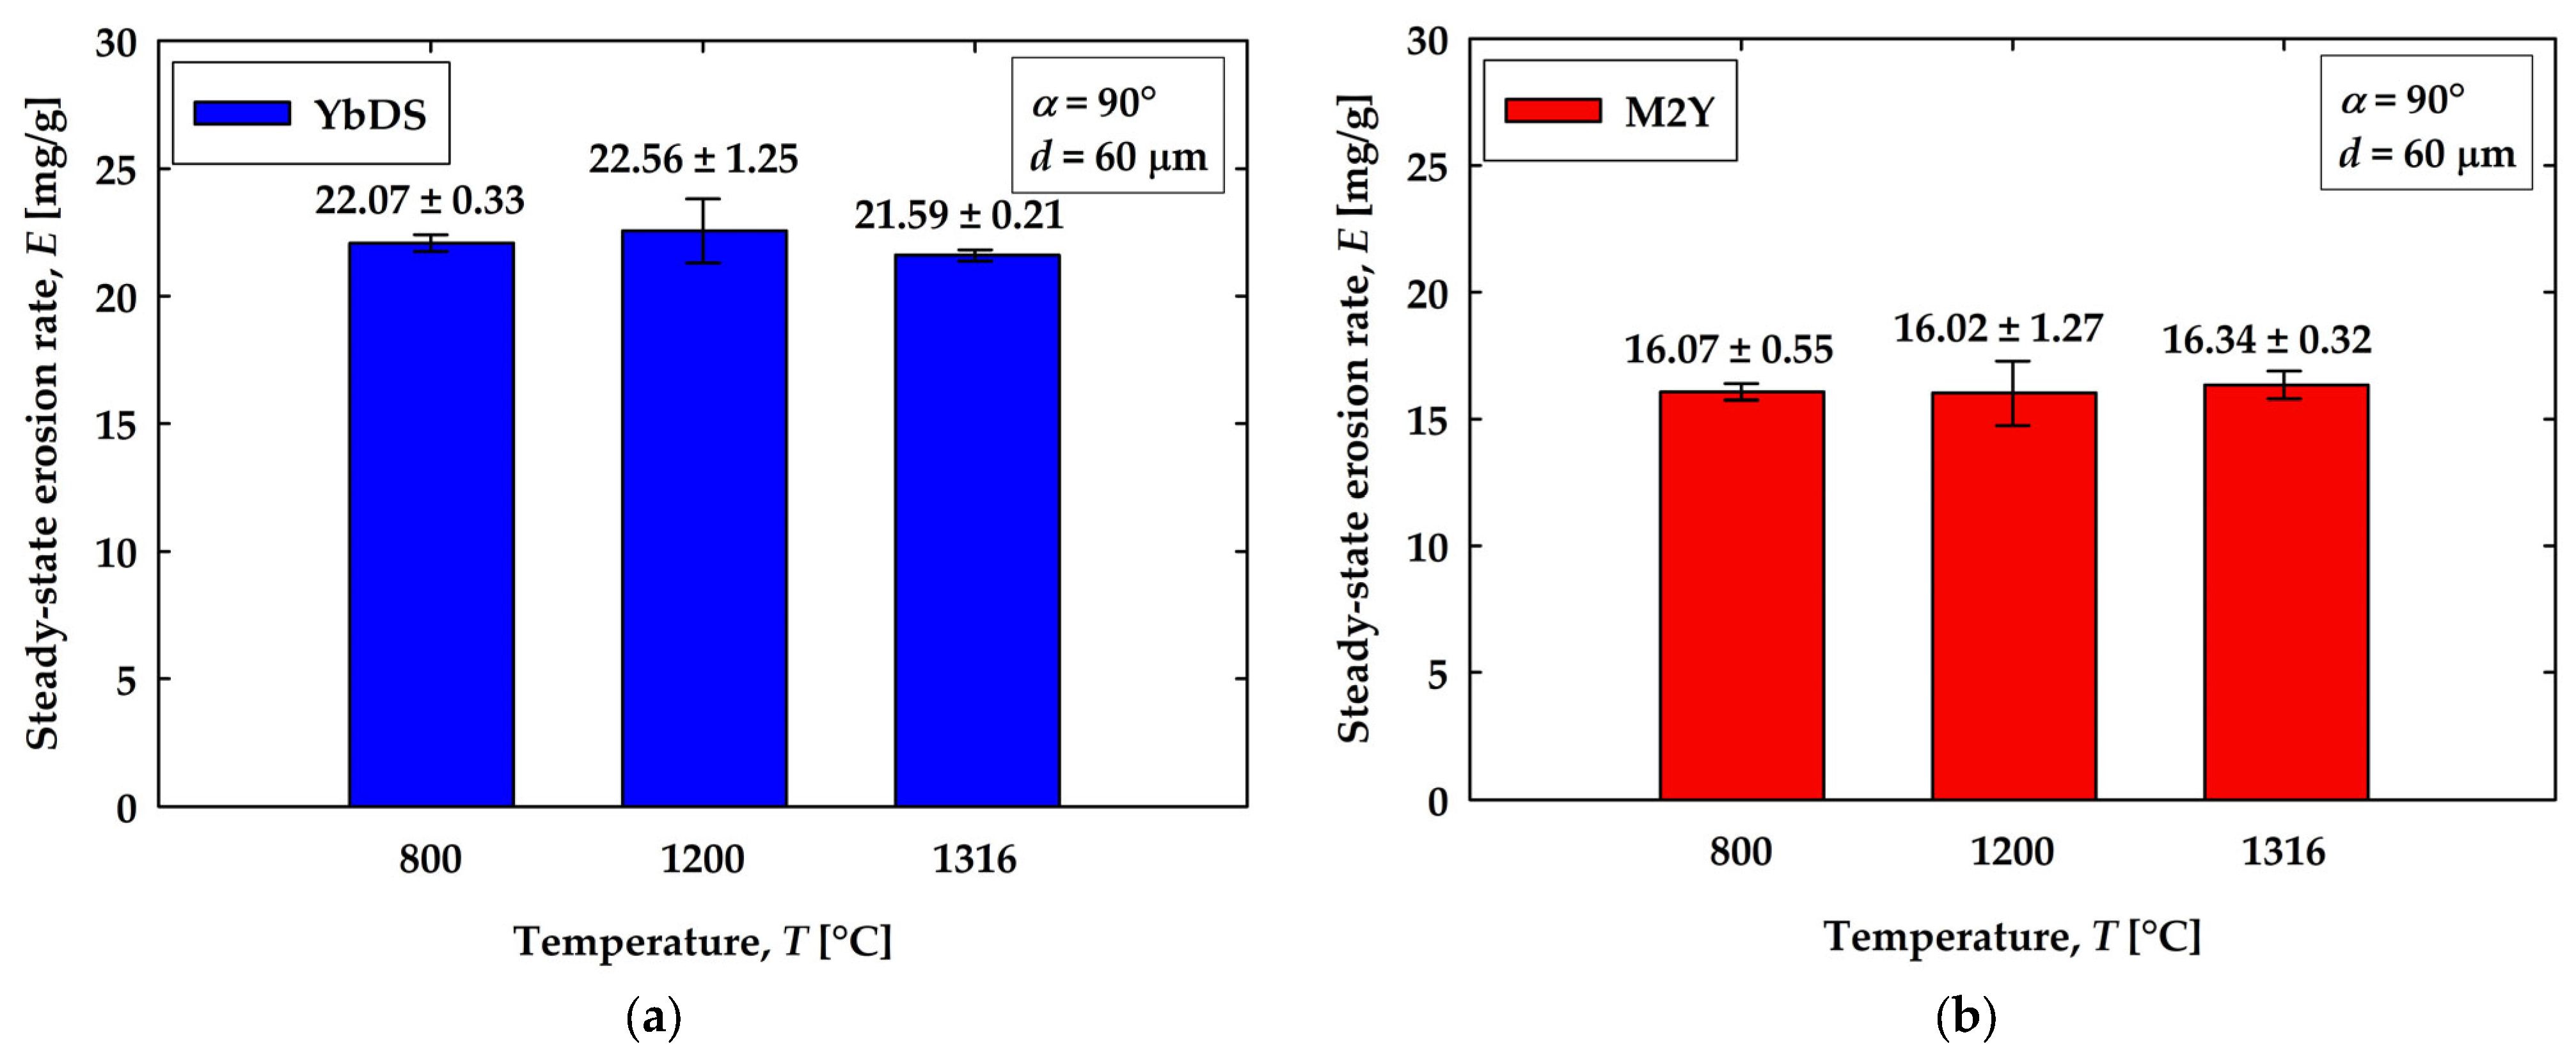
3.3. Phase 3—Temperature (EBCs)

The effect of temperature, T, on the erosion rate is shown in Figure 8a,b for α = 90° and d = 60 µm. For both the YbDS and M2Y EBCs, there does not appear to be any significant effect of temperature on the steady-state erosion rate when comparing between 800, 1200, and 1316 °C. For the YbDS EBC, the average steady-state erosion rate varies less than 5%, and for the M2Y EBC, the average varies approximately 2% over the range of tested temperatures.

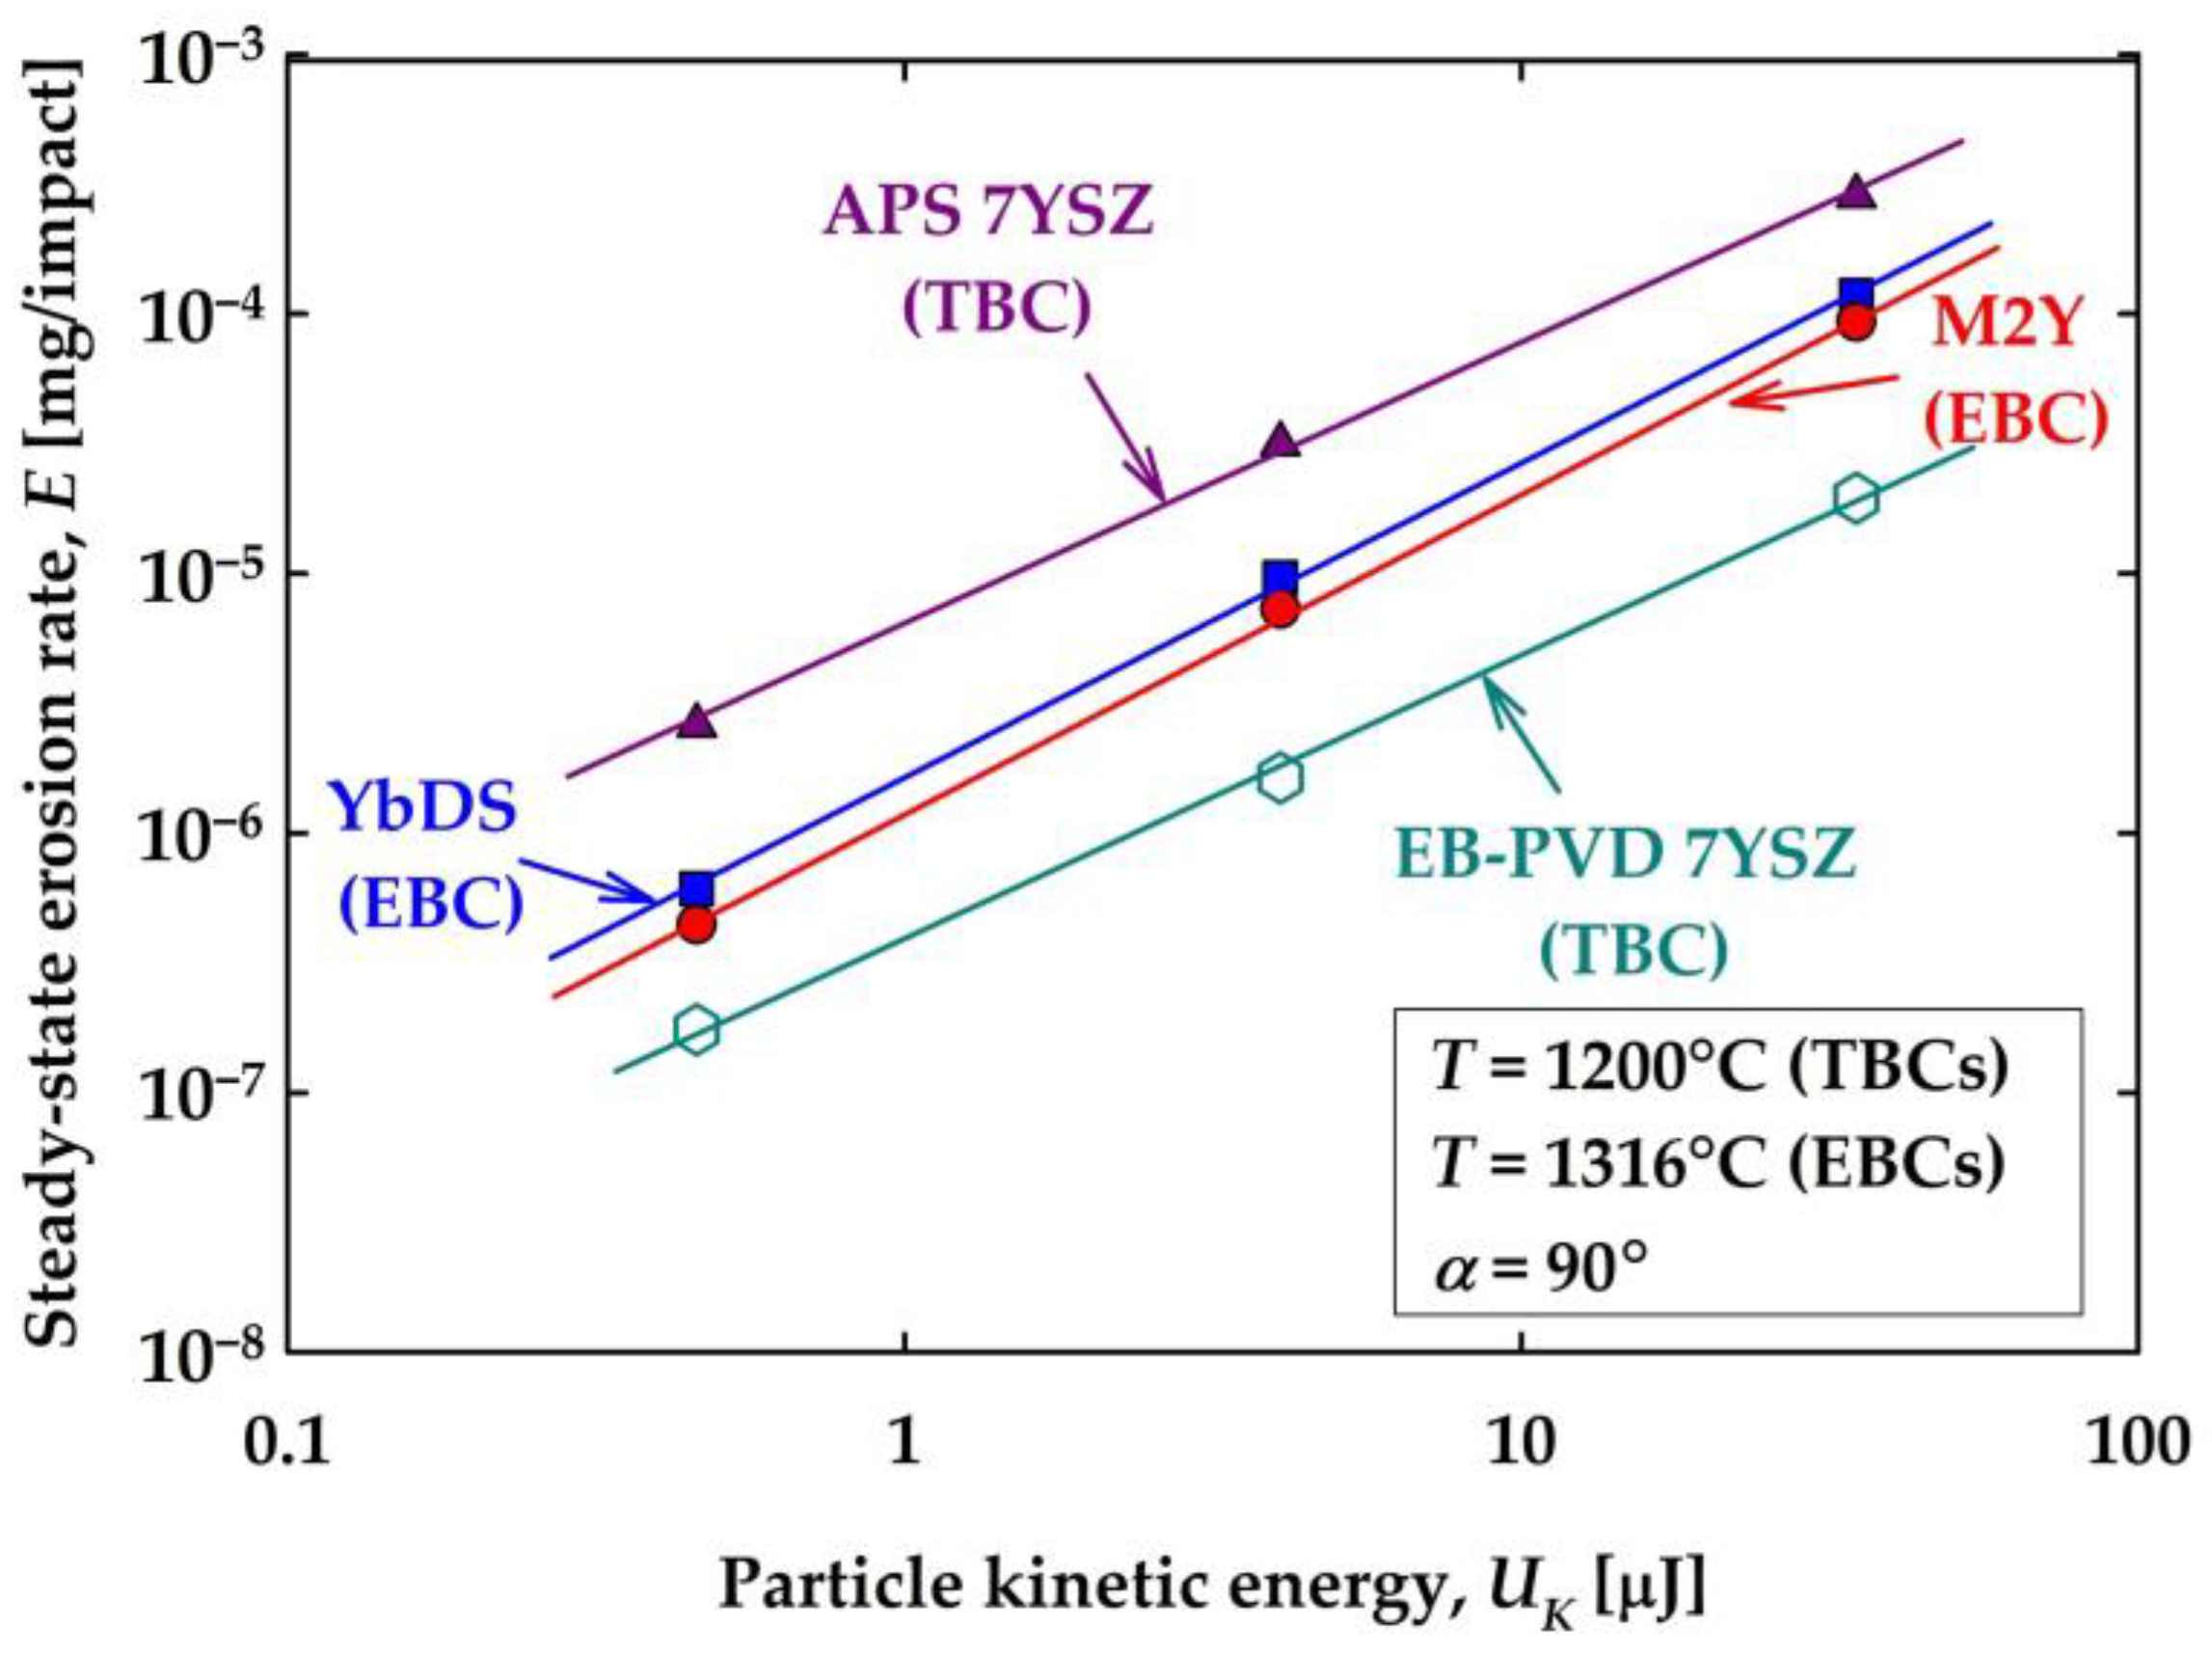
3.4. Phase 4—Particle Kinetic Energy (TBCs)

The steady-state erosion rate for the APS and EB-PVD 7YSZ TBCs is shown in Figure 9 for T = 1200 °C and α = 90°. Similar to the EBC results presented in Section 3.1, the APS and EB-PVD TBCs exhibit a power law functional dependence with respect to particle kinetic energy, UK, as expressed by Equation (2), where γ = 6.33 × 10⁻⁶ and b = 1.08 for the APS 7YSZ, and γ = 3.89 × 10⁻⁷ and b = 1.09 for the EB-PVD 7YSZ. It is evident that the EB-PVD coatings have far greater erosion resistance, as the steady-state erosion rate of the EB-PVD 7YSZ is approximately 16 times lower than that of the APS 7YSZ. This result is consistent with other studies available in the literature where EB-PVD 7YSZ has been shown to be approximately 7–25 times more resistant (e.g., lower erosion rate) when compared to APS 7YSZ [33].

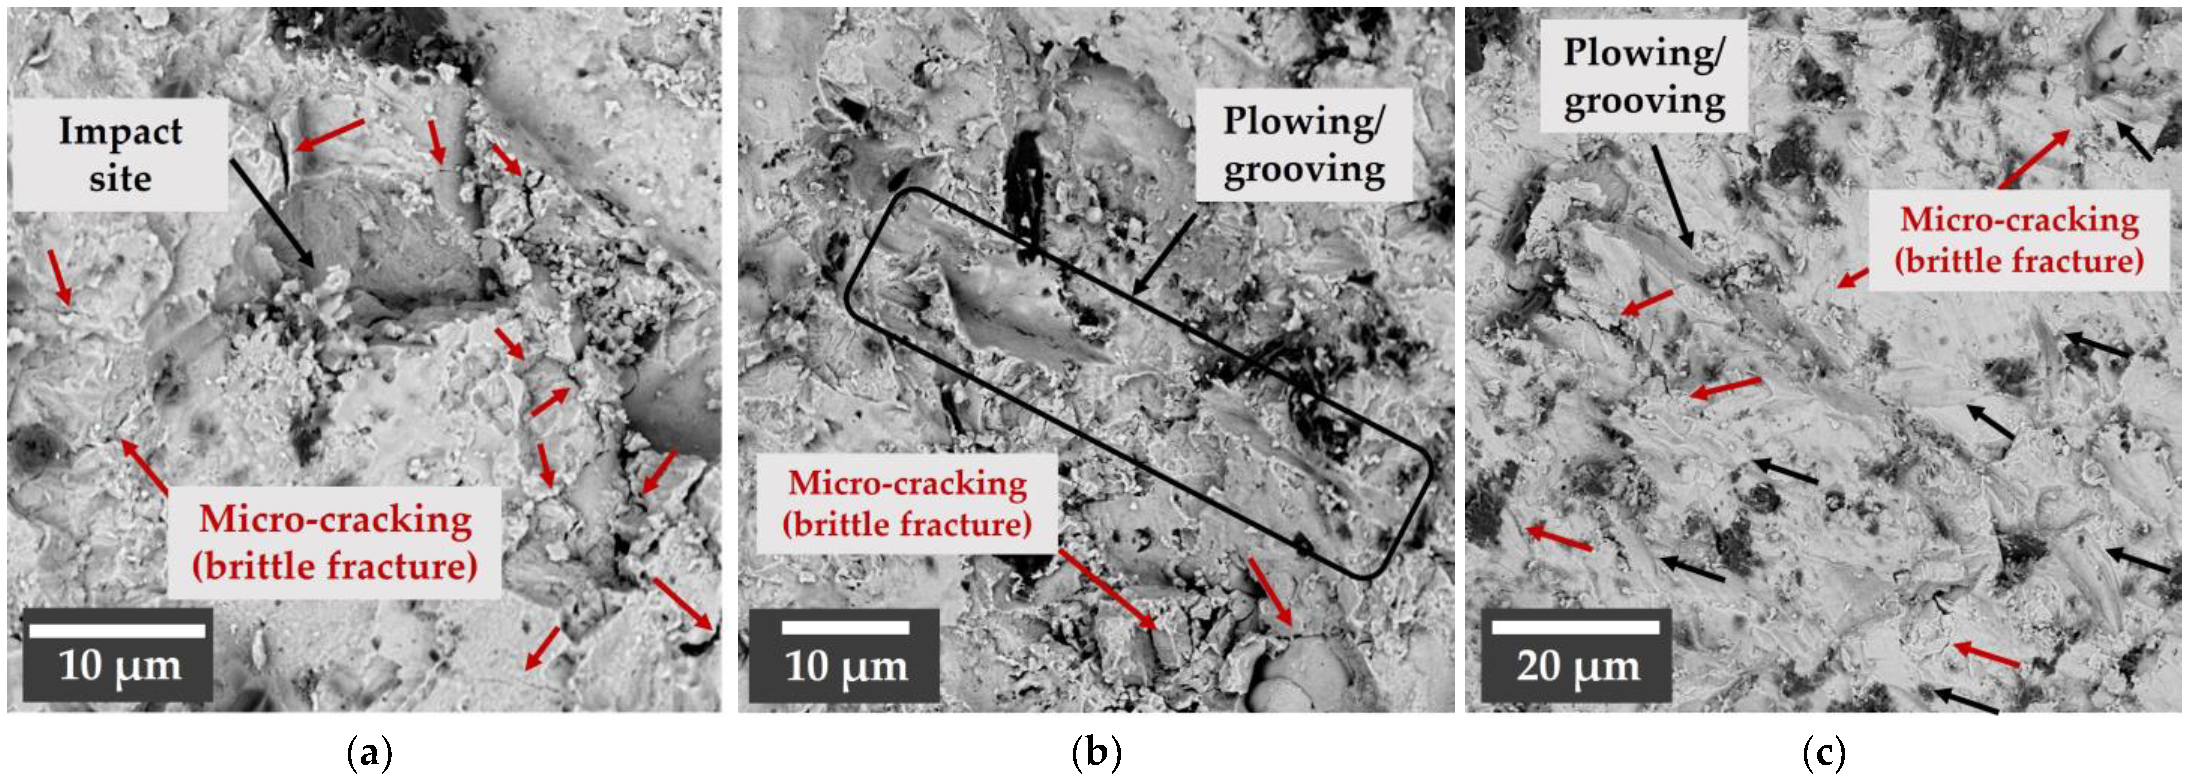
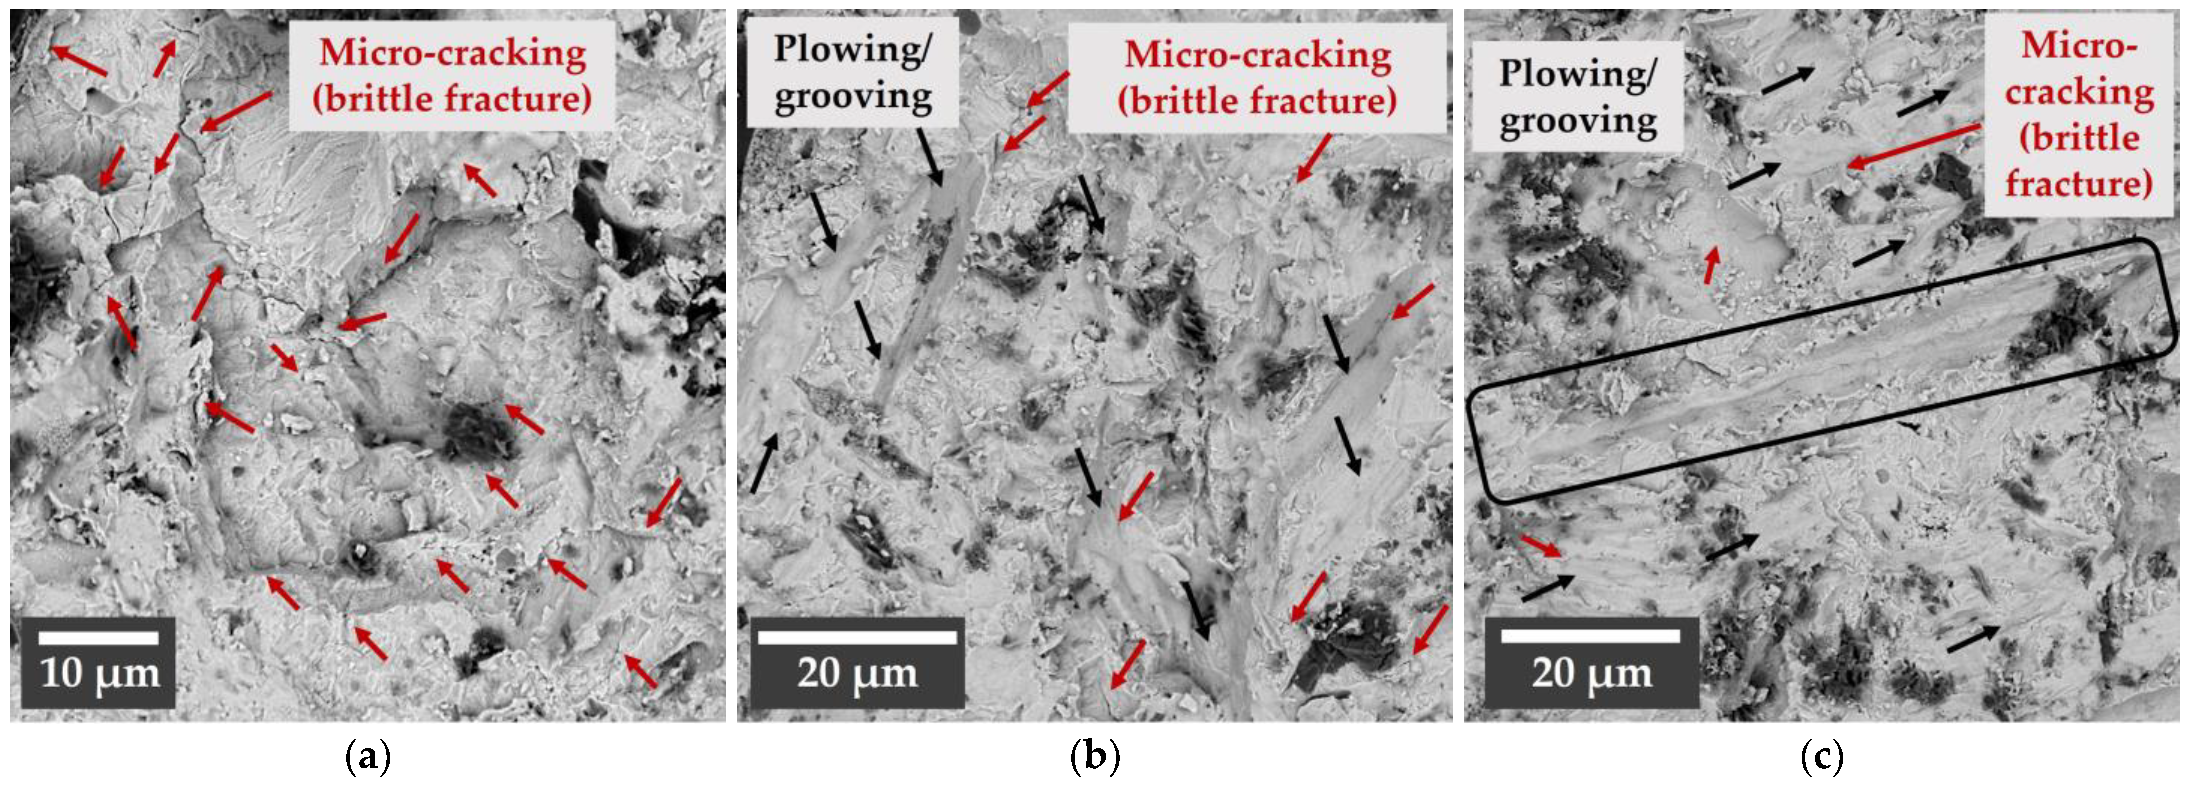
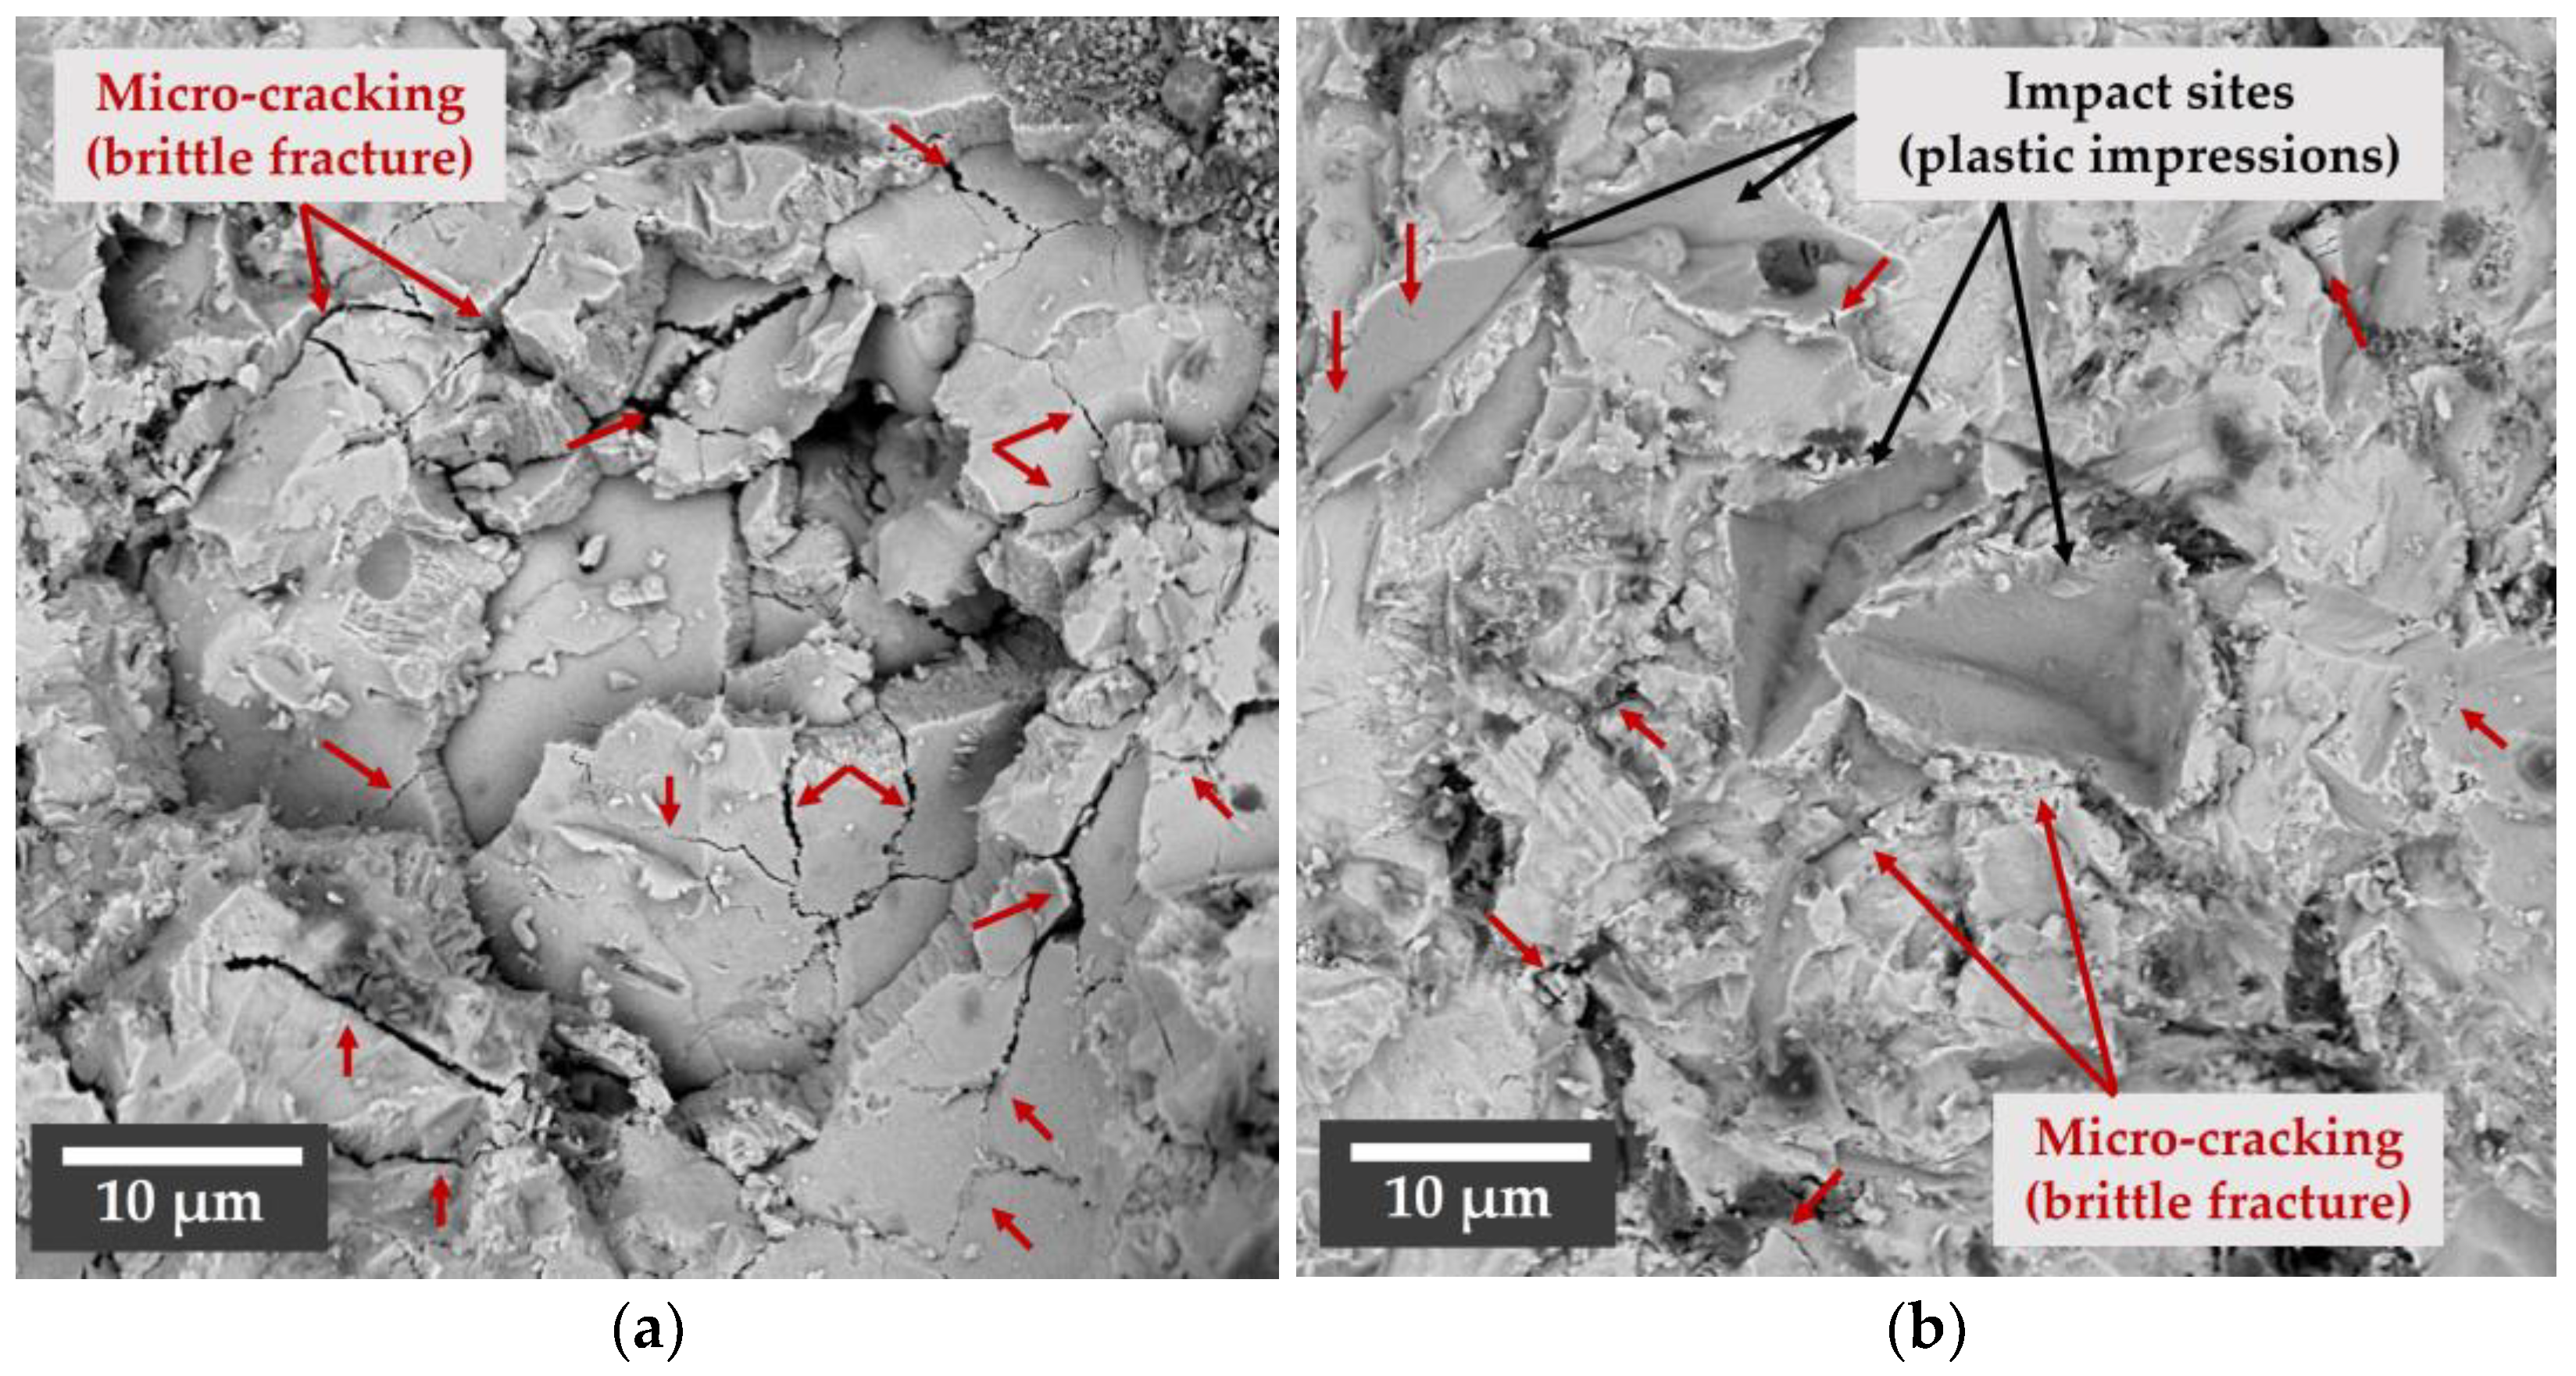
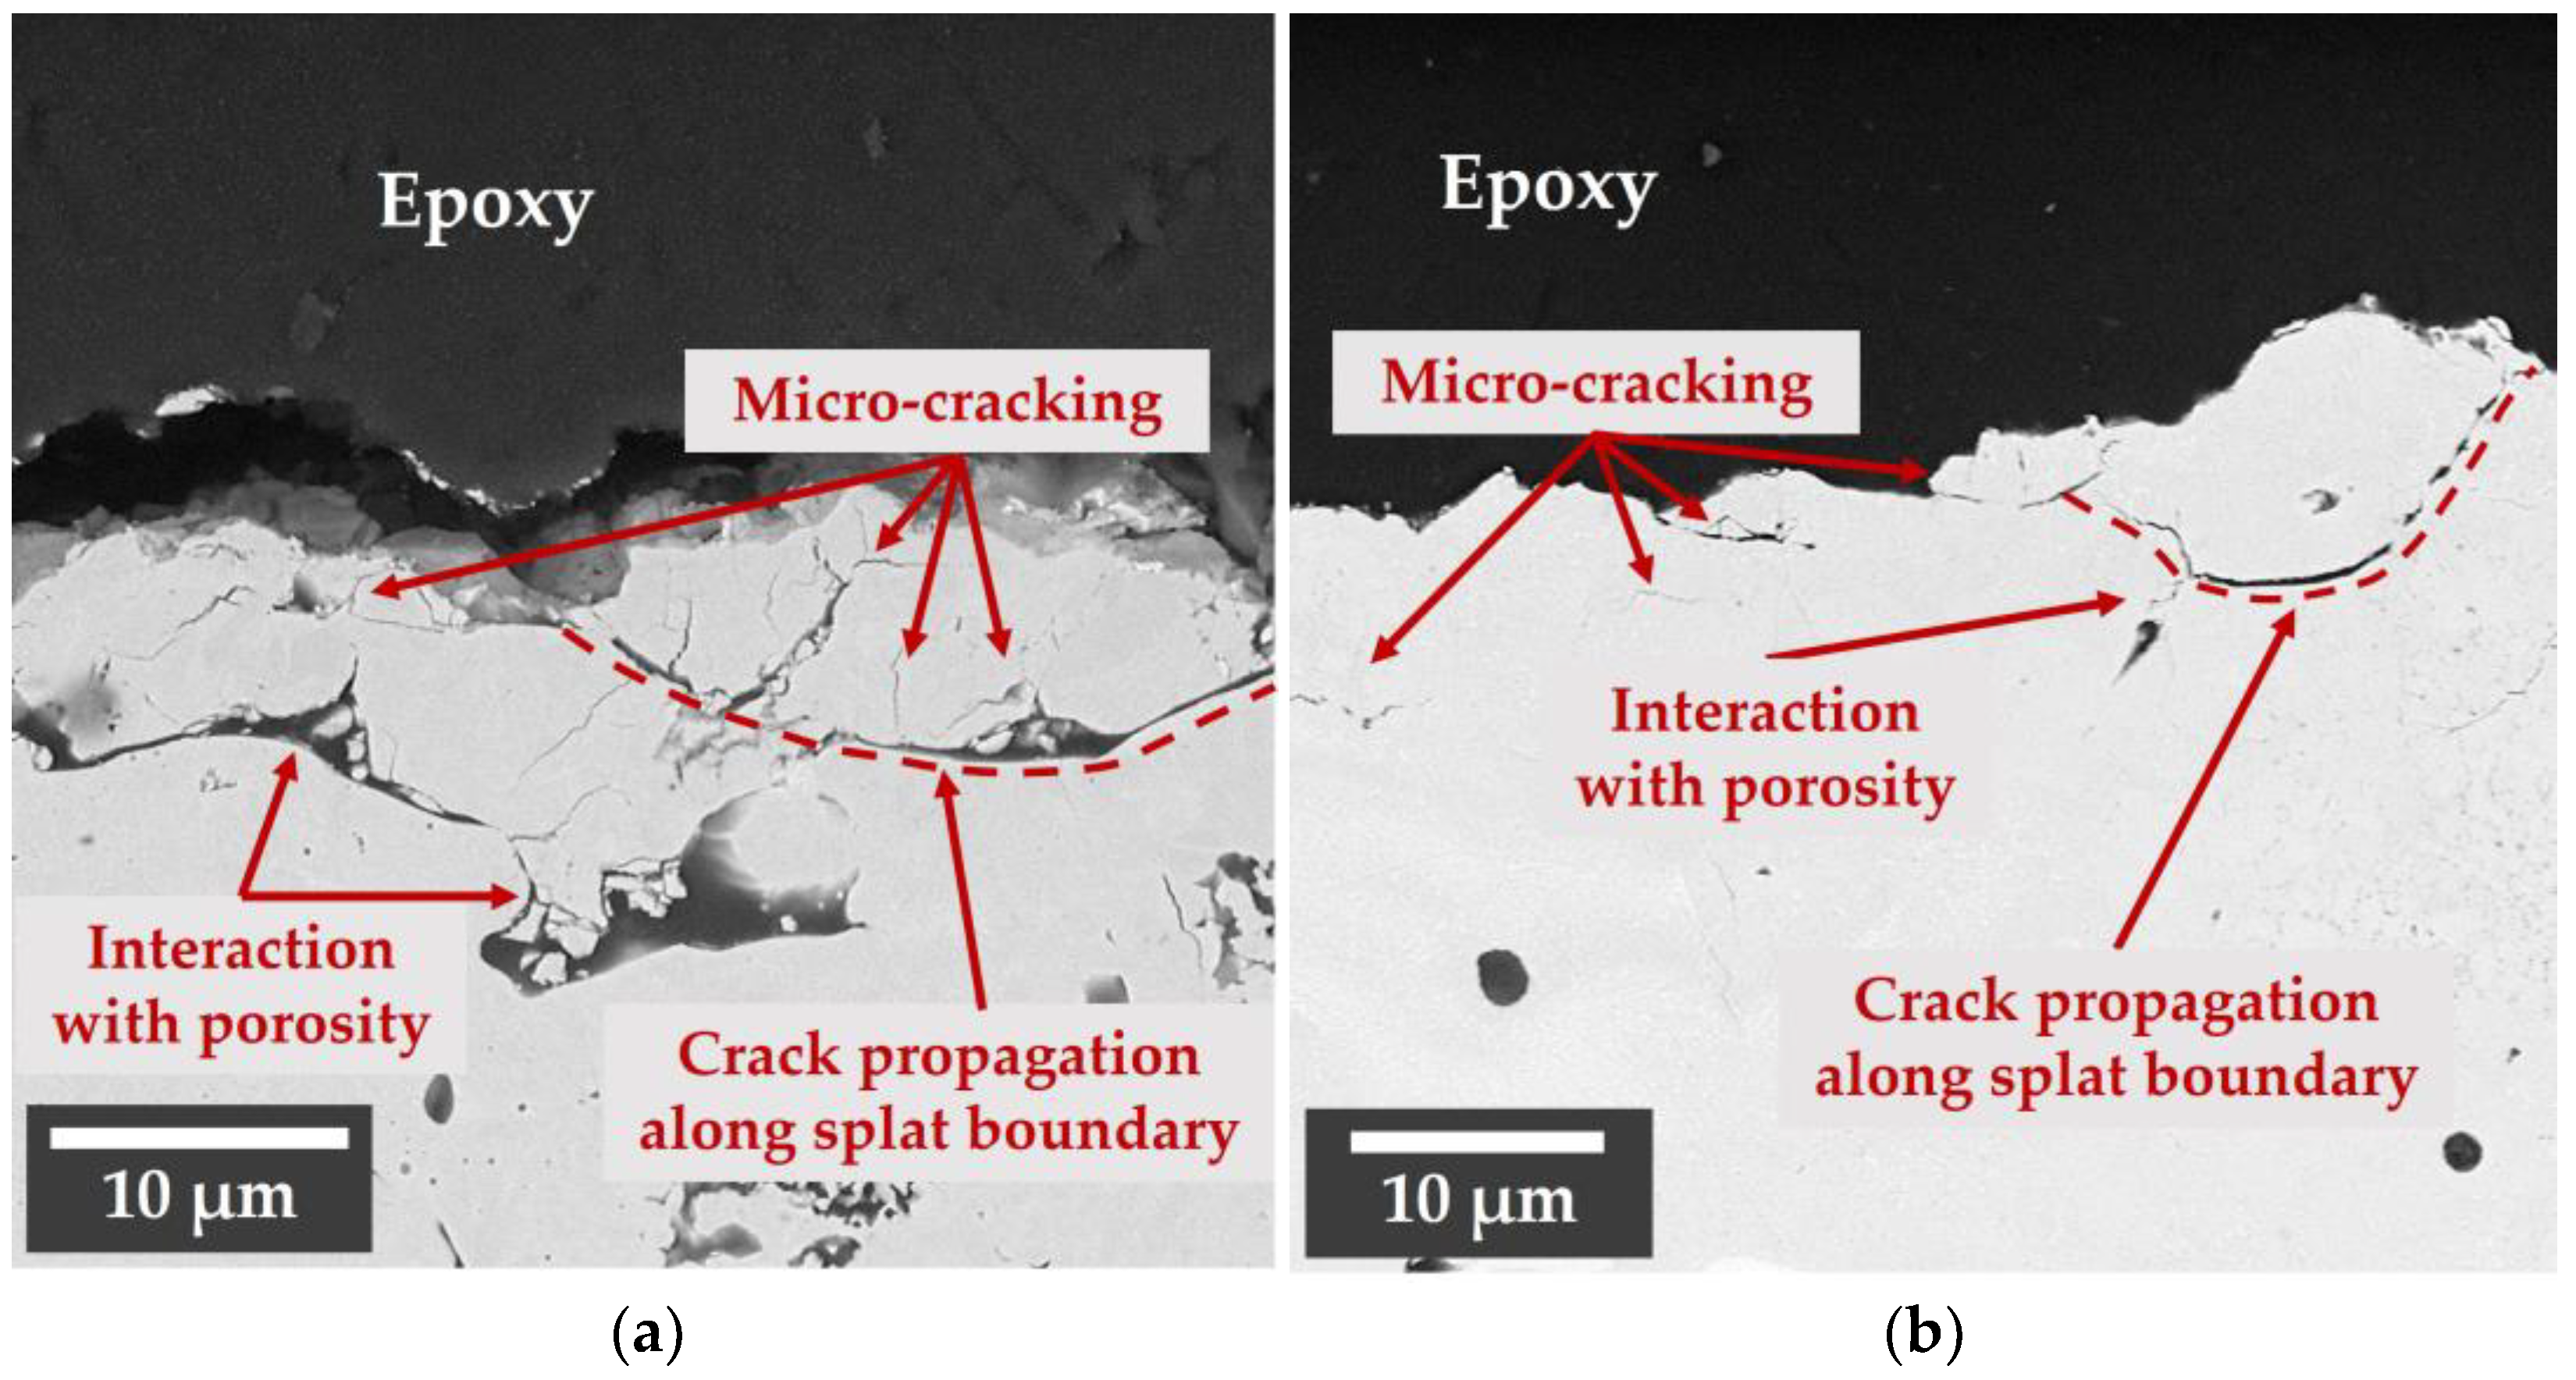
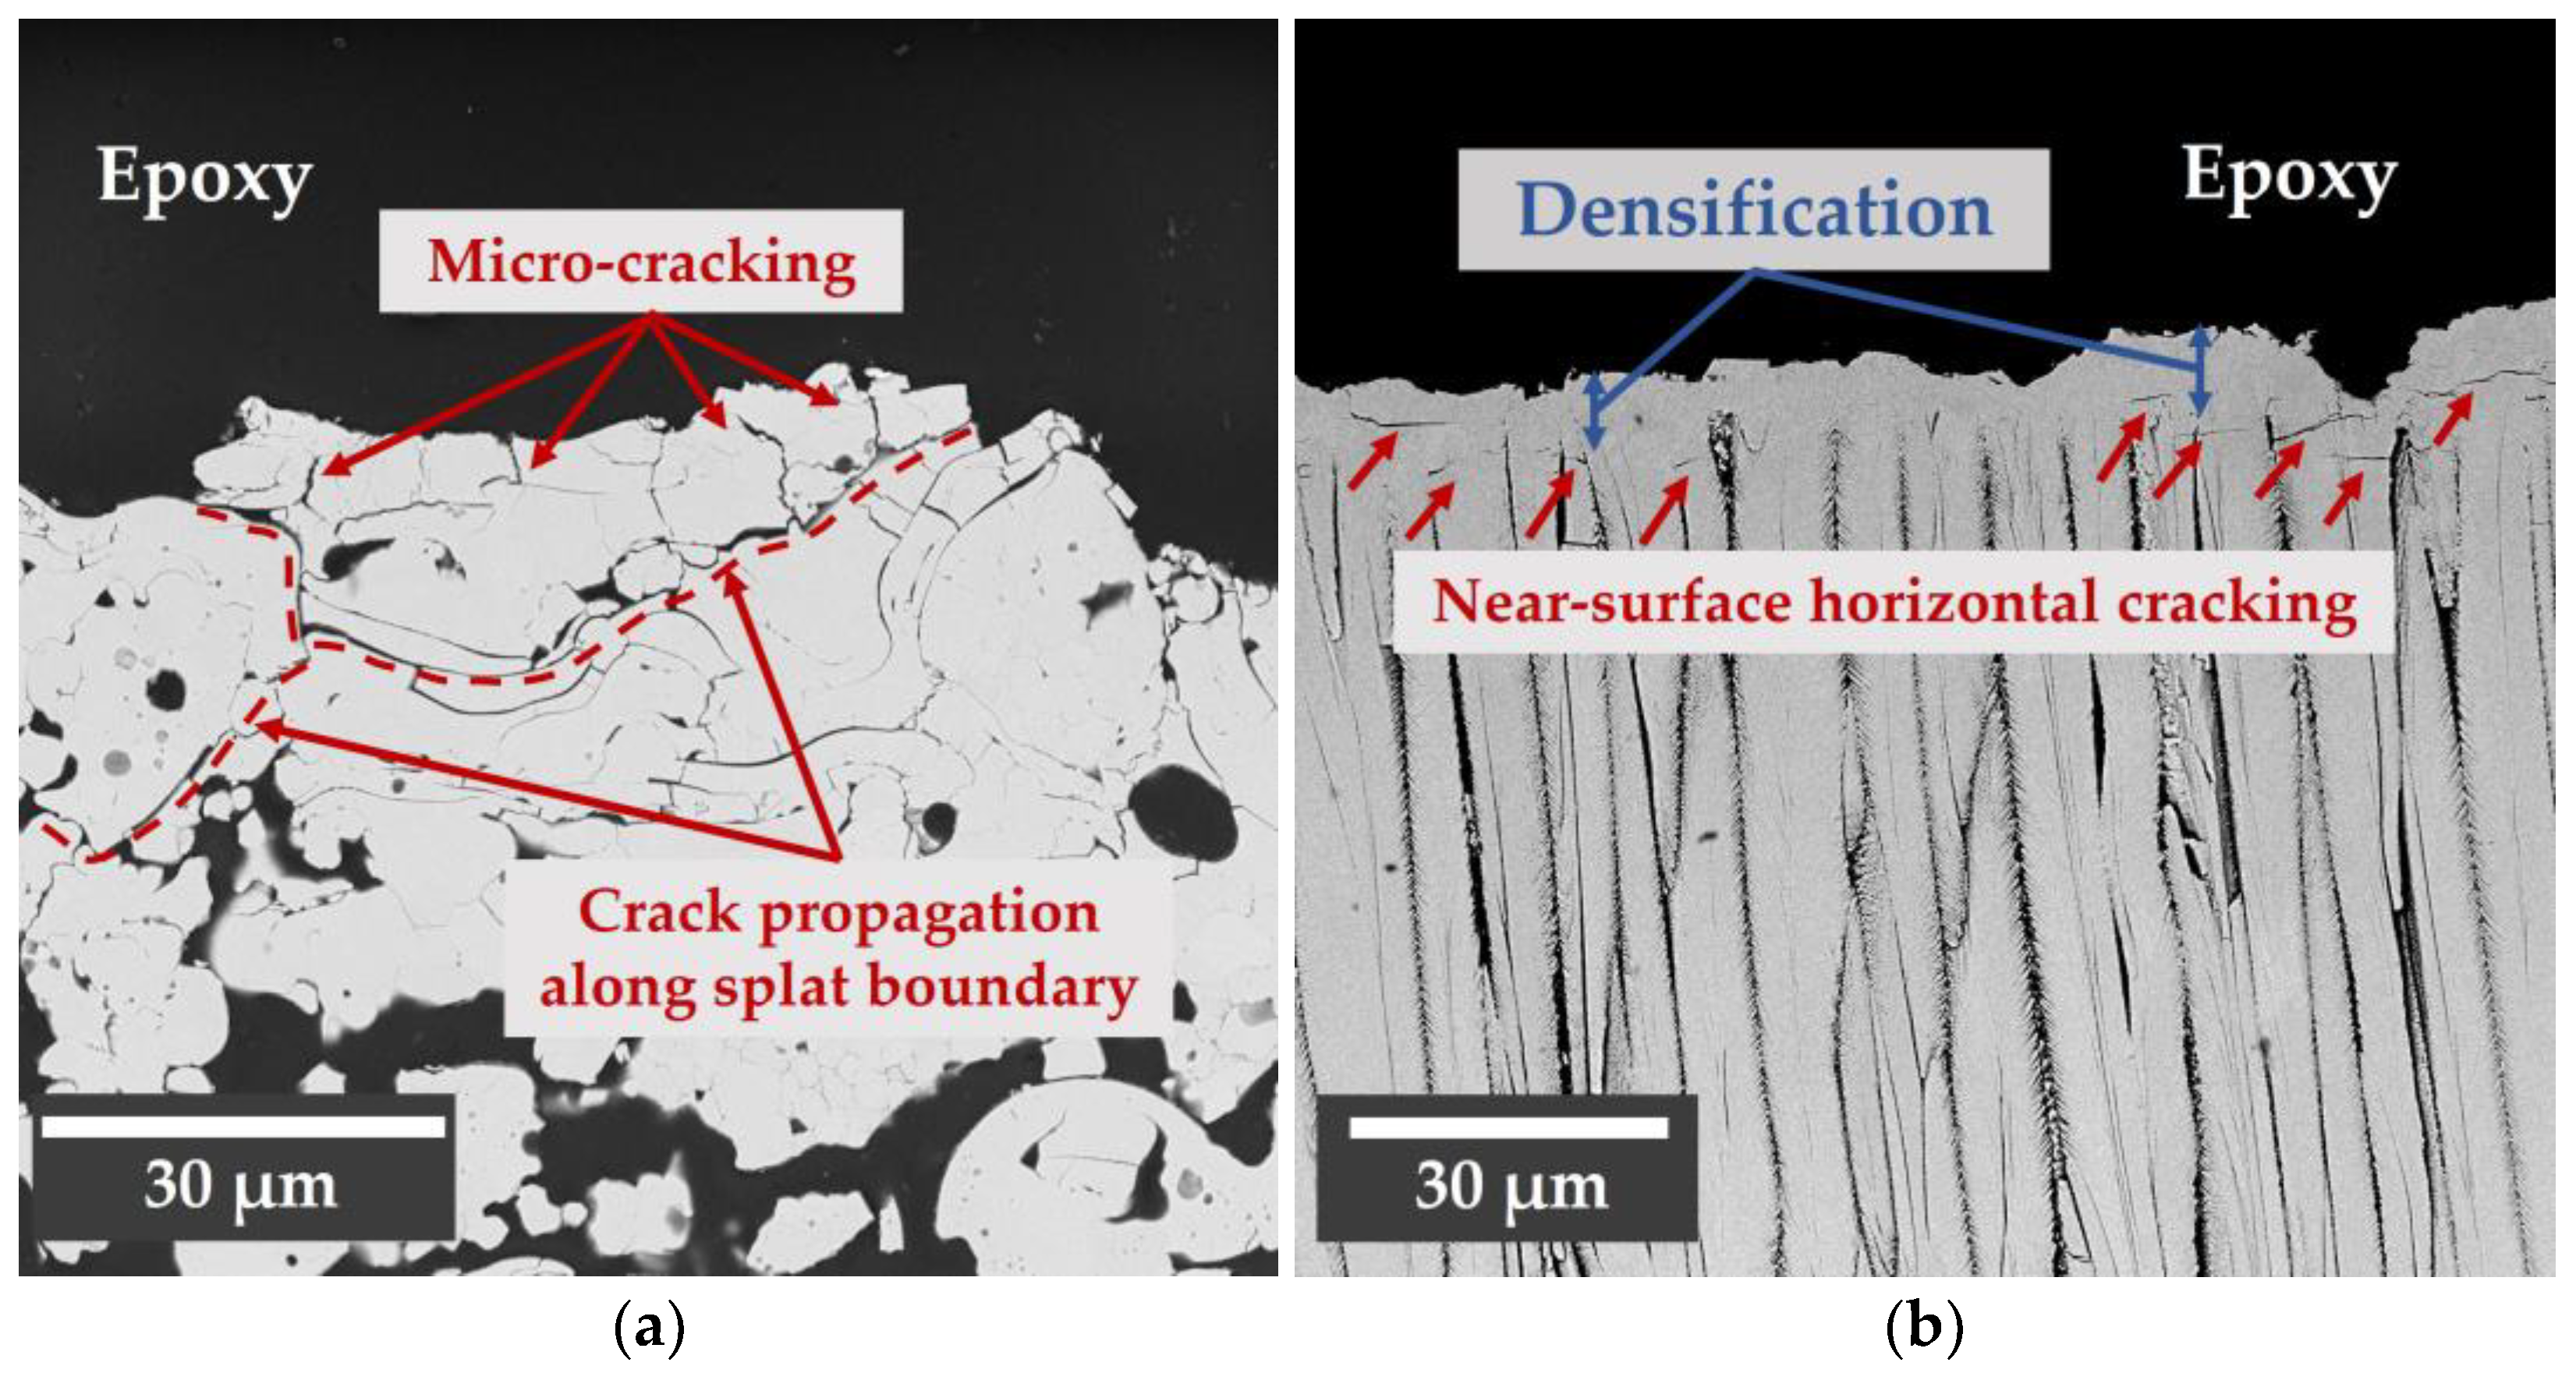
3.5. Erosion Damage Morphology

SEM images of the erosion surfaces for the YbDS EBC at T = 1316 °C, d = 60 µm, and α = 90°, 60°, and 30° are shown in Figure 10. At α = 90°, plastic impressions reminiscent of an impacting particle (e.g., sharp indenter), along with micro-cracks that result in surface chipping of the material (e.g., brittle fracture mode of erosion), are observed. As α decreases to 60° and 30°, shown in Figure 10b,c, respectively, there is an increase in plowing/grooving that is a result of an impacting particle sliding along the surface. Micro-cracking is still evident at lower α, but the overall surface appears smoother as a result of reduced surface chipping due to brittle fracture and the increase in plowing/grooving, which is more representative of a ductile erosion process. Similar observations were made for the M2Y EBC, as shown in Figure 11.
Erosion surface morphologies for the APS and EB-PVD 7YSZ TBCs at T = 1200°, d = 60 µm, and α = 90° are shown in Figure 12. For the APS 7YSZ shown in Figure 12a, significant micro-cracking is observed, highlighting that material removal occurs via a brittle mode of erosion. For the EB-PVD 7YSZ shown in Figure 12b, micro-cracking is evident, along with well-defined plastic impressions from impacting particles. It is evident that the extent of micro-cracking in the EB-PVD 7YSZ is much lower compared to the APS 7YSZ, which appears to correlate with the higher erosion resistance observed for the EB-PVD microstructure based on the measured erosion rates.
Polished cross-sections showing the subsurface erosion damage for the APS YbDS and M2Y EBCs are shown in Figure 13. The subsurface damage morphology was similar for both EBCs. Micro-cracking was observed to occur along splat boundaries, resulting in delaminated material. Inter-splat micro-cracking was also noticed, along with cracks interacting with existing defect centers such as porosity.
Figure 14 shows the polished cross-sections for the APS and EB-PVD 7YSZ TBCs. For the APS 7YSZ, significant micro-cracking was observed, where the cracks propagate along splat boundaries and interact with existing defect centers such as porosity. For the EB-PVD 7YSZ, a region of densification was observed extending approximately 8 µm below the surface. Near-surface horizontal cracks were observed, but they were generally confined to single columns, where crack propagation to neighboring columns appeared to be hindered by the columnar boundaries/gaps. The erosion damage observations for the APS and EB-PVD TBCs are consistent with what has been presented and described by other researchers [28,33,34,35,36].

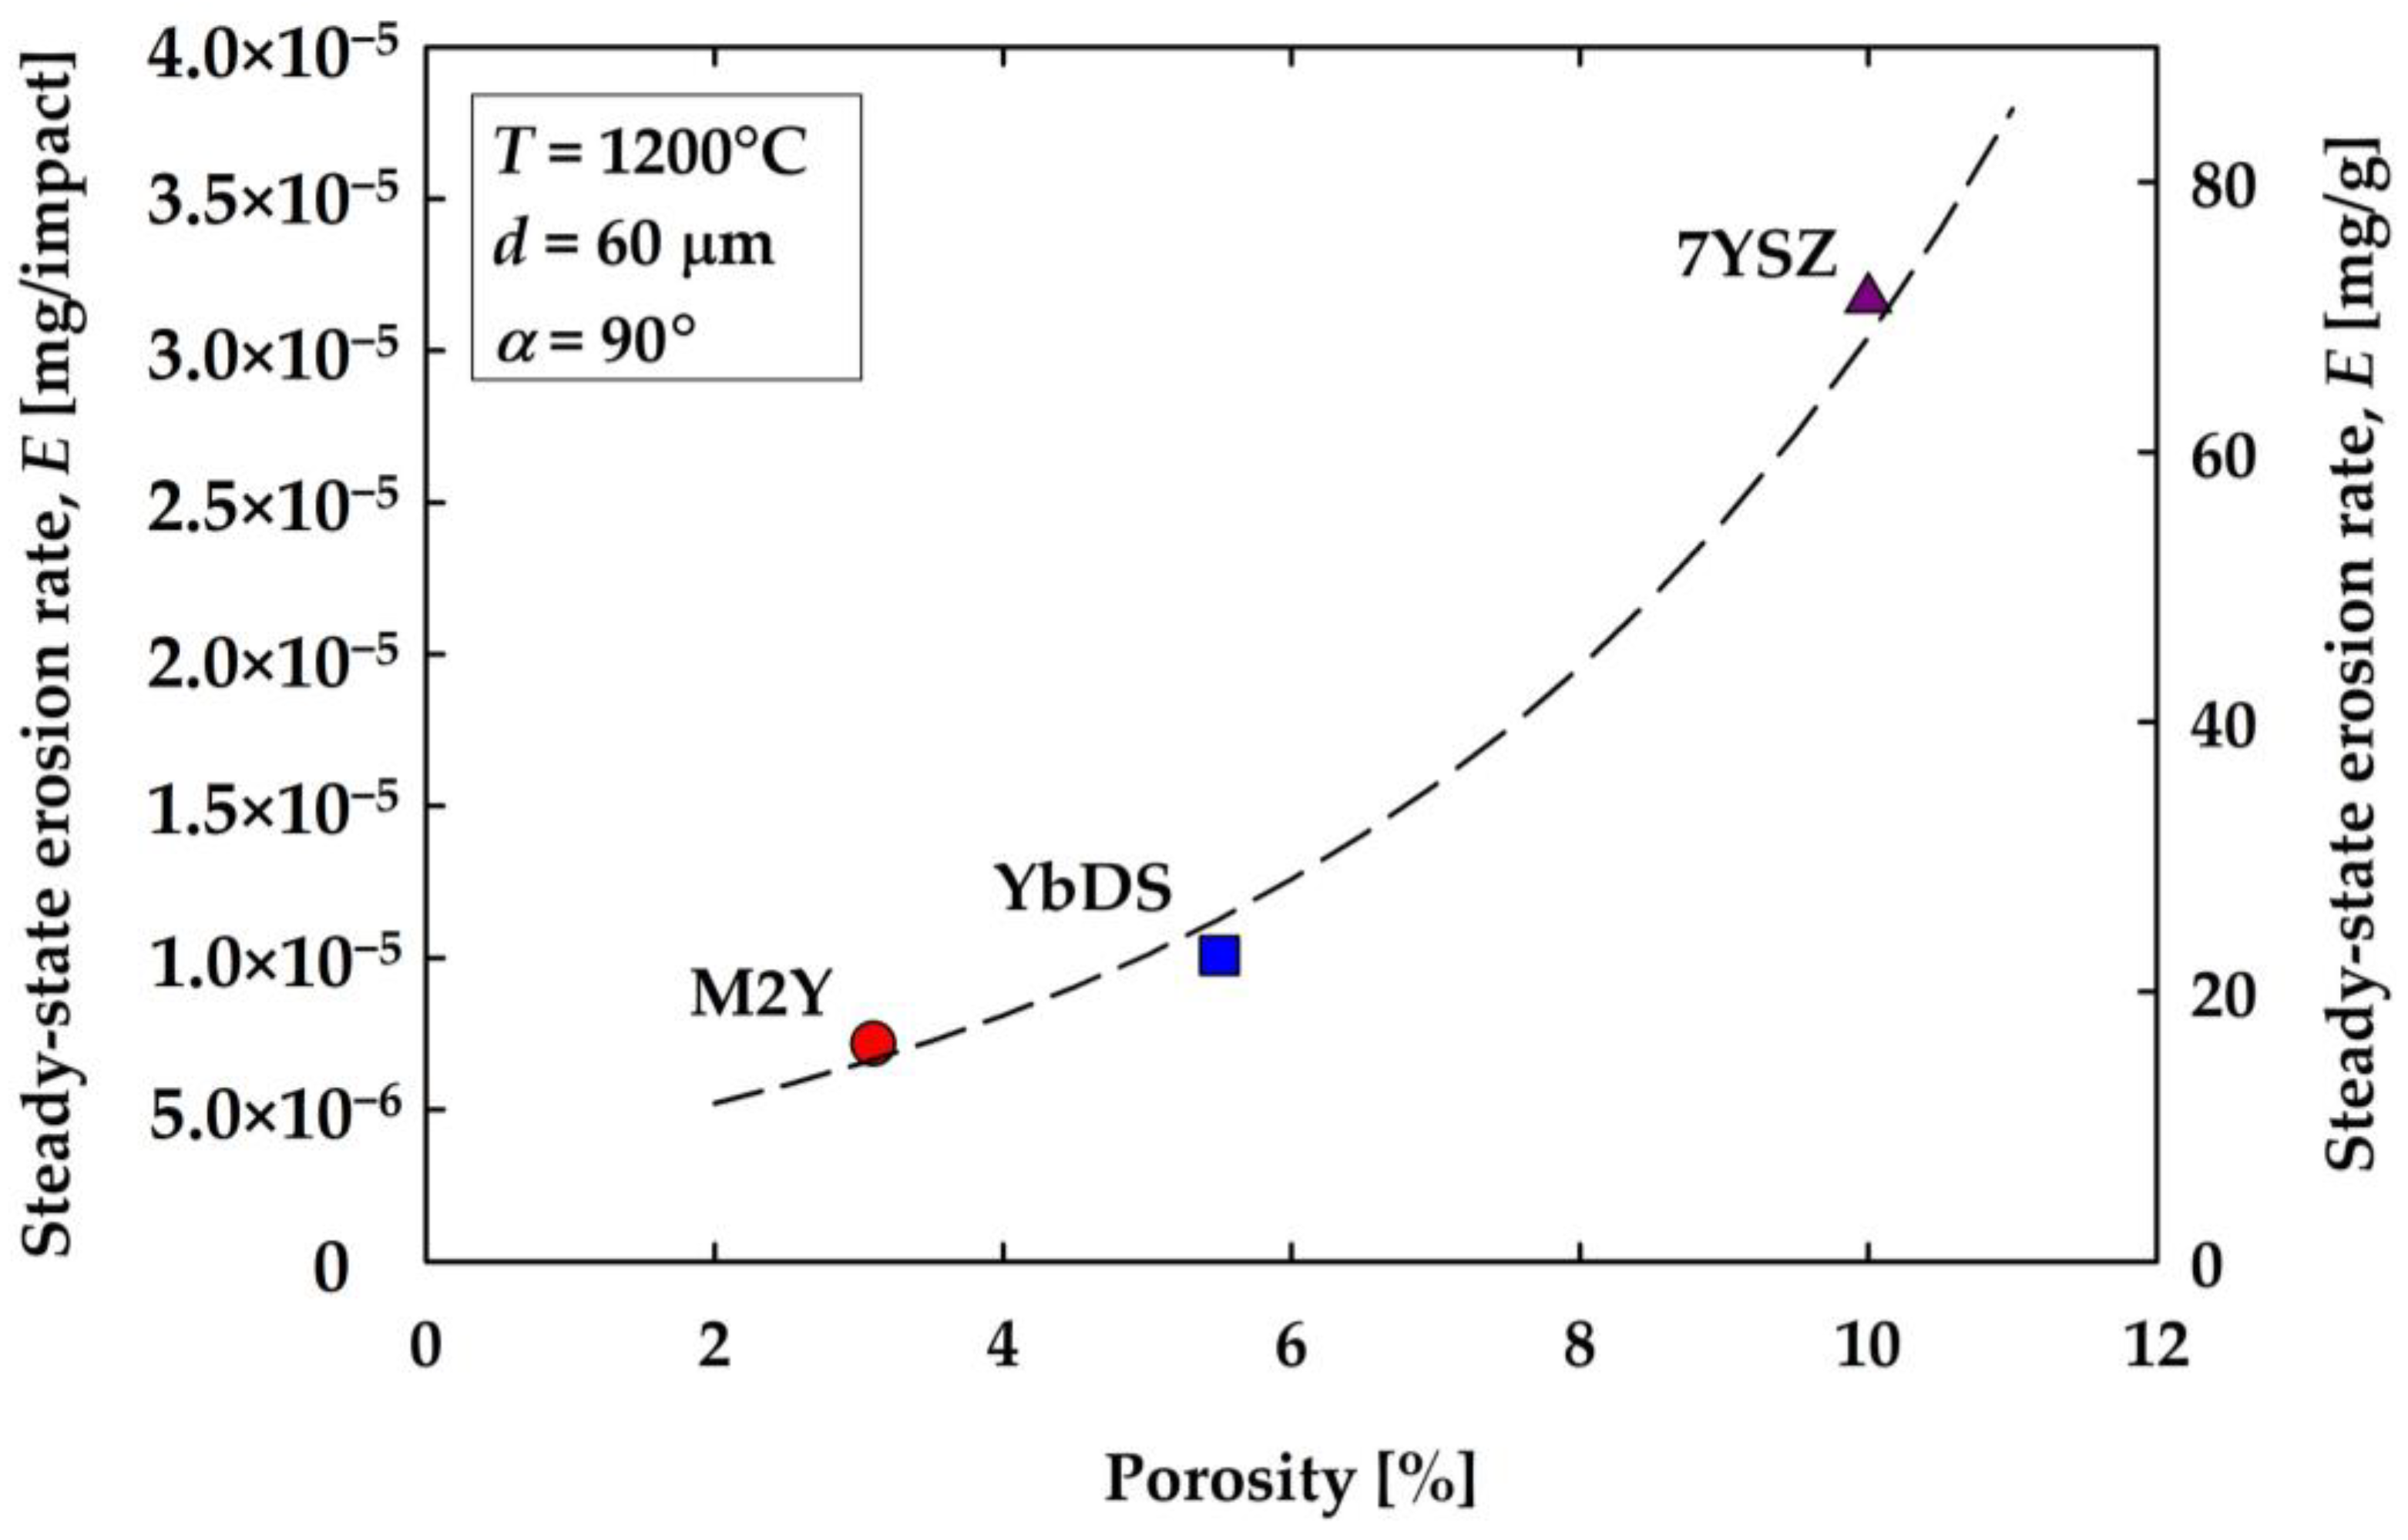
3.6. Comparison of EBCs and TBCs

Since EBC/CMC materials are targeted to replace TBC/superalloy materials in the hot section of gas turbine engines, it is important to characterize and compare the relative erosion resistance of EBCs and TBCs for material selection, design, and lifing purposes. Figure 15 shows the steady-state erosion rate for the APS YbDS and M2Y EBCs as well as the APS and EB-PVD 7YSZ TBCs as a function of particle kinetic energy, UK, for α = 90°. It is observed that the YbDS and M2Y EBCs have greater erosion resistance compared to the APS 7YSZ TBC but are less resistant compared to the EB-PVD 7YSZ TBC. While the data plotted in Figure 15 for the EBCs were at 1316 °C and at 1200 °C for the TBCs, it is worth noting from Phase 3 of this work that no significant difference was observed in the steady-state erosion rate for the EBCs at 800, 1200, or 1316 °C. Therefore, any difference in test temperature should have a negligible effect on the observed trends. Another aspect to consider is the effect of coating density. Ideally, when comparing the erosion resistance of different materials, a volumetric erosion rate (e.g., the mass loss erosion rate divided by the material density) should be used. For the coatings tested in this work, the theoretical densities are similar and listed in Table 2. Based on the measured porosity within the coatings, the bulk densities are still similar, within 11% of each other, and therefore would not significantly alter the results/trends observed in Figure 15, where the erosion rate is expressed in terms of mass loss [mg/impact]. This conclusion also leads into the next aspect of this study, where it is of interest to compare the results in this work with other results on EBCs and TBCs reported in the literature. Other studies on EBC and TBC erosion report the erosion rate in terms of mass loss, and oftentimes, the coating density is either not measured or not provided. Thus, based on the current work, any variation in density due to porosity is assumed to be negligible with respect to comparing the results from this study with those from other studies. Figure 16 shows the results of this work compared with other published results on high-temperature erosion of APS 7YSZ TBC [33,35], EB-PVD 7YSZ TBC [28,34,35], an APS EBC of unknown composition [26], and a PS-PVD YbDS EBC [27]. The erosion conditions for each reference are displayed in Table 3. Based on Figure 16, the results obtained in this work are in reasonable agreement with the results reported by other researchers in the literature for both the TBCs and EBCs, despite some differences in test conditions (e.g., particle type, particle size, particle velocity, temperature). This highlights that particle kinetic energy plays a significant role in controlling the overall erosion response. Moreover, the observations from Figure 15, where the EB-PVD 7YSZ TBCs possess the greatest erosion resistance, followed by the APS EBCs and APS 7YSZ, still holds true when data from multiple studies are compared. Therefore, depending upon application, design, and lifing requirements for EBCs, a multilayered coating with an EB-PVD topcoat may provide additional resistance to SPE.
The increased erosion resistance of the columnar, EB-PVD microstructure compared to the lamellar/splat-like APS microstructure has been attributed to the high intra-columnar density and the presence of columnar boundaries, which hinders crack propagation, resulting in lower material removal [31,36]. While these microstructural differences may explain the increased erosion resistance of EB-PVD compared to APS, this does not explain the greater SPE resistance observed for the APS EBCs when compared to the APS 7YSZ TBCs, considering that they have similar microstructures. An important observation to note is that APS EBCs, by design, are denser (e.g., lower number of defect centers/porosity) than the APS TBCs. Functionally, the primary purpose of a TBC is to act as a thermal barrier, while the primary function of an EBC is to act as a barrier to water vapor. For APS TBCs, the higher porosity provides a lower thermal conductivity, which is desirable from a design and applications perspective. However, high porosity is not desirable for EBCs from an oxidation standpoint, as it increases oxidant permeation, although some porosity is still necessary for compliance. In the case of SPE, porosity has been shown to influence the erosion behavior, where increasing coating porosity (i.e., decreasing density) leads to higher erosion rates (i.e., lower SPE resistance) [42]. This trend is evident for the APS coatings in this study, where a higher percent porosity leads to a higher erosion rate, as shown graphically in Figure 17. Therefore, the higher SPE resistance of the M2Y EBC compared to the YbDS EBC can be attributed to its slightly lower porosity (3.1% vs. 5.5%). It is possible that the SPE resistance of the YbDS EBC could be improved by adjusting the deposition parameters to lower its porosity to the same level as the M2Y EBC. However, this is unlikely to result in any substantial benefit, especially when considering the enhanced oxidation performance of the M2Y EBC due to chemical modifications [3]. As an aside, chemical modifications used to lower the thermal conductivity in 7YSZ TBCs have been shown to negatively affect SPE resistance in some cases by up to ~200% at high temperature [43].
Additionally, mechanical properties such as hardness and fracture toughness will also play a role in the SPE performance. However, the high-temperature mechanical properties relevant to this work are difficult to obtain and not well characterized, particularly for EBC systems. As such, future work is warranted to understand how the mechanical properties influence the observed SPE behavior. Despite this, the results of this study provide researchers and engineers with the high-temperature erosion behavior of two state-of-the-art EBCs and demonstrate their relative SPE resistance compared to TBCs that have been used extensively in aero engine design for decades.

4. Conclusions

The SPE behavior of two APS EBCs was investigated at high temperature using Al2O3 particulate. The SPE behavior was characterized with respect to particle kinetic energy, UK, impingement angle, α, and temperature, T. The EBCs exhibited a power law functional dependence with respect to particle kinetic energy of the form E = γ U K b . The EBCs were shown to exhibit the same functional dependence with respect to impingement angle when normalized to the erosion rate at α = 90°. The effect of temperature was shown to be negligible, as the erosion rate for both EBCs was relatively constant over the three temperatures explored in this work, T = 800, 1200, and 1316 °C. The SPE behavior of the EBCs was also compared to APS and EB-PVD 7YSZ TBCs. It was shown that the SPE resistance of the EBCs falls in between the two 7YSZ TBCs, where the EB-PVD 7YSZ possessed the greatest erosion resistance, followed by the two EBCs (M2Y and YbDS), and APS 7YSZ was the least resistant. Porosity was shown to negatively affect the SPE resistance of the APS coatings, where higher porosity resulted in higher erosion rates. Future work is warranted to better understand how microstructure-property relationships influence SPE behavior. Nonetheless, the results obtained in this study demonstrate the high-temperature SPE behavior of two state-of-the-art EBCs and how the SPE behavior of EBCs compares to TBCs.

Author Contributions

Conceptualization, M.J.P.; methodology, M.J.P.; formal analysis, M.J.P., J.L.S., B.J.H., K.N.L. and L.C.H.; investigation, M.J.P., J.L.S., B.J.H., K.N.L. and L.C.H.; data curation, M.J.P., J.L.S. and L.C.H.; writing—original draft preparation, M.J.P.; writing—review and editing, M.J.P., J.L.S., B.J.H., K.N.L. and L.C.H. All authors have read and agreed to the published version of the manuscript.

Funding

This research was sponsored by the National Aeronautics and Space Administration’s Transformative Aeronautics Concepts Program, Transformational Tools and Technologies Project.

Institutional Review Board Statement

Not applicable.

Informed Consent Statement

Not applicable.

Data Availability Statement

All data that support the findings of this study are included within the article.

Conflicts of Interest

The authors declare no conflict of interest.

References

  1. Lee, K.N.; van Roode, M. Environmental barrier coatings enhance performance of SiC/SiC ceramic matrix composites. Am. Ceram. Soc. Bull. 2019, 98, 46–53. [Google Scholar]
  2. Lee, K.N.; Zhu, D.; Lima, R.S. Perspectives on environmental barrier coatings (EBCs) manufactured via air plasma spray (APS) on ceramic matrix composites (CMCs): A tutorial paper. J. Therm. Spray Technol. 2021, 30, 40–58. [Google Scholar] [CrossRef]
  3. Lee, K.N. Yb2Si2O7 environmental barrier coatings with reduced bond coat oxidation rates via chemical modifications for long life. J. Am. Ceram. Soc. 2019, 102, 1507–1521. [Google Scholar] [CrossRef]
  4. Richards, B.T.; Young, K.A.; de Francqueville, F.; Sehr, S.; Begley, M.; Wadley, H.N.G. Response of ytterbium disilicate-silicon environmental barrier coatings to thermal cycling in water vapor. Acta Mater. 2016, 106, 1–14. [Google Scholar] [CrossRef]
  5. Abdul-Aziz, A. Durability modeling review of thermal- and environmental-barrier-coated fiber-reinforced ceramic matrix composites Part I. Materials 2018, 11, 1251. [Google Scholar] [CrossRef]
  6. Tejero-Martin, D.; Bennett, C.; Hussain, T. A review on environmental barrier coatings: History, current state of the art and future development. J. Euro. Ceram. Soc. 2021, 41, 1747–1768. [Google Scholar] [CrossRef]
  7. Fang, G.; Gao, X.; Song, Y. A review on ceramic matrix composites and environmental barrier coatings for aero-engine: Material development and failure analysis. Coatings 2023, 13, 357. [Google Scholar] [CrossRef]
  8. Opila, E.J.; Hann, R.E., Jr. Paralinear oxidation of CVD SiC in water vapor. J. Am. Ceram. Soc. 1997, 80, 197–205. [Google Scholar] [CrossRef]
  9. Robinson, R.C.; Smialek, J.L. SiC recession by SiO2 scale volatility under combustion conditions: I, experimental results and empirical model. J. Am. Ceram. Soc. 1999, 82, 1817–1825. [Google Scholar] [CrossRef]
  10. Jacobson, N.S.; Kuczmarski, M.A.; Kowalski, B.A. Vaporization of protective oxide films into different gas atmospheres. Oxid. Met. 2020, 93, 247–282. [Google Scholar] [CrossRef]
  11. Summers, W.D.; Begley, M.R.; Zok, F.W. Transition from penetration cracking to spallation in environmental barrier coatings on ceramic composites. Surf. Coat. Technol. 2019, 378, 125083. [Google Scholar] [CrossRef]
  12. Richards, B.T.; Zhu, D.; Ghosn, L.J.; Wadley, H.N.G. Mechanical properties of air plasma sprayed environmental barrier coating (EBC) systems: Preliminary assessments. In Developments in Strategic Ceramic Materials; Kriven, W.M., Wang, J., Zhu, D., Fischer, T., Eds.; John Wiley & Sons: Hoboken, NJ, USA, 2016; pp. 219–237. [Google Scholar]
  13. Appleby, M.P.; Zhu, D.; Morscher, G.N. Mechanical properties and real-time damage evaluations of environmental barrier coated SiC/SiC CMCs subjected to tensile loading under thermal gradients. Surf. Coat. Technol. 2015, 284, 318–326. [Google Scholar] [CrossRef]
  14. Ridley, M.J.; Opila, E.J. Thermomechanical and thermochemical stability of HfSiO4 for environmental barrier coating applications. J. Am. Ceram. Soc. 2021, 104, 3593–3602. [Google Scholar] [CrossRef]
  15. Ruggles-Wrenn, M.B.; Williams, T.M. Fatigue of a SiC/SiC Ceramic Matrix Composite with an Ytterbium-Disilicate Environmental Barrier Coating at Elevated Tempeature. Int. J. Appl. Ceram. Technol. 2020, 17, 2074–2082. [Google Scholar] [CrossRef]
  16. Panakarajupally, R.P.; Presby, M.J.; Manigandan, K.; Zhou, J.; Chase, G.G.; Morscher, G.N. Thermomechanical characterization of SiC/SiC ceramic matrix composites in a combustion facility. Ceramics 2019, 2, 407–425. [Google Scholar] [CrossRef]
  17. Ericks, A.R.; Zok, F.W.; Poerschke, D.L.; Levi, C.G. Protocol for selecting exemplary silicate deposit compositions for evaluating thermal and environmental barrier coatings. J. Am. Ceram. Soc. 2021, 105, 3665–3688. [Google Scholar] [CrossRef]
  18. Wiesner, V.L.; Harder, B.J.; Bansal, N.P. High-temperature interactions of desert sand CMAS glass with yttrium disilicate environmental barrier coating material. Ceram. Int. 2018, 44, 22738–22743. [Google Scholar] [CrossRef]
  19. Webster, R.I.; Bansal, N.P.; Salem, J.A.; Opila, E.J.; Wiesner, V.L. Characterization of thermochemical and thermomechanical properties of Eyjafjallajökull volcanic ash glass. Coatings 2020, 10, 100. [Google Scholar] [CrossRef]
  20. Stokes, J.L.; Harder, B.J.; Wiesner, V.L.; Wolfe, D.E. Effect of crystal structure and cation size on molten silicate reactivity with environmental barrier coating materials. J. Am. Ceram. Soc. 2019, 103, 622–634. [Google Scholar] [CrossRef]
  21. Wolf, M.; Mack, D.E.; Guillon, O.; Vaßen, R. Resistance of pure and mixed rare earth silicates against calcium-magnesium-aluminosilicate (CMAS): A comparative study. J. Am. Ceram. Soc. 2020, 103, 7056–7071. [Google Scholar] [CrossRef]
  22. Wiesner, V.L.; Scales, D.; Johnson, N.S.; Harder, B.J.; Garg, A.; Bansal, N.P. Calcium-magnesium aluminosilicate (CMAS) interactions with ytterbium silicate environmental barrier coating material at elevated temperatures. Ceram. Int. 2020, 46, 16733–16742. [Google Scholar] [CrossRef]
  23. Kedir, N.; Garcia, E.; Kirk, C.; Guo, Z.; Gao, J.; Zhai, X.; Sun, T.; Fezzaa, K.; Sampath, S.; Chen, W.W. In situ characterization of foreign object damage (FOD) in environmental-barrier-coated silicon carbide (SiC) ceramic. J. Am. Ceram. Soc. 2020, 103, 4586–4601. [Google Scholar] [CrossRef]
  24. Kedir, N.; Garcia, E.; Kirk, C.; Gao, J.; Guo, Z.; Zhai, X.; Sun, T.; Fezzaa, K.; Sampath, S.; Chen, W.W. Impact damage of narrow silicon carbide (SiC) ceramics with and without environmental barrier coatings (EBCs) by various foreign object debris (FOD) simulants. Surf. Coat. Technol. 2021, 407, 126779. [Google Scholar] [CrossRef]
  25. Singh, S.; Singh, D.; Signh, J.P.; Singh, R.N.; Routbort, J.L. Solid particle erosion of thin films deposited on ceramics. In Advances in Ceramic Coatings and Ceramic-Metal Systems: Ceramic Engineering and Science Proceedings; Zhu, F., Plucknett, K., Eds.; The American Ceramic Society: Westerville, OH, USA, 2005; pp. 191–198. [Google Scholar]
  26. Okita, Y.; Mizokami, Y.; Hasegawa, J. Experimental and numerical investigation of environmental barrier coated ceramic matrix composite turbine airfoil erosion. J. Eng. Gas Turbine Power 2019, 141, 031013-1–031013-10. [Google Scholar] [CrossRef]
  27. Presby, M.J.; Harder, B.J. Solid particle erosion of a plasma spray-physical vapor deposition environmental barrier coating in a combustion environment. Ceram. Int. 2021, 47, 24403–24411. [Google Scholar] [CrossRef]
  28. Cernuschi, F.; Lorenzoni, L.; Capelli, S.; Guardamagna, C.; Krager, M.; Vaßen, R.; von Niessen, K.; Markocsan, N.; Menuey, J.; Giolli, C. Solid particle erosion of thermal spray and physical vapour deposition thermal barrier coatings. Wear 2011, 271, 2909–2918. [Google Scholar] [CrossRef]
  29. Davis, A.G.; Boone, D.H.; Levy, A.V. Erosion of ceramic thermal barrier coatings. Wear 1986, 110, 101–116. [Google Scholar] [CrossRef]
  30. Bruce, R.W. Development of 1232 °C (2250 °F) erosion and impact tests for thermal barrier coatings. Tribol. Trans. 1998, 41, 399–410. [Google Scholar] [CrossRef]
  31. Nicholls, J.R.; Deakin, M.J.; Rickerby, D.S. A comparison between the erosion behavior of thermal spray and electron beam physical vapour deposition thermal barrier coatings. Wear 1999, 223–235, 352–361. [Google Scholar] [CrossRef]
  32. Schmitt, M.P.; Harder, B.J.; Wolfe, D.E. Process-structure-property relations for the erosion durability of plasma spray-physical vapor deposition (PS-PVD) thermal barrier coatings. Surf. Coat. Technol. 2016, 197, 11–18. [Google Scholar] [CrossRef]
  33. Shin, D.; Hamed, A. Influence of micro-structure on erosion resistance of plasma sprayed 7YSZ thermal barrier coating under gas turbine operating conditions. Wear 2018, 396–397, 34–47. [Google Scholar] [CrossRef]
  34. Swar, R.; Hamed, A.; Shin, D.; Woggon, N.; Miller, R. Deterioration of thermal barrier coated turbine blades by erosion. Int. J. Rotating Mach. 2012, 2012, 601837. [Google Scholar] [CrossRef]
  35. Nicholls, J.R.; Jaslier, Y.; Rickerby, D.S. Erosion of EB-PVD thermal barrier coatings. Mater. High Temp. 1998, 15, 15–22. [Google Scholar] [CrossRef]
  36. Wellman, R.G.; Nicholls, J.R. A review of the erosion of thermal barrier coatings. J. Phys. D Appl. Phys. 2007, 40, 293–305. [Google Scholar] [CrossRef]
  37. Wellman, R.G.; Nicholls, J.R. A Monte Carlo model for predicting the erosion rate of EB-PVD TBCs. Wear 2004, 256, 889–899. [Google Scholar] [CrossRef]
  38. Wellman, R.G.; Nicholls, J.R. On the effect of ageing on the erosion of EB-PVD TBCs. Surf. Coat. Technol. 2004, 177–178, 80–88. [Google Scholar] [CrossRef]
  39. Wellman, R.G.; Whitman, G.; Nicholls, J.R. CMAS corrosion of EB-PVD TBCs: Identifying the minimum level to initiate damage. Int. J. Refract. Met. Hard Mater. 2010, 28, 124–132. [Google Scholar] [CrossRef]
  40. Steinberg, L.; Naraparaju, R.; Heckert, M.; Mikulla, C.; Schulz, U.; Leyens, C. Erosion behavior of EB-PVD 7YSZ coatings under corrosion/erosion regime: Effect of TBC microstructure and the CMAS chemistry. J. Eur. Ceram. Soc. 2018, 38, 5101–5112. [Google Scholar] [CrossRef]
  41. Miller, R.A.; Kuczmarski, M.A. Burner rig for small particle erosion testing of thermal barrier coatings. J. Test. Eval. 2014, 42, 648–658. [Google Scholar] [CrossRef]
  42. Mahade, S.; Venkat, A.; Curry, N.; Leitner, M.; Joshi, S. Erosion performance of atmospheric plasma sprayed thermal barrier coatings with diverse porosity levels. Coatings 2021, 11, 86. [Google Scholar] [CrossRef]
  43. Wellman, R.G.; Nicholls, J.R.; Murphy, K. Effect of microstructure and temperature on the erosion rates and mechanisms of modified EB-PVD TBCs. Wear 2009, 267, 1927–1934. [Google Scholar] [CrossRef]
  44. Kedir, N.; Gong, C.; Sanchez, L.; Presby, M.J.; Kane, S.; Faucett, D.C.; Choi, S.R. Erosion in gas-turbine grade ceramic matrix composites. J. Eng. Gas Turbines Power 2019, 141, 011019-1–011019-9. [Google Scholar] [CrossRef]
  45. Presby, M.J.; Gong, C.; Kane, S.; Kedir, N.; Stanley, A.; Faucett, D.C.; Choi, S.R. Erosion in a melt-infiltrated SiC/SiC ceramic matrix composite. J. Eng. Gas Turbines Power 2020, 142, 041009-1–041009-9. [Google Scholar] [CrossRef]
  46. Presby, M.J. High-temperature solid particle erosion in a melt-infiltrated SiC/SiC ceramic matrix composite. J. Eng. Gas Turbines Power 2021, 143, 121026-1–121026-6. [Google Scholar] [CrossRef]
  47. Panakarajupally, R.P.; Mirza, F.; El Rassi, J.; Morscher, G.N.; Abdi, F.; Choi, S. Solid particle erosion behavior of melt-infiltrated SiC/SiC ceramic matrix composites (CMCs) in a simulated turbine engine environment. Comp. Part B 2021, 216, 108860. [Google Scholar] [CrossRef]
  48. Stuckner, J.; Harder, B.; Smith, T.M. Microstructure segmentation with deep learning encoders pre-trained on a large microscopy dataset. Npj Comput. Mater. 2022, 8, 200. [Google Scholar] [CrossRef]
  49. Darolia, R. Thermal barrier coatings technology: Critical review, progress update, remaining challenges and prospects. Int. Mater. Rev. 2013, 56, 315–348. [Google Scholar] [CrossRef]
  50. Vaßen, R.; Mack, D.E.; Tandler, M.; Sohn, Y.J.; Sebold, D.; Guillon, O. Unique performance of thermal barrier coatings made of yttria-stabilized zirconia at extreme temperature (>1500 °C). J. Am. Ceram. Soc. 2020, 104, 463–471. [Google Scholar] [CrossRef]
  51. Wiederhorn, S.M.; Hockey, B.J. Effect of material parameters on the erosion resistance of brittle materials. J. Mater. Sci. 1983, 18, 766–780. [Google Scholar] [CrossRef]
  52. Ritter, J.E.; Strzepa, P.; Jakus, K.; Rosenfeld, L.; Buckman, K.J. Erosion damage in glass and alumina. J. Am. Ceram. Soc. 1984, 67, 769–774. [Google Scholar] [CrossRef]
  53. Ritter, J.E. Erosion damage in structural ceramics. Mater. Sci. Eng. 1985, 71, 195–201. [Google Scholar] [CrossRef]
  54. Wiederhorn, S.M.; Lawn, B.R. Strength degradation of glass impacted with sharp particles: I, annealed surfaces. J. Am. Ceram. Soc. 1979, 1–2, 66–70. [Google Scholar] [CrossRef]
  55. Marshall, D.B.; Lawn, B.R.; Evans, A.G. Elastic/plastic indentation damage in ceramics: The lateral crack system. J. Am. Ceram. Soc. 1982, 11, 561–566. [Google Scholar] [CrossRef]
Figure 1. Cross-sectional SEM images showing the as-deposited EBC microstructures: (a) YbDS and (b) M2Y.
Coatings 13 00902 g001
Figure 2. Cross-sectional SEM images showing the as-deposited TBC microstructures: (a) APS 7YSZ and (b) EB-PVD 7YSZ.
Coatings 13 00902 g002
Figure 3. Erosion burner rig: (a) image of the rig during operation, (b) schematic of the burner [27].
Coatings 13 00902 g003
Figure 4. SEM images of the Al2O3 particles used in this study: (a) 27 µm, (b) 60 µm, and (c) 150 µm.
Coatings 13 00902 g004
Figure 5. Exemplary cumulative mass loss versus cumulative mass erodent curve for M2Y EBC at T = 1316 °C, d = 60 µm, v = 135 m/s, and α = 90°.
Coatings 13 00902 g005
Figure 6. Steady-state erosion rate, E [mg/impact], versus particle kinetic energy, UK [µJ], for the YbDS and M2Y EBCs.
Coatings 13 00902 g006
Figure 7. The effect of impingement angle, α, on the YbDS and M2Y EBCs at T = 1316 °C and d = 60 µm: (a) steady-state erosion rate, E [mg/g] and E [mg/impact], versus impingement angle, α [°]; (b) normalized steady-state erosion rate, E, versus impingement angle, α [°].
Coatings 13 00902 g007
Figure 8. The effect of temperature, T, on the steady-state erosion rate, E [mg/g], at α = 90° and d = 60 µm: (a) YbDS, (b) M2Y.
Coatings 13 00902 g008
Figure 9. Steady-state erosion rate, E [mg/impact], versus particle kinetic energy, UK [µJ], for the APS 7YSZ and EB-PVD 7YSZ TBCs at T = 1200 °C and α = 90°.
Coatings 13 00902 g009
Figure 10. Erosion surface damage morphology for YbDS EBC at T = 1316 °C and d = 60 µm: (a) α = 90°, (b) α = 60°, (c) α = 30°.
Coatings 13 00902 g010
Figure 11. Erosion surface damage morphology for M2Y EBC at T = 1316 °C and d = 60 µm: (a) α = 90°, (b) α = 60°, (c) α = 30°.
Coatings 13 00902 g011
Figure 12. Erosion surface damage morphology for the 7YSZ TBCs at T = 1200 °C, d = 60 µm, and α = 90°: (a) APS, (b) EB-PVD.
Coatings 13 00902 g012
Figure 13. Erosion sub-surface damage morphology for the APS EBCs at T = 1316 °C, d = 60 µm, and α = 90°: (a) YbDS, (b) M2Y.
Coatings 13 00902 g013
Figure 14. Sub-surface erosion damage morphology for the 7YSZ TBCs at T = 1200 °C, d = 60 µm, and α = 90°: (a) APS, (b) EB-PVD.
Coatings 13 00902 g014
Figure 15. Steady-state erosion rate, E [mg/impact], versus particle kinetic energy, UK [µJ], at α = 90° for the APS YbDS and M2Y EBCs at T = 1316 °C, and the APS 7YSZ and EB-PVD 7YSZ TBCs at T = 1200 °C.
Coatings 13 00902 g015
Figure 16. Steady-state erosion rate, E [mg/impact], versus Particle kinetic energy, UK [µJ], at α = 90° for the TBCs and EBCs tested in this study compared to other results reported in the literature.
Coatings 13 00902 g016
Figure 17. Steady-state erosion rate, E, versus porosity [%] for the APS coatings: YbDS, M2Y, and 7YSZ.
Coatings 13 00902 g017
Table 1. Erosion test conditions used for each phase of this study.
PhaseTemperature, T [°C]Mean Particle Size, d [µm]Impingement Angle, α [°]Particle
Velocity,
v [m/s]
Particle Kinetic
Energy 1, UK [µJ]
1131627901500.46
601354.07
15010034.90
2131660301354.07
60
90
380060901354.07
1200
1316
4120027901500.46
601354.07
15010034.90
1 Particle kinetic energy, UK = 0.5 mv2, was calculated using the particle velocity, v, and the mass of an individual particle, m. The mass of an individual particle was estimated using the density of Al2O3, ρ = 3.95 g/cm3, and the mean particle size, d, while approximating the particles as spheres [51,52,53].
Table 2. Density of the coatings investigated in this study.
MaterialTheoretical Density [g/cm3]Bulk Density 1 [g/cm3]
YbDS6.155.81
M2Y6.075.88
APS 7YSZ6.105.49
EB-PVD 7YSZ6.105.25 2
1 Bulk density considers the percent porosity obtained from image analysis. 2 Porosity measurement of topcoat (e.g., includes inter-columnar gaps and intra-columnar pores).
Table 3. Erosion test conditions and data reported in the literature for comparison to this study.
ReferenceMaterialTemperature, T [°C]Particle Type 1Particle Size,
d [µm] 1
Velocity,
v [m/s] 1
Erosion Rate,
E [mg/g] 2
Shin [33]APS 7YSZ 3980Al2O327231150
Shin [33]APS 7YSZ 3980Al2O327305256
Shin [33]APS 7YSZ 4980Al2O327231256
Shin [33]APS 7YSZ 4980Al2O327305344
Nicholls [35]APS 7YSZ910Al2O3100230322
Cernuschi [28]EB-PVD 7YSZ700SiO2122400.0535
Swar [34]EB-PVD 7YSZ871Al2O32612211.5
Swar [34]EB-PVD 7YSZ871Al2O32636620
Swar [34]EB-PVD 7YSZ982Al2O32612217
Swar [34]EB-PVD 7YSZ982Al2O32624421
Swar [34]EB-PVD 7YSZ982Al2O32636626
Swar [34]EB-PVD 7YSZ1093Al2O32636627
Nicholls [35]EB-PVD 7YSZ910Al2O310023028.5
Okita [26]APS EBC 51037SiO25022529.57 6
Presby [27]PS-PVD YbDS1200Al2O32715010.72
Presby [27]PS-PVD YbDS1200Al2O36013521.75
Presby [27]PS-PVD YbDS1200Al2O315010014.95
1 Particle kinetic energy, UK, was estimated for each condition using the velocity, v [m/s], particle type (density), and particle size, d [µm], while approximating the particle geometry as spherical. 2 The erosion rate, E [mg/g], was converted to E [mg/impact] by multiplying E [mg/g] by the mass of an individual particle. 3 Standard porosity (12.9 ± 5%). 4 High porosity (19.5 ± 1.2%). 5 Coating composition not reported. 6 Measured at α = 80°. Assumption: E(80°) ≈ E(90°).
Disclaimer/Publisher’s Note: The statements, opinions and data contained in all publications are solely those of the individual author(s) and contributor(s) and not of MDPI and/or the editor(s). MDPI and/or the editor(s) disclaim responsibility for any injury to people or property resulting from any ideas, methods, instructions or products referred to in the content.

