
Verification of the Simulated Carburizing Process in Different Bore Sizes


Abstract
:1. Introduction
2. Materials and Methods
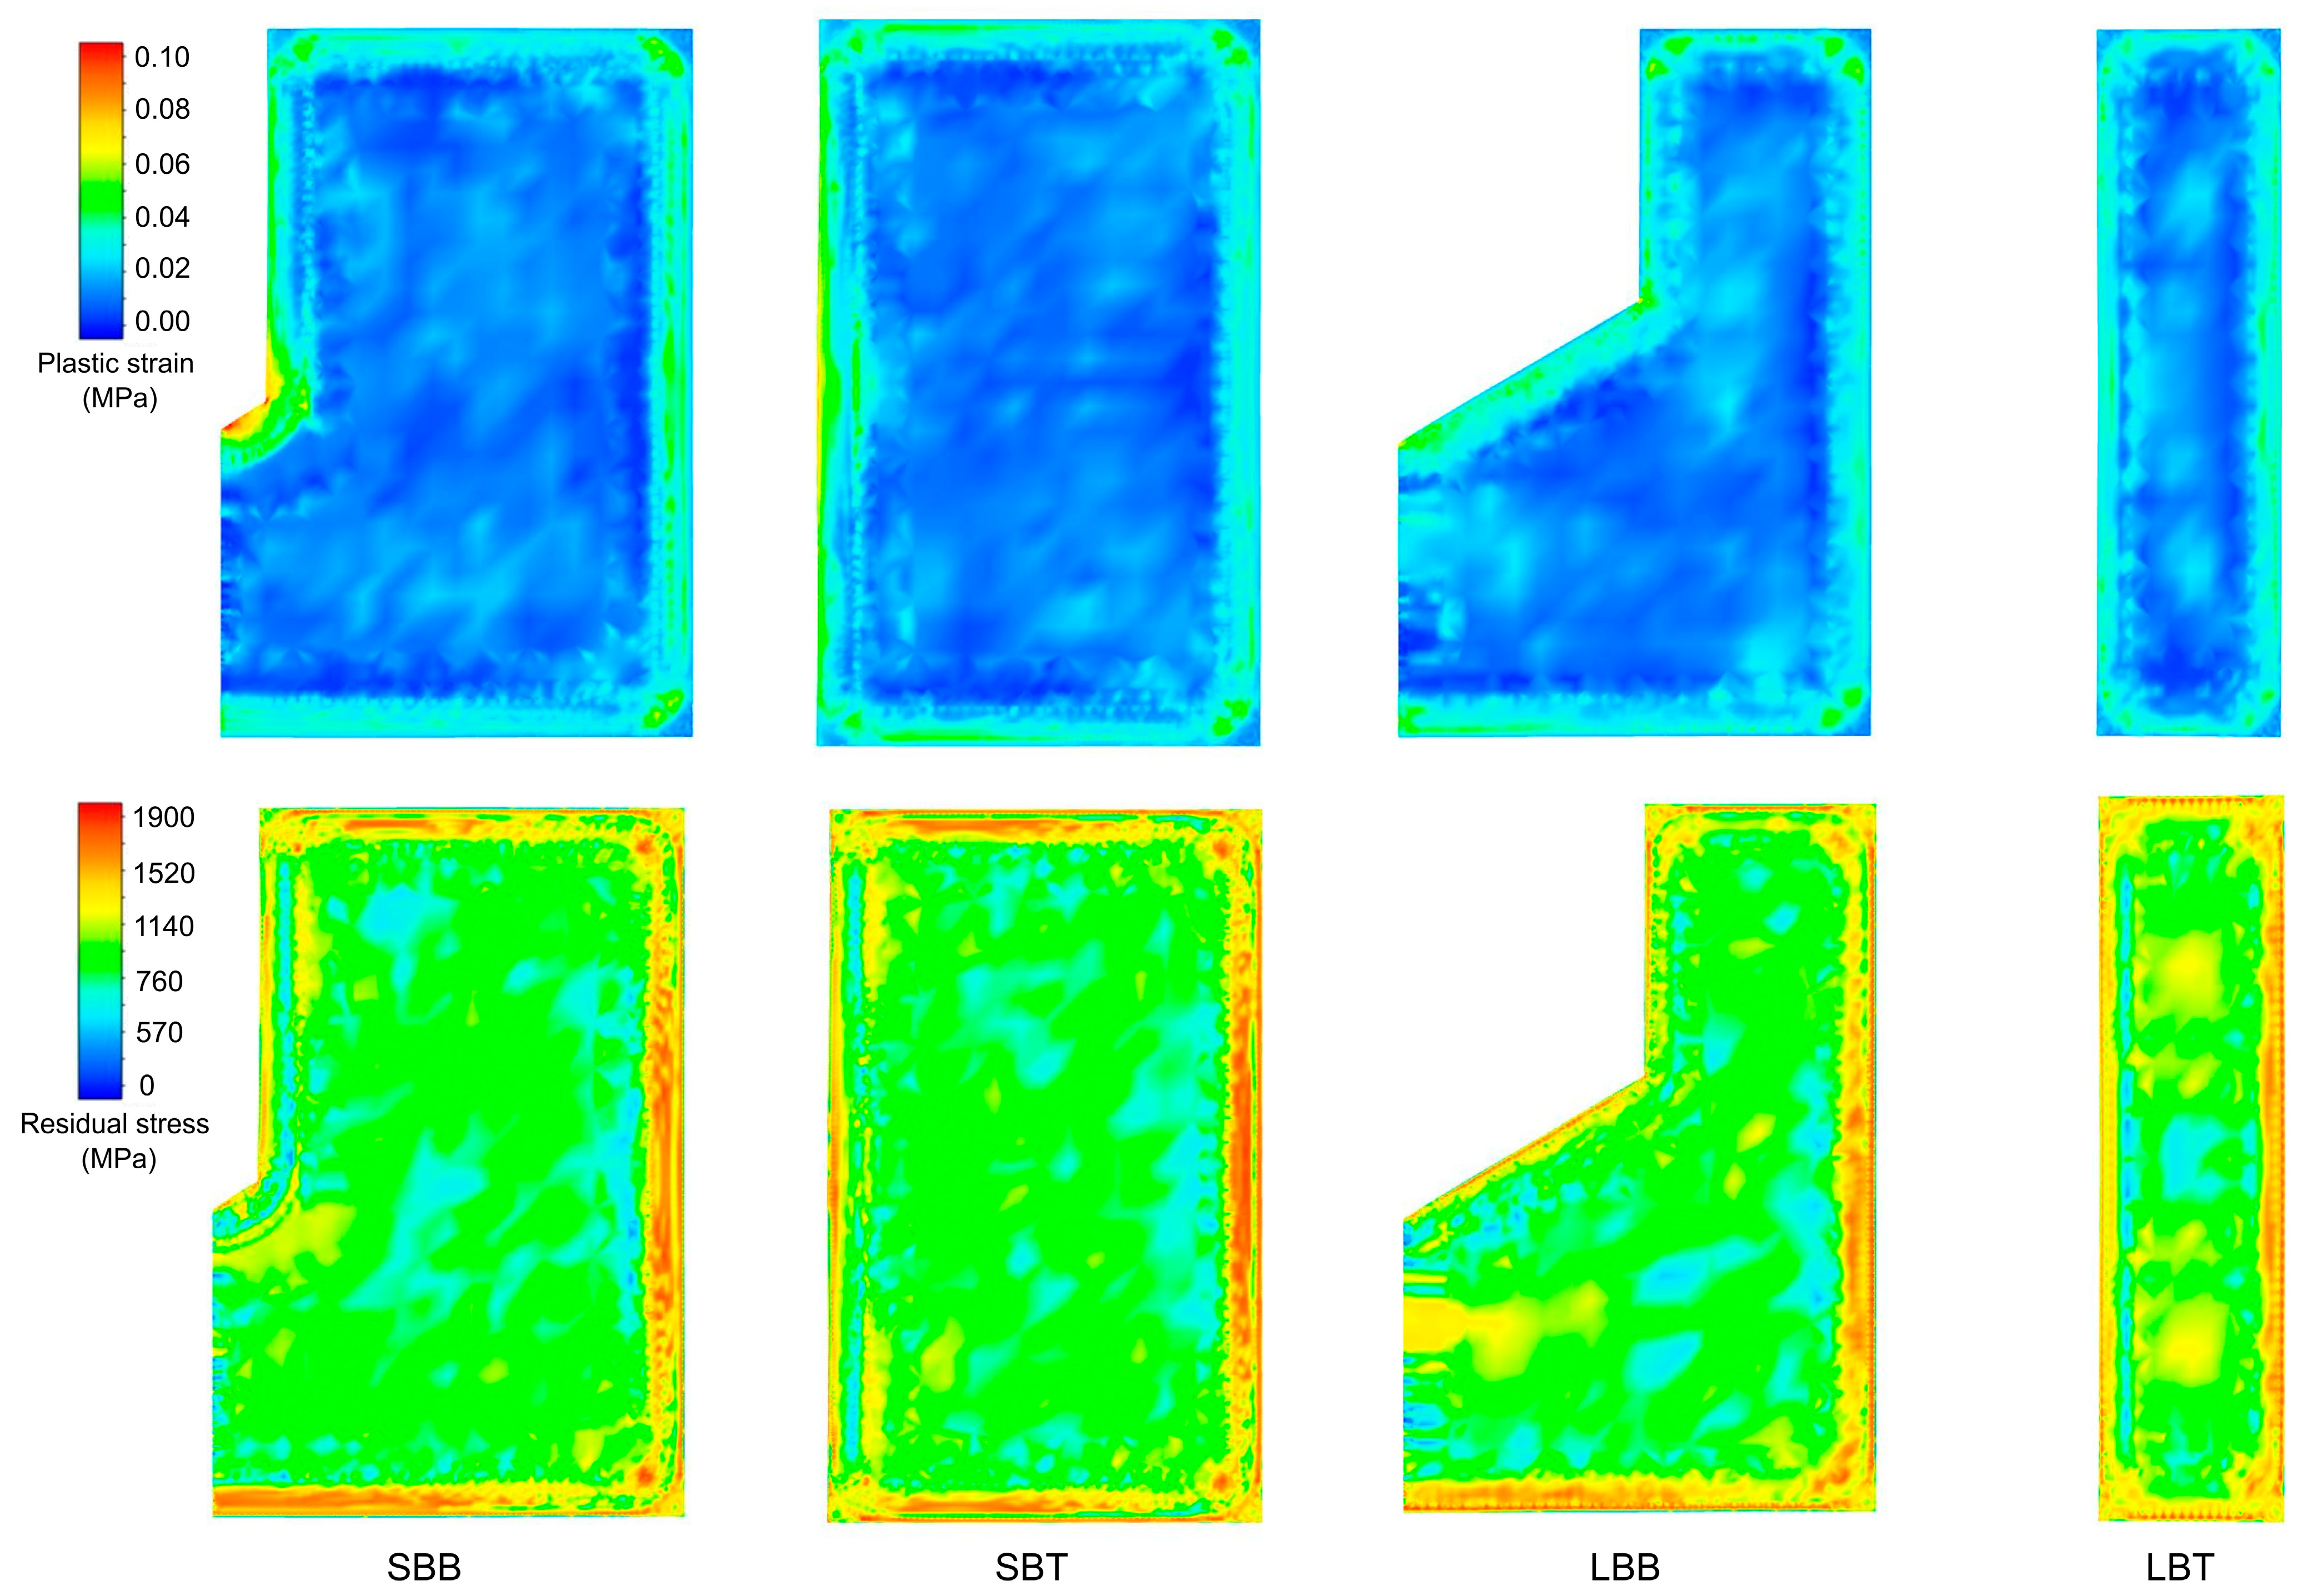
3. Results and Discussions
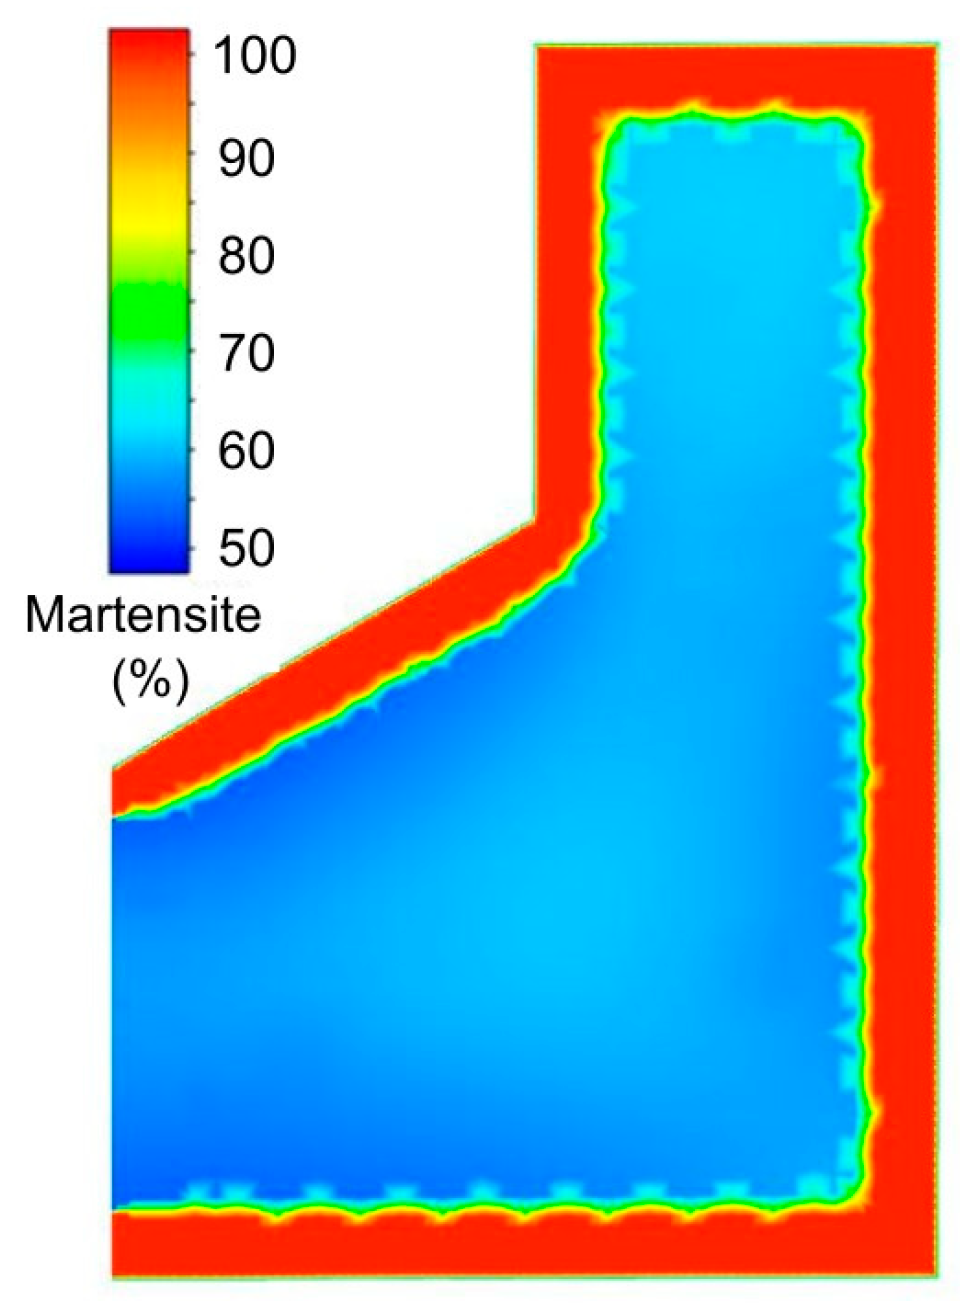
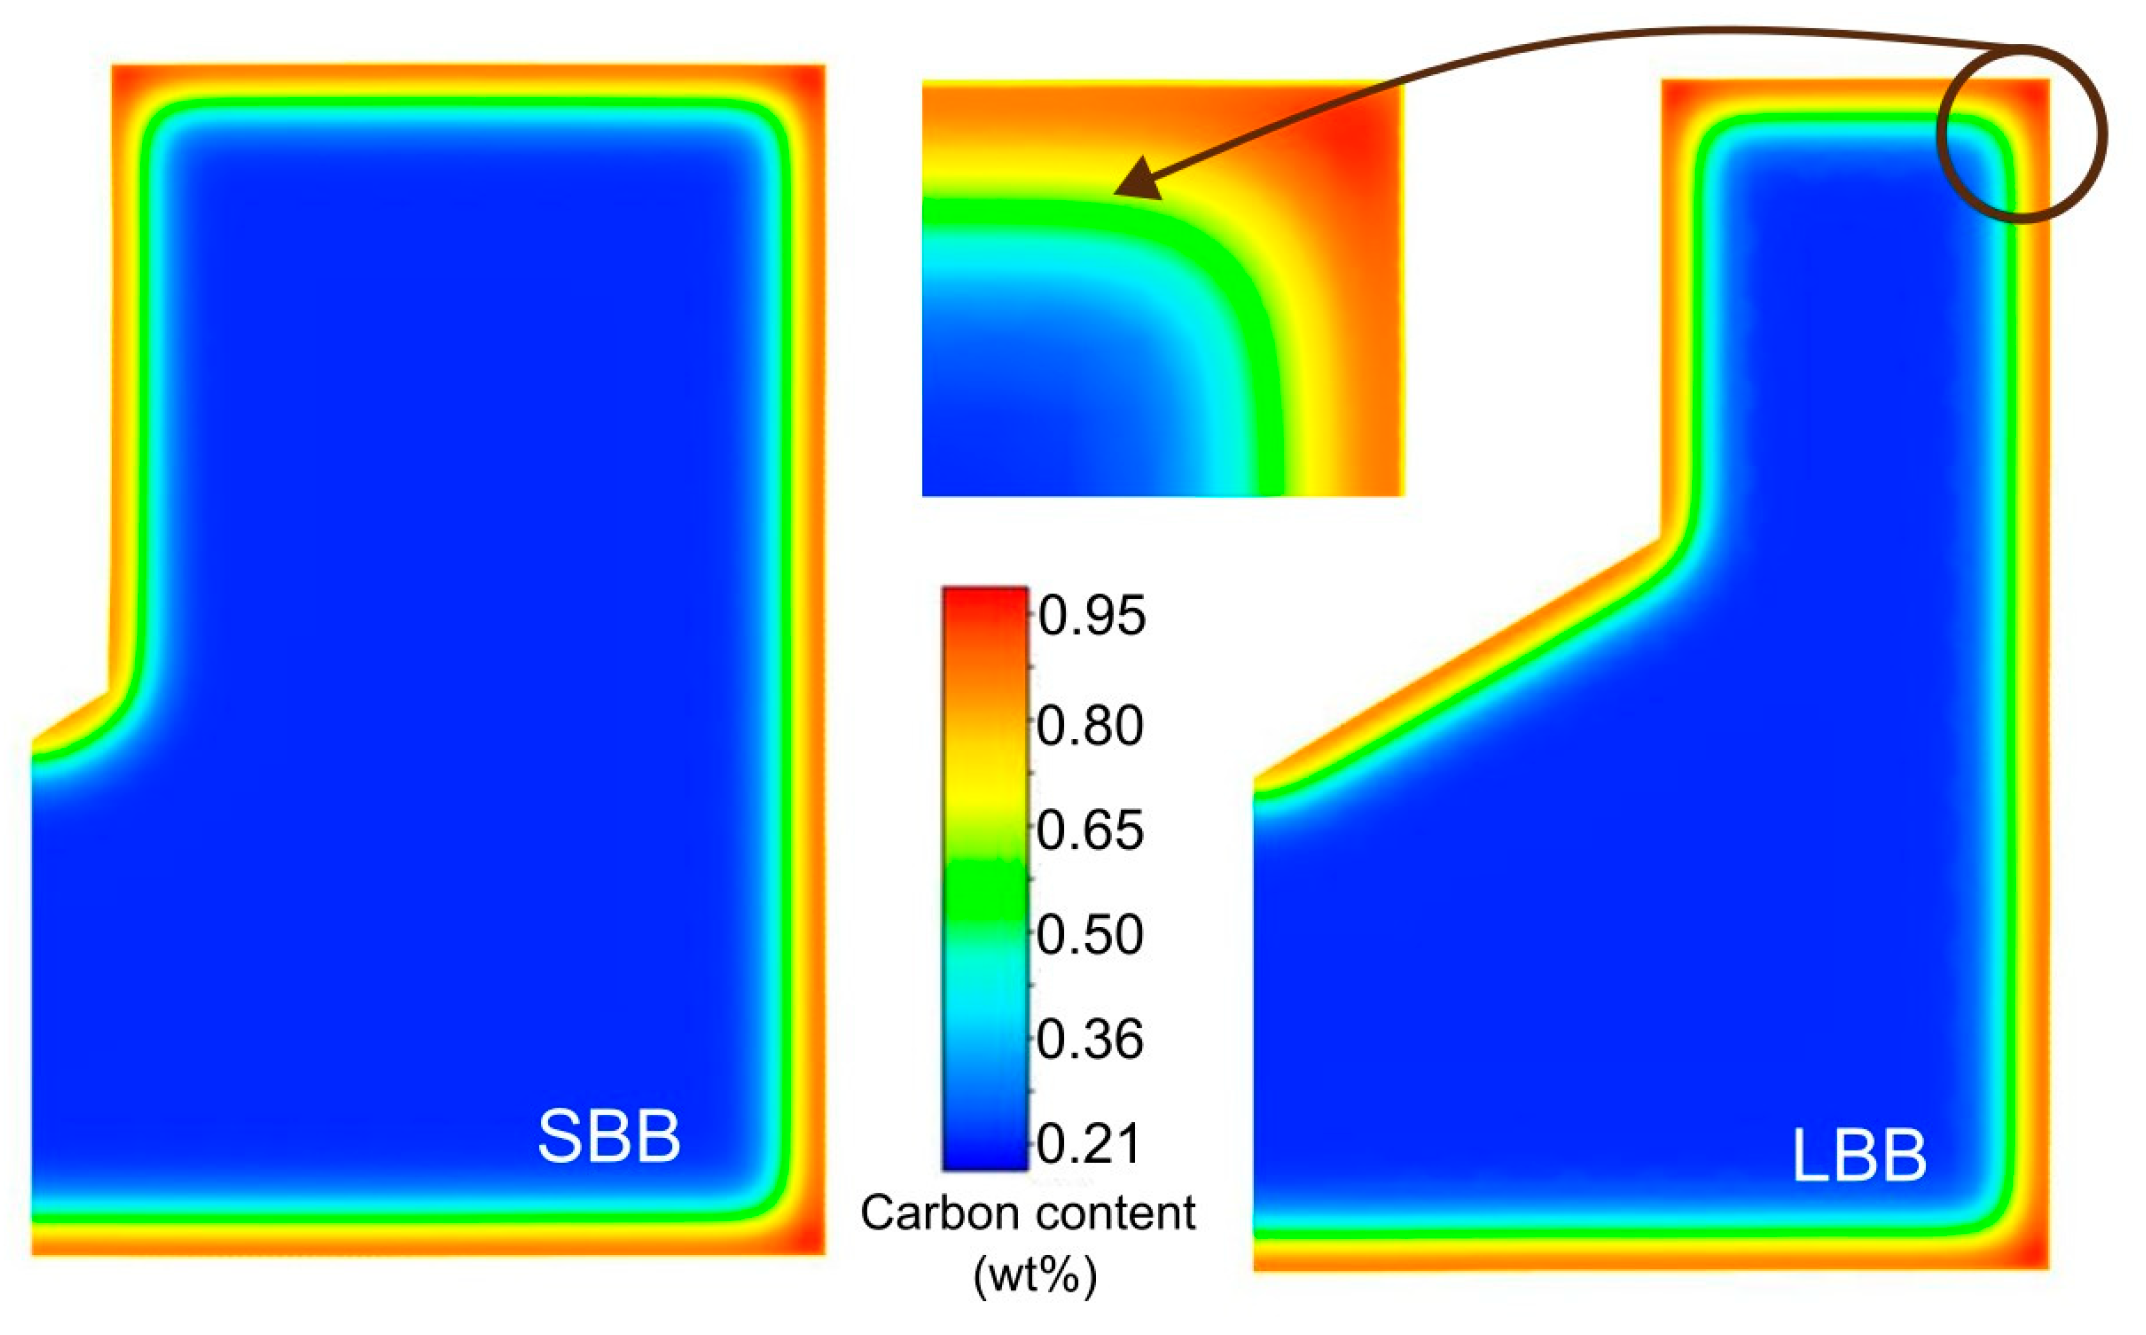
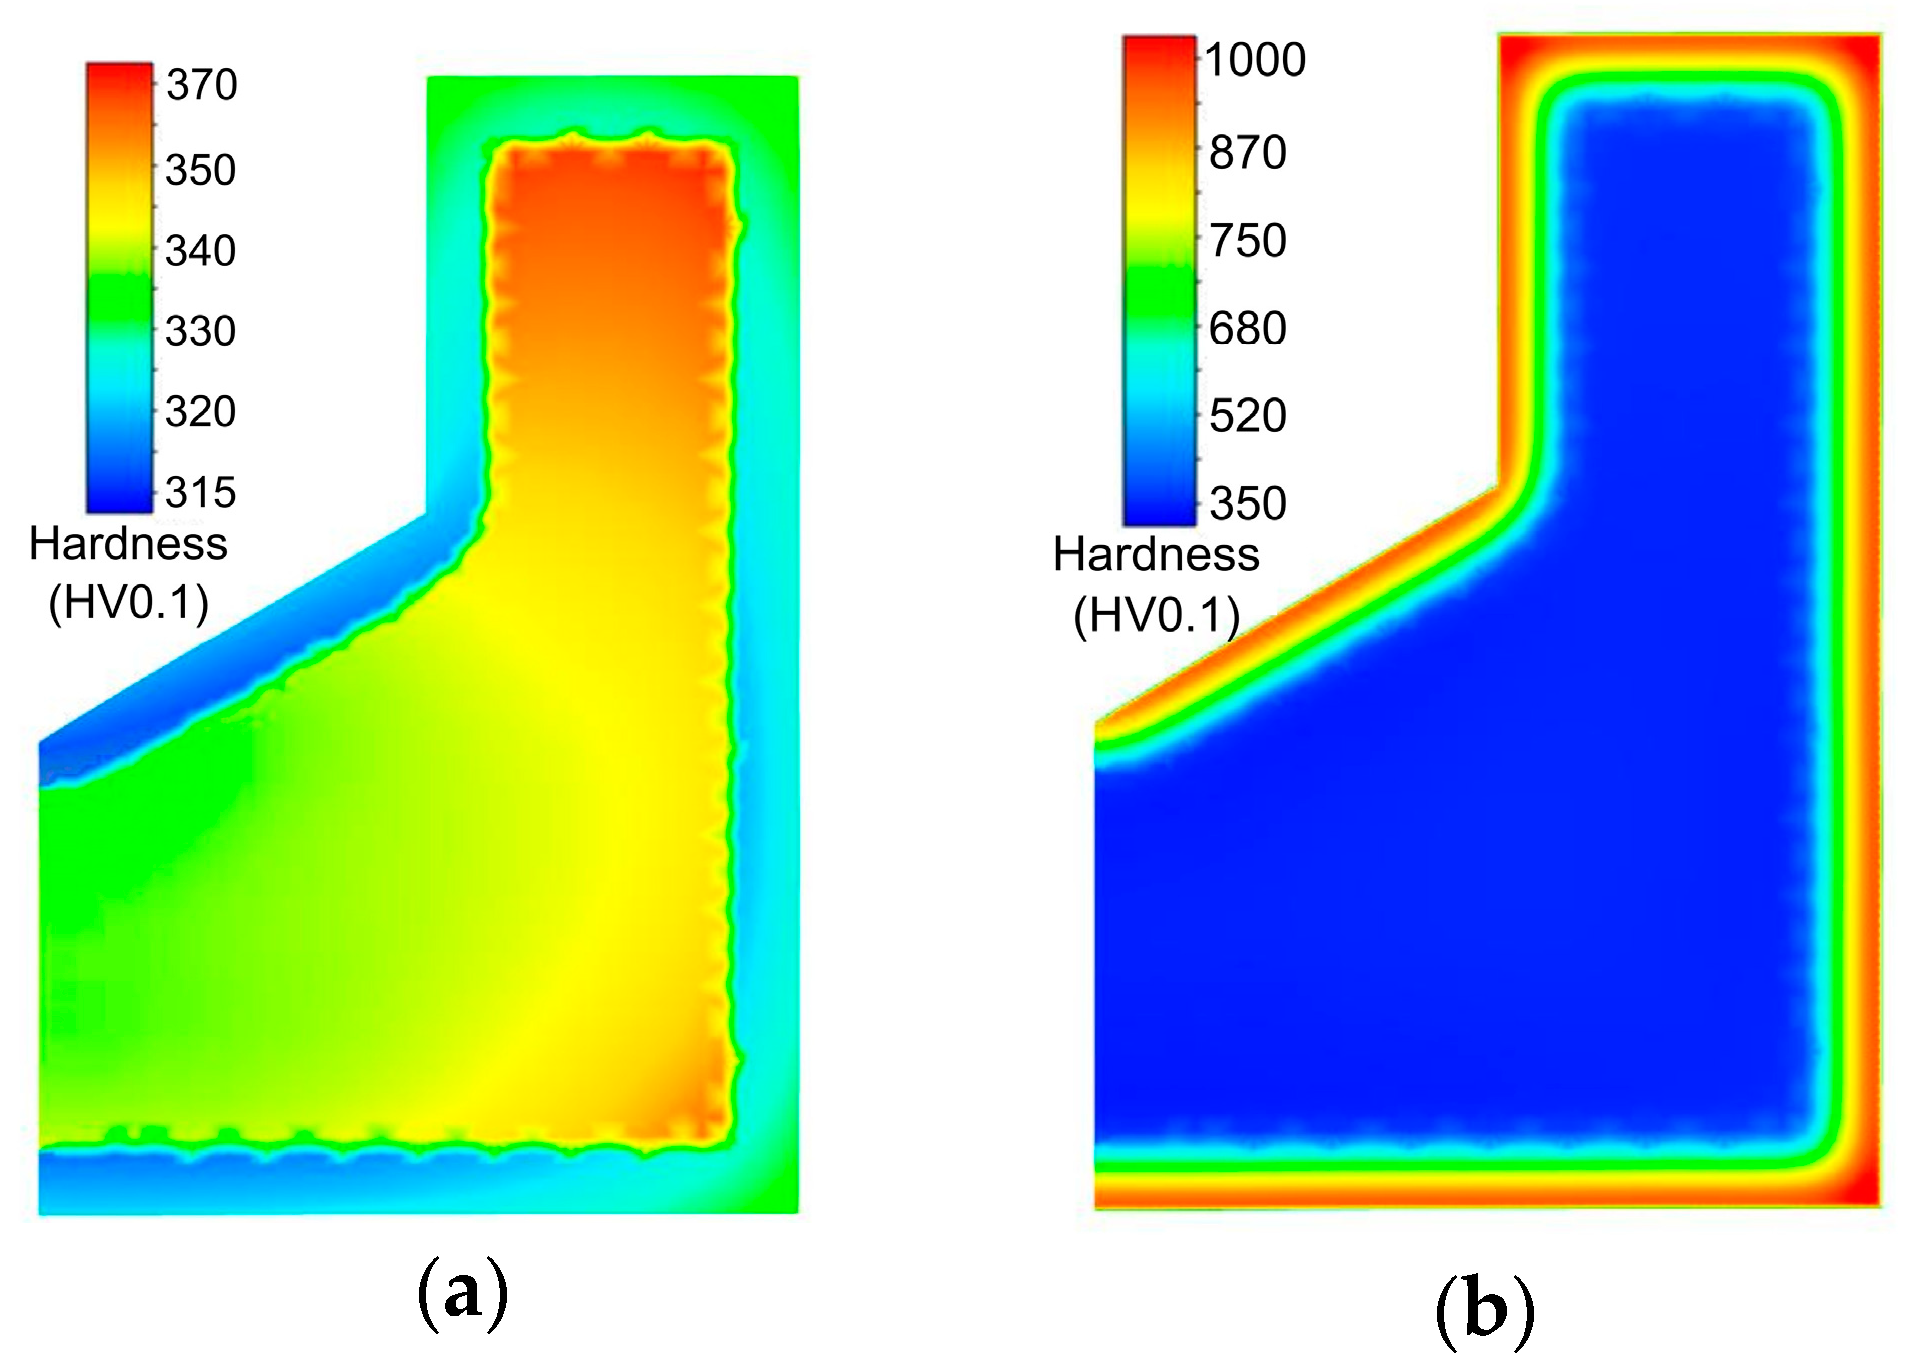
3.1. Microstructure
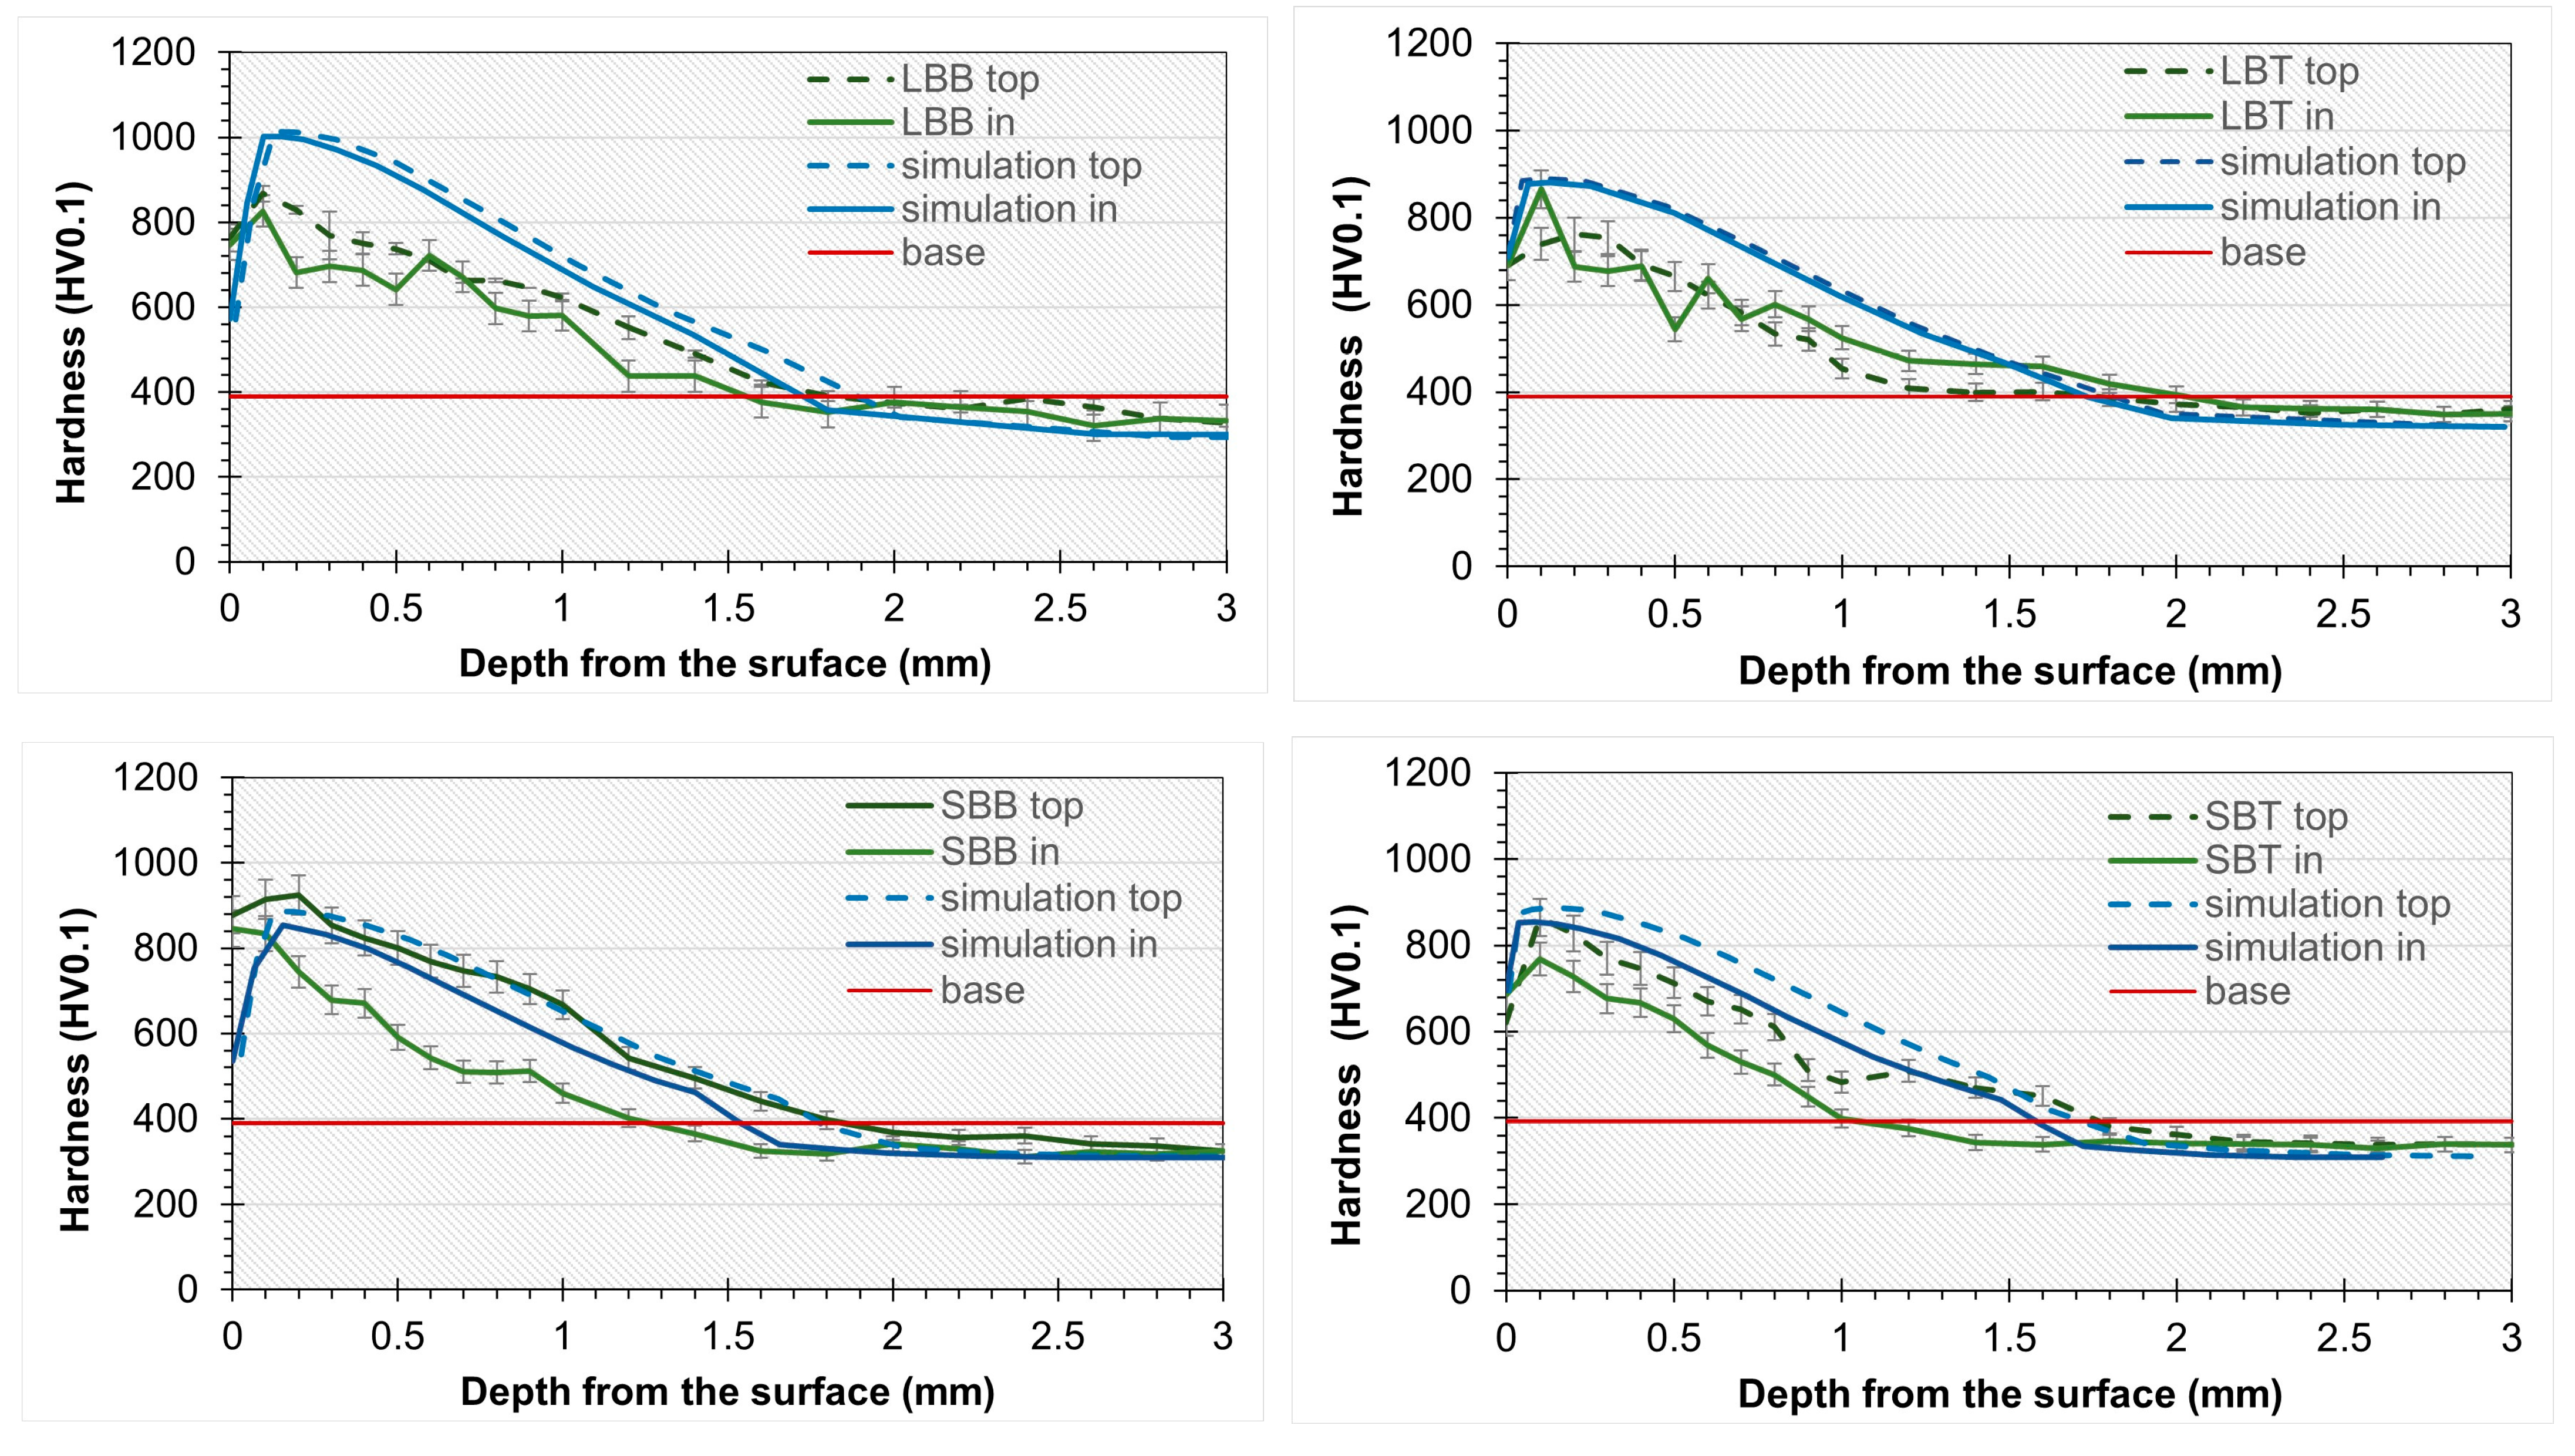
3.2. Hardness
4. Conclusions
Author Contributions
Funding
Institutional Review Board Statement
Informed Consent Statement
Data Availability Statement
Acknowledgments
Conflicts of Interest
References
- Tao, Q.; Wang, J.; Fu, L.; Chen, Z.; Shen, C.; Zhang, D.; Sun, Z. Ultrahigh Hardness of Carbon Steel Surface Realized by Novel Solid Carburizing with Rapid Diffusion of Carbon Nanostructures. J. Mater. Sci. Technol. 2017, 33, 1210–1218. [Google Scholar] [CrossRef]
- Suh, B.S.; Lee, W.J. Surface Hardening of AISI 316L Stainless Steel Using Plasma Carburizing. Thin Solid Film. 1997, 295, 185–192. [Google Scholar] [CrossRef]
- Savrai, R.A.; Skorynina, P.A.; Makarov, A.V.; Osintseva, A.L. Effect of Liquid Carburizing at Lowered Temperature on the Micromechanical Characteristics of Metastable Austenitic Steel. Phys. Met. Metallogr. 2020, 121, 1015–1020. [Google Scholar] [CrossRef]
- Gupta, G.S.; Chaudhuri, A.; Vasanth Kumar, P. Modelling, Simulation, and Graphical User Interface for Industrial Gas Carburising Process. Mater. Sci. Technol. 2002, 18, 1188–1194. [Google Scholar] [CrossRef]
- Liu, L.; Li, Q.; Liu, X.; Gao, Y.; Ren, X.; Liao, B.; Yang, Q. Stress Field Simulation of Carburized Specimens with Different Carbon Content during Quenching Process. Mater. Lett. 2007, 61, 1251–1255. [Google Scholar] [CrossRef]
- Tóth, L.; Fábián, E.R. The Effects of Quenching and Tempering Treatment on the Hardness and Microstructures of a Cold Work Steel. Int. J. Eng. Manag. Sci. 2019, 4, 286–294. [Google Scholar] [CrossRef]
- Baragetti, S. Finite Element Analysis and Experiments for Predicting Fatigue and Rolling Contact Fatigue Behavior of Spur Gears. Period. Polytech. Mech. Eng. 2022, 66, 304–313. [Google Scholar] [CrossRef]
- Wada, T. Diffusion Modeling of the Carburization Process. Metall. Trans. A 1980, 11, 1076–1077. [Google Scholar] [CrossRef]
- Guo, J.; Deng, X.; Wang, H.; Zhou, L.; Xu, Y.; Ju, D. Modeling and Simulation of Vacuum Low Pressure Carburizing Process in Gear Steel. Coatings 2021, 11, 1003. [Google Scholar] [CrossRef]
- Jimenez, H.; Statia, M.; Puchi, E. Mathematical Modeling of a Carburizing Process of a SAE 8620H Steel. Surf. Coat. Technol. 1999, 121, 358–365. [Google Scholar] [CrossRef]
- Kang, S.H.; Im, Y.T. Finite Element Investigation of Multi-Phase Transformation within Carburized Carbon Steel. J. Mater. Process. Technol. 2007, 183, 241–248. [Google Scholar] [CrossRef]
- Karabelchtchikova, O.; Sisson, R.D. Carbon Diffusion in Steels: A Numerical Analysis Based on Direct Integration of the Flux. J. Phase Equilibria Diffus. 2006, 27, 598–604. [Google Scholar] [CrossRef]
- Lee, S.J.; Matlock, D.K.; Van Tyne, C.J. Comparison of Two Finite Element Simulation Codes Used to Model the Carburizing of Steel. Comput. Mater. Sci. 2013, 68, 47–54. [Google Scholar] [CrossRef]
- Nurbanasari, M.; Tsakiropoulos, P.; Palmiere, E.J. A Study of Carbide Precipitation in a H21 Tool Steel. ISIJ Int. 2014, 54, 1667–1676. [Google Scholar] [CrossRef]
- Peng, J.; Li, Z.; Fu, L.; Ji, X.; Pang, Z.; Shan, A. Carbide Precipitation Strengthening in Fine-Grained Carbon-Doped FeCoCrNiMn High Entropy Alloy. J. Alloys Compd. 2019, 803, 491–498. [Google Scholar] [CrossRef]
- Shin, S.E.; Choi, H.J.; Hwang, J.Y.; Bae, D.H. Strengthening Behavior of Carbon/Metal Nanocomposites. Sci. Rep. 2015, 5, 1–7. [Google Scholar] [CrossRef] [PubMed]
- Zhang, H.; Xiao, Y.; Xu, Z.; Yang, M.; Zhang, L.; Yin, L.; Chai, S.; Wang, G.; Zhang, L.; Cai, X. Effects of Ni-Decorated Reduced Graphene Oxide Nanosheets on the Microstructural Evolution and Mechanical Properties of Sn-3.0Ag-0.5Cu Composite Solders. Intermetallics 2022, 150, 107683. [Google Scholar] [CrossRef]
- Dalgic, M.; Irretier, A.; Zoch, H.W. Stress-Strain Behaviour of the Case Hardening Steel 20MnCr5 Regarding Different Microstructures. Materwiss. Werksttech. 2009, 40, 448–453. [Google Scholar] [CrossRef]
- Zhang, H.; Ouyang, Z.; Li, L.; Ma, W.; Liu, Y.; Chen, F.; Xiao, X. Numerical Study on Welding Residual Stress Distribution of Corrugated Steel Webs. Metals 2022, 12, 1831. [Google Scholar] [CrossRef]
- Katemi, R.J.; Epp, J. Influence of Carbonitriding Conditions on Phase Composition and Residual Stresses for 20MnCr5 Low Alloy Steel. Tanzania J. Sci. 2021, 47, 790–799. [Google Scholar] [CrossRef]
- Hiremath, P.; Sharma, S.; Gowrishankar, M.C.; Shettar, M.; Gurumurthy, B.M. Effect of Post Carburizing Treatments on Residual Stress Distribution in Plain Carbon and Alloy Steels- A Numerical Analysis. J. Mater. Res. Technol. 2020, 9, 8439–8450. [Google Scholar] [CrossRef]
- Sawicki, J.; Januszewicz, B.; Sikora, M.; Witkowski, B. The Influence of Workpiece Speed on Microhardness and Residual Stresses in Vacuum-Carburised 20MnCr5 Steel Using the Single-Piece Flow Method. Arch. Mater. Sci. Eng. 2022, 115, 66–75. [Google Scholar] [CrossRef]
- Al Rafi, A.; Ali, M.M.; Haque, R.; Basir, A. Analysis of Stress and Distortion in Heat Treatment of Different Steels. In Proceedings of the 2018 International Conference on Computing, Electronics & Communications Engineering (iCCECE), Southend, UK, 16–17 August 2019; pp. 297–301. [Google Scholar] [CrossRef]
- Szávai, S.; Bezi, Z.; Béres, L.; Kovács, S. Subsurcface Material Characterisation by Simulation on Carburized Rolling Cycle Fatigue Test Specimens. Proc. Eng. Sci. 2019, 1, 659–665. [Google Scholar]
- Liang, R.; Wang, Z.; Yang, S.; Chen, W. Study on Hardness Prediction and Parameter Optimization for Carburizing and Quenching: An Approach Based on FEM, ANN and GA. Mater. Res. Express 2021, 8, 116501. [Google Scholar] [CrossRef]
- Wang, J.; Yang, S.; Li, J.; Ju, D.; Li, X.; He, F.; Li, H.; Chen, Y. Mathematical Simulation and Experimental Verification of Carburizing Quenching Process Based on Multi-Field Coupling. Coatings 2021, 11, 1132. [Google Scholar] [CrossRef]
- Rangaswamy, P.; Scherer, C.P.; Bourke, M.A.M. Experimental Measurements and Numerical Simulation of Stress and Microstructure in Carburized 5120 Steel Disks. Mater. Sci. Eng. A 2001, 298, 158–165. [Google Scholar] [CrossRef]
- Rudnizki, J.; Zeislmair, B.; Prahl, U.; Bleck, W. Thermodynamical Simulation of Carbon Profiles and Precipitation Evolution during High Temperature Case Hardening. Steel Res. Int. 2010, 81, 472–476. [Google Scholar] [CrossRef]
- Clausen, B.; Surm, H.; Hoffmann, F.; Zoch, H.W. The Influence of Carburizing on Size and Shape Changes. Materwiss. Werksttech. 2009, 40, 414–419. [Google Scholar] [CrossRef]
- Kenéz, L.; Kutasi, N.; Filep, E.; Jakab-Farkas, L.; Ferencz, L. Anodic Plasma Nitriding in Hollow Cathode (HCAPN). HTM–J. Heat Treat. Mater. 2018, 73, 96–105. [Google Scholar] [CrossRef]
- Renkó, J.B.; Károly, D.; Bonyár, A. Design, Manufacture, and Characterization of a Novel Ti-Based Nanocrystalline Alloy. J. Mater. Res. Technol. 2021, 11, 498–506. [Google Scholar] [CrossRef]
- EN ISO 18265; Metallic Materials–Conversion of Hardness Values. Multiple DIN Deutsches Institut für Normung: Berlin, Germany, 2000.
- Liščić, B.; Tensi, H.M.; Luty, W. (Eds.) Theory and Technology of Quenching; Springer: Berlin/Heidelberg, Germany, 1992; ISBN 978-3-662-01598-8. [Google Scholar]
- Trzaska, J. Calculation of the Steel Hardness after Continuous Cooling. Arch. Mater. Sci. Eng. 2013, 61, 87–92. [Google Scholar]
- Kim, H.J.; Kweon, Y.G. The Effects of Retained Austenite on Dry Sliding Wear Behavior of Carburized Steels. Wear 1996, 193, 8–15. [Google Scholar] [CrossRef]


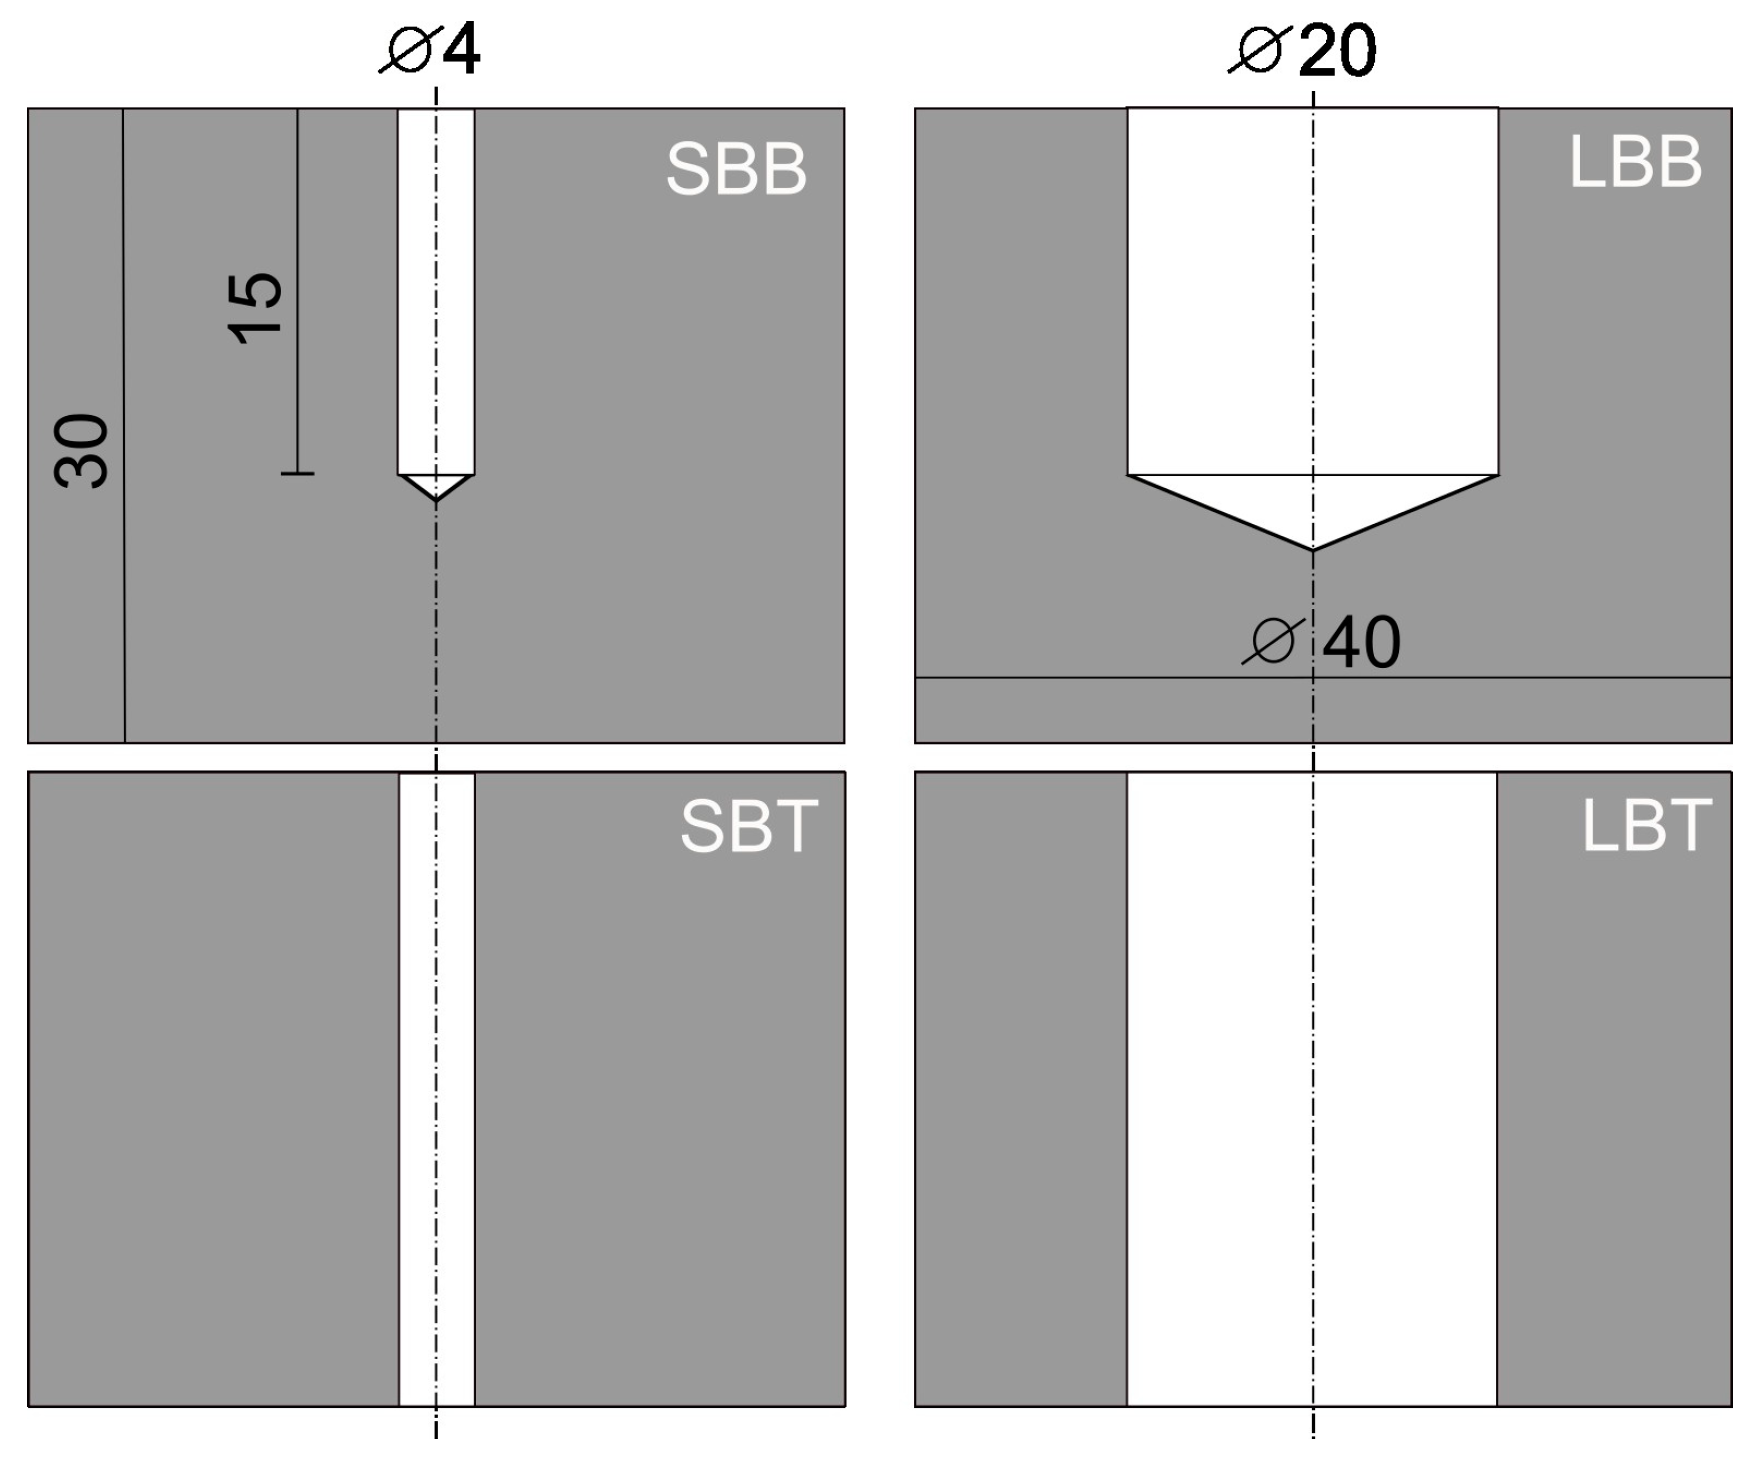
| Abbreviation | Name | Dimensions (mm) |
|---|---|---|
| LBT | Large bore trough | ø20 × 30 |
| LBB | Large bore blind | ø20 × 15 |
| SBT | Small bore trough | ø4 × 30 |
| SBB | Small bore blind | ø4 × 15 |
| LBT | LBB | SBT | SBB | ||||||||||||||||
|---|---|---|---|---|---|---|---|---|---|---|---|---|---|---|---|---|---|---|---|
| Real | Simulated | Real | Simulated | Real | Simulated | Real | Simulated | ||||||||||||
| In | Top | In | Top | In | Top | In | Top | In | Top | In | Top | In | Top | In | Top | ||||
| 785 | 871 | 890 | 871 | 827 | 849 | 1002 | 1012 | 834 | 925 | 853 | 886 | 768 | 853 | 854 | 886 | ||||
| diff. | diff. | diff. | diff. | ||||||||||||||||
| top | 0% | top | 16% | top | −5% | top | 4% | ||||||||||||
| in | 11% | in | 17% | in | 2.3% | in | 10% | ||||||||||||
| Average layer thickness (mm) | LBT | LBB | SBT | SBB | ||||
| Real | Simulated | Real | Simulated | Real | Simulated | Real | Simulated | |
| 1.86 ± 0.20 | 1.75 ± 0.04 | 1.76 ± 0.27 | 1.86 ± 0.06 | 1.42 ± 0.50 | 1.68 ± 0.13 | 1.54 ± 0.37 | 1.68 ± 0.18 | |
Disclaimer/Publisher’s Note: The statements, opinions and data contained in all publications are solely those of the individual author(s) and contributor(s) and not of MDPI and/or the editor(s). MDPI and/or the editor(s) disclaim responsibility for any injury to people or property resulting from any ideas, methods, instructions or products referred to in the content. |
© 2023 by the authors. Licensee MDPI, Basel, Switzerland. This article is an open access article distributed under the terms and conditions of the Creative Commons Attribution (CC BY) license (https://creativecommons.org/licenses/by/4.0/).
Share and Cite
Rumony, A.; Szlancsik, A.; Kovács, D. Verification of the Simulated Carburizing Process in Different Bore Sizes. Coatings 2023, 13, 1019. https://doi.org/10.3390/coatings13061019
Rumony A, Szlancsik A, Kovács D. Verification of the Simulated Carburizing Process in Different Bore Sizes. Coatings. 2023; 13(6):1019. https://doi.org/10.3390/coatings13061019
Chicago/Turabian StyleRumony, András, Attila Szlancsik, and Dorina Kovács. 2023. "Verification of the Simulated Carburizing Process in Different Bore Sizes" Coatings 13, no. 6: 1019. https://doi.org/10.3390/coatings13061019