Article

Owens–Wendt Characterization of Femtosecond-Laser-Textured Hydrophobic Aluminum Surfaces

1
Department of Chemical Technology of Composite Materials, Chemical Technology Faculty, Igor Sikorsky Kyiv Polytechnic Institute, Beresteiskyi Ave. 37, 03056 Kyiv, Ukraine
2
Solid State Laser Laboratory, Department of Laser Technologies, Center for Physical Sciences and Technology, Savanoriu Ave. 231, 02300 Vilnius, Lithuania
*
Author to whom correspondence should be addressed.
Coatings 2023, 13(6), 1104; https://doi.org/10.3390/coatings13061104
Submission received: 28 April 2023 / Revised: 6 June 2023 / Accepted: 12 June 2023 / Published: 15 June 2023
(This article belongs to the Special Issue Laser Surface Engineering)

Abstract

:
The eligibility of applying the Owens–Wendt approach to determining the free surface energy of liquid-repellent aluminum surfaces, with micro- and nanotextures formed by a femtosecond laser, was considered. This approach has been shown to be applicable using two essential parameters that can be derived from the graphs. The first is related to the fraction of the contact area between the liquid and the solid surface in the Cassie state. The second is related to the degree of intrinsic polarity of the surface material or the applied organic modifier. The presented interpretation was used to compare the liquid repellency of the obtained textures. A microtexture with a period of 60 μm and a groove width of 45 μm has been shown to be the most liquid repellent. Among the modifiers, 1H,1H,2H,2H-perfluoroctyltriethoxysilane was the most effective, and stearic acid was only slightly inferior, but promising in terms of cost and environmental friendliness. It was shown that spontaneous hydrophobization provided a contact angle with water up to 159°, but the stability of such textures was inferior to the considered modifiers.

1. Introduction

Texturing is an effective way to achieve liquid-repellent surfaces bioinspired by lotus leaves, reeds, and rose petals [1]. A high throughput of metal surface micro-texturing is provided by femtosecond laser ablation [2,3]. It also allows the formation of nanotextures, including highly ordered laser-induced periodic surface structures (LIPSS). The hierarchical surface structure makes it possible to realize a stable Cassie wetting state, when a liquid drop contacts with the protrusions of the texture, and trapped air is located in its depressions [4,5]. This provides a surface contact angle above 150°, which is defined as a superhydrophobic state [6]. An important factor in this case is the intrinsic hydrophobicity (non-polarity) of the surface, given that metals are polar surfaces, and their oxides are predominantly hydrophilic materials [7]. Numerous studies have been devoted to methods of hydrophobization of textured surfaces, such as treatment in solution, chemical vapor deposition, as well as the phenomenon of spontaneous hydrophobization, leading to an increase in the surface contact angle above 160° after texturing [8]. Hypotheses explain this phenomenon by adsorption from the atmosphere and binding on the surface of hydrocarbons, as well as carbon dioxide [9].
The effectiveness of both induced and spontaneous methods is often assessed by the contact angle with water, as well as by indicators such as contact angle hysteresis and rolling angles [10,11]. In some publications, the surface energy of hydrophobic textured surfaces is also characterized by the Zisman and Owens–Wendt methods, which are more comprehensive tools for describing the stability of wetting states [12,13,14]. The first method is based on the “one-component” description of the surface energy, i.e., it is well suited for surfaces without a polar interaction component; the second considers its possibility, so the two-component method is more informative and, at the same time, difficult to use [15,16,17]. In this paper, the second method, which is widely used to determine the surface energy of polymers, as well as other medium-polarized materials, was considered. Its use in characterizing chemically modified surfaces is justified by the distance effect of the manifestation of a surface force field. For example, in references [18,19], the dependence of the contact angle of the steel surface contaminated with hydrocarbon on the thickness of such a layer is described. In this case, the surface polarity decreases with an increase in the amount of adsorbate. The application of the method is complicated by the fact that, on textured surfaces, where probe liquid drops are in the Cassie state, a transition to the Wenzel state occurs at a certain value of surface tension [20,21]. That is, the fraction of the contact surface with the probe liquid drop changes, which means that the graphical solution of the system of equations loses its meaning. Nevertheless, the method is potentially a source of valuable information, both in determining the stability limits of the Cassie state, and, consequently, the quality of the liquid-repellant structure and the characterization of this state [22]. This necessitates its use in a number of works as an additional method for characterizing the surface energy.
The purpose of this work was to obtain and interpret the regularities that determine the shape of the Owens–Wendt plots for aluminum surfaces textured with a femtosecond laser, and to determine the surface features to which the method is sensitive. The aluminum alloy of the 7500 series was chosen as a substrate for obtaining textures due to its versatility and widespread use in engineering [23]. Obtaining highly effective liquid-repellent textures on its surface by processing with a femtosecond laser would make it possible to impart valuable properties such as low adhesion to ice, increased corrosion resistance, etc. Moreover, laser surface treatment is a solution to one of the fundamental problems of creating superhydrophobic coatings: the limited scalability of highly ordered structures [24,25]. It is known that the textures obtained by this method are highly repeatable, and water-repellent properties can be specified by the geometry of the cells [26]. The second essential factor in ensuring superhydrophobicity is the intrinsic hydrophobicity of the material surface layer [27]. There is a wide range of water repellents for aluminum substrates, which can be conditionally divided into groups of hydrocarbon compounds, organosilicon and fluorinated modifiers [28,29]. A feature of the first group is its low cost and environmental friendliness; the second and third groups have high efficiency [30]. In this work, spontaneous hydrophobization was also investigated. Thus, in addition to studying the capabilities of the Owens–Wendt method, a comparison of the effect of the structure on the aluminum surface processed with a femtosecond laser, as well as the composition of the modifying layers on hydrophobicity, was carried out.

2. Materials and Methods

2.1. Sample Texture Formation

In this study, both micro- and nanotextures were formed using a femtosecond laser (“Carbide”, Light Conversion, Vilnius, Lithuania) on a polished surface of samples 20 × 20 mm2 in size and 2 mm thick, made of 7500 aluminum alloy. The average laser power reached 6 W at a wavelength of 1030 nm and a repetition rate of 60 kHz with a pulse width of ~360 fs. Both micro- and nanotextures were formed at a sample speed of 60 mm/s using X-Y linear stages (Aerotech, Inc., Pittsburgh, PA, USA). During the formation of the nanotexture, the laser beam was focused on the surface of the sample with a spot diameter of ~80 μm (at 1/e2 level) and a pulse energy of ~46 μJ, which corresponded to an energy density of ~0.9 J/cm2. The laser spots overlapped on the sample by ~60% with continuous scanning and a step between adjacent passes of 30 μm. To engrave microtextures, the laser beam was sharply focused into a spot with a diameter of ~5 μm (at 1/e2 level), and the laser pulse energy varied from ~21 μJ to ~35 μJ, which corresponded to an energy density from ~107 J/cm2 to ~178 J/cm2. The microtexture for sample “M” was in the form of pyramids, and for samples “B”, “C”, and “E”, it was in the form of linear grooves. The void-shaped texture was not used due to low efficiency [31]. A blank degreased aluminum plate was used as a reference surface. The laser processing parameters were optimized to achieve the best performance and minimum sample contamination under the limitations of the power and energy of the laser source. A more detailed description and layout of laser processing was given in [32].
After texturing, the samples were stored in room conditions in a container (polypropylene box with a volume of 3 L) to protect them from contamination with airborne dust. The samples were stored for 2 months at atmospheric pressure and room temperature (22 °C).

2.2. Chemical Surface Treatment

The following modifiers (“Alfa Aesar”, Thermo Fisher, Kandel, Germany) have been used to reduce the surface energy of laser textured surfaces: 1H,1H,2H,2H-perfluoroctyltriethoxysilane (POTS) (CAS 51851-37-7); Octyltrimethoxysilane (OCTEO) (CAS 3069-40-7); Stearic acid (CAS 57-11-4); and Squalane (CAS 111-01-3). This choice of modifiers is justified by the fact that POTS is one of the most common agents and is the most effective [33,34], while OCTEO is an analogue and fluorine-free replacement for POTS, which makes this option more environmentally friendly for use [35]. Before treatment, the samples were repeatedly rinsed with isopropyl alcohol and dried in an oven at 80 °C for 15 min. For treatment with POTS/OCTEO, the samples were immersed in 1 wt.% solution of isopropyl alcohol for 30 min at room temperature and dried in an oven at 130 °C for 30 min [36]. For treatment with stearic acid/squalane, the samples were immersed in 0.5 wt.% isopropyl alcohol solution of stearic acid and 0.5 wt.% xylene solution of squalane for 30 min at room temperature and dried in a desiccator at 65 °C for 30 min.

2.3. Surface Characterization

The surface topography of the obtained samples was studied using a “MIRA3 LMU” scanning electron microscope (Tescan, s.r.o., Brno, Czech Republic) and a “MarSurf PS 10” tactile profilometer (Mahr GmbH, Goettingen, Germany). Determination of the contact angle was performed using the sessile drop technique. An optical microscope and an H5D digital camera (Delta Optical, Shanghai, China) with the “ScopeTek View” software (version 1.0.0.1, ScopeTek Optics Electronics, Hangzhou, China) were used to obtain photos of liquid droplets. Measurements were taken at least at 5 different locations on the sample surface. The measurements were carried out by applying drops of probe fluid with a volume of 5 ± 0.5 µL, which were carefully applied to the surface with a micropipette under room conditions (temperature 22 °C and relative humidity ~50%). Samples were dried for 5 min at 60 °C in an oven before applying new sample fluid. In the case of linear textures, the contact angle was measured in the longitudinal direction of the microgrooves. Water–ethanol mixtures were used as probe liquids when plotting the Owens–Wendt graph to achieve greater measurement resolution compared to particular liquids. The surface tension values of the water–ethanol probe liquids were measured individually with decomposition performed by paraffin calibration. The surface tension of probe liquids was calculated using the dependencies from [37]. The elemental composition of the surface was determined using an X-ray energy dispersive spectrometer (EDS) (“INCA X-ACT”, Oxford Instruments, Abingdon, UK).

2.4. Owens–Wendt Method

The Owens–Wendt method is based on the free surface energy Equation (1) [17]:
σ S L = σ S + σ L 2 σ S D σ L D + σ S P σ L P
where σ S L is the surface energy at the solid–liquid interface; σ S is the surface energy at the solid–air interface; σ L is the surface tension of the liquid; and the indices D and P correspond to the dispersed and polar components of the surface energy. Its practical modification (2) is reduced to the straight-line equation. This provides the possibility of the graphical solution of the system of equations and approximation of experimental data.
σ L ( 1 + c o s θ ) 2 σ L D = σ S P σ L P σ L D + σ S D
The graphical method in this case consists of plotting the dependence σ L ( 1 + c o s θ ) / 2 σ L D = f ( σ L P / σ L D ) and its approximation by a straight line. The slope of this line allows the calculating of σ S P and the intersection with the ordinate axis indicates σ S D .

3. Results and Discussion

3.1. Owens–Wendt Plot on Micro- and Nanoscale Textures

To assess the effect of surface texture on the results obtained by the Owens–Wendt method, two levels of textures were used: micro and nano. The pattern of the microtextured sample (Figure 1a) was formed by square pillars. The period of this texture was 45 μm with a pillar width of 30 μm. The nanotextured sample (Figure 1b) was formed by a disordered structure of intergrown 150–200 nm crystals. The obtained samples were treated with octyltrimethylsilane to reduce the surface energy.
The Owens–Wendt plots for both textured surfaces (Figure 2) cannot be approximated by a straight line, as is possible in accordance with the classical approach. However, for a flat surface with the same treatment, it was determined that the dispersed component of the surface energy σ S D is 18.0 mN/m, and the polar one σ S P is 2.4 mN/m, which correlates with previous measurement results [38].
The plot for textured surfaces contains at least two segments. The first one, hereinafter referred to as “plateau” in the range σ L P / σ L D above 0.6, corresponds to the wetting plateau, when the contact angle for the nanostructure is maintained in the range from 155° to 160°, and for the microstructure from 140° to 145°. The second is at σ L P / σ L D below 0.6, which probably corresponds to the transition between the Cassie and Wenzel wetting states, which is typically followed by a decrease in the surface water contact angle [39].
The “plateau” wetting state may be described by the Cassie-Baxter Equation (3), which takes into account the dependence of the contact angles on the fractional composition of the contact surface:
c o s θ a p p = f 1 c o s θ 1 + f 2 c o s θ 2
where c o s θ a p p is the contact angle of a two-phase heterogenous surface, f 1 and c o s θ 1 are the surface fraction and contact angle of the first phase, and f 2 and c o s θ 2 are the surface fraction and contact angle of the second phase (air). If θ 2 was considered to be 360°, then c o s θ 2 = 1.
In the transition state, the distribution of the fractions of the contact area of the droplet with air and the modified surface changes. That is, for such surfaces, when using the sessile drop technique for each probe liquid, the unique surface contact angle is measured with its values f1 and f2 from the Cassie equation. Since the fractional composition of the composite surface (the ratio between f1 and f2) differs for each probe liquid, especially during the wetting transition, each point of the graph corresponds to its own pair of polar and dispersion components. Hence, the classical Owens-Wendt graphical approximation loses its meaning for textured samples, where a wetting transition can be observed.
However, if we assume that, in the plateau region, the contact angle of the probe liquid with the substrate remains constant at a given measurement accuracy, then the use of graphical approximation can still be justified. Furthermore, given that the studied surfaces have a negligible polar component, i.e., σ T S P → 0, it is possible to determine the value of the dispersion component of the composite surface energy (textural irregularities and air pockets) σ T S D in Equation (4) of the considered surfaces (Table 1):
σ L ( 1 + c o s θ app ) 2 σ L D = σ T S D
The values of σ T S D , determined in this way, are significantly lower than the intrinsic disperse component of the material σ S D . This can be explained by the fact that a significant part of the droplet’s contact with the surface falls on air, the surface tension of which is assumed to be zero [40,41]. The ratio σ T S D / σ S D can thus be used as a measure of the reduction in interfacial contact and is inherently related to the ratio of the parameters of the Cassie equation f2/(f2 + f1).
The second informative parameter of the graph is the coordinate of the beginning of the wetting transition. In the work, it is characterized by the value of the polar component of the surface tension of the probe liquid σ L P where the plateau ends.
The σ T S D / σ S D parameter is sensitive to texture geometry. For example, when passing from a microstructure to a nanostructure in Figure 2, it decreases by almost five times, which can be explained by a decrease in the fraction of the liquid–material interfacial contact f1.
The value of σ L P is related to the minimum surface tension at the beginning of the wetting transition, which can be determined, for example, by the Zisman method, as was shown in [32].

3.2. Owens–Wendt Plots as a Tool for Comparing the Water Repellency of Microtextures

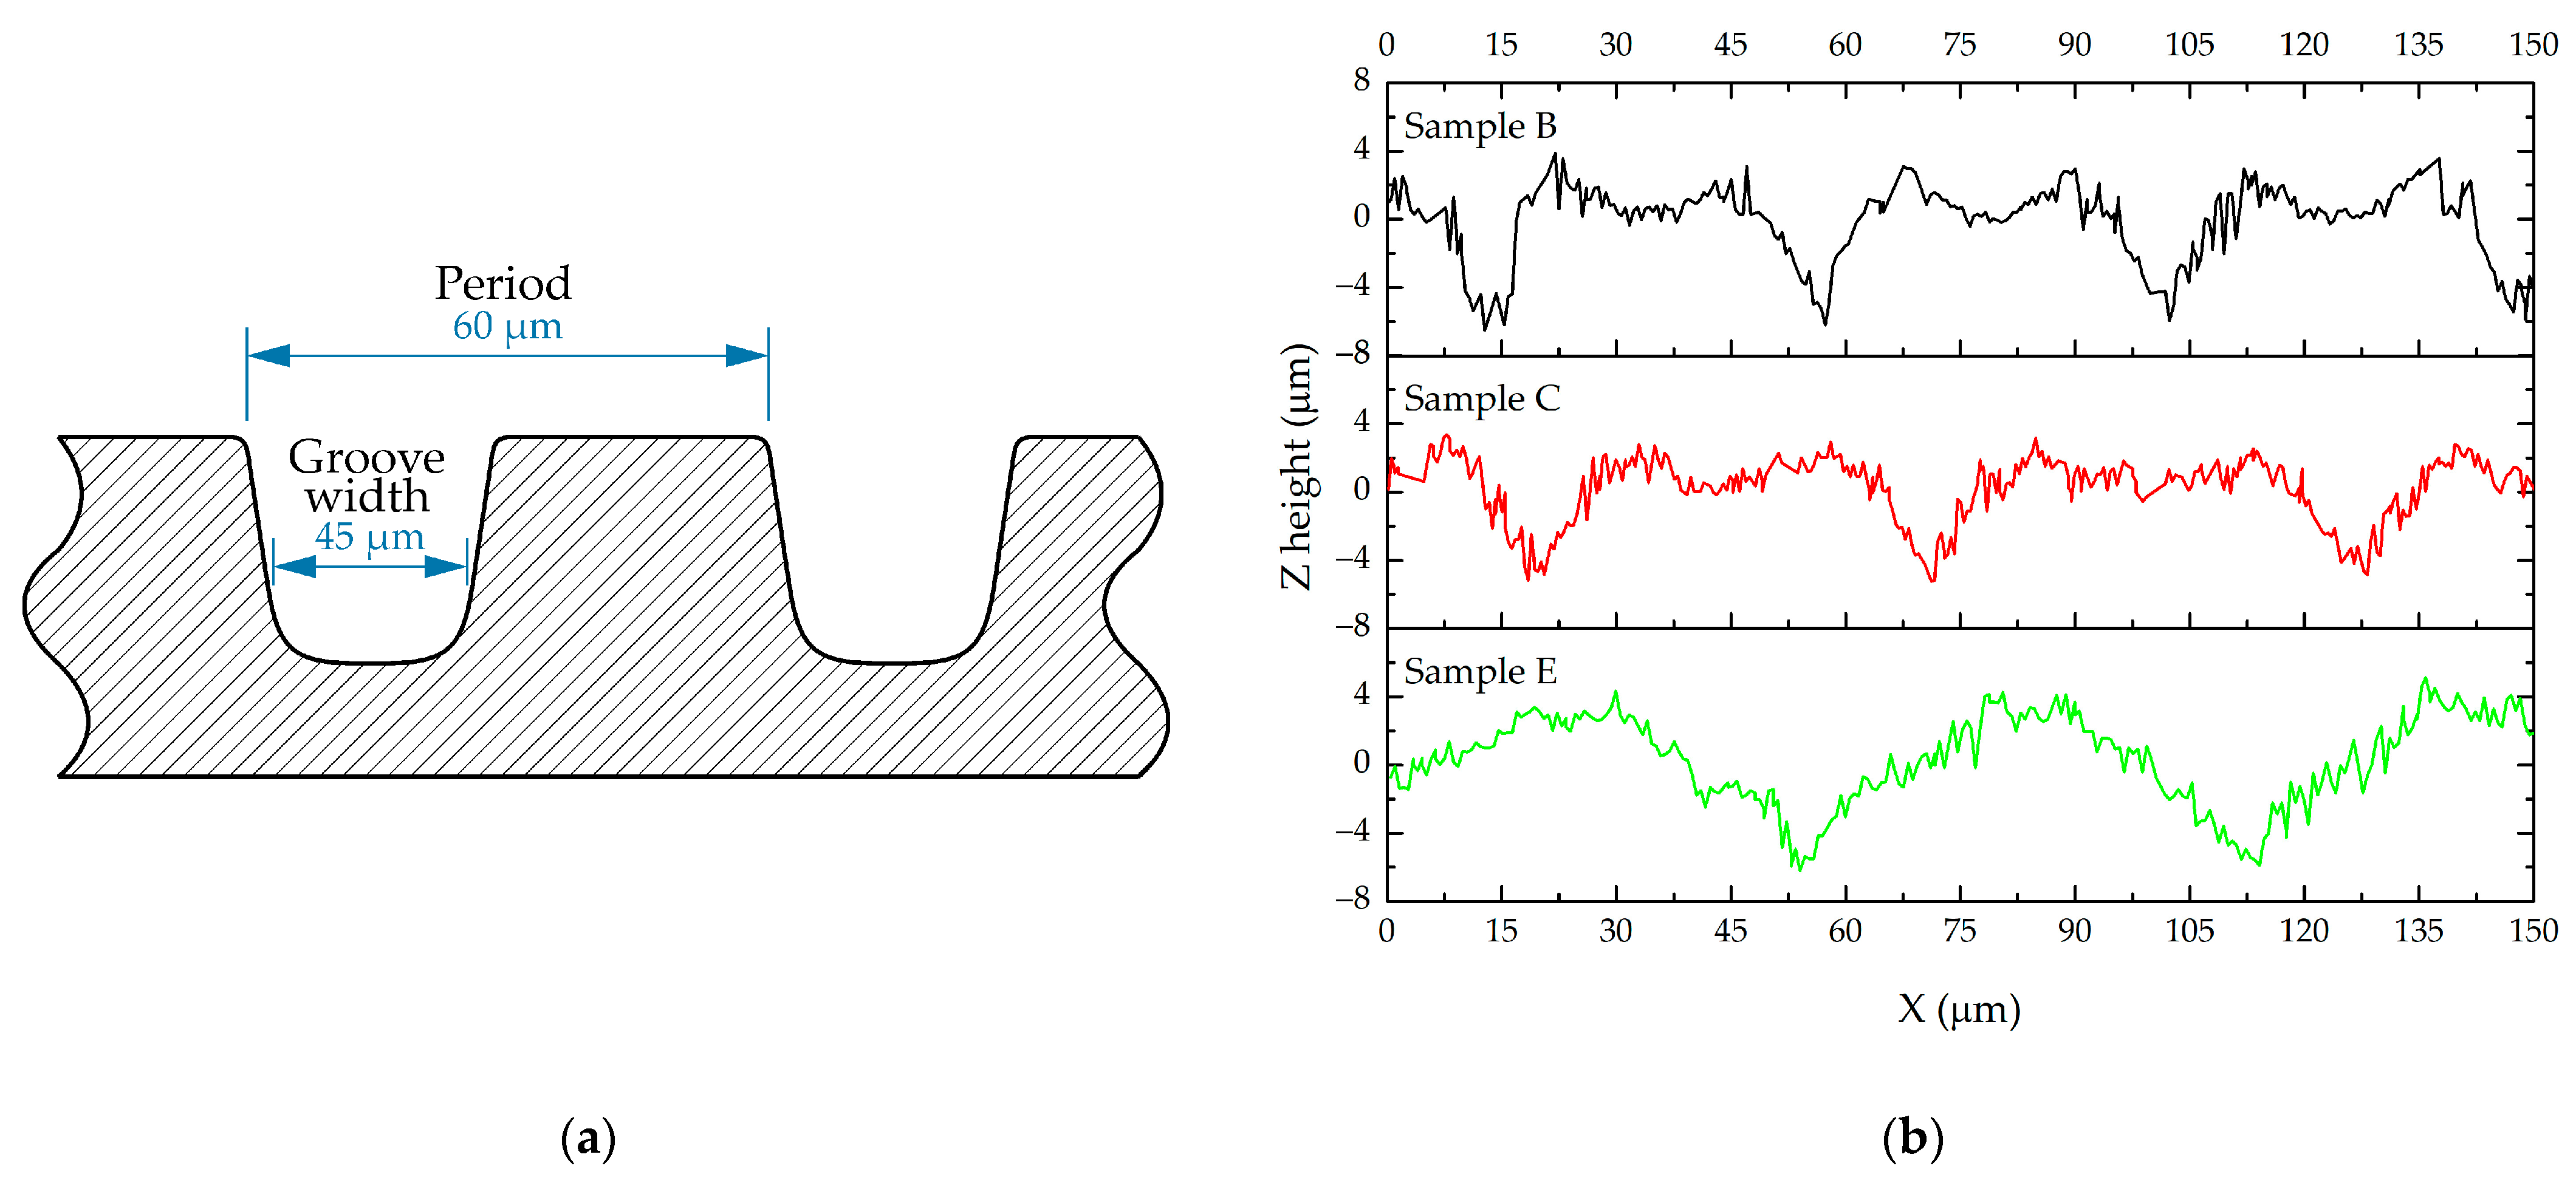
When comparing liquid-repellent textures of different levels of organization, a more subtle analysis of their quality within the level is of particular interest. Below, unidirectional microtextures with varying period and width of the grooves have been considered (Table 2). The geometry of the obtained structures was confirmed by profilometry (Figure 3).
The surface of the laser-processed samples was formed by two levels of roughness, whereby the main microrelief (Figure 4a) was supplemented by a submicron level (Figure 4b) at the tops of the protrusions and in the depressions. The appearance of a finer texture on the metal surface is a common artifact in femtosecond laser processing [42]. In this case, the second level of texture forms the edge on the microprotrusions. A characteristic feature of the sample in Figure 4 is the small width of the protrusions (15 µm), which causes the edges to merge.
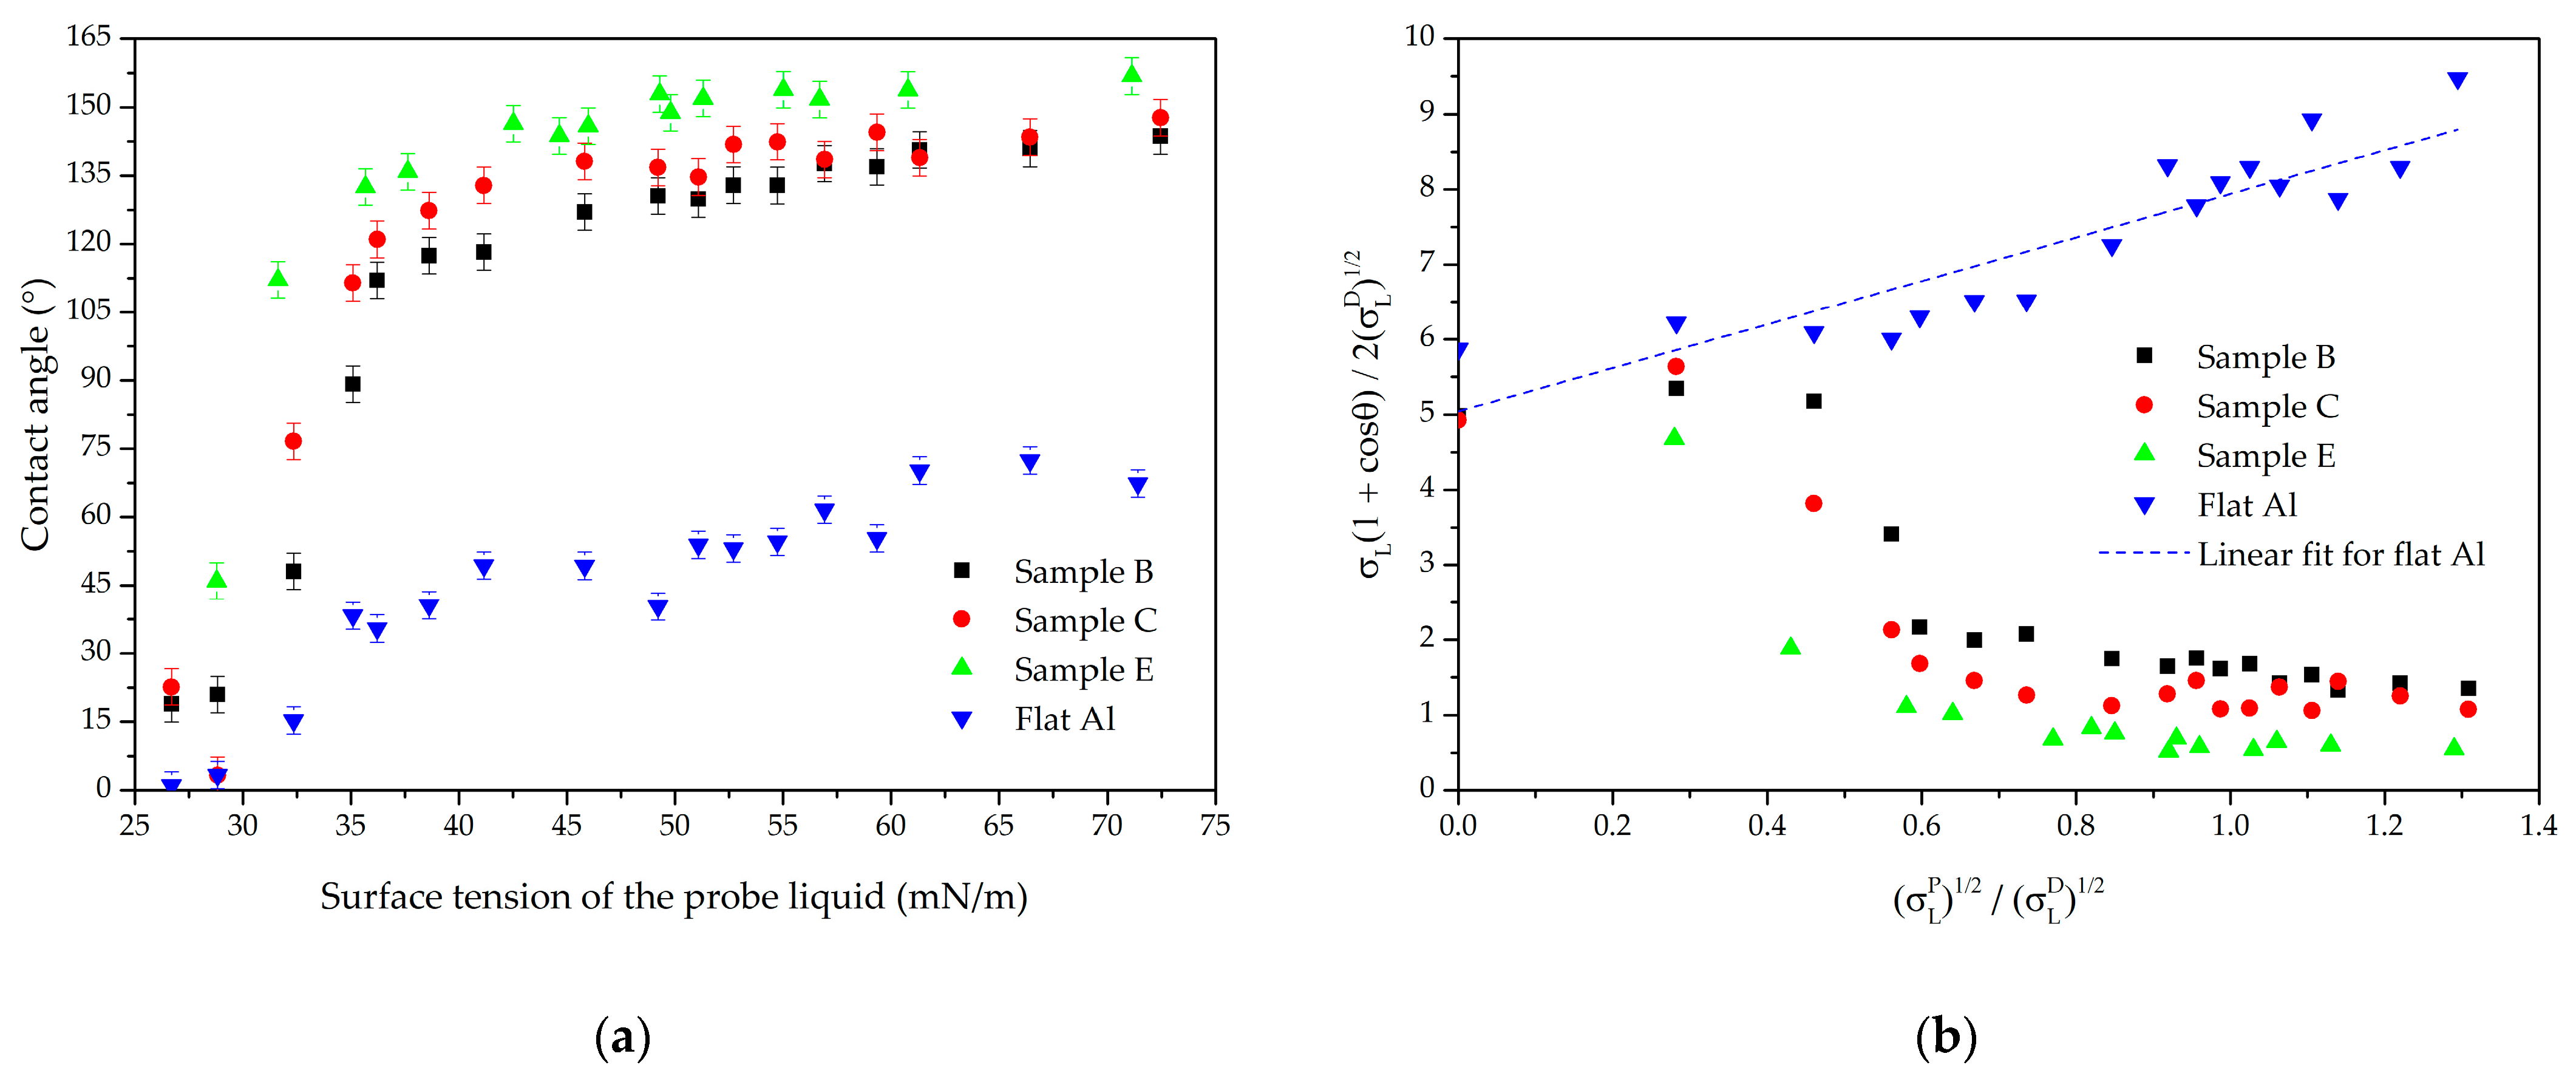
To compare the water repellency of these textures, stearic acid was used as a hydrophobizer in all samples. Its Owens–Wendt plot shows that the total surface energy on a flat surface is 33.7 mN/m. In this case, the polar component is 8.4 mN/m, and the dispersion component is 25.3 mN/m. This is partially consistent with the order of values from [43,44].
The appearance of the graph for textured surfaces turned out to be quite sensitive to the geometry of the microtexture (Figure 5). When passing from samples “B” and “C”, with a groove width of 20 μm, to sample “E”, with a groove of 45 μm, a “plateau” fell, corresponding to an increase in the contact angles. It should be noted that the parameter f2 in the Cassie equation for sample “E”, provided that it is considered exclusively as a microtexture, is 0.75, and for “B” and “C” it is 0.44 and 0.35, respectively.
The value of the parameter σ T S D / σ S D (Table 3), however, does not strictly correlate with the above values of f2. It should be taken into account that these values of f2 were calculated based on the geometric model of the microtexture sample. An error in such calculations can be introduced by the nanotexture along the edges of the grooves, and the fraction of the surface occupied by it increases when passing from sample “B” to sample “E”.
The polar component of the critical surface tension of textures σ L P remains constant at the level of 9.3 mN/m regardless of the change in texture geometry. This fact indicates the main influence of the material’s intrinsic surface energy on the position of the wetting transition point. The next section of the paper is devoted to verifying this conclusion.

3.3. Characterization of the Effectiveness of Hydrophobic Agents in the Formation of Liquid-Repellent Properties of Textured Surfaces

The stability of the liquid repellency effect is largely determined by the nonpolarity of the chemical layer of the modifier on the textured surface [45,46,47]. To evaluate this effect on the appearance of the Owens–Wendt graph, the most efficient structure from those considered in Section 3.2 was selected (sample “E”).
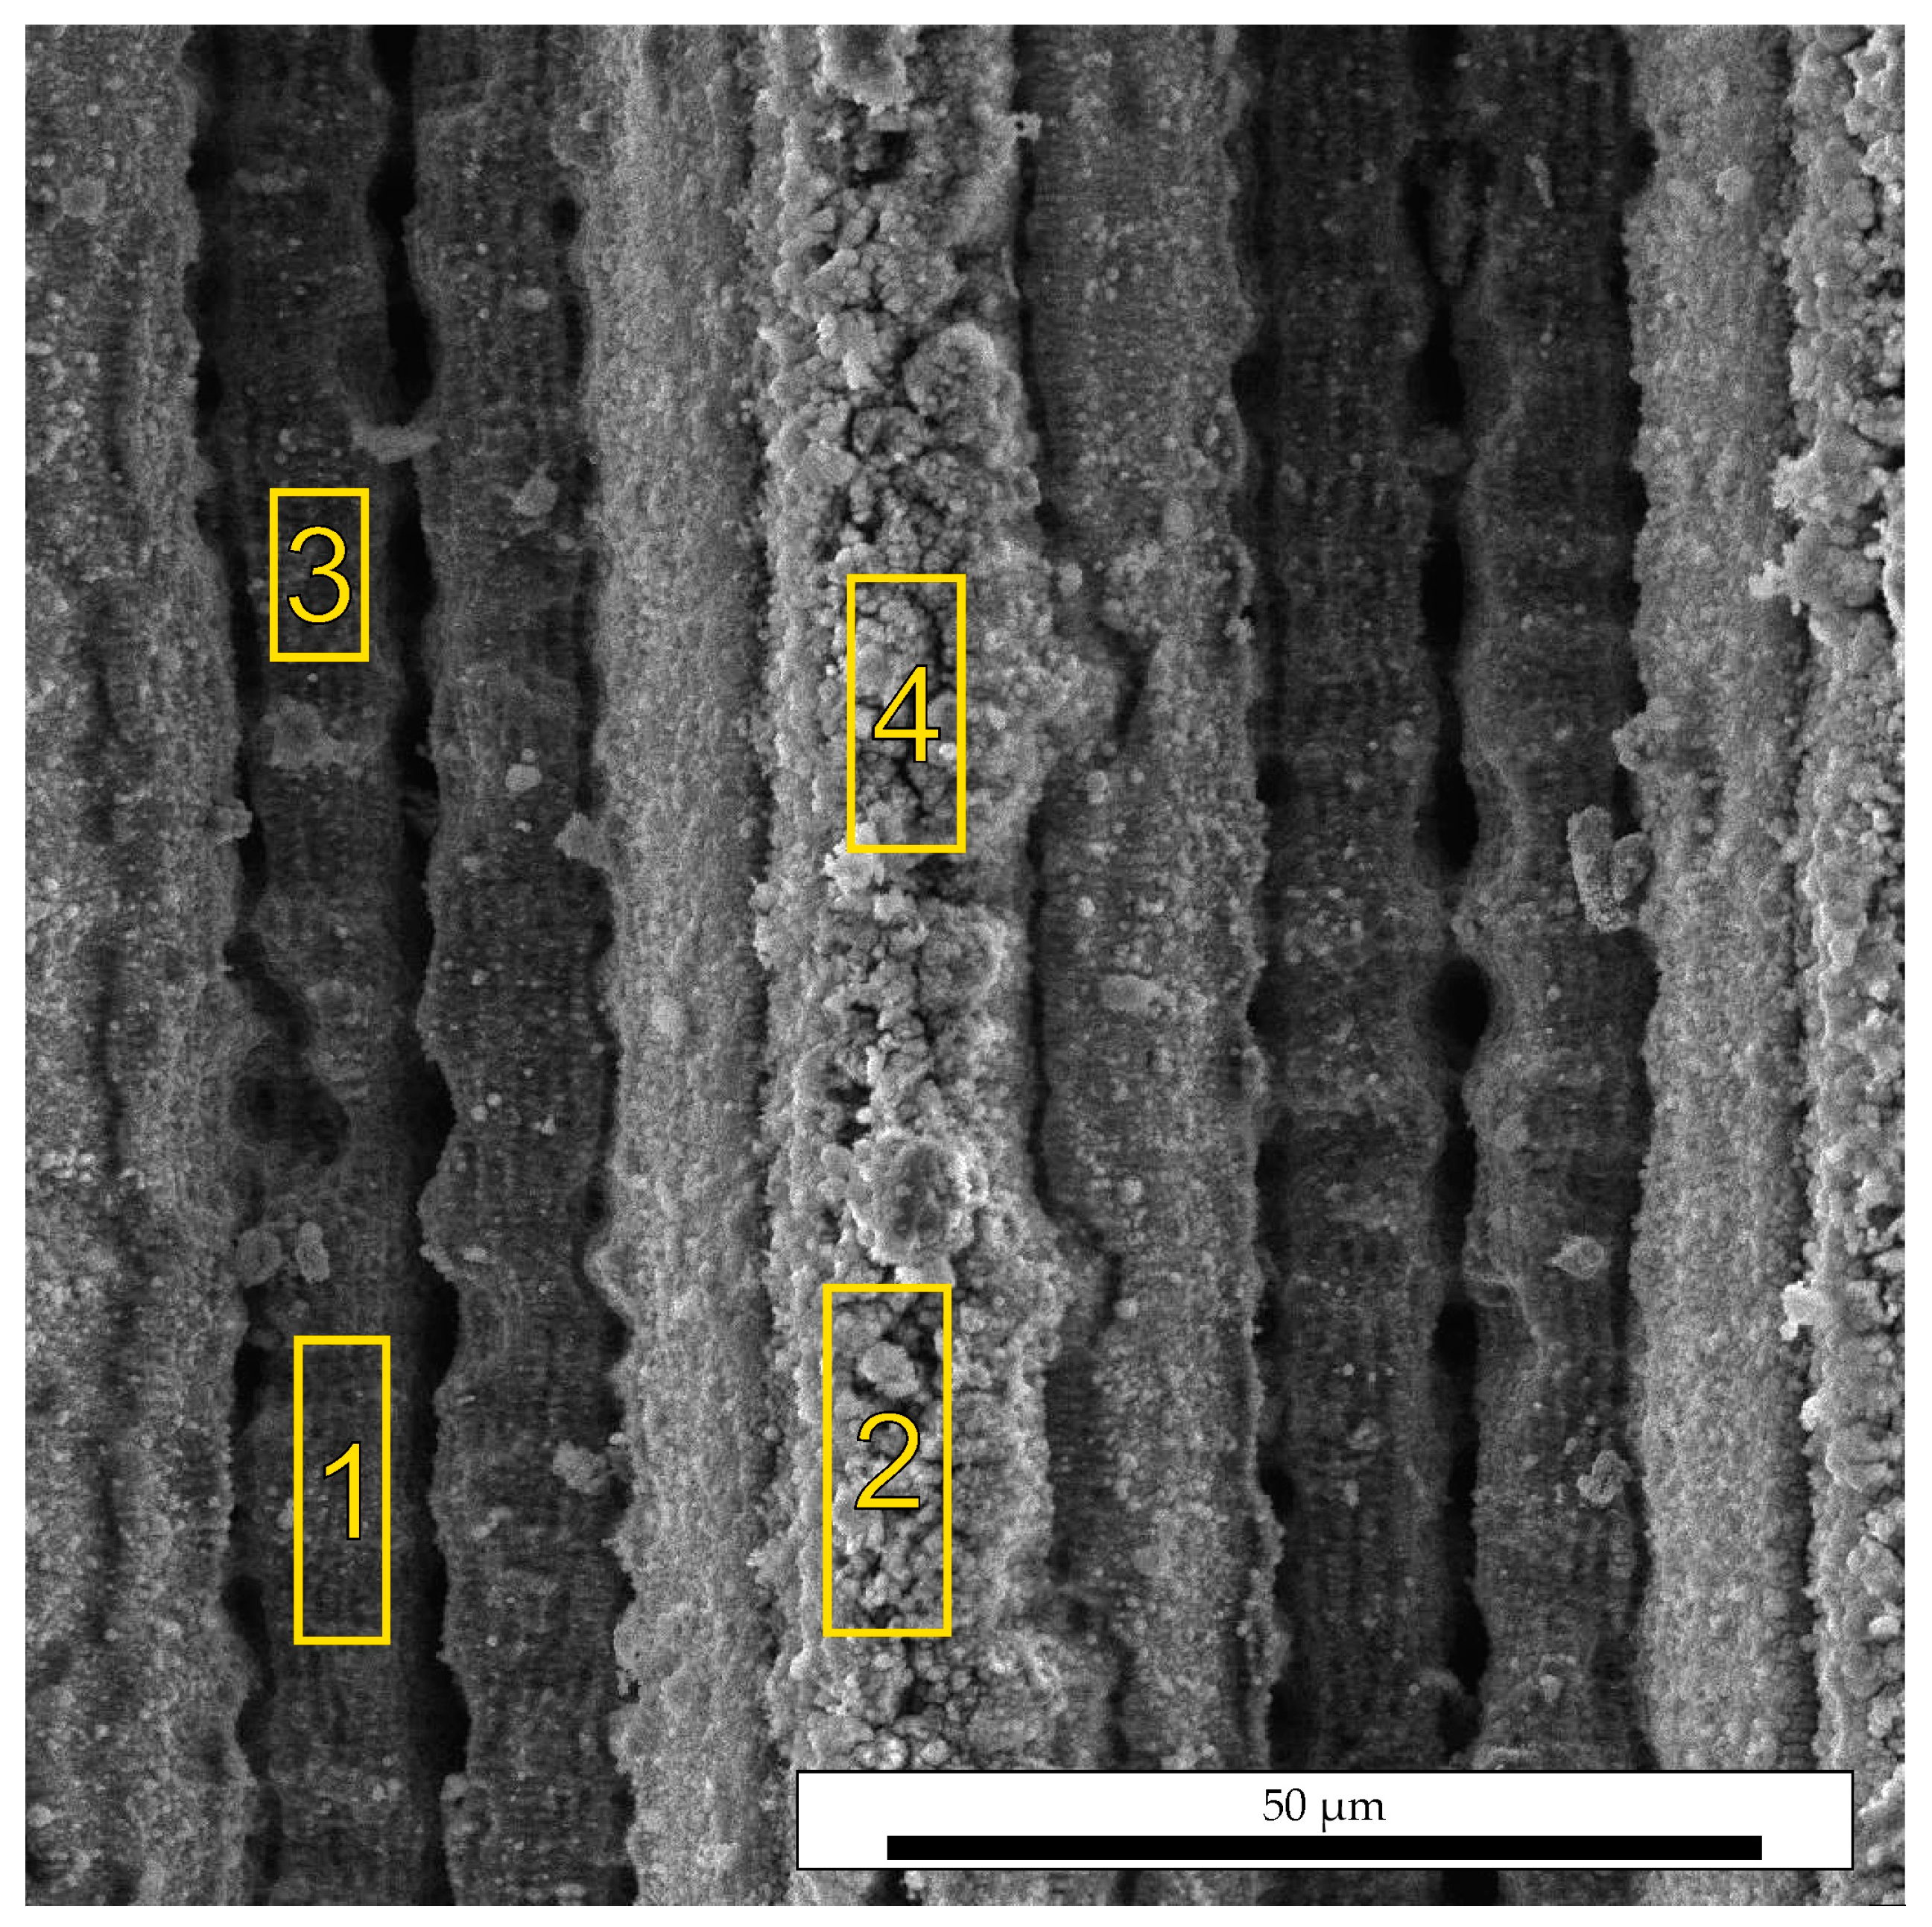
Besides the selected hydrophobizers, the surface energy of the textured samples was also evaluated after exposure in the laboratory for 2 months, which led to spontaneous hydrophobization at a water contact angle of 159°. The increased carbon content over the entire surface (Figure 6 and Table 4) confirmed the absorption of hydrocarbons from the atmosphere. At the same time, it is noticeably greater on the surface of the protrusions (areas 2 and 4). This surface is also characterized by almost five times the oxygen content compared to the depressions (areas 1 and 3).
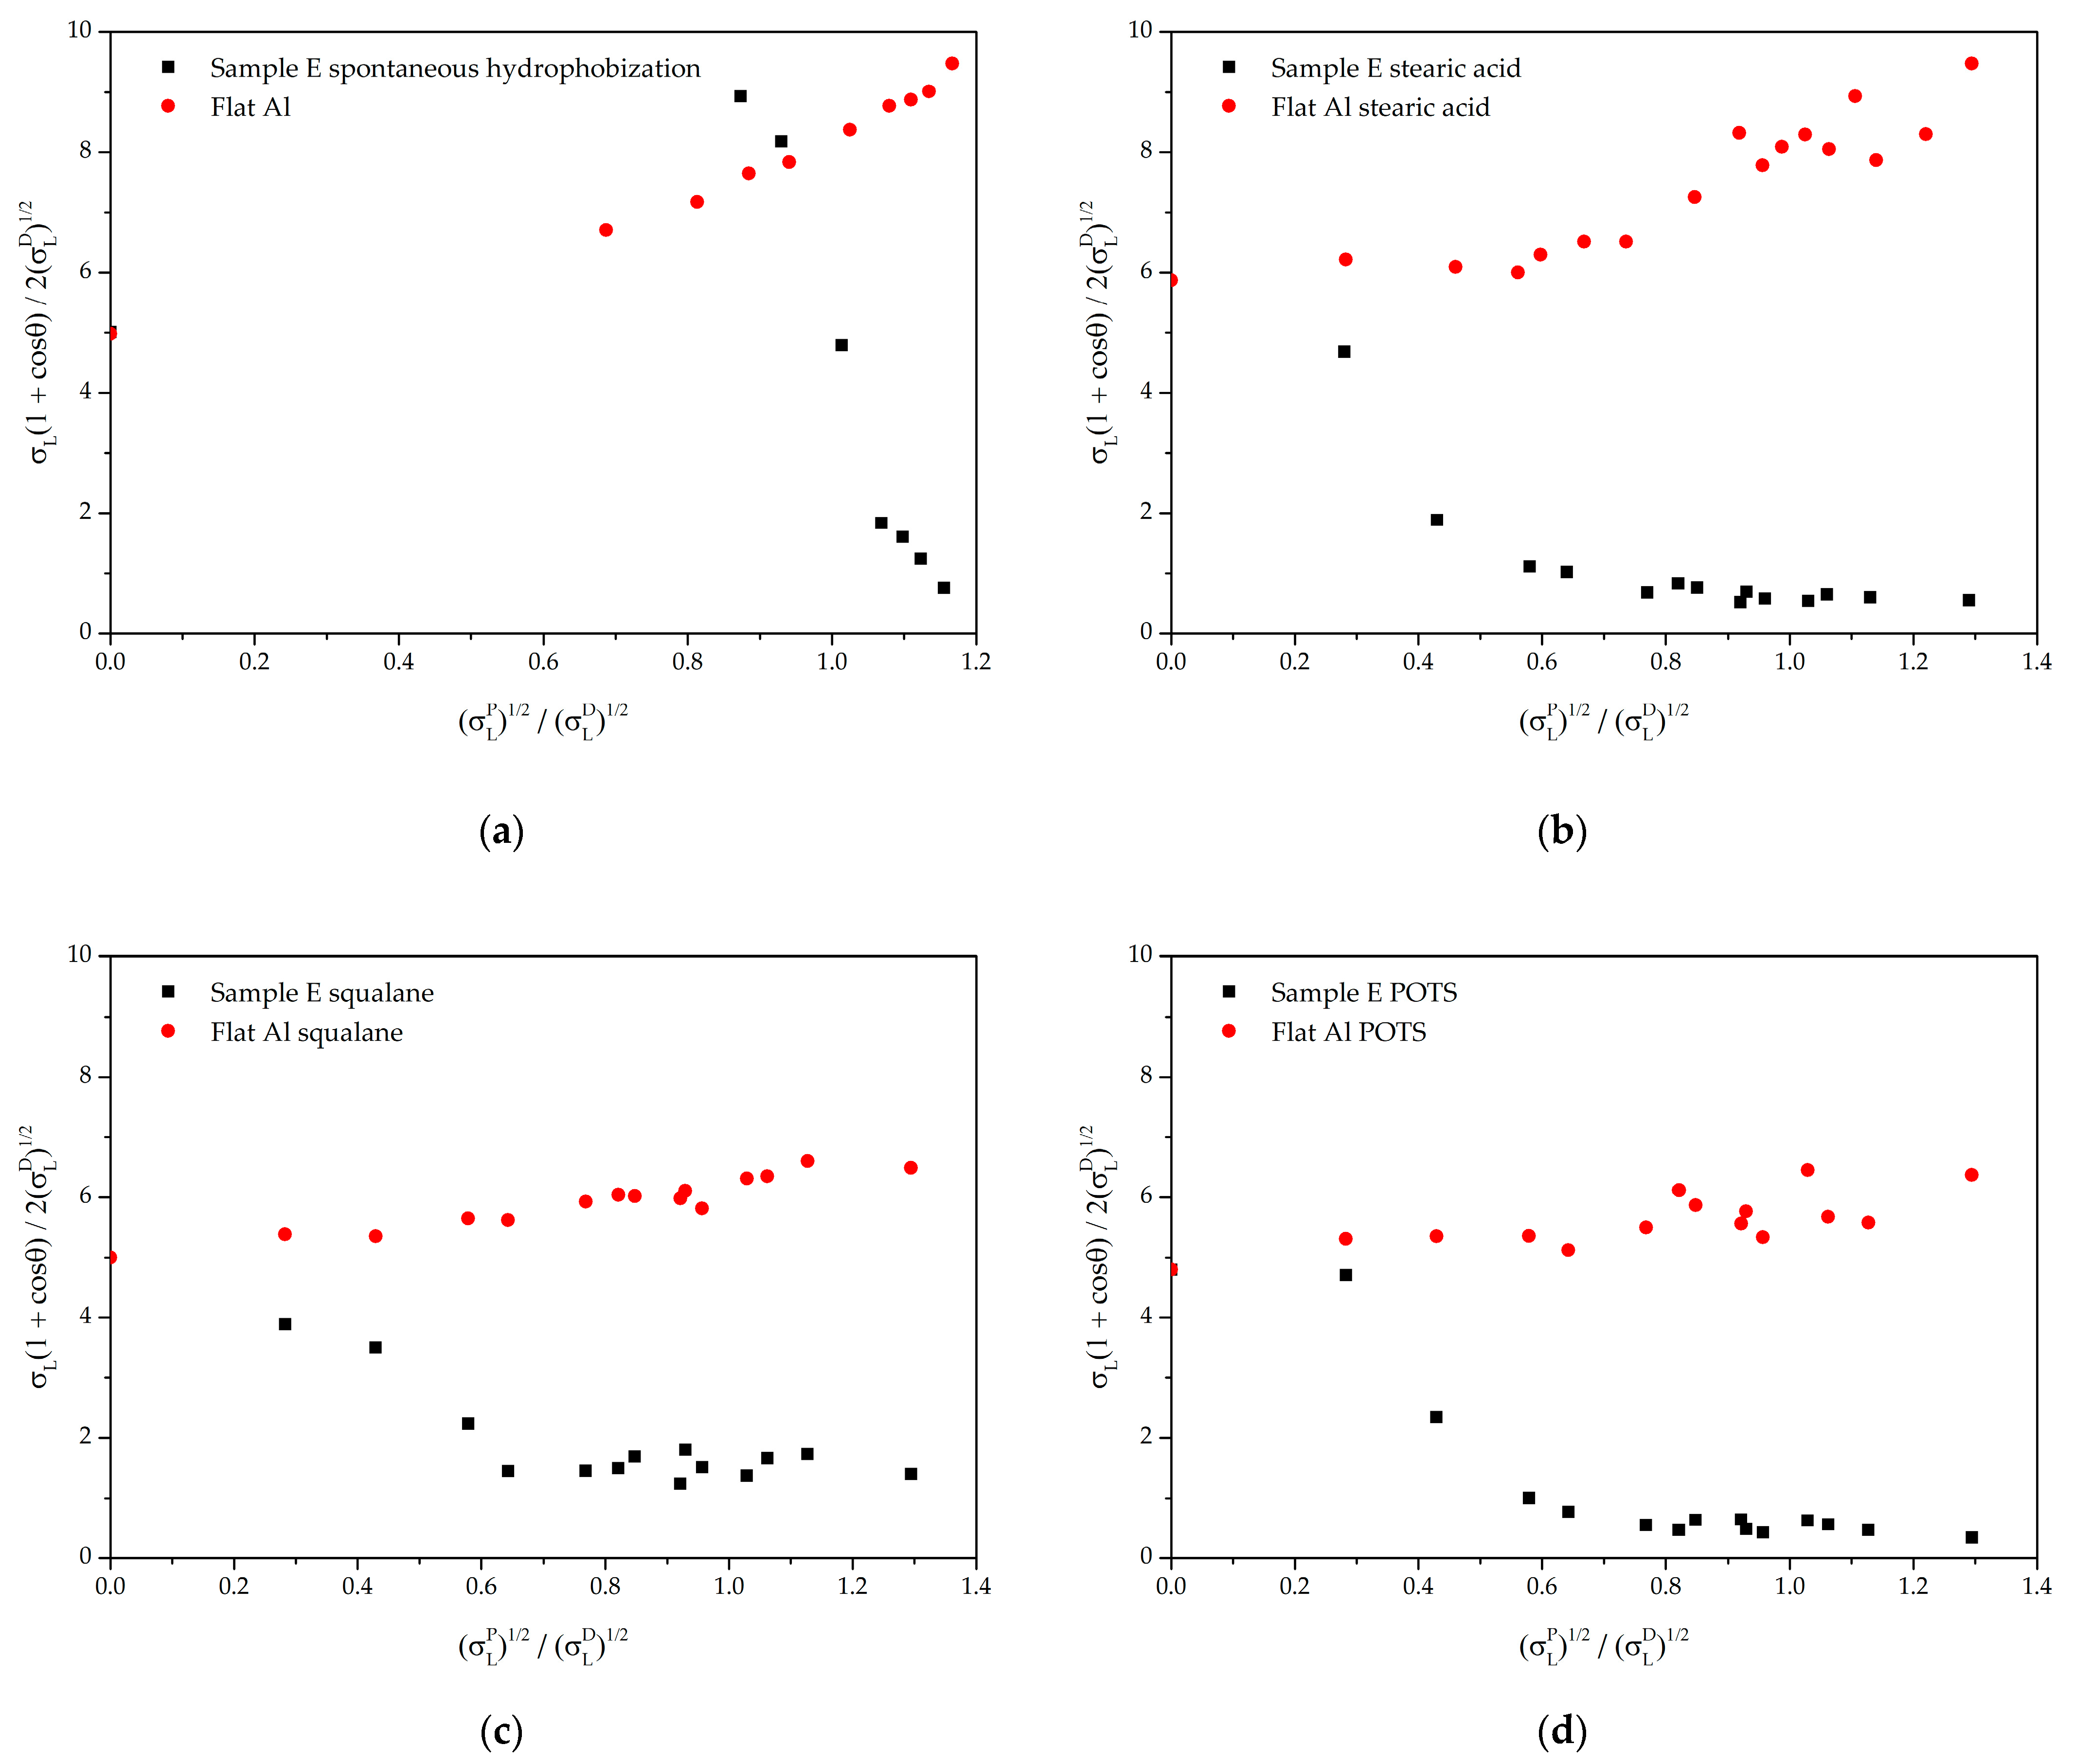
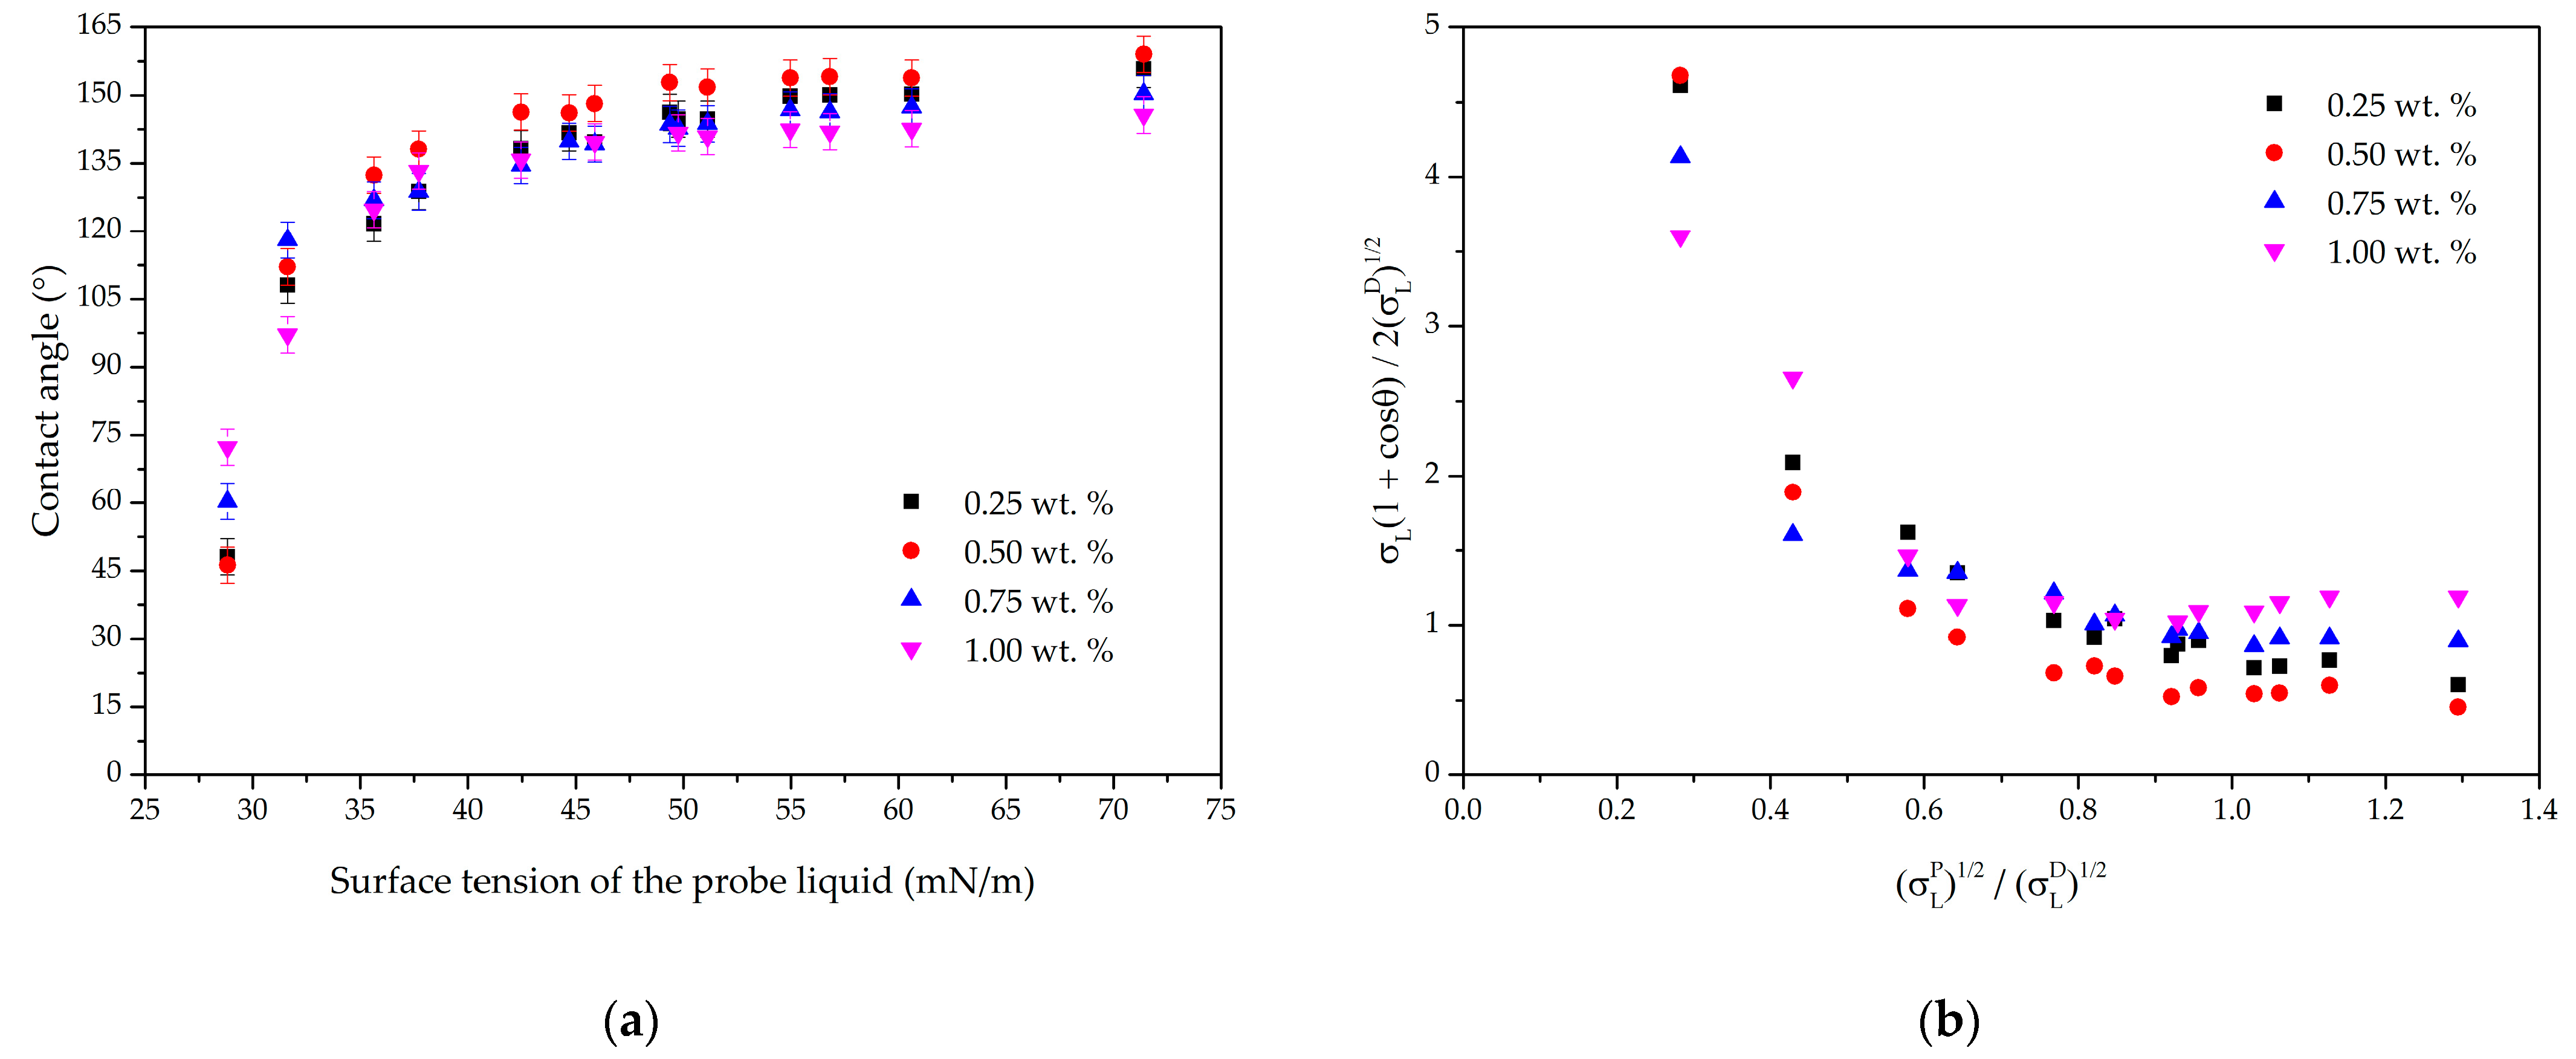
As seen in Figure 7, the sample surface after spontaneous hydrophobization has the highest value of σ L P (Table 5), which indicates its low resistance to the wetting transition, that occurs even with a slight decrease in the surface tension of the probe liquid. Its plateau is narrow, and it was assumed that it is reached at a point corresponding to water as a probe liquid.
On the contrary, samples with the same texture after chemical modification retain their liquid-repellent properties in a much wider range of surface tensions. Moreover, the treated samples can be ranked in order of widening the plateau: squalane—stearic acid—POTS, which can clearly be seen from a comparison of the respective values of σ L P (Table 5).
The parameter σ T S D / σ S D is sensitive both to the geometry of the texture and to the polarity of the hydrophobizer layer. Its high anomaly value is observed in the case of squalane. A possible reason for the latter is the accumulation of an excess of this modifier in the depressions of the texture, which significantly reduces its roughness.
To test this assumption, stearic acid, which proved to be an effective modifier in a thin layer, was applied to sample “E” from solutions with increasing concentration, assuming a corresponding increase in the thickness of the modifier layer. The lowest value of the parameter σ T S D / σ S D of 0.94 is achieved at a solution concentration of 0.5 wt.% (Figure 8) and increases with increasing concentration. This can be explained by the fact that, at lower concentrations (less than 0.5 wt.%), the modifier may not be sufficient to completely screen the surface while, at higher concentrations, it smoothed out the texture relief, demonstrating the same effect as with the case of squalane.
Thus, it can be concluded that the considered parameter σ T S D / σ S D depends, to a greater extent, on the geometric features of the surface than on its polarity. This parameter, as follows from Equation (4), is derived from the value of the contact angle and the value of the dispersed component of the surface energy of the modifier layer.
The position of σ L P is much more sensitive to the type of hydrophobic agent: surfaces treated with POTS and OCTEO turned out to be the most stable from this point of view. Stearic acid showed unexpectedly good stability along with silane modifiers. A surface treated with squalane showed reduced resistance to wetting by non-polar liquids. The spontaneous hydrophobized surface demonstrated the worst stability. This is consistent with the results of references [48,49], where the low resistance of such surfaces to environmental factors was confirmed, in particular, due to the rather small thickness of the modifier layer.

4. Conclusions

It has been shown that the Owens–Wendt method can be used to estimate the liquid-repellency of textured surfaces by mainly applying two significant parameters. The first one is σ T S D / σ S D , related to the area fraction of the liquid–solid interface in the Cassie state. The efficiency of the liquid-repellent texture increases as this parameter decreases. The second parameter is the minimum value of the polar component of the surface tension for the probe liquid σ L P , when the transition from the Cassie state to the Wenzel state begins. This parameter is most sensitive to the type of texture modifier, and it decreases as efficiency increases. The most efficient microtexture with a period of 60 µm, and a groove width of 45 µm, has been experimentally demonstrated. In this case, the formation of an artifact edge on the protrusion area increases the water repellency. POTS turned out to be the most effective liquid-repellent modifier, although stearic acid, promising in terms of cost and environmental friendliness, was only slightly inferior to it. Although spontaneous hydrophobization ensured the surface water contact angle up to 159°, the low stability of such textures compared to the studied modifiers hinders their practical application.

Author Contributions

Conceptualization, O.M.; methodology, D.B. and A.M.R.; validation, D.B. and O.M.; formal analysis, O.M.; investigation, O.M. and D.B.; resources, O.M., A.M.R. and E.V.; data curation, D.B. and Z.Y.; writing—original draft preparation, O.M. and D.B.; writing—review and editing, O.M., D.B. and A.M.R.; visualization, D.B.; supervision, O.M.; project administration, O.M. and A.M.R.; funding acquisition, O.M. and A.M.R. All authors have read and agreed to the published version of the manuscript.

Funding

This research was funded by the Research Council of Lithuania, grant no. S-LU-22-3 and by the Ministry of Education and Science of Ukraine, reg. no. 0122U002645.

Institutional Review Board Statement

Not applicable.

Informed Consent Statement

Not applicable.

Data Availability Statement

Not applicable.

Conflicts of Interest

The authors declare no conflict of interest.

References

  1. Si, Y.; Dong, Z.; Jiang, L. Bioinspired designs of superhydrophobic and superhydrophilic materials. ACS Cent. Sci. 2018, 4, 1102–1112. [Google Scholar] [CrossRef] [PubMed]
  2. Yong, J.; Yang, Q.; Guo, C.; Chen, F.; Hou, X. A review of femtosecond laser-structured superhydrophobic or underwater superoleophobic porous surfaces/materials for efficient oil/water separation. RSC Adv. 2019, 9, 12470–12495. [Google Scholar] [CrossRef]
  3. Long, J.; Fan, P.; Gong, D.; Jiang, D.; Zhang, H.; Li, L.; Zhong, M. Superhydrophobic surfaces fabricated by femtosecond laser with tunable water adhesion: From Lotus Leaf to Rose Petal. ACS Appl. Mater. Interfaces 2015, 7, 9858–9865. [Google Scholar] [CrossRef] [PubMed]
  4. Long, J.; Pan, L.; Fan, P.; Gong, D.; Jiang, D.; Zhang, H.; Li, L.; Zhong, M. Cassie-state stability of metallic superhydrophobic surfaces with various micro/nanostructures produced by a femtosecond laser. Langmuir 2016, 32, 1065–1072. [Google Scholar] [CrossRef] [PubMed]
  5. Myronyuk, O.; Dudko, V.; Baklan, D.; Melnyk, L. Study of structure influence on wear resistance of hierarchial superhydrophobic coatings. East.-Eur. J. Enterp. Technol. 2017, 3, 44–49. [Google Scholar] [CrossRef] [Green Version]
  6. Hooda, A.; Goyat, M.S.; Pandey, J.K.; Kumar, A.; Gupta, R. A review on Fundamentals, constraints and fabrication techniques of superhydrophobic coatings. Prog. Org. Coat. 2020, 142, 105557. [Google Scholar] [CrossRef]
  7. Somlyai-Sipos, L.; Baumli, P. Wettability of metals by water. Metals 2022, 12, 1274. [Google Scholar] [CrossRef]
  8. Milles, S.; Soldera, M.; Voisiat, B.; Lasagni, A.F. Fabrication of superhydrophobic and ice-repellent surfaces on pure aluminium using single and multiscaled periodic textures. Sci. Rep. 2019, 9, 13944. [Google Scholar] [CrossRef] [Green Version]
  9. Yang, Z.; Liu, X.; Tian, Y. Insights into the wettability transition of nanosecond laser ablated surface under ambient air exposure. J. Colloid Interface Sci. 2019, 533, 268–277. [Google Scholar] [CrossRef] [Green Version]
  10. Yang, C.W.; Hao, P.F.; He, F. Effect of upper contact line on sliding behavior of water droplet on superhydrophobic surface. Sci. Bull. 2009, 54, 727–731. [Google Scholar] [CrossRef] [Green Version]
  11. Jin, M.; Xing, Q.; Chen, Z. A review: Natural superhydrophobic surfaces and applications. J. Biomater. Nanobiotechnol. 2020, 11, 110–149. [Google Scholar] [CrossRef] [Green Version]
  12. Law, K.-Y. Water–surface interactions and definitions for hydrophilicity, hydrophobicity and Superhydrophobicity. Pure Appl. Chem. 2015, 87, 759–765. [Google Scholar] [CrossRef]
  13. Kariper, İ.A. Low-cost, high-efficiency, new generation material for fog harvesting fumed silica-doped polypropylene. NPJ Clean Water 2021, 4, 24. [Google Scholar] [CrossRef]
  14. Majhy, B.; Iqbal, R.; Sen, A.K. Facile fabrication and mechanistic understanding of a transparent reversible superhydrophobic–superhydrophilic surface. Sci. Rep. 2018, 8, 18018. [Google Scholar] [CrossRef] [Green Version]
  15. Etzler, F.M. Determination of the surface free energy of Solids. Rev. Adhes. Adhes. 2013, 1, 3–45. [Google Scholar] [CrossRef]
  16. Fox, H.W.; Zisman, W.A. The spreading of liquids on low energy surfaces. I. Polytetrafluoroethylene. J. Colloid Sci. 1950, 5, 514–531. [Google Scholar] [CrossRef]
  17. Owens, D.K.; Wendt, R.C. Estimation of the surface free energy of polymers. J. Appl. Polym. Sci. 1969, 13, 1741–1747. [Google Scholar] [CrossRef]
  18. Mantel, M.; Wightman, J.P. Influence of the surface chemistry on the wettability of Stainless Steel. Surf. Interface Anal. 1994, 21, 595–605. [Google Scholar] [CrossRef]
  19. Becker, S.; Merz, R.; Hasse, H.; Kopnarski, M. Solvent cleaning and wettability of technical steel and titanium surfaces. Adsorp. Sci. Technol. 2016, 34, 261–274. [Google Scholar] [CrossRef] [Green Version]
  20. Wang, X.; Fu, C.; Zhang, C.; Qiu, Z.; Wang, B. A comprehensive review of wetting transition mechanism on the surfaces of microstructures from theory and testing methods. Materials 2022, 15, 4747. [Google Scholar] [CrossRef]
  21. Murakami, D.; Jinnai, H.; Takahara, A. Wetting transition from the cassie–baxter state to the Wenzel State on textured polymer surfaces. Langmuir 2014, 30, 2061–2067. [Google Scholar] [CrossRef] [PubMed]
  22. Fan, P.; Pan, R.; Zhong, M. Ultrafast laser enabling hierarchical structures for versatile superhydrophobicity with enhanced Cassie–Baxter stability and durability. Langmuir 2019, 35, 16693–16711. [Google Scholar] [CrossRef]
  23. Ai, Y.; Yu, L.; Huang, Y.; Liu, X. The investigation of molten pool dynamic behaviors during the “∞” shaped oscillating laser welding of aluminum alloy. Int. J. Therm. Sci. 2022, 173, 107350. [Google Scholar] [CrossRef]
  24. Ta, V.D.; Dunn, A.; Wasley, T.J.; Li, J.; Kay, R.W.; Stringer, J.; Smith, P.J.; Esenturk, E.; Connaughton, C.; Shephard, J.D. Laser textured superhydrophobic surfaces and their applications for homogeneous spot deposition. Appl. Surf. Sci. 2016, 365, 153–159. [Google Scholar] [CrossRef] [Green Version]
  25. Chun, D.-M.; Ngo, C.-V.; Lee, K.-M. Fast fabrication of superhydrophobic metallic surface using nanosecond laser texturing and low-temperature annealing. CIRP Ann. 2016, 65, 519–522. [Google Scholar] [CrossRef]
  26. Zhang, L.; Tan, Z.; Zhang, C.; Tang, J.; Yao, C.; You, X.; Hao, B. Research on metal corrosion resistant bioinspired special wetting surface based on laser texturing technology: A Review. Micromachines 2022, 13, 1431. [Google Scholar] [CrossRef]
  27. Manoharan, K.; Bhattacharya, S. Superhydrophobic Surfaces Review: Functional application, fabrication techniques and limitations. J. Micromanuf. 2019, 2, 59–78. [Google Scholar] [CrossRef]
  28. Rasouli, S.; Rezaei, N.; Hamedi, H.; Zendehboudi, S.; Duan, X. Superhydrophobic and superoleophilic membranes for oil-water separation application: A comprehensive review. Mater. Des. 2021, 204, 109599. [Google Scholar] [CrossRef]
  29. Parvate, S.; Dixit, P.; Chattopadhyay, S. Superhydrophobic surfaces: Insights from theory and experiment. J. Phys. Chem. B 2020, 124, 1323–1360. [Google Scholar] [CrossRef] [Green Version]
  30. Zhao, X.; Li, Y.; Li, B.; Hu, T.; Yang, Y.; Li, L.; Zhang, J. Environmentally benign and durable superhydrophobic coatings based on SIO2 nanoparticles and silanes. J. Colloid Interface Sci. 2019, 542, 8–14. [Google Scholar] [CrossRef]
  31. Myronyuk, O.; Raks, V.A.; Baklan, D.; Vasyliev, G.; Vanagas, E.; Kurdil, N.; Sivolapov, P. Water repellent coatings with hierarchal structures obtained on anodized aluminum with femtosecond laser ablation. Appl. Nanosci. 2021, 12, 523–531. [Google Scholar] [CrossRef]
  32. Myronyuk, O.; Baklan, D.; Vasilyev, G.S.; Rodin, A.M.; Vanagas, E. Wetting patterns of liquid-repellent femtosecond laser textured aluminum surfaces. Coatings 2022, 12, 1852. [Google Scholar] [CrossRef]
  33. Yokoi, N.; Manabe, K.; Tenjimbayashi, M.; Shiratori, S. Optically transparent superhydrophobic surfaces with enhanced mechanical abrasion resistance enabled by mesh structure. ACS Appl. Mater. Interfaces 2015, 7, 4809–4816. [Google Scholar] [CrossRef] [PubMed]
  34. Çakır, M. Investigation of Coating Performance of UV-curable hybrid polymers containing 1H,1H,2H,2H-perfluorooctyltriethoxysilane coated on aluminum substrates. Coatings 2017, 7, 37. [Google Scholar] [CrossRef] [Green Version]
  35. Salazar-Hernández, C.; Salazar-Hernández, M.; Mendoza-Miranda, J.M.; Miranda-Avilés, R.; Elorza-Rodríguez, E.; Carrera-Rodríguez, R.; Puy-Alquiza, M.J. Organic modified silica obtained from DBTL polycondensation catalyst for anticorrosive coating. J. Solgel Sci. Technol. 2018, 87, 299–309. [Google Scholar] [CrossRef]
  36. Zhang, B.; Zeng, Y.; Wang, J.; Sun, Y.; Zhang, J.; Li, Y. Superamphiphobic aluminum alloy with low sliding angles and acid-alkali liquids repellency. Mater. Des. 2020, 188, 108479. [Google Scholar] [CrossRef]
  37. Zhang, Z.; Wang, W.; Korpacz, A.N.; Dufour, C.R.; Weiland, Z.J.; Lambert, C.R.; Timko, M.T. Binary liquid mixture contact-angle measurements for precise estimation of surface free energy. Langmuir 2019, 35, 12317–12325. [Google Scholar] [CrossRef]
  38. Kaelble, D.H. Dispersion-polar surface tension properties of organic solids. J. Adhes. 1970, 2, 66–81. [Google Scholar] [CrossRef]
  39. Park, I.W.; Ribe, J.M.; Fernandino, M.; Dorao, C.A. The Criterion of the Cassie–Baxter and Wenzel Wetting Modes and the Effect of Elastic Substrates on It. Adv. Mater. Interfaces 2023, 10, 2202439. [Google Scholar] [CrossRef]
  40. Drelich, J.; Marmur, A. Physics and applications of superhydrophobic and superhydrophilic surfaces and coatings. Surf. Innov. 2014, 2, 211–227. [Google Scholar] [CrossRef]
  41. Eriksson, M.; Swerin, A. Forces at superhydrophobic and superamphiphobic surfaces. Curr. Opin. Colloid Interface Sci. 2020, 47, 46–57. [Google Scholar] [CrossRef]
  42. Fang, R.; Zhang, X.; Zheng, J.; Pan, Z.; Yang, C.; Deng, L.; Li, R.; Lai, C.; Yan, W.; Maisotsenko, V.S.; et al. Super-wicking functionality of femtosecond laser textured aluminum at high temperatures. Nanomaterials 2021, 11, 2964. [Google Scholar] [CrossRef] [PubMed]
  43. Saito, M.; Yabe, A. Dispersion and polar force components of surface tension of oily soils. Text. Res. J. 1984, 54, 18–22. [Google Scholar] [CrossRef]
  44. Gros, A.T.; Feuge, R.O. Surface and interfacial tensions, viscosities, and other physical properties of some N-aliphatic acids and their methyl and ethyl esters. J. Am. Oil Chem. Soc. 1952, 29, 313–317. [Google Scholar] [CrossRef]
  45. Wei, S.; Liu, Y.; Kou, X.; Huang, S.; Chen, G.; Xu, L.; Tong, Q.; Zhu, F.; Xu, J.; Ouyang, G. Energy-efficient construction of thermally stable superhydrophobic nanoscale stacked lamellae based solid-phase microextraction coating for the determination of non-polar compounds. Anal. Chim. Acta 2019, 1092, 17–23. [Google Scholar] [CrossRef] [PubMed]
  46. Lei, H.; Xiong, M.; Xiao, J.; Zheng, L.; Zhu, Y.; Li, X.; Zhuang, Q.; Han, Z. Fluorine-free low surface energy organic coating for anti-stain applications. Prog. Org. Coat. 2017, 103, 182–192. [Google Scholar] [CrossRef]
  47. Jiang, J.; Shen, Y.; Wang, Z.; Tao, J.; Liu, W.; Chen, H.; Liu, S.; Xie, X.; Zeng, C. Anti/de-icing performance of the one-step electrodeposited superhydrophobic surfaces: Role of surface polarity regulated by hydrocarbon radical length. J. Chem. Eng. 2022, 431, 133276. [Google Scholar] [CrossRef]
  48. Li, F.; Feng, G.; Yang, X.; Lu, C.; Ma, G.; Li, X.; Xue, W.; Sun, H. Tunable wettability pattern transfer photothermally achieved on zinc with microholes fabricated by femtosecond laser. Micromachines 2021, 12, 547. [Google Scholar] [CrossRef]
  49. Wang, R.; Kido, M.; Nakanishi, S.; Okabe, T. Adhesion of atmospheric micro-contaminants on SUS304 Steel and removal by UV illumination. Mater. Trans. 2009, 50, 1798–1804. [Google Scholar] [CrossRef] [Green Version]
Figure 1. Sample surfaces examined under a scanning electron microscope (SEM, 20 kV, SE detector) after laser processing: (a) with microtexture and (b) with nanotexture.
Coatings 13 01104 g001
Figure 2. Wetting parameters of a blank alumina surface, microtexture and nanotexture: (a) contact angles and (b) Owens–Wendt plots.
Coatings 13 01104 g002
Figure 3. (a) Texture drawing for sample E and (b) profilometer measurements of samples “B”, “C”, and “E”.
Coatings 13 01104 g003
Figure 4. Periodic textures on samples examined under a scanning electron microscope (SEM, 10 kV, SE detector): (a) demonstrating a microrelief and (b) showing the submicron level.
Coatings 13 01104 g004
Figure 5. Wetting properties for linear textures on samples “B”, “C”, “E” and blank aluminum surfaces treated with stearic acid: (a) contact angles and (b) Owens–Wendt plots.
Coatings 13 01104 g005
Figure 6. Texture scan areas on sample “E” using EDS analysis.
Coatings 13 01104 g006
Figure 7. Owens–Wendt plots for sample “E” (a) with spontaneous hydrophobization and modified: (b) with stearic acid; (c) with squalane; and (d) with POTS.
Coatings 13 01104 g007
Figure 8. Wetting parameters for sample “E” treated with a different amount of stearic acid: (a) contact angles and (b) Owens–Wendt plot.
Coatings 13 01104 g008
Table 1. Characteristic parameters of micro- and nanotextures.
Sample σ T S D σ S D σ T S D / σ S D , % Critical   σ L P
M + OCTEO1.0018.05.569.96
N + OCTEO0.1718.00.949.96
Table 2. Sample texture parameters.
SampleMicrotexture
Bperiod 45 µmgroove width 20 µm
Cperiod 57 µmgroove width 20 µm
Eperiod 60 µmgroove width 45 µm
Table 3. Characteristic wetting parameters of stearic acid treated linear microtextures.
Sample (Figure) σ T S D σ S D σ T S D / σ S D , % Critical   σ L P
B + Stearic acid (Figure 5)1.8225.37.199.3
C + Stearic acid (Figure 5)1.1625.34.589.3
E + Stearic acid (Figure 5)0.2425.30.949.3
Table 4. Elemental composition (wt.%) of the surface in the scanning area according to the analysis of energy dispersive spectroscopy (EDS).
AreaCOMgAl
111.408.043.4177.15
213.3238.906.0441.74
310.126.583.2280.08
414.9328.274.5252.28
Table 5. Characteristic wetting parameters of linear microtextures.
Sample (Figure) σ T S D σ S D σ T S D / σ S D , % Critical   σ L P
E + 2 months (Figure 7a)0.5822.72.5630.6
E + Stearic acid (Figure 7b)0.2425.30.949.3
E + Squalane (Figure 7c)5.6124.422.911.0
E + POTS (Figure 7d)0.1121.00.528.0
Disclaimer/Publisher’s Note: The statements, opinions and data contained in all publications are solely those of the individual author(s) and contributor(s) and not of MDPI and/or the editor(s). MDPI and/or the editor(s) disclaim responsibility for any injury to people or property resulting from any ideas, methods, instructions or products referred to in the content.