Article

An Investigation of the Dynamic Curing Behavior and Micro-Mechanism of a Super-Tough Resin for Steel Bridge Pavements

1
School of Transportation, Southeast University, Nanjing 211189, China
2
China Railway 19th Bureau Group No. 3 Engineering Co., Ltd., Shenyang 110136, China
*
Authors to whom correspondence should be addressed.
Coatings 2023, 13(9), 1567; https://doi.org/10.3390/coatings13091567
Submission received: 2 August 2023 / Revised: 30 August 2023 / Accepted: 5 September 2023 / Published: 7 September 2023
(This article belongs to the Special Issue Surface Engineering and Mechanical Properties of Building Materials)

Abstract

:
To overcome challenging service conditions, a groundbreaking thermoset, “Super-Tough Resin” (STR), has been specifically designed for steel bridge deck paving. Currently, investigations of paving thermosets mainly focus on cured materials. Detailed investigations of the curing process and its impact on the evolving properties of STR are lacking. Therefore, this study aims to explore the curing kinetics and the performance evolution of STR. Specifically, spectroscopy test, time sweep, linear viscoelastic region, and weight loss tests were conducted. Our results show that the curing degrees increase significantly with the curing durations and temperatures at the initial stage. When cured for 10 h, the curing degrees at four temperatures all exceed 80%. Then, a kinetic model with an nth-order of 1.551 was established. Upon increasing the temperature from 35 to 80 °C, the gel point time decreases from 480 to 189 min but the corresponding curing degree remains constant at 75.73%. When curing time is increased from 2.5 to 4 h, the linear viscoelastic regions decrease from 20% to 3%. Finally, after 400 h, the weight losses of STR at 35 and 80 °C are about 8% and 20%, respectively. These outcomes are beneficial to understanding the dynamic curing behaviors of STR and similar thermosets.

1. Introduction

Compared with concrete bridges, steel bridges demonstrate superior advantages, including low self-weight, good prefabrication, favorable mechanical performance, and excellent bearing capacity [1,2]. Consequently, steel bridges are extensively constructed to connect two separated regions with a considerably long span. Typically, to provide a flat driving surface for vehicles, a deck pavement system is constructed on the steel bridge’s deck plate [3,4]. It should be noted that the service environment of a steel bridge deck pavement is significantly divergent from the concrete deck pavement and subgrade pavement [5,6]. Specifically, under the integrated influences of traffic vehicles and wind load, the steel bridge may generate relatively significant deformation and vibration. In addition, the comparatively high thermal conductivity of steel plates may increase the service temperature of the deck pavement. As a temperature-sensitive material, a traditional asphaltic pavement is prone to melting at high temperatures [7]. Hence, under vehicle loading, rutting distress may emerge on the steel deck pavement [2].
It is well acknowledged that rutting distress is primarily attributed to the viscoelastic nature of the asphalt binder [8]. Therefore, scholars are devoted to improving asphalt binder temperature stability and performance by altering the viscoelastic instinct by coupling versatile polymers [9], such as styrene butadiene rubber (SBR) latex [8] and the styrene-butadiene-styrene (SBS) copolymer [10,11]. Among these polymers, the thermosetting polymer epoxy resin was developed in 1939 [12]. Due to its great mechanical performance, superior corrosion resistance, and thermal stability, epoxy resin is extensively utilized in the fields of civil engineering, coatings, adhesives, structural composites, and electrical elements [13]. Epoxy resin was first utilized together with asphalt binder in pavement construction in the 1950s to overcome the challenge of jest blast erosion of airplanes on the pavement [14]. Afterward, epoxy resin asphalt or epoxy asphalt (EA) was used for demanding projects, such as tunnel pavements, steel bridge deck pavements, and intersection pavements [15,16,17].
EA is fabricated by mechanically mixing the epoxy resin’s main agent, its curing agent, and base asphalt. Upon mixing, the main agent spontaneously reacts with the curing agent and forms a three-dimensional thermoset network. After the curing process, the asphalt is distributed as spheres in the epoxy resin spatial network [18]. The thermoset network endows the asphalt with great temperature stability [7]. Hence, the performance of the EA is highly dominated by the thermosetting epoxy resin. Apart from EA, currently, some thermosetting materials are also being developed as binders for steel bridge deck paving, such as the polyurethane (PU) [11] and super-tough resin (STR) [7] studied in this paper. Similar to EA, the strength of the thermosetting polymers is gradually formed along with the curing reaction process [17]. Typically, the curing process, which is also known as polymerization, includes the formation, branching, and crosslinking of polymeric chains [19], as shown in Figure 1 [20]. Initially, individual polymeric chains are generated in the form of linear or branched shapes and the molecular weight demonstrates an increasing trend. As the curing reaction continues, the linear chains may further branch and transform into branched chains. The pronounced branched chains may eventually lead to the gelation of thermosets. At the point of gelation or gel point, the thermoset converts from the original viscous liquid to a viscoelastic solid and the molecular weight tends to be infinite [12,19,21]. Afterward, the curing reaction proceeds but is restricted due to the low mobility of polymeric chains. Consequently, the polymerization may transform from a chemical-controlled reaction to a diffusion-controlled reaction after the gel point [12,22].
As reviewed above, the polymerization of the thermoset is a considerably complex process that involves chemical component variation and mechanical performance evolution. It is well acknowledged that there is no uniform standard for thermoset curing characterization. Typically, the mechanical or chemical parameters varying with the curing process can be monitored, and then, adopted to depict the curing degree and curing reaction rate of thermosets. Consequently, the methods for characterizing the curing reaction cam be generally divided into two categories [23,24]: (1) direct methods, which monitor the variation in reactant concentration, such as spectroscopy techniques, and (2) indirect methods, which characterize the evolution of thermosets’ mechanical properties, such as thermal and rheological techniques. By monitoring the curing degree-related parameters, the curing degree and curing reaction rate can be determined. Finally, suitable curing kinetic models can be established to reveal the curing process of thermosets and therefore determine the appropriate manufacturing procedures.
Currently, in road engineering, previous studies [25,26] mainly emphasize the mechanical and rheological performance of the cured polymer binders and their mixture for paving. The high-temperature stability, low-temperature flexibility, and intermediate-temperature fatigue resistance of paving binders and their mixture have been extensively studied [27,28]. In addition, some efforts have been made to investigate the curing kinetics of paving thermosets using thermal methods [15,29] and some studies have monitored the curing process using the Fourier Transform Infrared (FTIR) method [14,30]. However, the curing process investigation of paving thermosets is insufficient and rough. To our knowledge, there have been a few research studies that investigate curing kinetics via direct methods. In addition, studies on the mechanical and rheological performance evolution of thermosetting polymers for paving in pavement engineering can hardly be found in the literature. Consequently, the strength evolution of thermosetting pavements, such as epoxy asphalt concrete, is ambiguous and the opening time for traffic is typically determined using an empirical approach [31,32]. Therefore, it is essential to characterize the dynamic curing behaviors and understand the micro-mechanism of paving thermosets.
This study is organized as follows: Section 2 introduces the objectives; Section 3 presents the materials, sample fabrications, and methods; Section 4 reveals the results, discussion, and implications of the tests; and Section 5 concludes the main findings of this study.

2. Objectives

Considering the lack of research on paving thermosets’ dynamic curing behaviors, this study aims to depict the chemical, rheological, and mechanical performance evolution of a novel paving binder, STR, which demonstrates better fatigue resistance and low-temperature toughness and shows promise as an alternative to EA for steel bridge deck paving. This study attempts to establish the curing kinetics via the FTIR spectroscopy test and characterize the curing-dependent rheological and weight loss properties of the thermoset. Specifically, the STR was cured at different temperatures with varying intervals and the evolution of the STR characteristic peaks were detected via FTIR test. Then, a suitable kinetic model was selected and established for STR. Afterward, the curing-dependent rheological properties, including the gel point and linear viscoelastic (LVE) region of STR, were obtained using rheology tests. Finally, the curing-induced weight loss of STR was monitored and an appropriate model was established to predict the weight loss of STR.
The results are beneficial for understanding the dynamic curing process of STR. Practically, the curing kinetic model and rheological property evolution can help to determine the construction parameters, such as the allowable duration and compaction time. In addition, the curing schemes in field conditions can be determined. By combining the weight loss characteristics, the potential curing shrinkage of super-tough resin concrete (STRC) can be evaluated. Finally, the curing characteristics and cured performance can be combined to better estimate the applicability of potential paving thermosets.

3. Materials and Methods

In this study, STR was purchased from a local supplier. STR is manufactured by mixing the main agent with the curing agent with a weight ratio of 1:1. The main properties of the two components are listed in Table 1.

3.1. FTIR Test

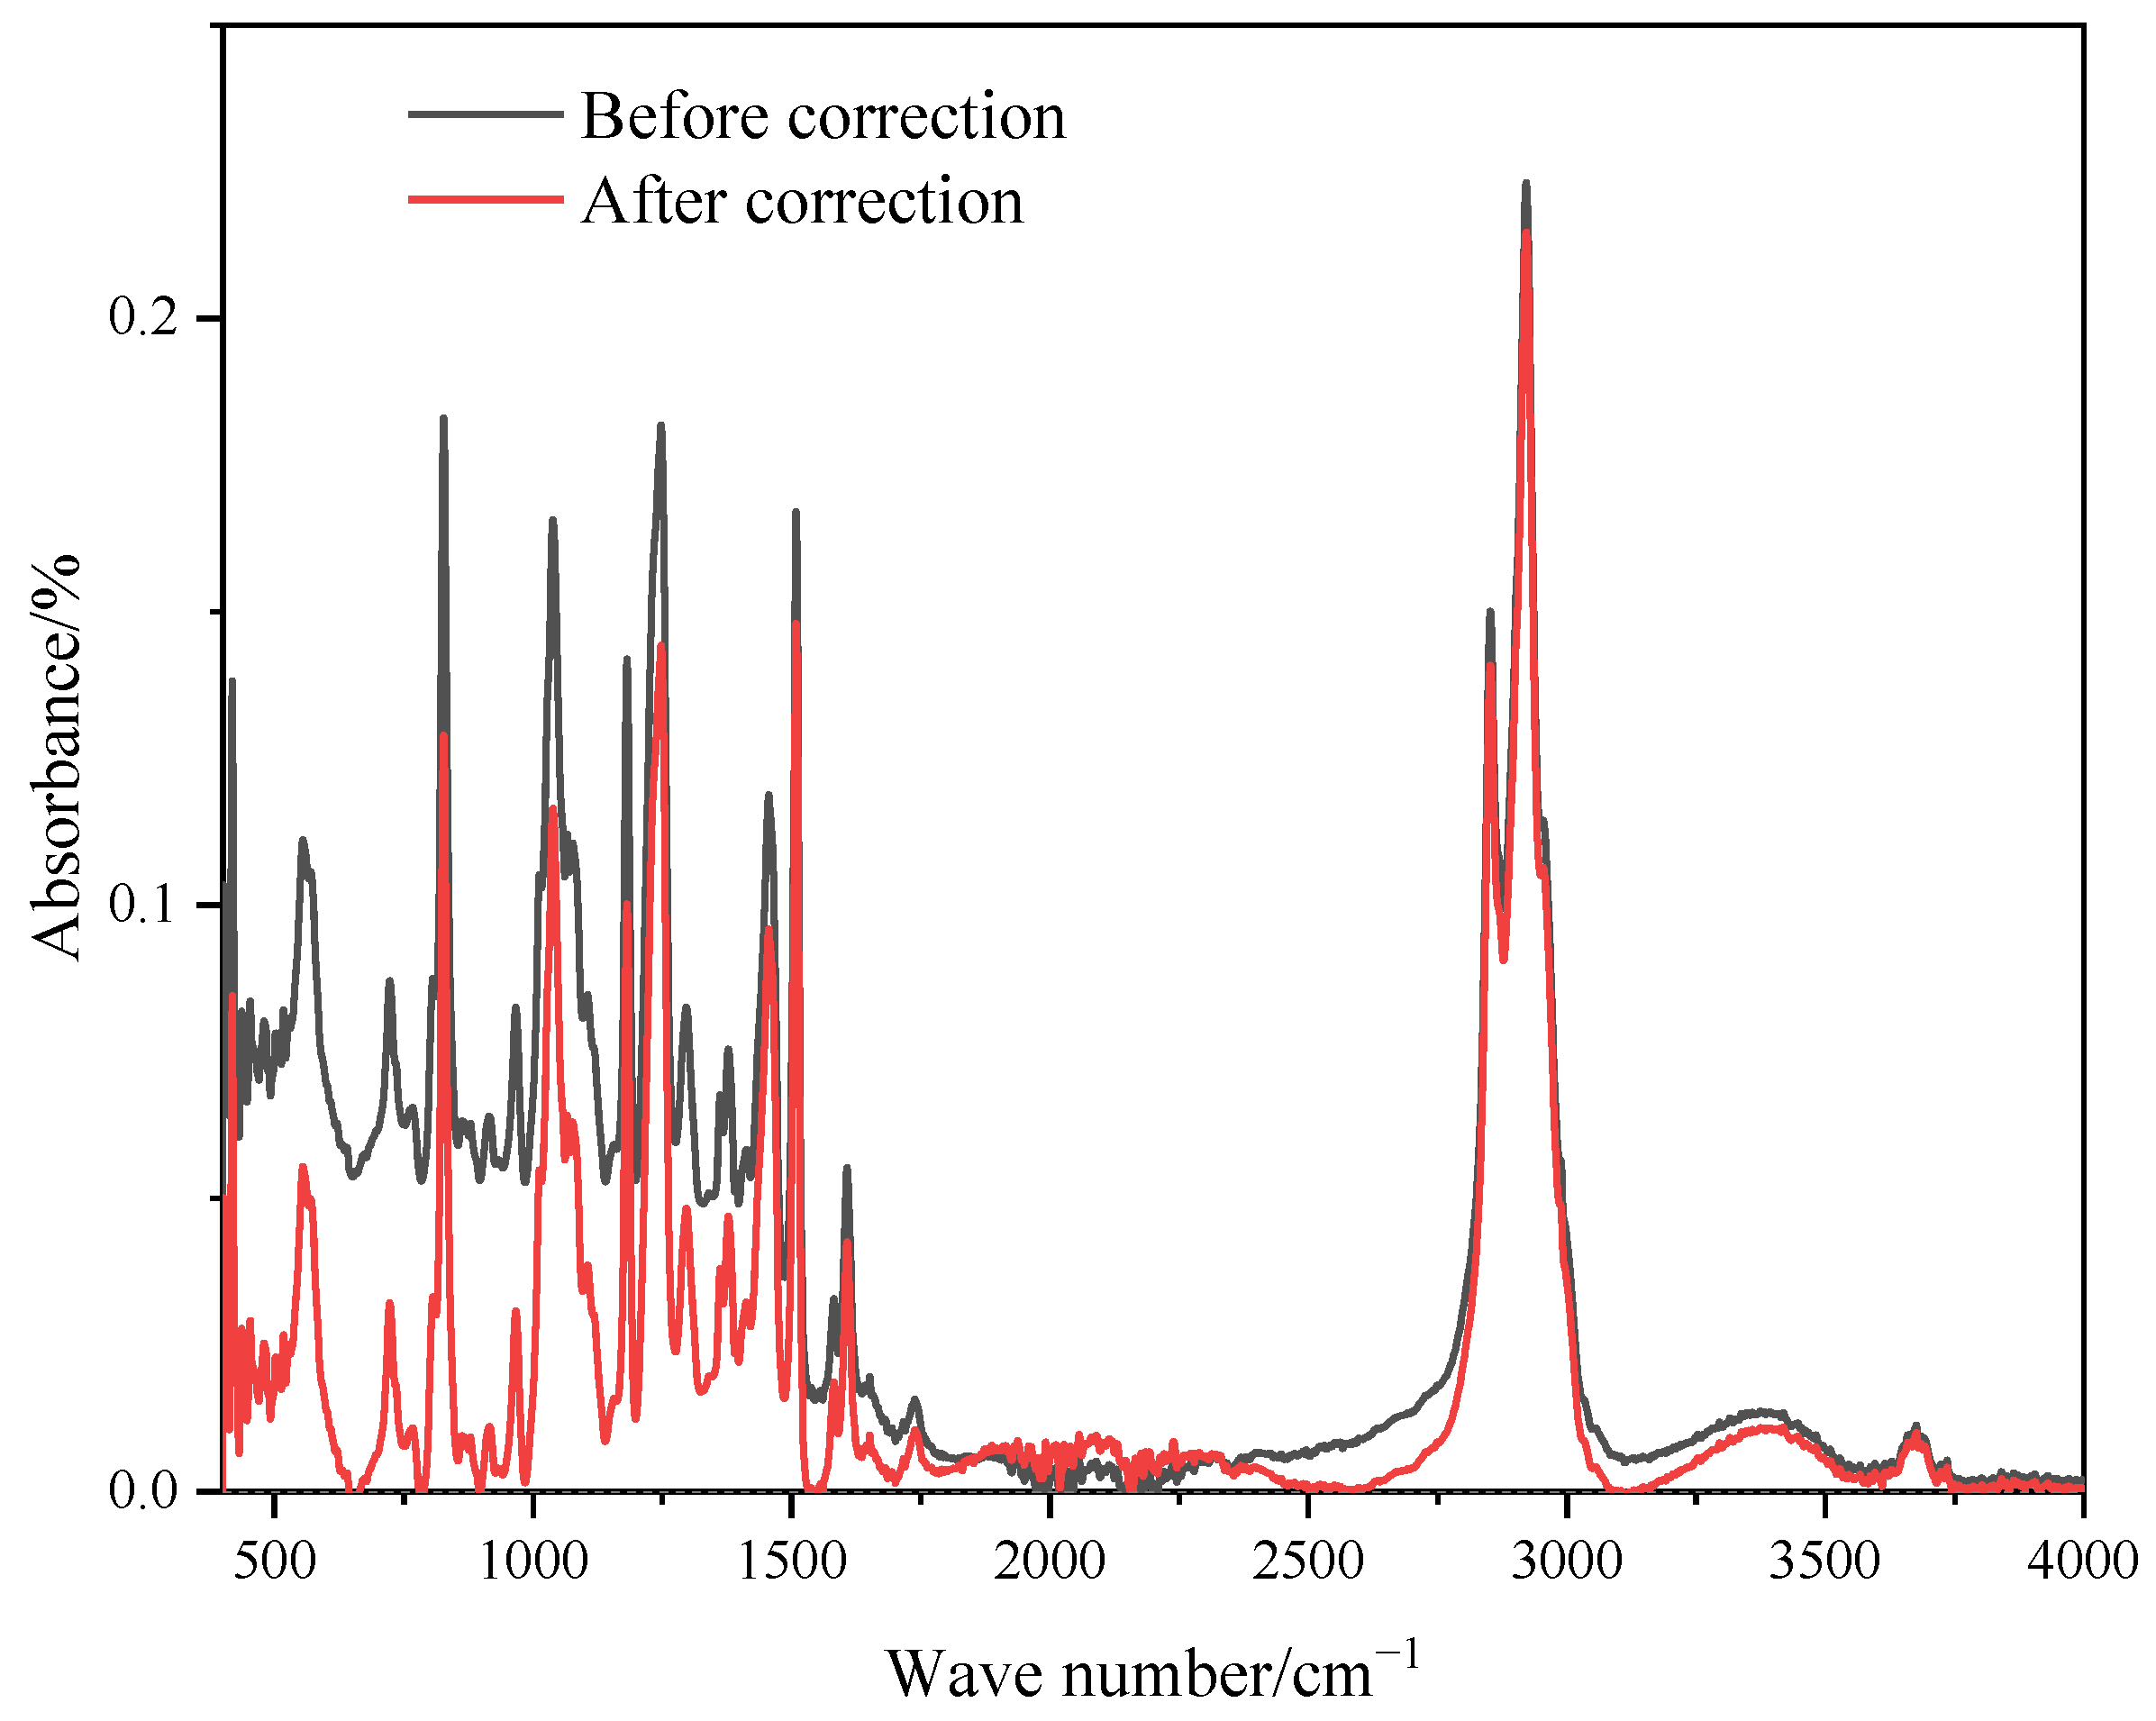
The FTIR test is capable of being used to monitor the variation in characteristic bands [33] in thermosets and therefore understand the curing process. Studies have also confirmed the comparability of the kinetics established via FTIR to other methods [34,35,36]. In this study, a Nicolet iS10 infrared spectrometer in attenuated total absorbance mode from the Thermo Scientific Corporation (Shanghai, China) was utilized to monitor the curing process. The scanning range was from 400 to 4000 cm−1 with a spectral resolution of 4 cm−1. Before calculating the characteristic peak areas, baseline corrections were conducted, and the spectra after baseline correction are demonstrated in Figure 2.

3.2. Rheological Tests

In this study, rheological tests, including the time sweep test and LVE region test, were conducted using an Anton Paar MCR102 dynamic shear rheometer (DSR, Anton Paar (Shanghai) Trading Co., LTD, Shanghai, China). Separated by the gel point, the STR binder may exhibit varying statuses and stress-strain responses: below the gel point, the STR binder can be regarded as a viscous liquid; above the gel point, the STR binder turns into a viscoelastic solid. Consequently, the rheological test protocols should be adjusted according to the solid–liquid states of the STR binder.

3.2.1. Sample Preparation

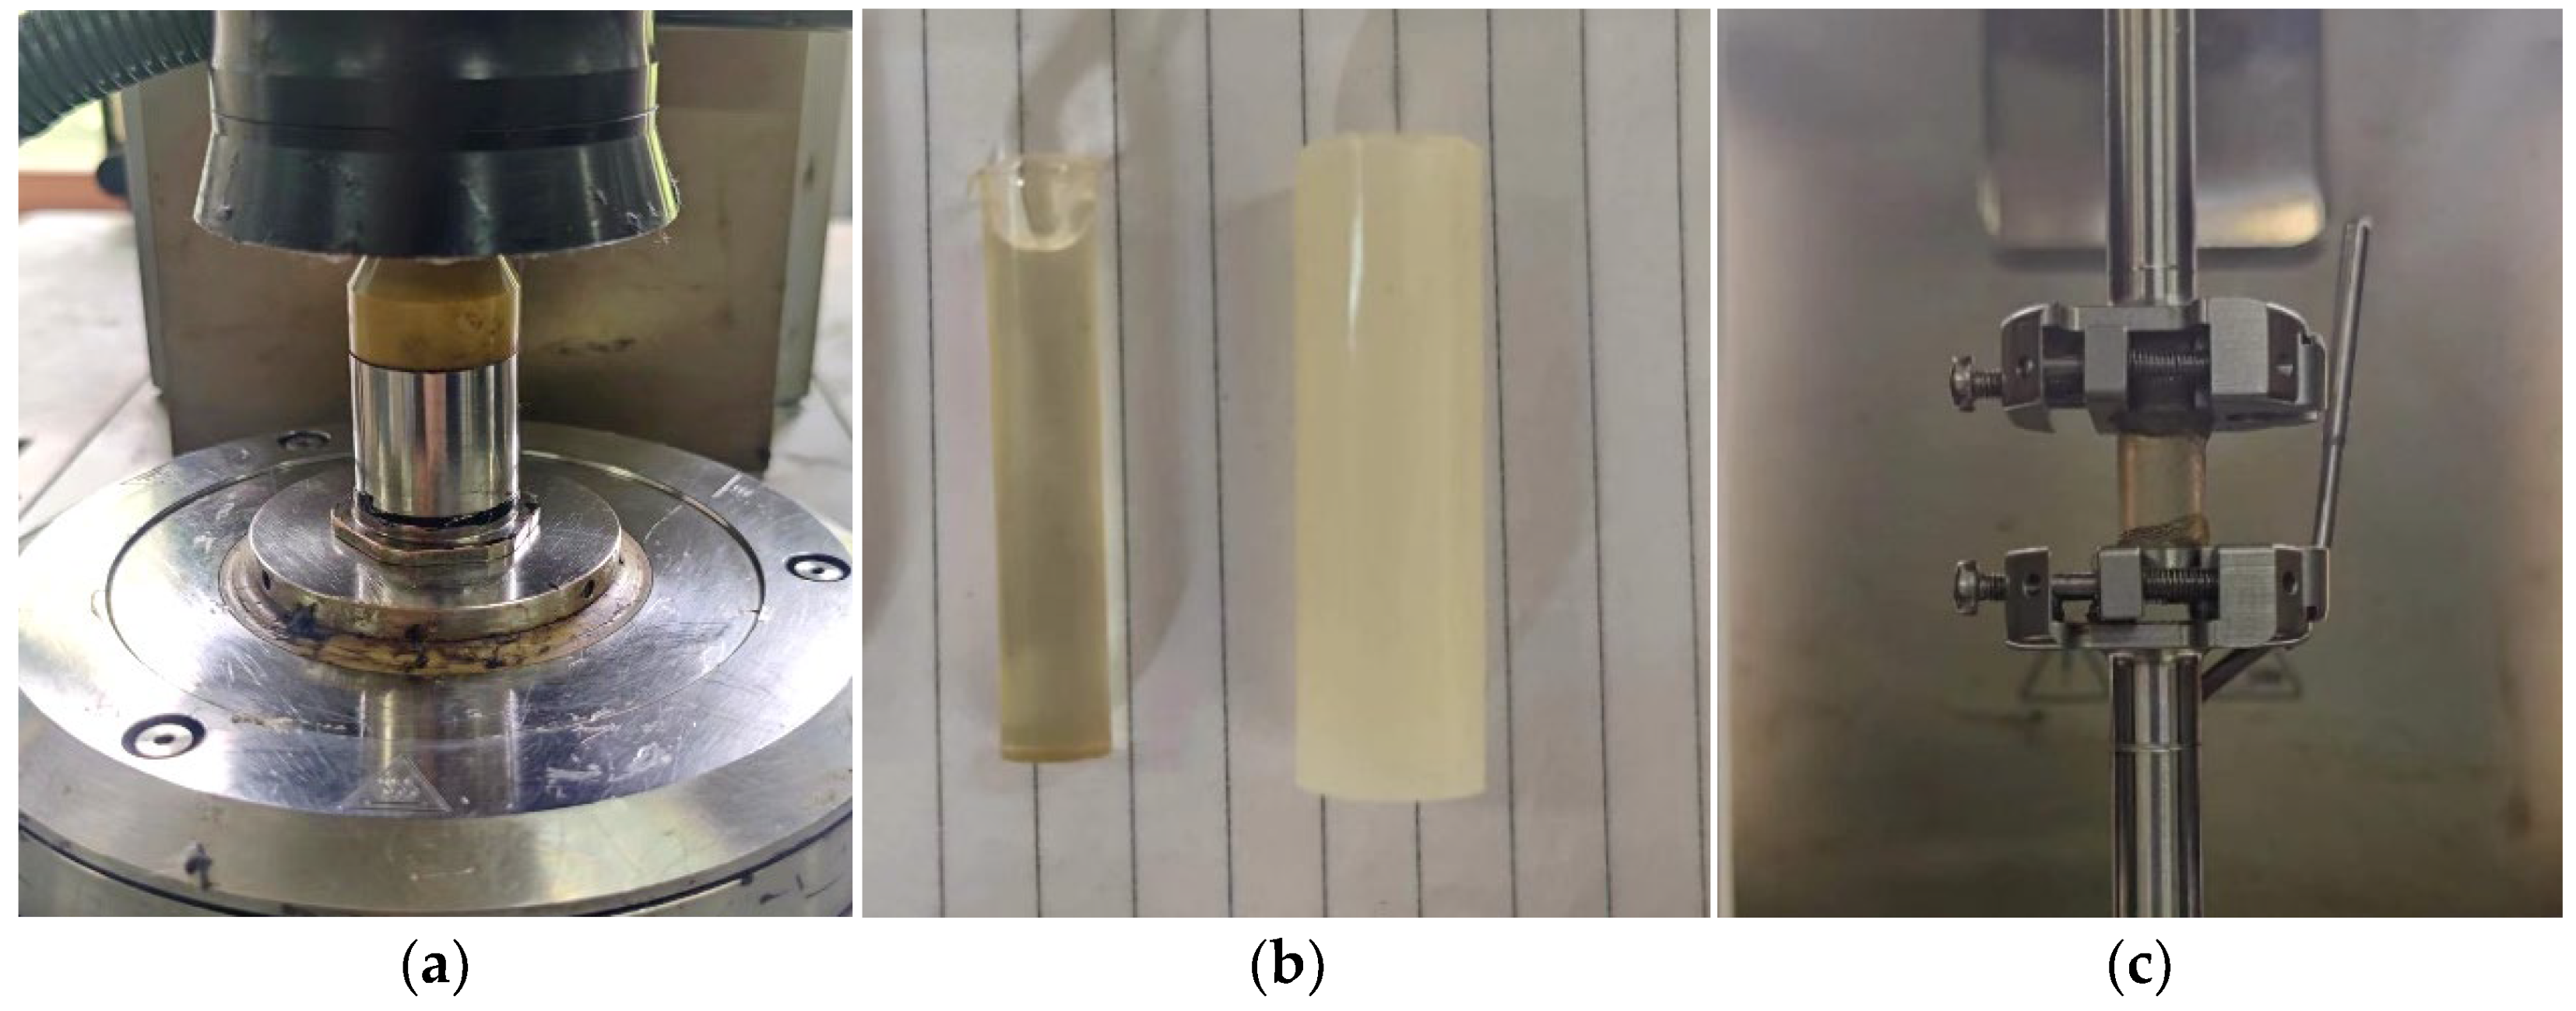
During the curing process, the STR sample may transform from a viscous liquid to a viscoelastic solid. For the viscous liquid, a traditional parallel plate can be utilized for the rheological tests, as shown in Figure 3a. However, after the gel point, a thermosetting three-dimensional network gradually formed, which is irreversible. Therefore, the viscoelastic solid STR cannot be remelted and reshaped like the asphaltic binder [7]. To characterize the rheological properties of the solid STR, a solid torsion bar fixture was adopted. The solid fixture requires the samples to be tall cylinders, with three fixed diameters: 8, 11.5, and 15 mm. STR demonstrates a relatively high shear modulus at low temperatures. Considering the torque limitation of the DSR equipment, the STR sample was fabricated with a diameter of 8 mm.
To prepare such a sample, the homogenous STR mixture was poured into a cylindrical silicone tube with an inner diameter of 8 mm, as shown in Figure 3b. After the designed curing process, the STR sample was extracted and truncated with a height of 20 mm. Then, steel rings were glued to both ends of the STR cylinder. Finally, the STR sample was clamped on the fixture for the following tests, as shown in Figure 3c.

3.2.2. Time Sweep Test

A time sweep test was conducted to investigate the shear modulus evolution of STR during the curing process and, consequently, determine the curing duration corresponding to the gel point at varying curing temperatures. In this study, the time sweep test mainly focused on the modulus evolution near the gel point rather than the whole curing process. At the gel point, the three-dimensional network of the STR initiates but can hardly be considered solid yet. Hence, a parallel plate with a diameter of 25 mm was utilized to conduct the time sweep test of STR. The gap of the parallel plate was 1 mm. The time sweep test was conducted at 35, 50, 65, and 80 °C. During the test, the shear strain was kept constant at 1% with a loading frequency of 1 Hz.

3.2.3. Linear Viscoelastic (LVE) Region Test

Based on existing studies, the stress-strain response of a viscoelastic material may vary depending on the loading strain or stress amplitude [37,38]. When the loading strain is within the LVE region, the shear modulus is independent of the loading strain and remains constant. In this study, the LVE regions of STR samples with varying curing schemes were determined using the strain sweep test. The test was conducted at 25 °C with a loading frequency of 1.59 Hz. The parallel plate and solid torsion bar fixture were used for the testing before and after the gel point, respectively.

3.3. Weight Loss Monitoring

During the curing reaction process of STR, weight loss of the reactant was observed. Therefore, an electronic balance was used to continuously monitor the variation in the mixture weight. Specifically, the curing temperatures included 35, 50, 65, and 80 °C, which cover the conventional service or curing temperatures used in the field.

3.4. Experimental Schemes

In this study, chemical, rheological, and weight loss tests were conducted to comprehensively characterize the performance evolution of STR during the curing process. Details of the curing schemes and testing parameters are summarized in Table 2.

4. Results and Discussion

4.1. Results of FTIR Test

4.1.1. Curing Degree under Defined Curing Schemes

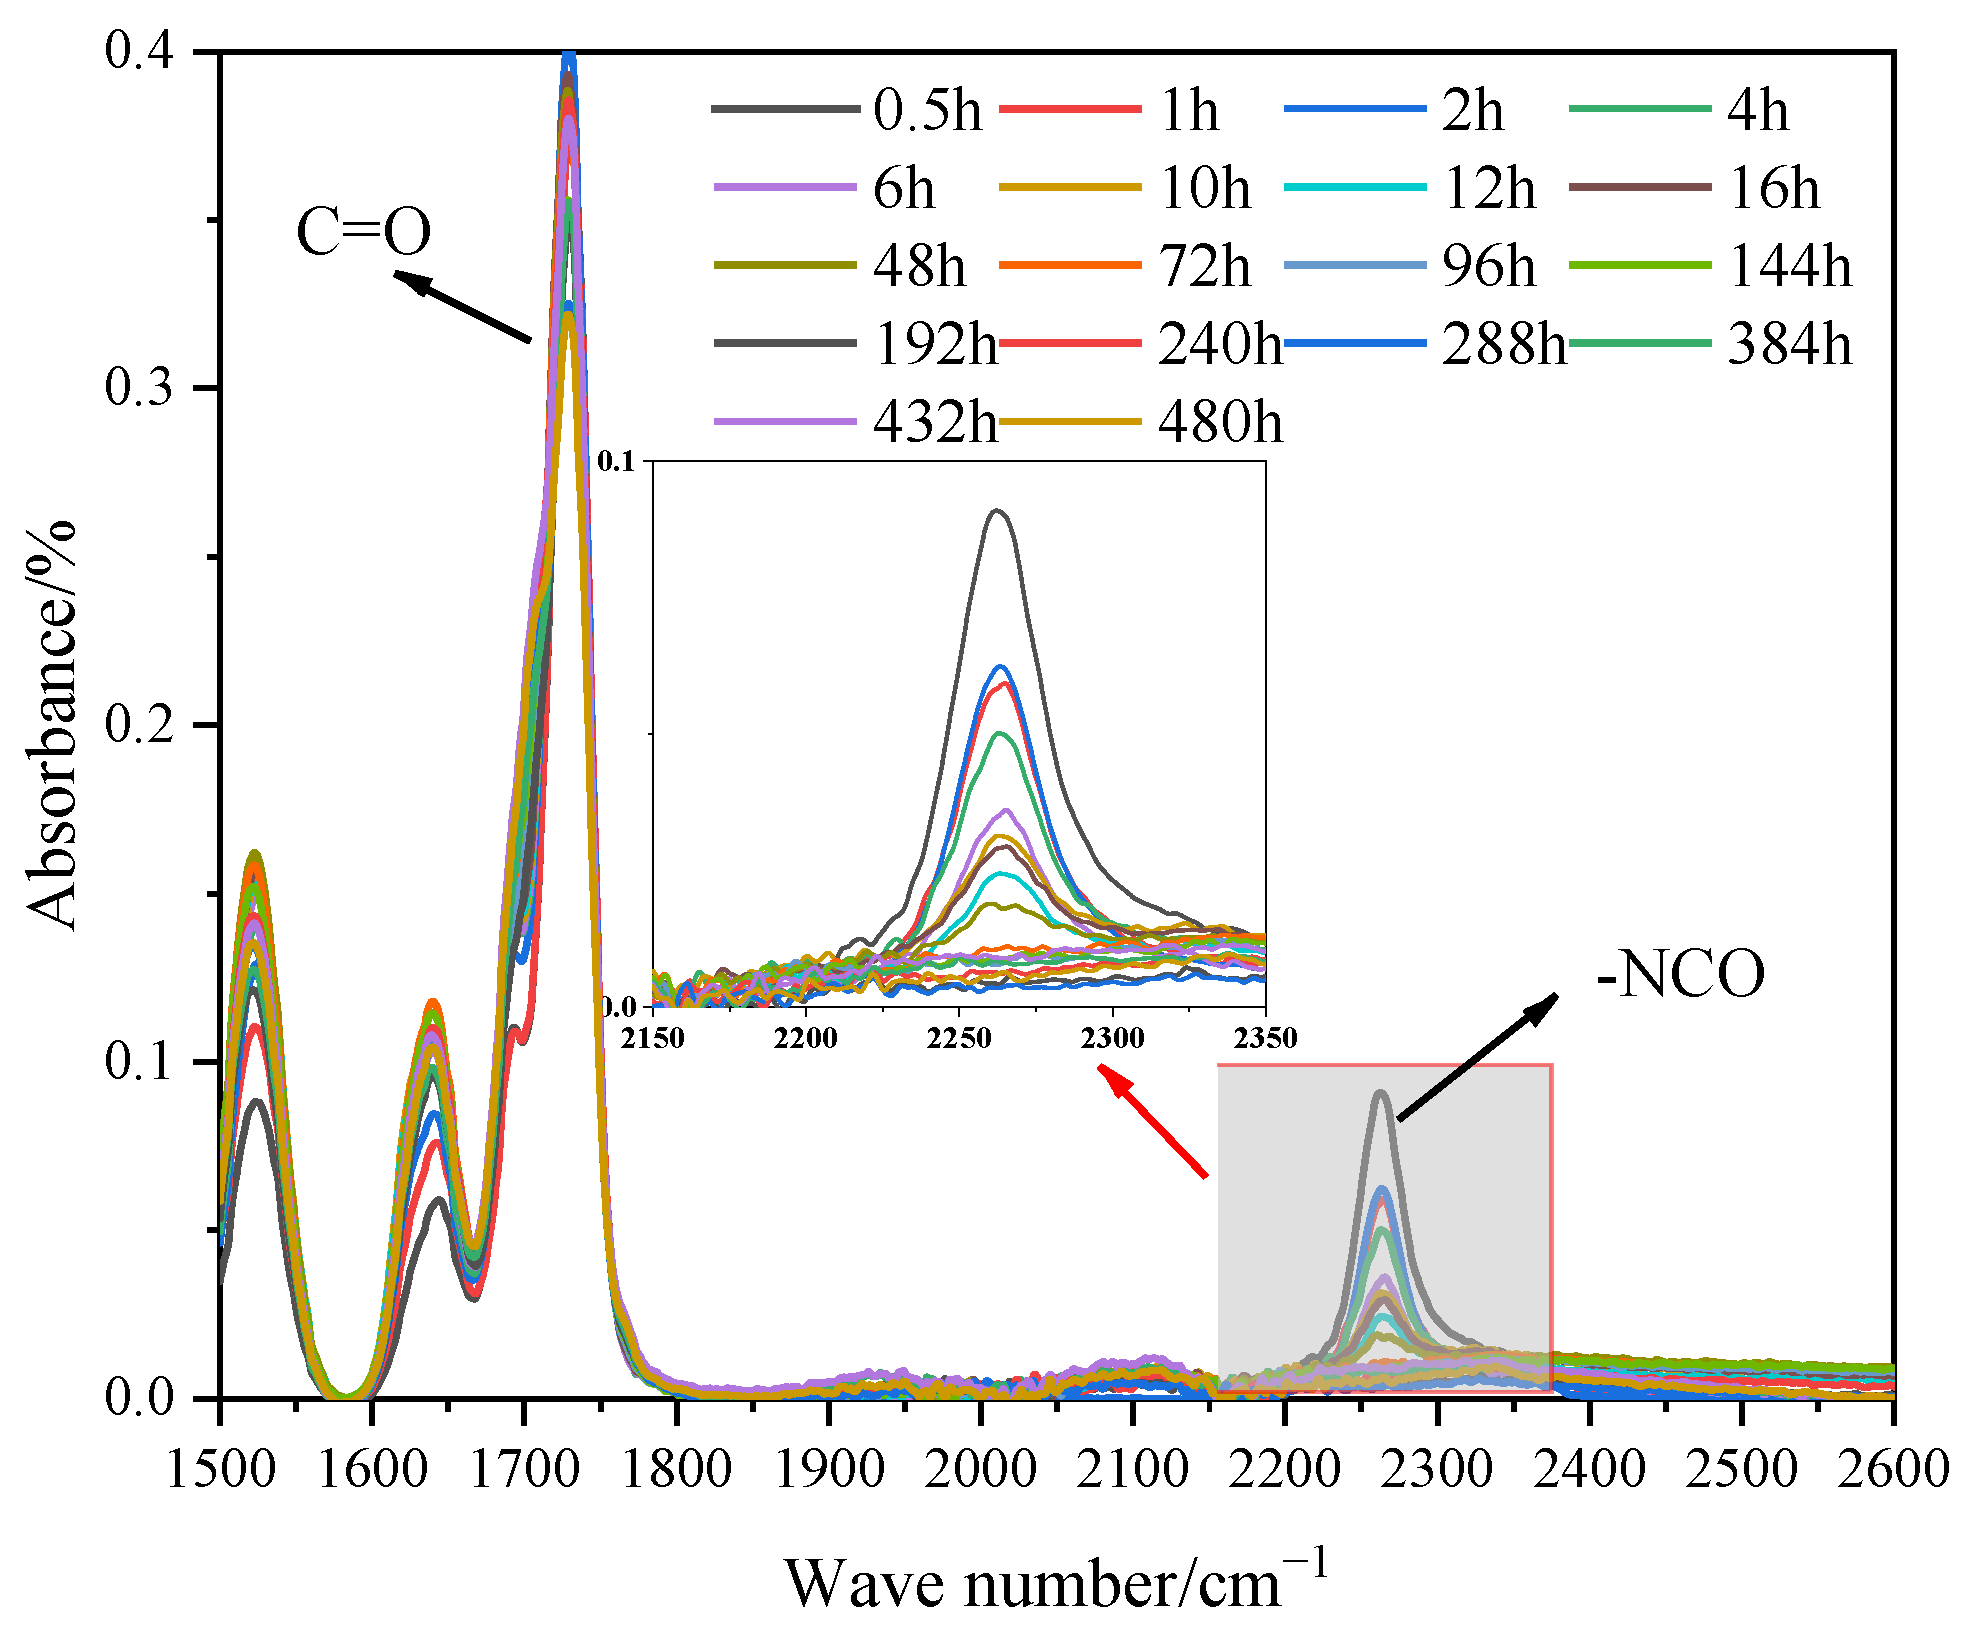
The FTIR test was used to monitor the chemical evolution of STR and, therefore, follow the curing reaction. As shown in Figure 4, in the curing process, the intensity of the characteristic peak (-NCO) ranging from 2181 to 2359 cm−1 gradually decreases and finally disappears, which indicates the completion of the curing reaction. In contrast, the intensity of the characteristic peak (C=O) ranging from 1667 to 1795 cm−1 remains nearly unaffected throughout the polymerization process. Based on the Lambert-Beer principle, the area of a specified absorbance peak is proportional to the concentration of the corresponding chemical composition. However, according to the existing study [39], the intensity of an absorbance peak is highly dependent on the sample thickness. To eliminate such interference, the absorbance peak of C=O is selected as the reference peak, and the normalized absorbance index (AI) of the -NCO peak is defined in Equation (1). Hence, the conversion of the -NCO peak or curing degree α can be calculated using Equation (2).
A I = A N C O A C = O
α t = A I 0 A I t A I 0
where A-NCO and AC=O are the absorbance peak areas of -NCO and C=O, respectively; AI0 is the normalized absorbance index at the beginning; and AIt is the normalized absorbance index after a certain curing duration.
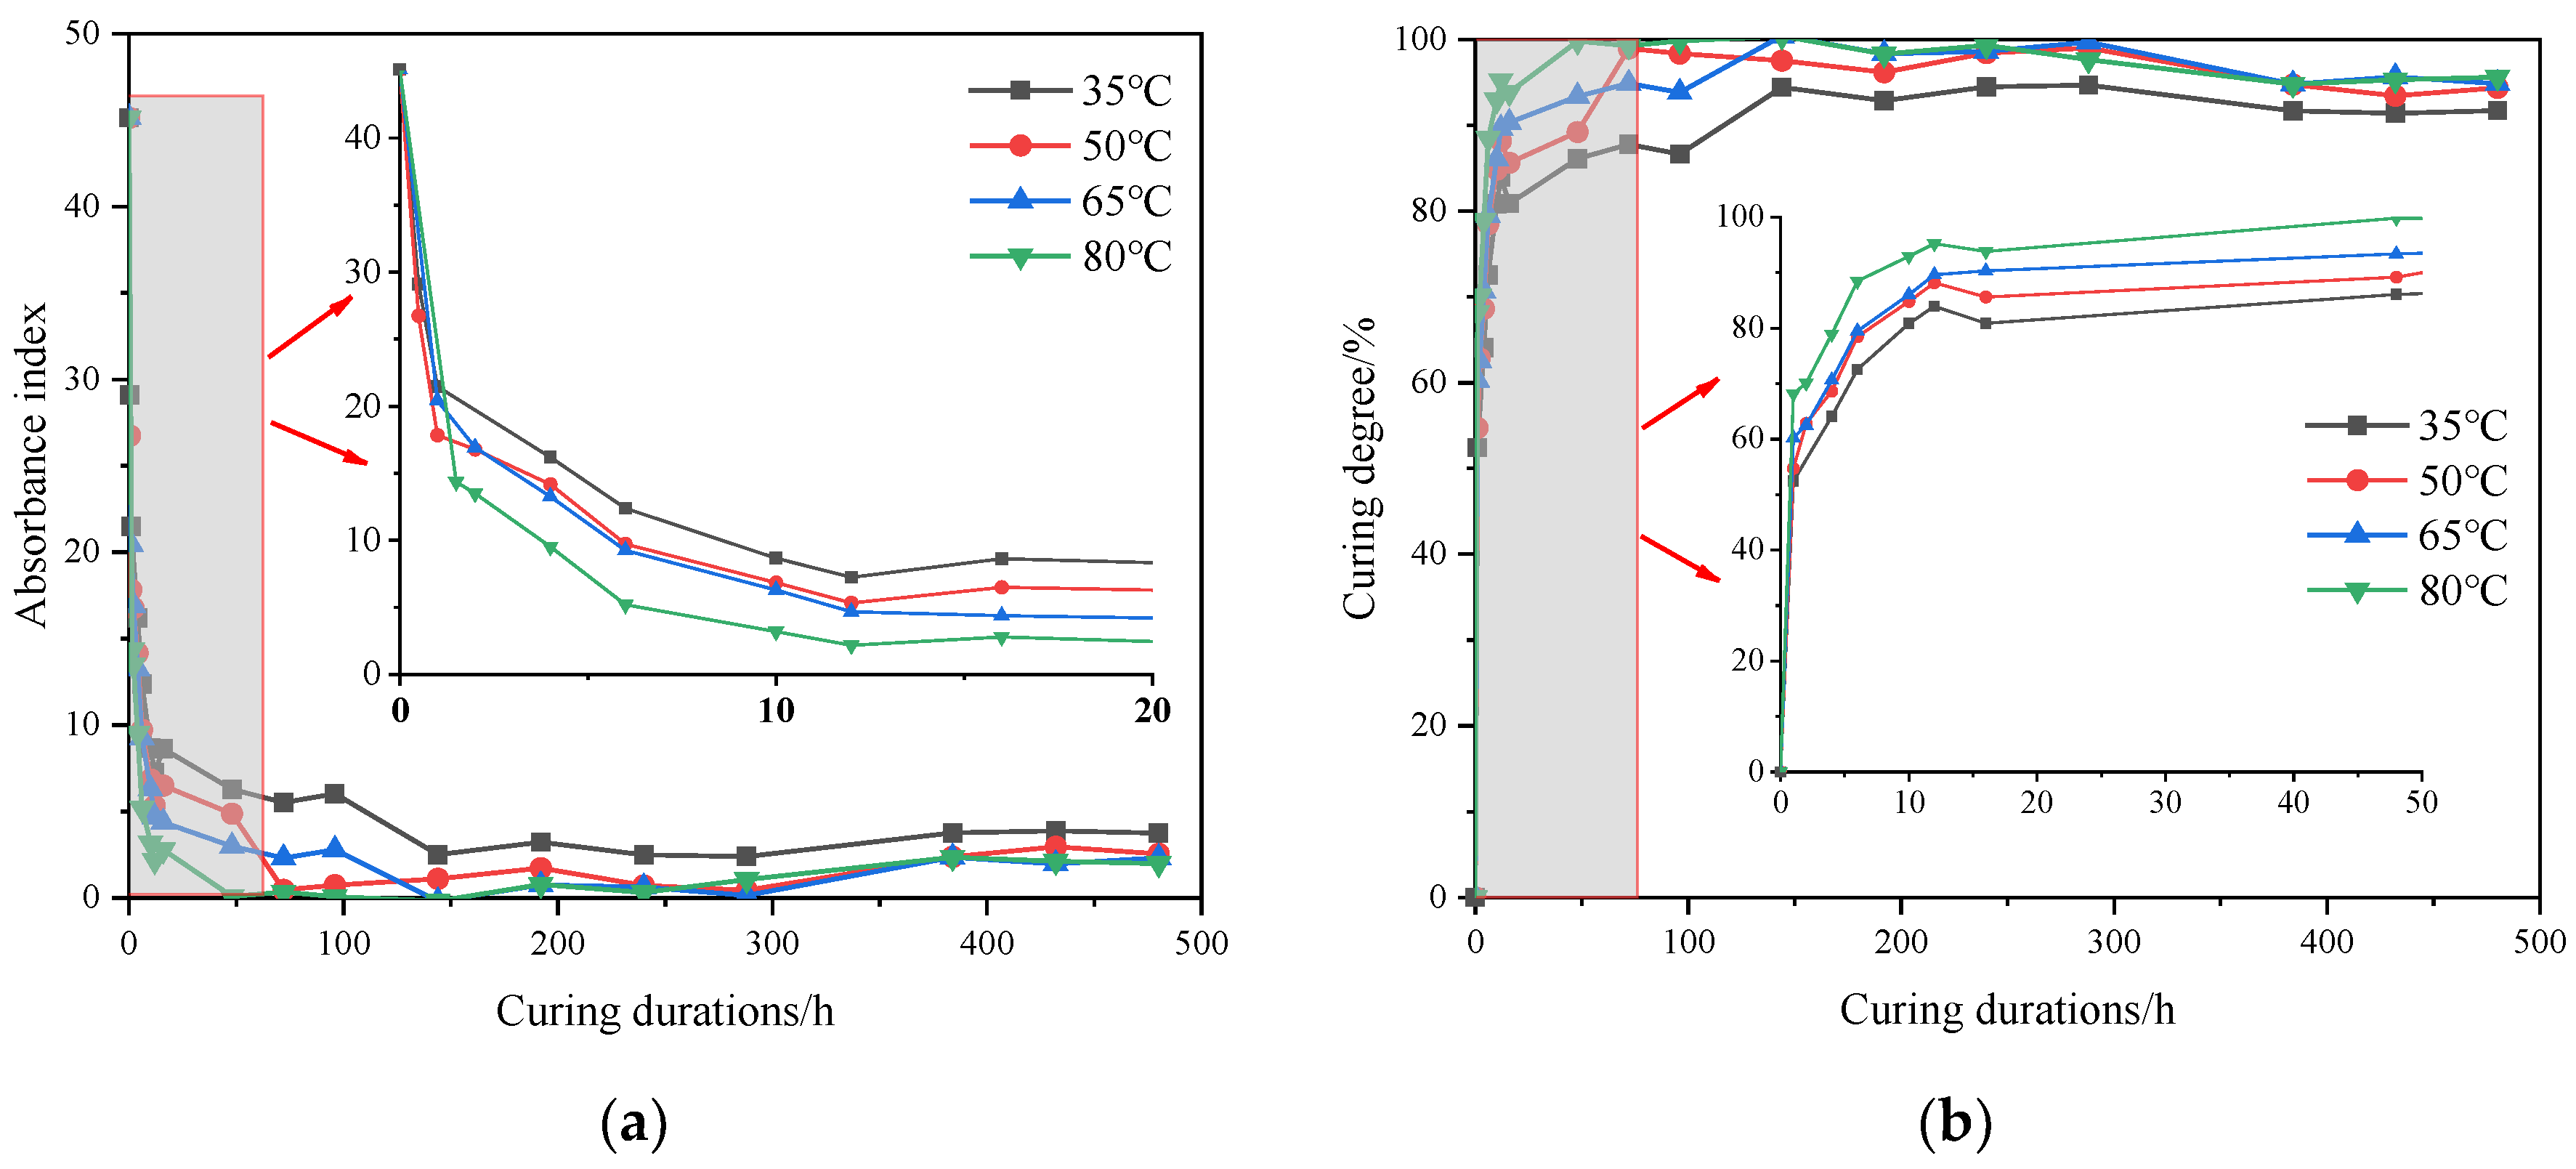
According to Equation (2), the absorbance index and curing degree of STR at varying curing temperatures can be calculated and are shown in Figure 5a,b.
As demonstrated in Figure 5, with the prolonging of curing duration, the absorbance index of the -NCO characteristic peak presents steadily decreasing trends at four curing temperatures. Consequently, the curing degrees or chemical band conversions increase significantly with the curing durations. Particularly, at the initial stage, both the absorbance index and curing degree change dramatically, which indicates the relatively high curing rates of STR in the early phase. For instance, when cured for 10 h, the AIs at four temperatures roughly decrease from 45 to 10; in addition, a remarkable curing rate can be observed, and the corresponding curing degrees at four curing temperatures all exceed 80%. Then, with the proceeding of the curing reaction, the curing degrees continue to increase, but with a considerably lower gradient, and level off gradually. Specifically, when STR is cured for 144 h, the curing degree reaches a plateau regardless of the curing temperature, which may imply the approximate completion of the curing reaction. These results imply that with the proceeding of the curing process, the three-dimensional network gradually forms and the movement of the branched or linear chains is restricted. Consequently, the reaction rate decreases gradually, and the reaction between reactants may transform from a chemical-controlled mode to a diffusion-controlled mode.
According to Figure 5, significant effects of curing temperature on the curing reaction can be observed. Generally, increased curing temperatures are beneficial to enhancing the curing rate and consequently increasing the curing degree. As revealed in Figure 5b, with the same curing durations, the curing degrees of STR at 80 °C are always the highest, followed by that of STR at 65 and 50 °C. In contrast, the curing degree of STR at 35 °C is the lowest. For instance, it takes 10 h for STR cured at 35 °C to reach an 80% curing degree. However, when cured at 80 °C, it takes 6 h to reach a curing degree of 80%. Furthermore, even when cured for 480 h, the curing degree of STR can hardly reach 100%, especially at low curing temperatures. When cured at 35 °C, the ultimate curing degree is lower than 95%. In contrast, when cured at 65 and 80 °C, the final curing degree approaches 100%. Hence, increased curing temperatures could promote chemical conversion and increase the ultimate curing degree.

4.1.2. Curing Kinetics

Currently, numerous phenomenological models [23] have been proposed to manifest the curing kinetics of thermosets, including the nth-order model, autocatalytic model, and Kamal model, as shown in Equations (3)–(5), respectively.
d α d t = k ( 1 α ) n
d α d t = k α m ( 1 α ) n
d α d t = ( k 1 + k 2 α m ) ( 1 α ) n
k = A e E a / R T
where α is the curing degree; t is the reaction duration; m and n are the curing reaction orders; k, k1, and k2 are the reaction rate constants; A is the pre-exponential factor; Ea is the curing reaction activation energy; R is the gas constant 8.314 J/(mol·K); and T is the absolute temperature.
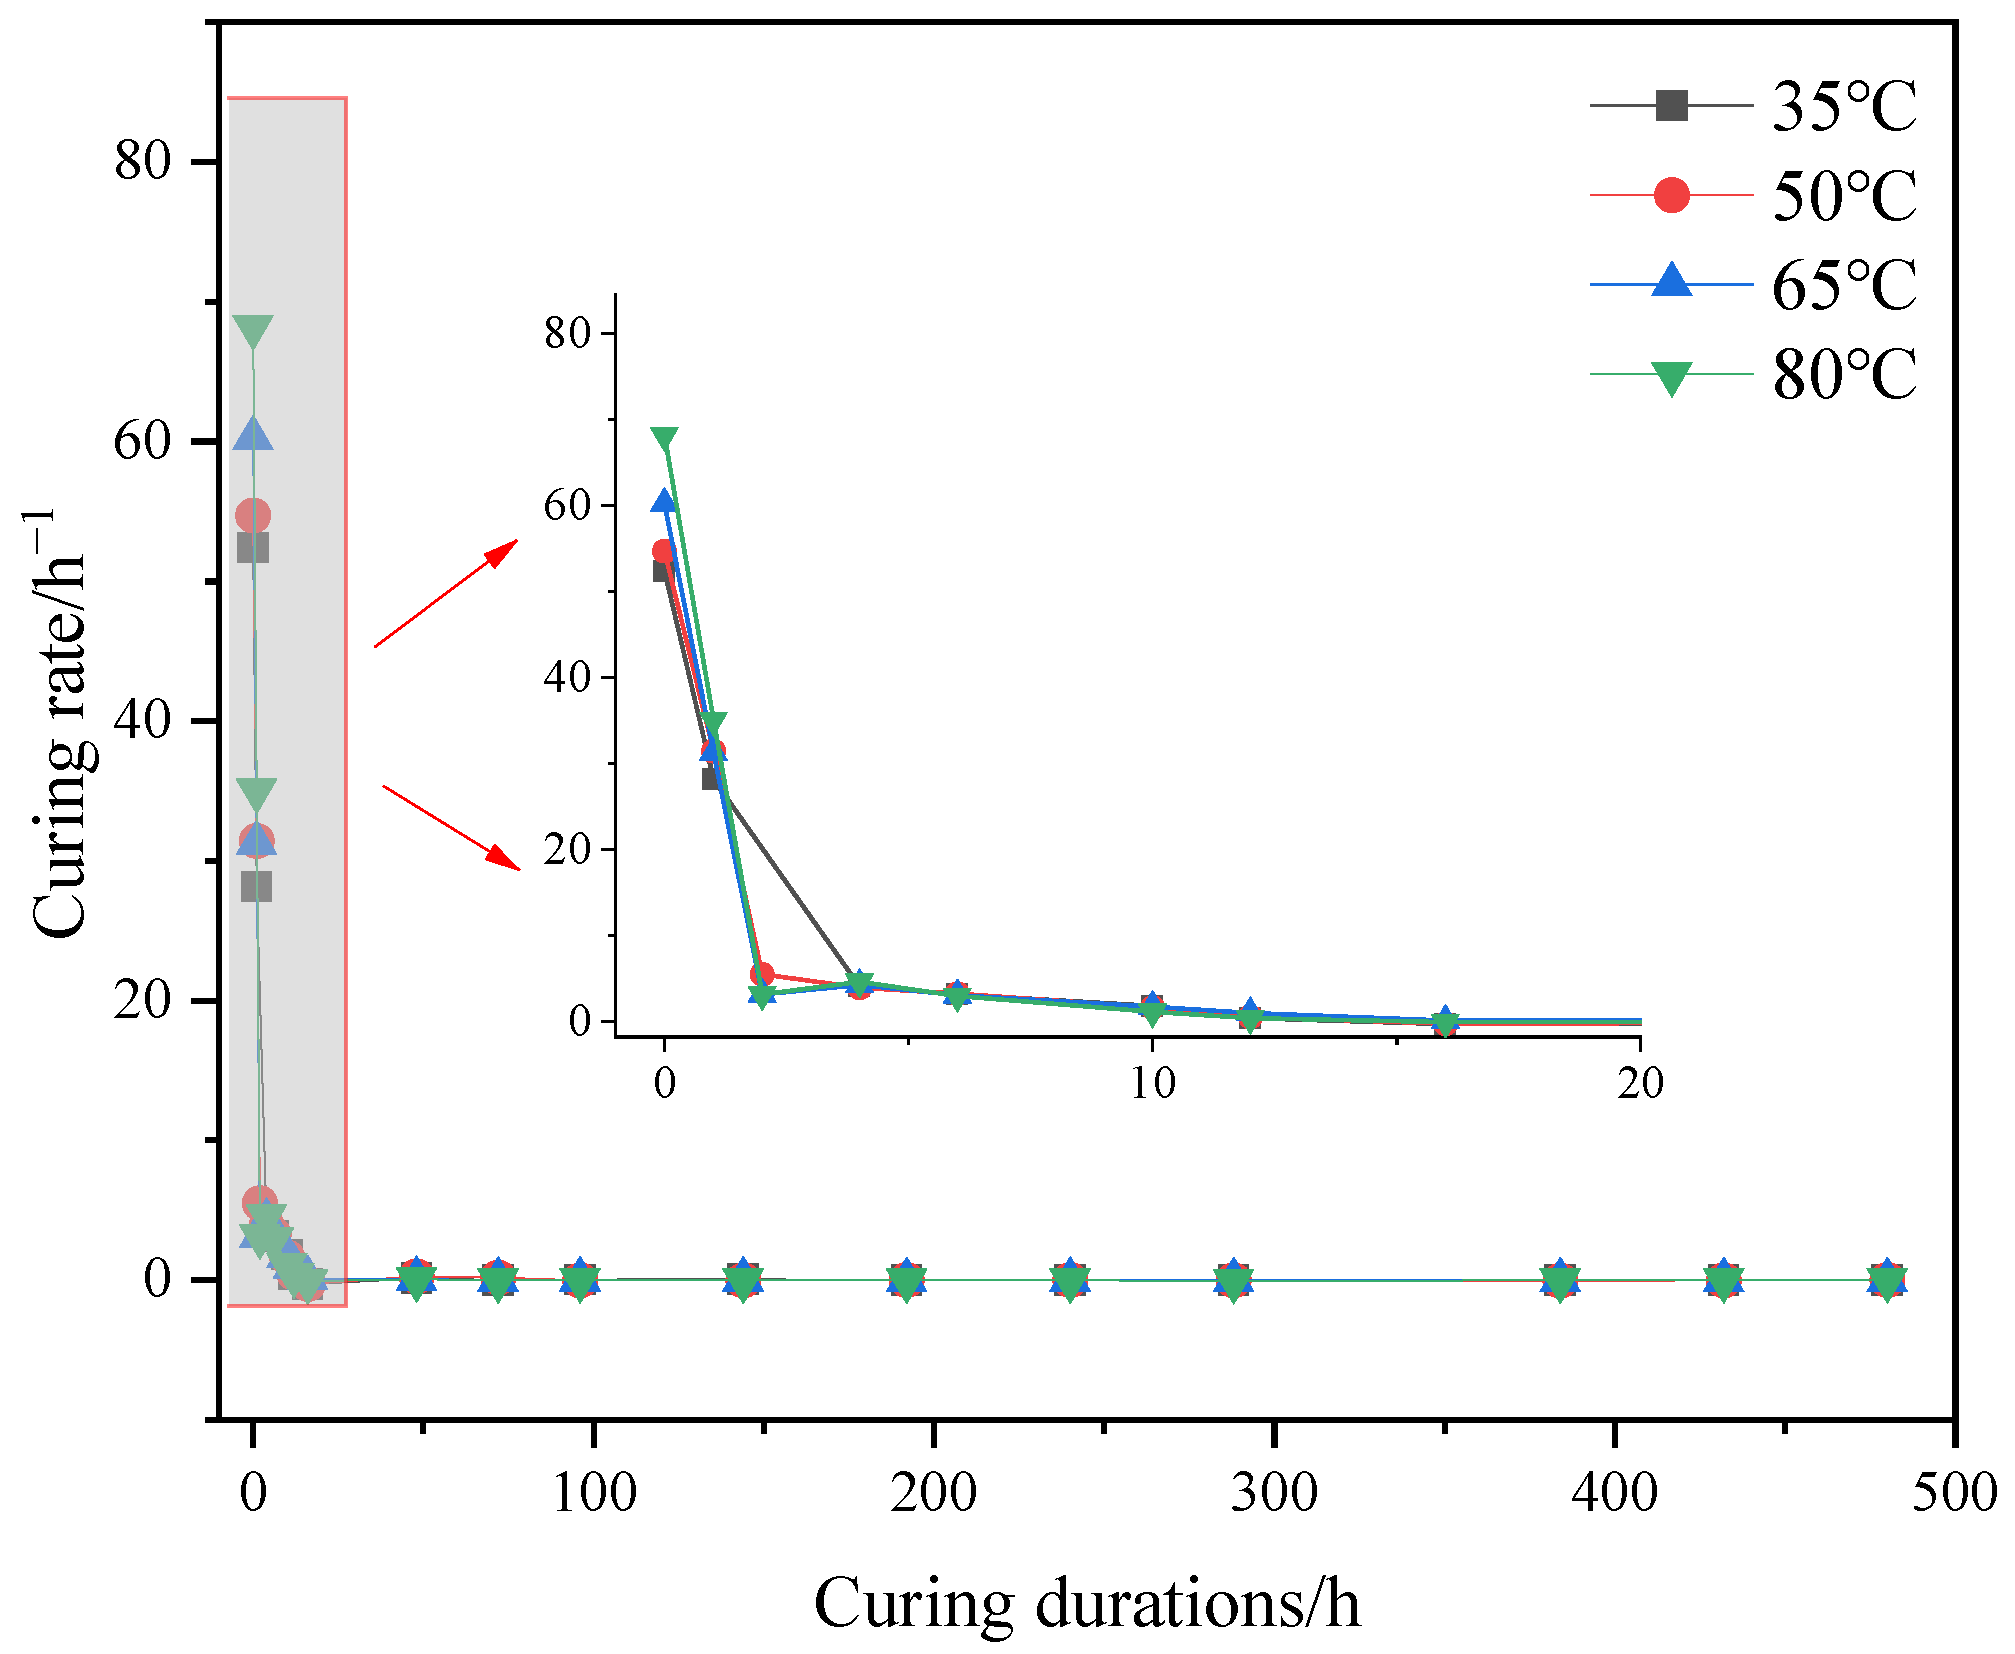
According to the above equations, for the nth-order model, the maximum curing reaction rate occurs at the beginning; afterward, the reaction rate decreases gradually. In contrast, the curing reaction rate of the autocatalytic model begins at 0, and then, increases to the maximum. The Kamal model is a generalized nth-order model and autocatalytic model. Based on Figure 5b, the differential values of the curing degree were calculated as shown in Figure 6.
According to the curing reaction rate shown in Figure 6, the curing reaction reaches the maximum rate at the beginning. Then, due to the formation of a polymer network, the movements of the branched and linear chains are restricted, and consequently, the reaction rate gradually levels off. The curing behaviors of STR are in accordance with the nth-order reaction mechanism. Therefore, the curing reaction of STR is speculated to be the nth-order reaction. Based on the curing degree data and the corresponding curing rate, Equation (3) was used to fit the data, and the fitting parameters are listed in Table 3.
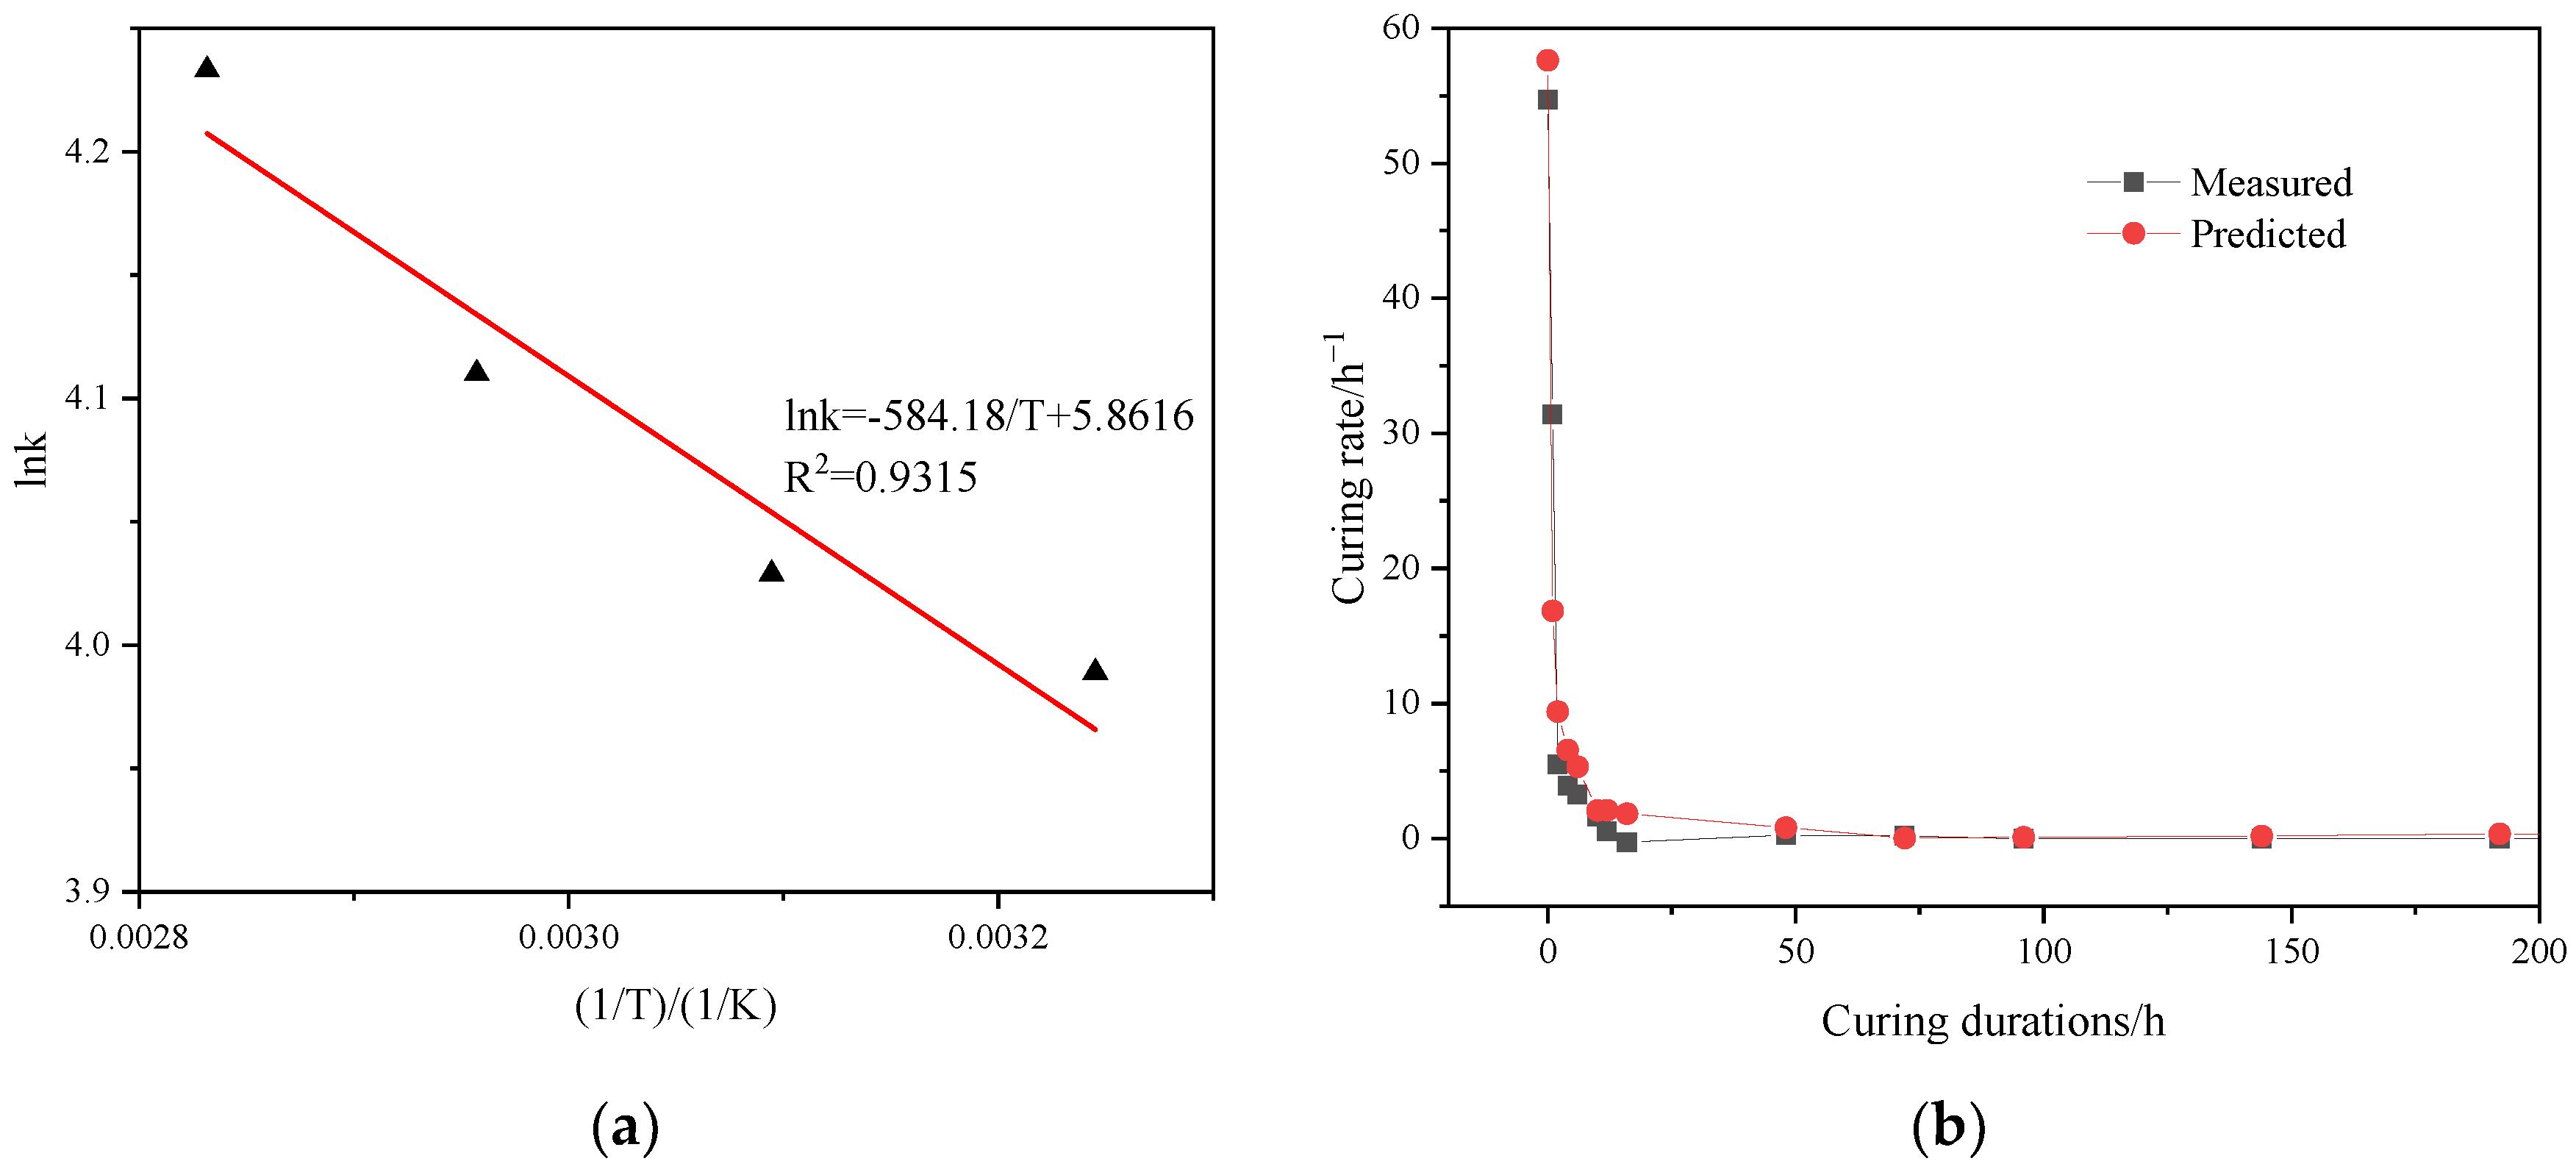
According to Table 3, both the reaction rate constant k and reaction order n vary at different temperatures, especially for k. The results indicate that increased curing temperatures can enhance the reaction rate constant k. The data further explain the aforementioned results whereby at high curing temperatures, the curing degree is higher than that of STR at low curing temperatures. As shown in Equation (6), the reaction rate constant k correlates with the curing temperature and follows the Arrhenius law. Equation (6) can be rewritten into Equation (7). As shown in Equation (7), lnk and 1/T demonstrate a linear relationship. Hence, linear fitting was conducted based on Table 3. The results are shown in Figure 7a.
ln k = ln A E a R T
According to the linear fitting results, the activation energy Ea and pre-exponential factor A can be calculated from the slope and intercept, respectively. Then, Ea and A are determined as 4.86 kJ/mol and 351.29/h. In addition, the nth-order is taken as the average of n at four temperatures, as listed in Table 3. Hence, the curing reaction model of STR is described in Equation (8). Consequently, the predicted curing reaction rate at 50 °C can be calculated and compared with the test results, as shown in Figure 7b. The established nth-order kinetic model can help to determine the curing degree of STR at varying curing temperatures and durations and, consequently, understand the dynamic curing behaviors of STR.
d α d t = 351.29 ( 1 α ) 1.551 e 584.18 T

4.2. Results of Time Sweep Test

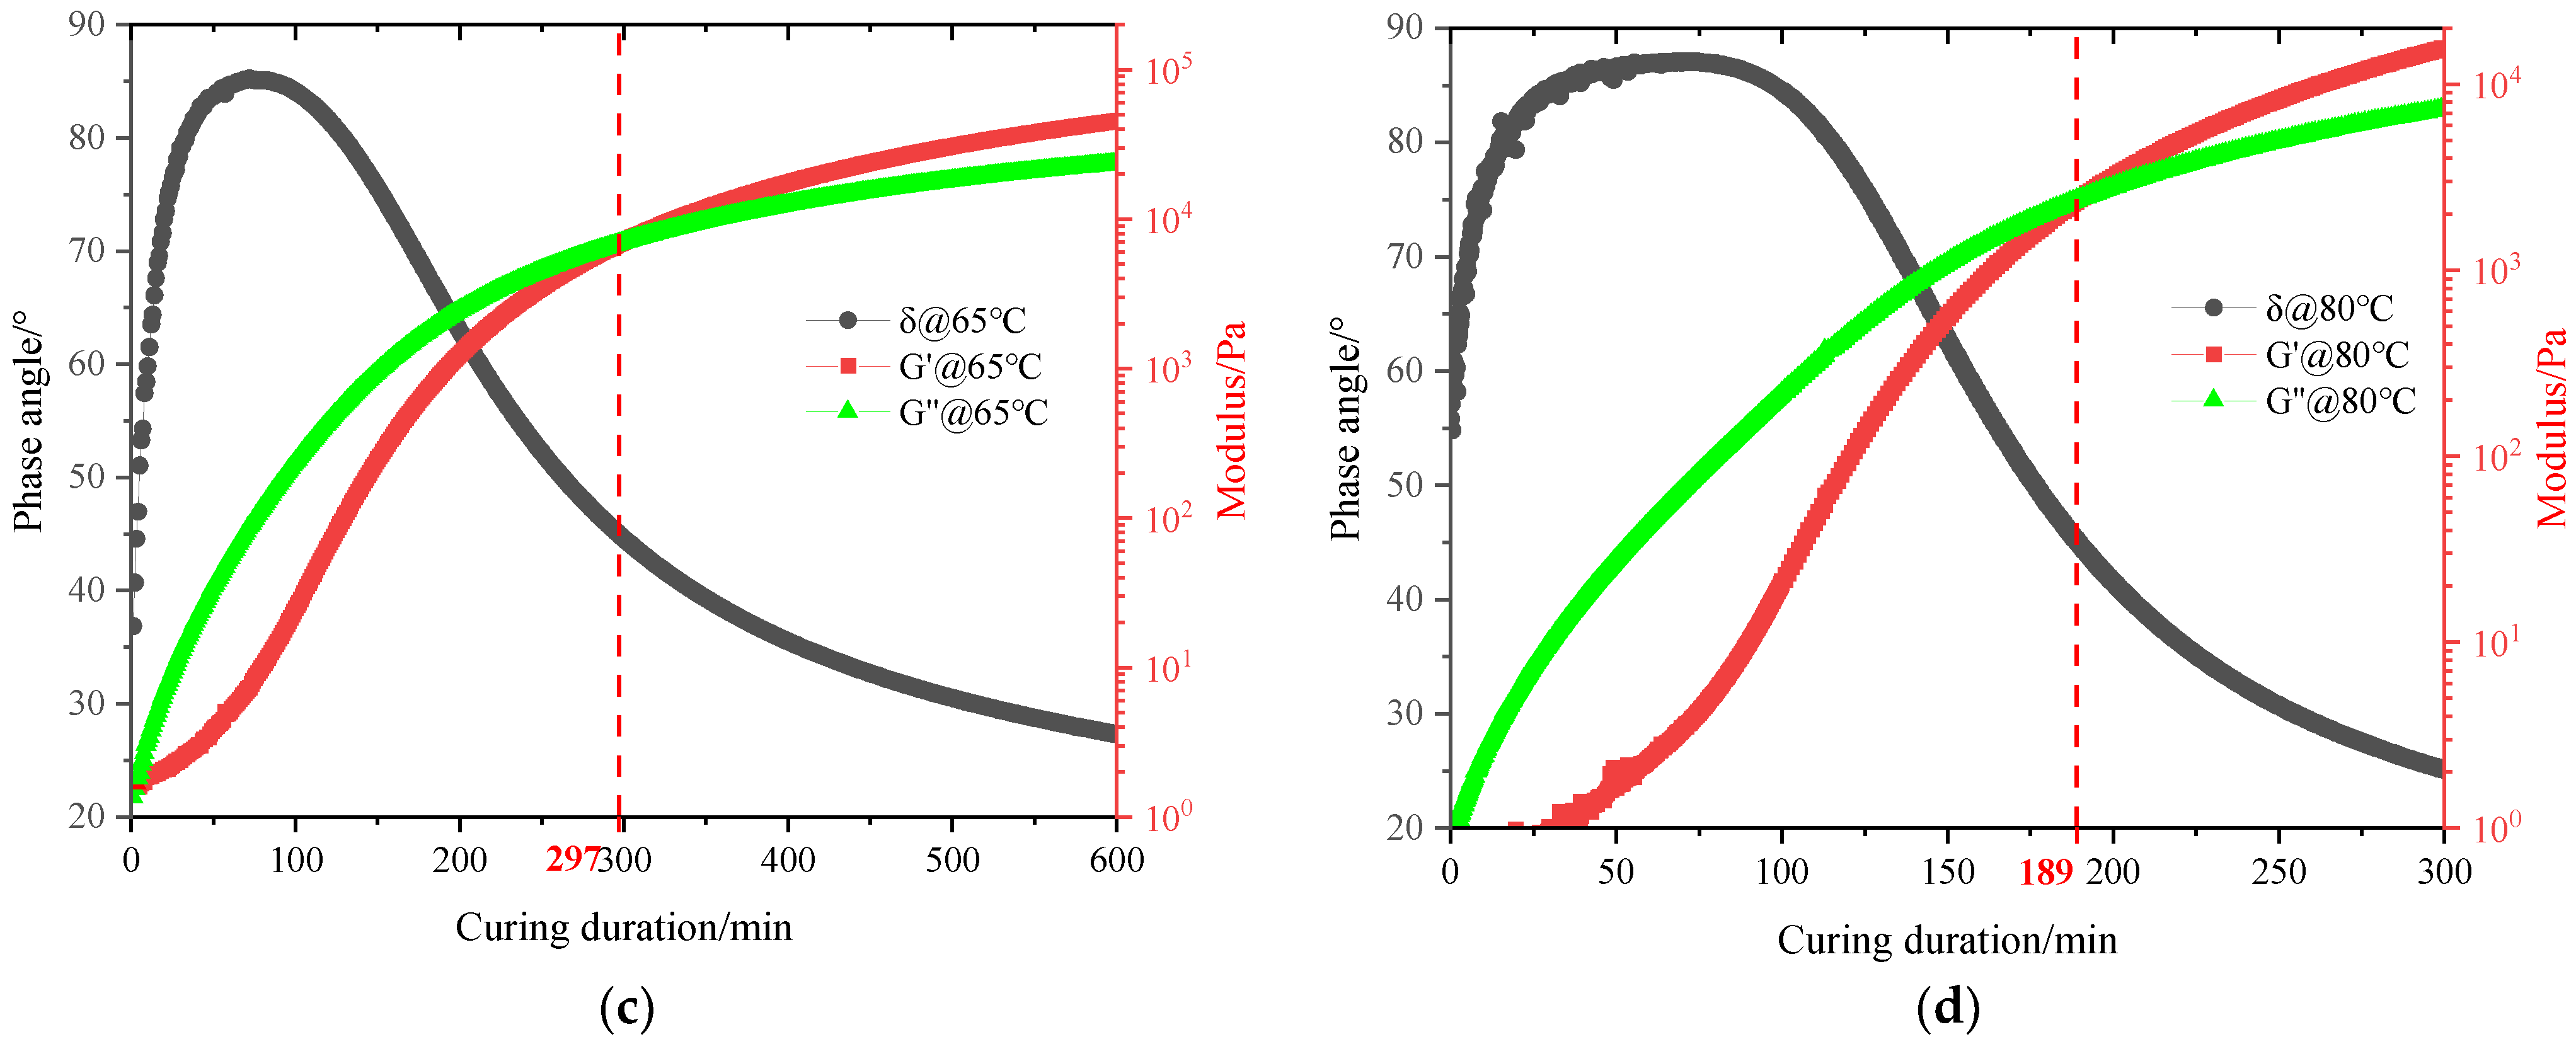
In this study, the time sweep test was used to understand the rheological property evolution of STR and consequently determine the gel point at varying curing temperatures. Many methods have been proposed to determine the gel time [40,41]. In this research, the gel point was defined as the intersection point of the storage modulus and the loss modulus in a time sweep test using DSR equipment [42]. The results of the time sweep test at different curing temperatures are demonstrated in Figure 8.
As revealed in Figure 8, with the prolonging of curing duration, the storage modulus and loss modulus both demonstrate significantly increased trends regardless of the curing temperature, which is attributed to the proceeding of the curing reaction. At the beginning of the curing process, the loss modulus is always higher than the storage modulus. Therefore, the stress–strain response is mainly dominated by the viscous properties initially. After the gel point time, the storage modulus is higher than the loss modulus, which indicates the transformation of STR from a viscous liquid to a viscoelastic solid. In addition, during the curing process, an induction period can be observed in storage modulus evolution. The increment rate of the storage modulus starts roughly at 0, and then, reaches the maximum according to the slope of the storage modulus evolution curve.
Apart from the evolution of the modulus, the phase angle of STR also demonstrates an interesting phenomenon. Generally, at the initial stage, the phase angle increases considerably and reaches a peak at about 85°. Thereafter, the phase angle decreases significantly due to the enhancement of the curing degree. According to the time sweep test results, the curing time to the cross point of the storage modulus and loss modulus, namely, gel time, can be determined, as summarized in Table 4. In addition, based on the established curing reaction model in the previous section, the curing degree of the gel point can be calculated, as shown in Table 4.
As shown in Table 4, with the increase in temperature from 35 to 80 °C, the gel point time decreases significantly from 480 to 189 min. These results indicate that the elevated curing temperature is beneficial to promoting the curing reaction rate and shortening the gel point time of thermosets. Moreover, although a decrease in gel point time is observed, the gel point curing degree does not present an obvious difference. Regardless of the curing temperature, the gel point curing degree concentrates around 75.73%. A previous study [23] has also confirmed the finding that the curing temperatures show insignificant effects on the gel point curing degree. In addition, the gel point time can be correlated with the curing temperature using Equation (9).
ln t g e l = c + E a R T
where tgel is the gel point time; c is the equation constant; Ea is the activation energy for the gel point equation; R is the gas constant; and T is the absolute temperature.
By linear fitting lntgel with 1/T, the equation for predicting the gel point time can be established. Therefore, linear fitting was conducted based on Table 4 with a correlation coefficient of 0.948. According to the fitting results, the slope of the equation is −0.6339 and the intercept is 2097.8. Consequently, the gel point time can be predicted using Equation (10). Based on Equation (10), the gel point time at a specified curing temperature can be calculated, which is beneficial for understanding the pre- and post-gelation characteristics of STR.
t g e l = exp ( 2097.8 T 0.6339 )

4.3. Results of LVE Region Test

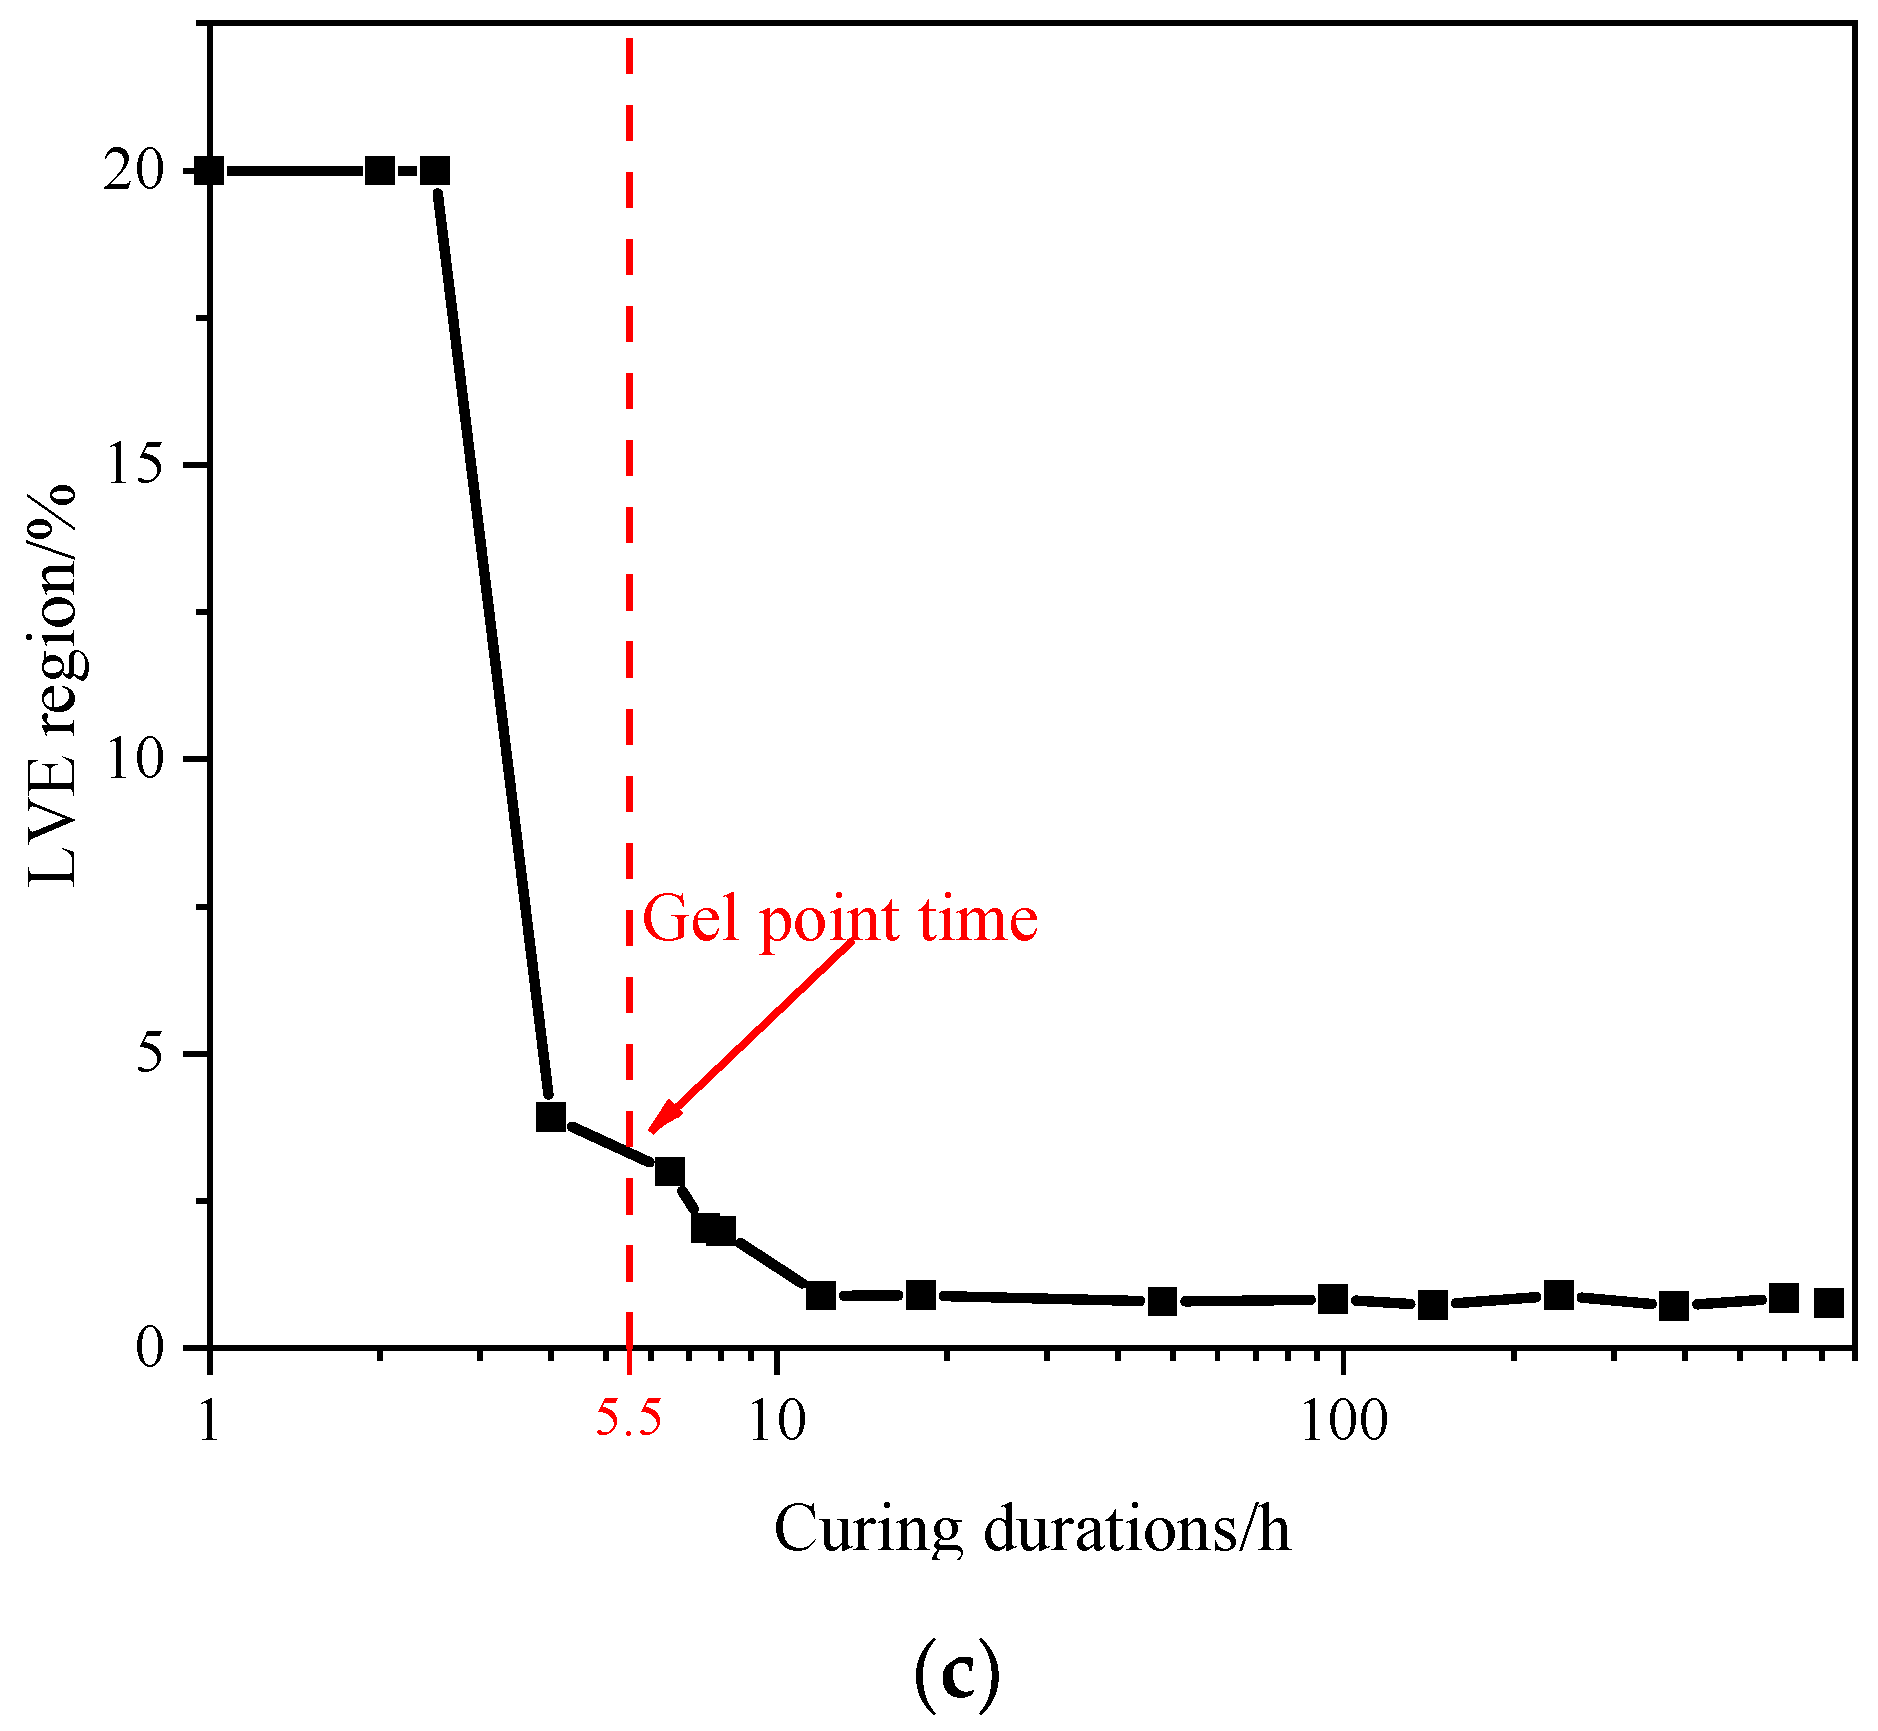
The specimens for the LVE region test were cured at 50 °C for different durations from 1 to 720 h. The LVE region test was conducted at 25 °C, and the loading strain varied from 0.001% to 2% or 0.1% to 20% depending on the curing durations of the STR samples. The LVE region is determined as the strain at which the complex shear modulus reduces to 95% of the initial value [38]. The results of the LVE region test are summarized in Figure 9.
According to Figure 9, with the increase in curing duration, the complex shear modulus reveals an apparent upward trend even after curing for 720 h. However, based on the FTIR test results, the curing reaction is approximately accomplished after 100 h at 50 °C. Therefore, the evolutions of STR’s chemical composition and mechanical properties are inconsistent. In addition, the LVE region demonstrates a significant decreasing trend, especially when the curing duration increases from 2.5 to 4 h. When the STR samples are cured for fewer than 4 h, the LVE region exceeds 20%, which is remarkably higher than that of traditional asphalt. However, with the prolonging of curing durations, the LVE region decreases sharply, which indicates that the STR gradually converts from a viscous liquid to a viscoelastic solid. These results may be attributed to the branching of thermosetting polymers, which limits the free movement of polymer chains.
It is clear that, when cured for 10 h at 50 °C, the LVE region demonstrates a stable tendency and concentrates around 1%. After this, the increases in curing duration can hardly alter the LVE region. This phenomenon means that after 10 h of curing process, a thermosetting three-dimensional network is basically formed, and the movement of branched chains is confined. According to the previous section, the gel point time at 50 °C is about 5.5 h. Based on Figure 9c, it should be noted that the inflection point of LVE region evolution seems to be near the gel point. This interesting finding may further confirm the definition of the gel point and the apparent rheological property evolution at this point.

4.4. Weight Loss Monitoring

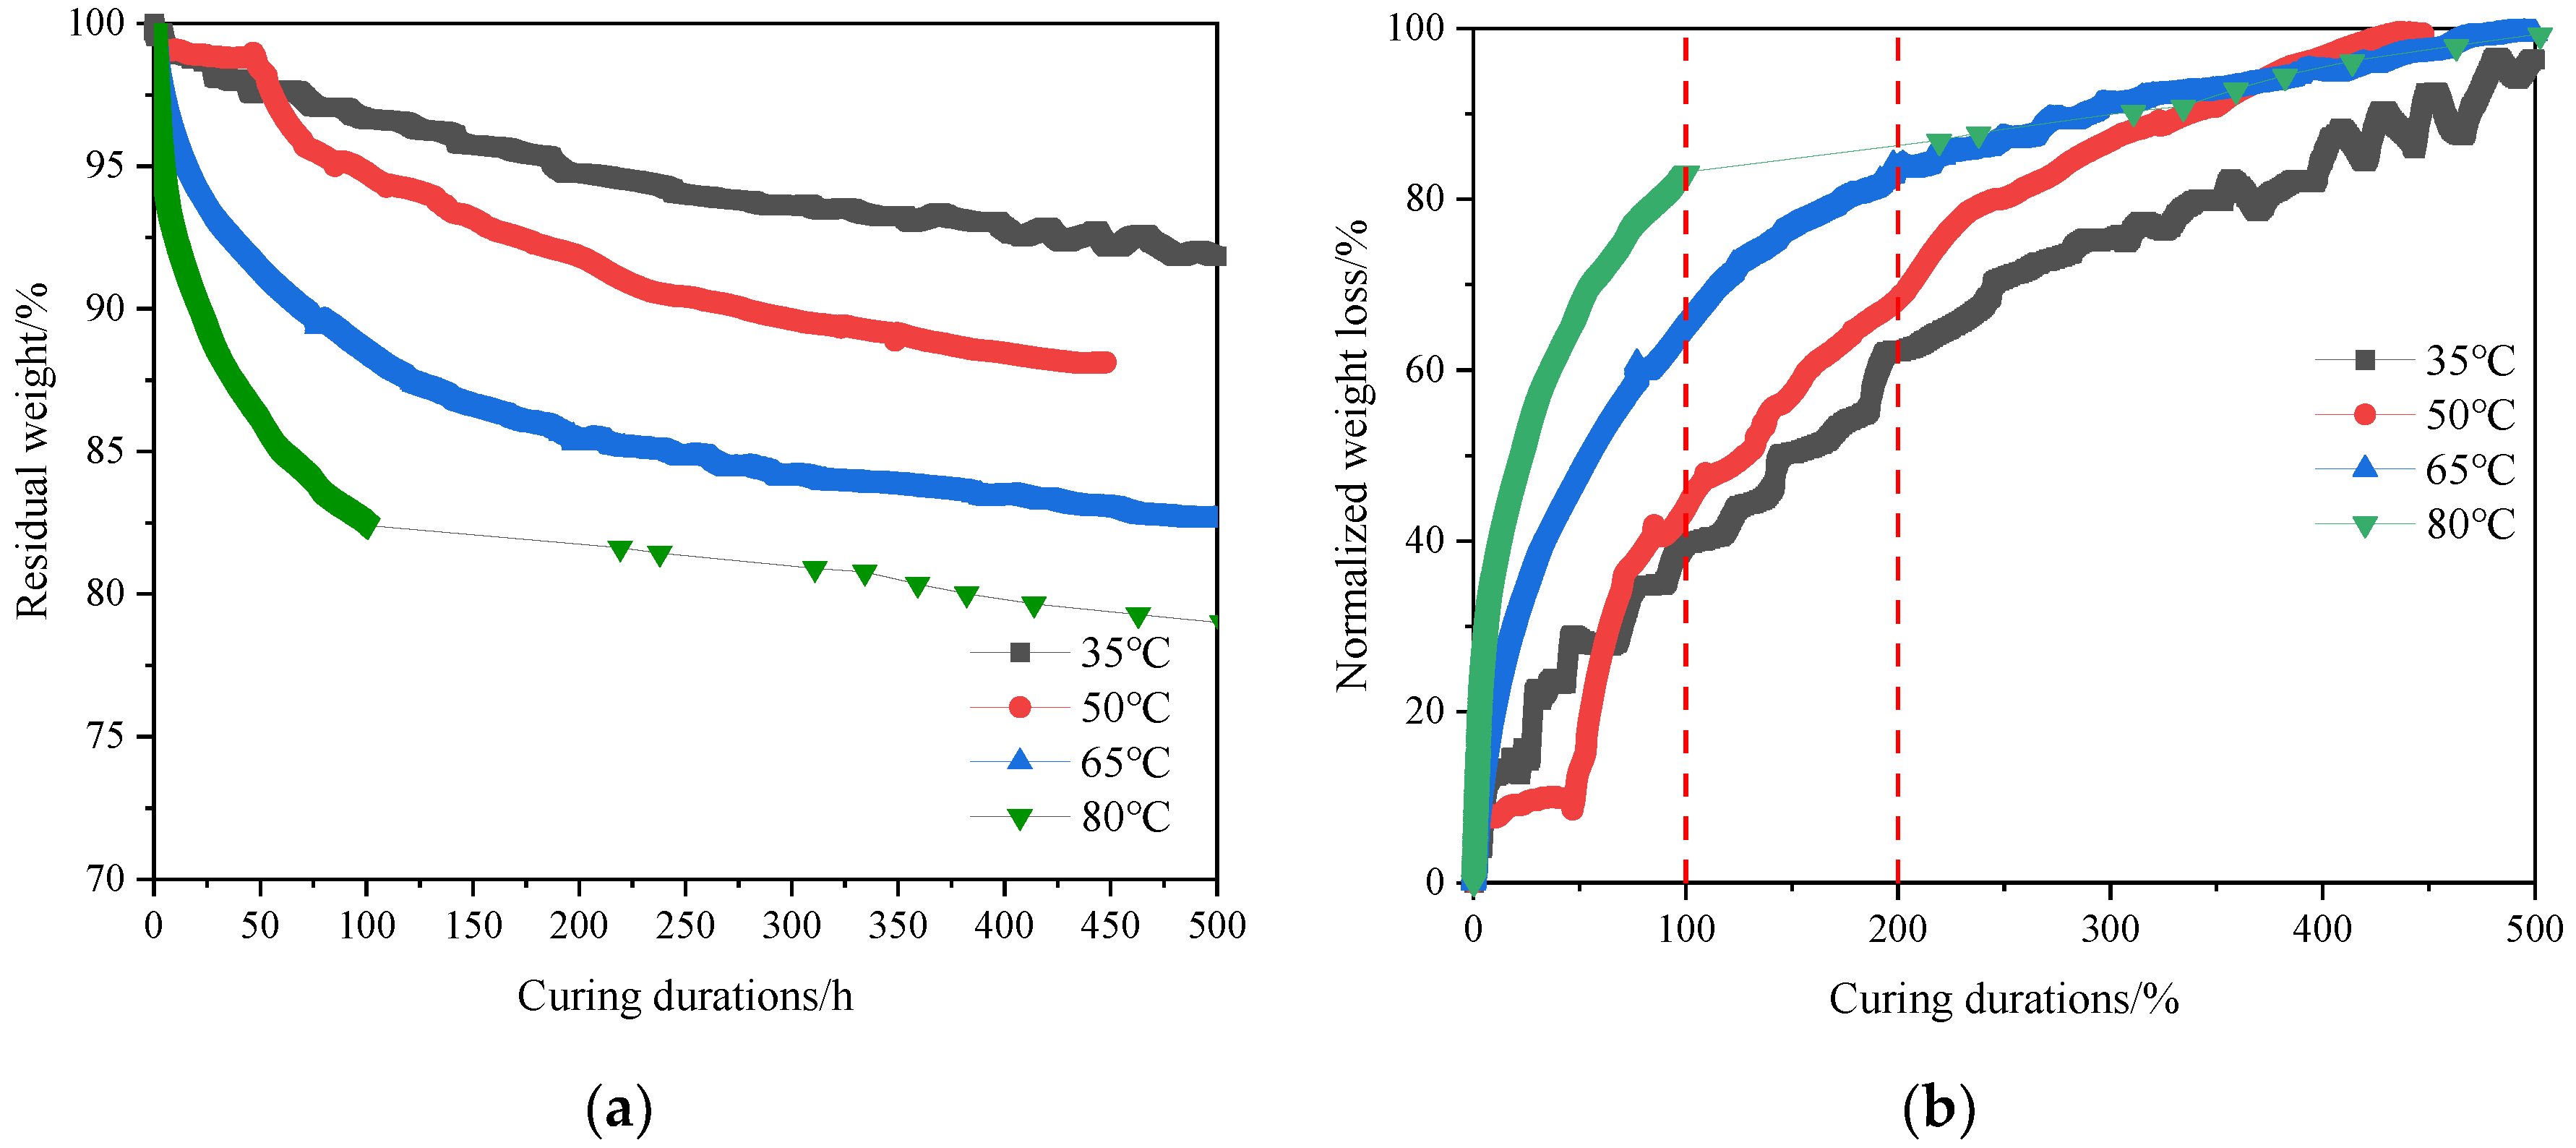
During the curing reaction process of STR, weight loss of the reactant is observed. Therefore, an electronic balance was used to continuously monitor the variation in the mixture weight. Specifically, the curing temperatures included 35, 50, 65, and 80 °C, which cover the conventional service or curing temperatures used in the field. The normalized results of the curing-induced weight loss are presented in Figure 10.
As revealed in Figure 10a, with the prolonging of curing durations, the weight of the reactant demonstrates a significantly decreasing trend, especially for the specimens cured at higher temperatures. The observed weight loss of STR may be attributed to the reaction-induced volatilization of the curing agent. Specifically, after being cured for 400 h, the weight loss of the specimen cured at 35 °C is about 8%; in contrast, when cured at 80 °C, the weight loss approaches 20%. These results indicate that the elevated curing temperatures may boost the curing reaction rate and increase the evaporation of the reactant.
In addition, the rates of STR weight loss at different curing temperatures all show decreasing trends. The weight loss of STR at the beginning of the curing reaction is higher than that of STR at the end of the curing reaction, especially for the specimens at high curing temperatures. As shown in Figure 10b, when cured for 100 h, the weight loss of STR cured at 35 and 50 °C is approximately 40% of the total weight loss. In contrast, the weight losses of STR cured at 65 and 80 °C exceed 60% and 80% by total weight loss, respectively. Therefore, the initial weight loss occupies most of the total weight loss during the whole curing process.
To predict the weight loss of STR at varying curing temperatures for different curing durations, the Maxwell equation was utilized to correlate the weight loss data, as shown in Equation (11). The fitting results are summarized in Figure 11 and Table 5.
W = A + B exp ( t C )
In the above equation, W is the percentage weight loss of STR, %; t is the curing duration, h; and A, B, and C are the fitting constants.
Based on the fitting results listed in Figure 11 and Table 5, the proposed Maxwell equation could correlate well with the weight loss data. Consequently, the weight loss of STR in the curing process can be predicted in varying curing temperature and duration combinations, as shown in Equation (12).
W = 0.23 T + 98.53 + ( 0.15 T + 4.32 ) exp ( t 452.89 5.13 T )

5. Conclusions

In this study, chemical, rheological, and weight loss tests were conducted to comprehensively characterize the performance evolution and understand the dynamic curing behaviors of STR during the curing process. The main conclusions drawn are as follows.
(1)
The curing degrees increase significantly with the curing durations, particularly at the initial stage. Specifically, when cured for 10 h, the curing degrees increase remarkably at four curing temperatures, all exceeding 80%. When cured for 144 h, the curing degree reaches a plateau regardless of the curing temperature. Moreover, increased curing temperature can also increase the curing rate and ultimate curing degree.
(2)
The curing reaction of STR reaches the maximum rate at the beginning. Then, the reaction rate gradually levels off. Therefore, the curing reaction of STR is speculated to be the nth-order reaction. By fitting the test results, the nth-order curing kinetic model with an nth-order of 1.551 was established.
(3)
With the increase in temperature from 35 to 80 °C, the gel point time decreases significantly from 480 to 189 min. However, the gel point curing degree does not present an obvious difference and concentrates around 75.73%.
(4)
The LVE region demonstrates an obvious decreasing trend, especially when the curing duration increases from 2.5 to 4 h. When cured at 50 °C for more than 10 h, a three-dimensional network is basically formed and the LVE region demonstrates a stable tendency concentrating around 1%.
(5)
Increased curing duration and temperature can boost the weight loss of reactants. After 400 h, the weight losses of specimens cured at 35 and 80 °C are about 8% and 20%, respectively. In addition, the initial weight loss occupies most of the total weight loss during the whole curing process. Finally, the Maxwell equation was proposed to predict the weight loss of STR with a specified curing scheme.
According to the results of this study, the curing kinetic model and rheological property evolution could help to determine construction parameters, such as the allowable duration and compaction time. Finally, the curing characteristics and cured performance could be combined to better estimate the applicability of STR and similar potential thermosets for steel bridge deck paving.

Author Contributions

Conceptualization, Y.H., F.N. and J.J.; methodology, Y.H., Z.Z. and J.T.; formal analysis, Y.H., J.T. and J.J.; investigation, Y.H., Z.Z. and J.T.; resources, F.N. and S.Z.; writing—original draft preparation, Y.H.; writing—review and editing, Y.H. and J.J.; supervision, F.N. and J.J.; funding acquisition, F.N. and S.Z. All authors have read and agreed to the published version of the manuscript.

Funding

This work was supported by the National Natural Science Foundation of China (52078131) and the Postgraduate Research and Practice Innovation Program of Jiangsu Province, China (KYCX21_0134). This research was also financially supported by a collaborative project with the China Railway 19th Bureau Group No. 3 Engineering Co., Ltd.

Institutional Review Board Statement

Not applicable.

Informed Consent Statement

Not applicable.

Data Availability Statement

All data are included in the article.

Conflicts of Interest

The authors declare no conflict of interest.

References

  1. Zhu, Z.; Xiang, Z.; Li, J.; Huang, Y.; Ruan, S. Fatigue behavior of orthotropic bridge decks with two types of cutout geometry based on field monitoring and FEM analysis. Eng. Struct. 2020, 209, 109926. [Google Scholar] [CrossRef]
  2. Han, Y.; Zhang, Z.; Tian, J.; Ni, F.; Gu, X. Long-Term In Situ Performance Evaluation of Epoxy Asphalt Concrete for Long-Span Steel Bridge Deck Pavement. Coatings 2023, 13, 545. [Google Scholar] [CrossRef]
  3. Jia, X.; Huang, B.; Chen, S.; Shi, D. Comparative investigation into field performance of steel bridge deck asphalt overlay systems. KSCE J. Civ. Eng. 2016, 20, 2755–2764. [Google Scholar] [CrossRef]
  4. Medani, T.O. Design Principles of Surfacings on Orthotropic Steel Bridge Decks. Ph.D. Thesis, Technische Universiteit Delft, Delft, The Netherlands, 2006. [Google Scholar]
  5. Farreras-Alcover, I.; Chryssanthopoulos, M.K.; Andersen, J.E. Data-based models for fatigue reliability of orthotropic steel bridge decks based on temperature, traffic and strain monitoring. Int. J. Fatigue 2017, 95, 104–119. [Google Scholar] [CrossRef]
  6. Xiang, Q.; Xiao, F. Applications of epoxy materials in pavement engineering. Constr. Build. Mater. 2020, 235, 117529. [Google Scholar] [CrossRef]
  7. Han, Y.; Ni, F.; Jiang, J.; Tian, J.; Zhang, Z.; Zhou, Z.; Dong, Q. Rheological investigation of a super-tough resin-based binder for steel bridge deck paving. Constr. Build. Mater. 2023, 384, 131441. [Google Scholar] [CrossRef]
  8. Han, Y.; Tian, J.; Ding, J.; Shu, L.; Ni, F. Evaluating the storage stability of SBR-modified asphalt binder containing polyphosphoric acid (PPA). Case Stud. Constr. Mater. 2022, 17, e01214. [Google Scholar] [CrossRef]
  9. Raisi, A.; Asefnejad, A.; Shahali, M.; Doozandeh, Z.; Kamyab Moghadas, B.; Saber-Samandari, S.; Khandan, A. A soft tissue fabricated using a freeze-drying technique with carboxymethyl chitosan and nanoparticles for promoting effects on wound healing. J. Nanoanalysis 2020, 7, 262–274. [Google Scholar] [CrossRef]
  10. Lesueur, D. Polymer modified bitumen emulsions (PMBEs). In Polymer Modified Bitumen; Elsevier: Amsterdam, The Netherlands, 2011; pp. 25–42. [Google Scholar]
  11. Li, X.; Li, J.; Wang, J.; Yuan, J.; Jiang, F.; Yu, X.; Xiao, F. Recent applications and developments of Polyurethane materials in pavement engineering. Constr. Build. Mater. 2021, 304, 124639. [Google Scholar] [CrossRef]
  12. Shundo, A.; Yamamoto, S.; Tanaka, K. Network formation and physical properties of epoxy resins for future practical applications. JACS Au 2022, 2, 1522–1542. [Google Scholar] [CrossRef]
  13. Cividanes, L.S.; Simonetti, E.A.; Moraes, M.B.; Fernandes, F.W.; Thim, G.P. Influence of carbon nanotubes on epoxy resin cure reaction using different techniques: A comprehensive review. Polym. Eng. Sci. 2014, 54, 2461–2469. [Google Scholar] [CrossRef]
  14. Xie, H.; Li, C.; Wang, Q. A critical review on performance and phase separation of thermosetting epoxy asphalt binders and bond coats. Constr. Build. Mater. 2022, 326, 126792. [Google Scholar] [CrossRef]
  15. Apostolidis, P.; Liu, X.; Kasbergen, C.; van de Ven, M.; Pipintakos, G.; Scarpas, A. Chemo-rheological study of hardening of epoxy modified bituminous binders with the finite element method. Transp. Res. Rec. 2018, 2672, 190–199. [Google Scholar] [CrossRef]
  16. Yu, L.; Chen, H.; Wang, H. Tracking and Analysis of Anti-slip Performance Evolutionary of Epoxy Asphalt Pavement on Steel Bridge Decks. J. Munic. Technol. 2022, 40, 29–34. [Google Scholar]
  17. Jamshidi, A.; White, G.; Kurumisawa, K. Functional and field performance of epoxy asphalt technology–state-of-the-art. Road Mater. Pavement Des. 2023, 24, 881–918. [Google Scholar] [CrossRef]
  18. Tian, J.; Luo, S.; Lu, Q.; Liu, S. Effects of epoxy resin content on properties of hot mixing epoxy asphalt binders. J. Mater. Civ. Eng. 2022, 34, 04022145. [Google Scholar] [CrossRef]
  19. Apostolidis, P.; Liu, X.; van de Ven, M.; Erkens, S.; Scarpas, T. Kinetic viscoelasticity of crosslinking epoxy asphalt. Transp. Res. Rec. 2019, 2673, 551–560. [Google Scholar] [CrossRef]
  20. Zhang, G. Study on Curing Deformation and Residual Stress of Variable Stiffness Composites. Ph.D. Thesis, Wuhan University of Technology, Wuhan, China, 2019. [Google Scholar]
  21. Gupta, A.M.; Macosko, C.W. Modeling strategy for systems with both stepwise and chainwise chemistry: Amine-epoxy networks with etherification. J. Polym. Sci. Part B Polym. Phys. 1990, 28, 2585–2606. [Google Scholar] [CrossRef]
  22. Wise, C.W.; Cook, W.D.; Goodwin, A.A. Chemico-diffusion kinetics of model epoxy-amine resins. Polymer 1997, 38, 3251–3261. [Google Scholar] [CrossRef]
  23. Lucio, B.; de la Fuente, J.L. Kinetic and thermodynamic analysis of the polymerization of polyurethanes by a rheological method. Thermochim. Acta 2016, 625, 28–35. [Google Scholar] [CrossRef]
  24. Boulkadid, M.K.; Touidjine, S.; Trache, D.; Belkhiri, S. Analytical methods for the assessment of curing kinetics of polyurethane binders for high-energy composites. Crit. Rev. Anal. Chem. 2022, 52, 1112–1121. [Google Scholar] [CrossRef] [PubMed]
  25. Apostolidis, P.; Liu, X.; Erkens, S.; Scarpas, T. Oxidative aging of epoxy asphalt. Int. J. Pavement Eng. 2022, 23, 1471–1481. [Google Scholar] [CrossRef]
  26. Huang, W.; Guo, W.; Wei, Y. Thermal effect on rheological properties of epoxy asphalt mixture and stress prediction for bridge deck paving. J. Mater. Civ. Eng. 2019, 31, 04019222. [Google Scholar] [CrossRef]
  27. Liu, M.; Hu, J.; Sun, J.; Li, Y.; Luo, S. Characterization of Roadway Epoxy Asphalt Binder with Different Epoxy Contents. J. Mater. Civ. Eng. 2023, 35, 04023144. [Google Scholar] [CrossRef]
  28. Sun, J.; Huang, W.; Lu, G.; Luo, S.; Li, Y. Investigation of the performance and micro-evolution mechanism of low-content thermosetting epoxy asphalt binder towards sustainable highway and bridge decks paving. J. Clean. Prod. 2023, 384, 135588. [Google Scholar] [CrossRef]
  29. Zhang, Y.; Pan, X.; Sun, Y.; Xu, W.; Pan, Y.; Xie, H.; Cheng, R. Flame retardancy, thermal, and mechanical properties of mixed flame retardant modified epoxy asphalt binders. Constr. Build. Mater. 2014, 68, 62–67. [Google Scholar] [CrossRef]
  30. Si, J.; Li, Y.; Yu, X. Curing behavior and mechanical properties of an eco-friendly cold-mixed epoxy asphalt. Mater. Struct. 2019, 52, 81. [Google Scholar] [CrossRef]
  31. Huang, W.; Guo, W.; Wei, Y. Prediction of Paving Performance for Epoxy Asphalt Mixture by Its Time- and Temperature-Dependent Properties. J. Mater. Civ. Eng. 2020, 32, 04020017. [Google Scholar] [CrossRef]
  32. Xu, J.; Ma, B.; Mao, W.; Wang, X. Strength characteristics and prediction of epoxy resin pavement mixture. Constr. Build. Mater. 2021, 283, 122682. [Google Scholar] [CrossRef]
  33. Zhang, W.; Li, Q.; Wang, J.; Zhao, Z.; Jin, D. Physical and chemical evaluation of adhesion recovery property of aged high-viscosity asphalt based on specialized composite rejuvenators. J. Clean. Prod. 2023, 414, 137758. [Google Scholar] [CrossRef]
  34. Li, Y.; Li, J.; Ma, S.; Luo, Y. Different catalytic systems on hydroxyl-terminated GAP and PET with poly-isocyanate: Curing kinetics study using dynamic in situ IR spectroscopy. Int. J. Polym. Anal. Charact. 2016, 21, 495–503. [Google Scholar] [CrossRef]
  35. Xu, L.; Li, C.; Ng, K.S. In-situ monitoring of urethane formation by FTIR and Raman spectroscopy. J. Phys. Chem. A 2000, 104, 3952–3957. [Google Scholar] [CrossRef]
  36. Cong, P.; Luo, W.; Xu, P.; Zhang, Y. Chemical and physical properties of hot mixing epoxy asphalt binders. Constr. Build. Mater. 2019, 198, 1–9. [Google Scholar] [CrossRef]
  37. Wekumbura, C.; Stastna, J.; Zanzotto, L. Destruction and recovery of internal structure in polymer-modified asphalts. J. Mater. Civ. Eng. 2007, 19, 227–232. [Google Scholar] [CrossRef]
  38. Jiang, J. Investigation of the Fatigue Property and Internal Structure of Asphalt Mixtures Based on Multiscale Methods. Ph.D. Thesis, Southeast University, Nanjing, China, 2019. [Google Scholar]
  39. Kincal, D.; Özkar, S. Kinetic study of the reaction between hydroxyl-terminated polybutadiene and isophorone diisocyanate in bulk by quantitative FTIR spectroscopy. J. Appl. Polym. Sci. 1997, 66, 1979–1983. [Google Scholar] [CrossRef]
  40. Martínez-Miranda, M.; García-Martínez, V.; Gude, M. Gel point determination of a thermoset prepreg by means of rheology. Polym. Test. 2019, 78, 105950. [Google Scholar] [CrossRef]
  41. Hu, H.; Li, S.; Wang, J.; Zu, L.; Cao, D.; Zhong, Y. Monitoring the gelation and effective chemical shrinkage of composite curing process with a novel FBG approach. Compos. Struct. 2017, 176, 187–194. [Google Scholar] [CrossRef]
  42. Shah, D.U.; Schubel, P.J. Evaluation of cure shrinkage measurement techniques for thermosetting resins. Polym. Test. 2010, 29, 629–639. [Google Scholar] [CrossRef]
Figure 1. Formation process of thermoset network: (a) formation; (b) branching; (c) crosslinking.
Coatings 13 01567 g001
Figure 2. Example of baseline correction.
Coatings 13 01567 g002
Figure 3. Rheological test equipment and sample preparation: (a) parallel plate; (b) solid super-tough resin (STR) sample; (c) solid torsion bar fixture.
Coatings 13 01567 g003
Figure 4. Evolution of STR characteristic peak during curing.
Coatings 13 01567 g004
Figure 5. Evolution of STR curing parameters: (a) variation in absorbance index; (b) variation in curing degree.
Coatings 13 01567 g005
Figure 6. Evolution of curing reaction rate.
Coatings 13 01567 g006
Figure 7. Results of linear fitting and validation: (a) linear fitting; (b) result validation.
Coatings 13 01567 g007
Figure 8. Results of time sweep test at different temperatures: (a) 35 °C; (b) 50 °C; (c) 65 °C; (d) 80 °C.
Coatings 13 01567 g008aCoatings 13 01567 g008b
Figure 9. Results of the linear viscoelastic (LVE) region test: (a) short-term curing; (b) long-term curing; (c) relationship between curing durations and LVE region.
Coatings 13 01567 g009aCoatings 13 01567 g009b
Figure 10. Results of weight loss monitoring: (a) evolution of residual weight; (b) evolution of weight loss.
Coatings 13 01567 g010
Figure 11. Results of nonlinear fitting: (a) 35 °C; (b) 50 °C; (c) 65 °C; (d) 80 °C.
Coatings 13 01567 g011
Table 1. Typical properties of the main agent and curing agent.
PropertiesMain AgentCuring Agent
ResultsResults
AppearanceClear liquidLight yellow liquid
Brookfield Viscosity (23 °C, mPa·s)656223
Specific Gravity (23 °C, g/cm3)1.131.02
Table 2. Details of experimental schemes.
TestsCuring SchemesTest Schemes
Curing Temperatures/°CCuring Durations/hTest Temperatures/°CStrain/%Frequency/Hz
FTIR Test35, 50, 65, 800–48025--
Weight Loss Test35, 50, 65, 80--
Time Sweep Test0–1235, 50, 65, 8011
LVE Test0–720250.001–20/
1 × 10⁻⁵–0.02
1.59
Table 3. Fitting parameters of the nth-order model.
Parameters35 °C50 °C65 °C80 °C
k53.99756.20060.95368.932
n1.6631.5431.5501.448
Table 4. Gel point time and curing degree of STR.
Temperatures35 °C50 °C65 °C80 °CAverage
Gel Point Time/min480330297189-
Gel Point Curing Degree/%76.6976.0175.0675.16475.73
Table 5. Parameters of fitting results.
Temperatures/°CABCR2
3590.838.5271.180.99
5086.4913.82204.10.99
6582.9714.02110.960.99
8080.3916.0745.810.97
Relationship between T and A, B, CA = −0.23 × T + 98.53
R2 = 0.99
B = 0.15 × T + 4.32
R2 = 0.84
C = 452.89 − 5.13 × T
R2 = 0.99
-
Disclaimer/Publisher’s Note: The statements, opinions and data contained in all publications are solely those of the individual author(s) and contributor(s) and not of MDPI and/or the editor(s). MDPI and/or the editor(s) disclaim responsibility for any injury to people or property resulting from any ideas, methods, instructions or products referred to in the content.