

Study of the Design and Mechanical Properties of the Mix Proportion for Desulfurization Gypsum–Fly Ash Flowable Lightweight Soil

Abstract
:1. Introduction
2. Test Materials and Test Plans
2.1. Material
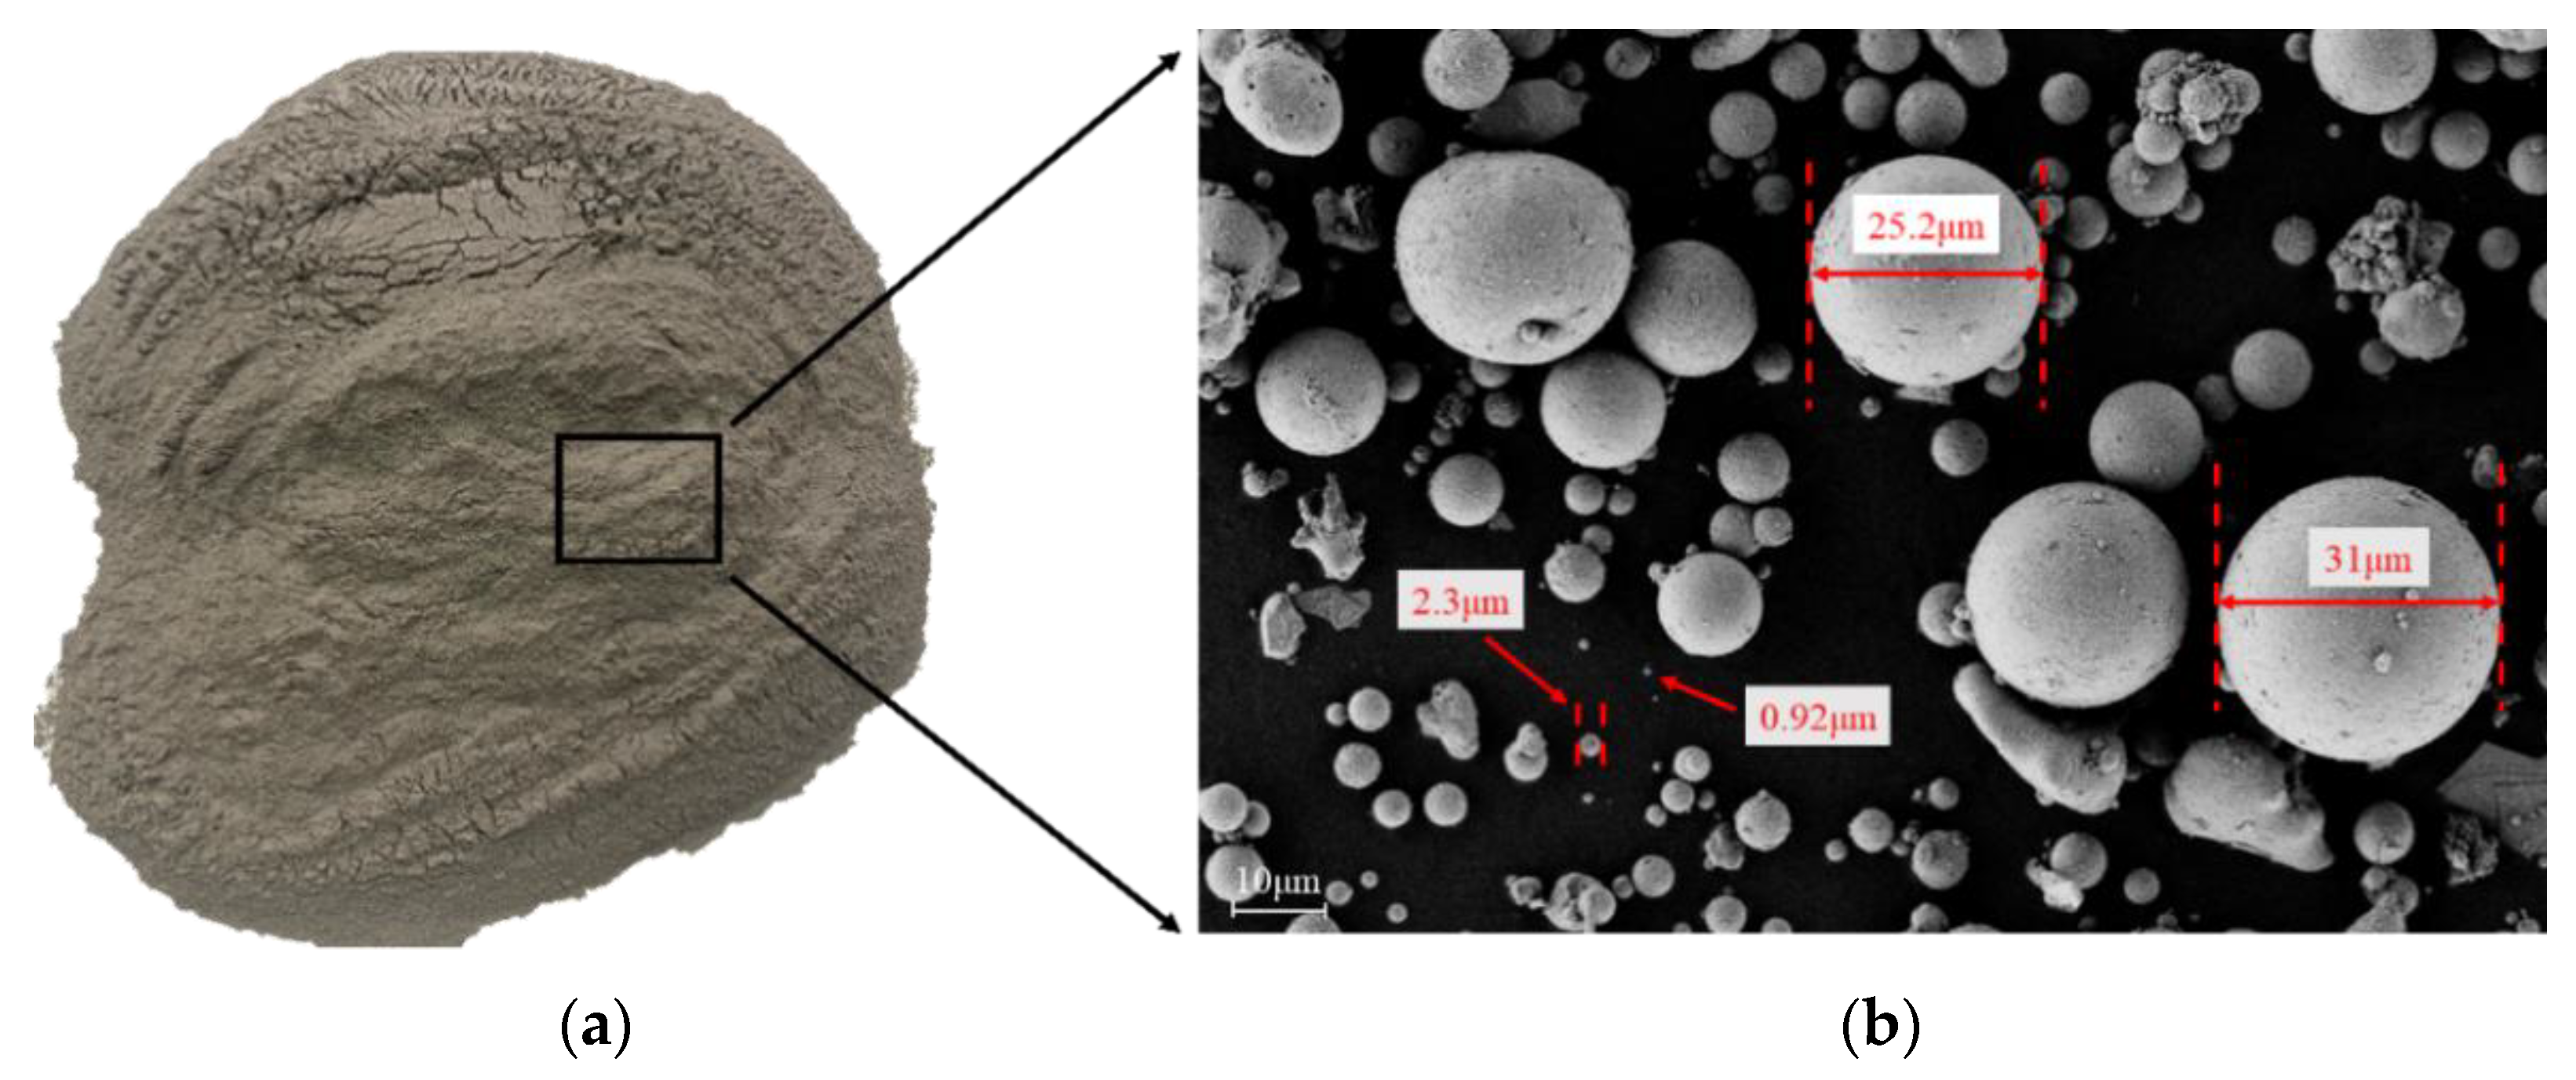
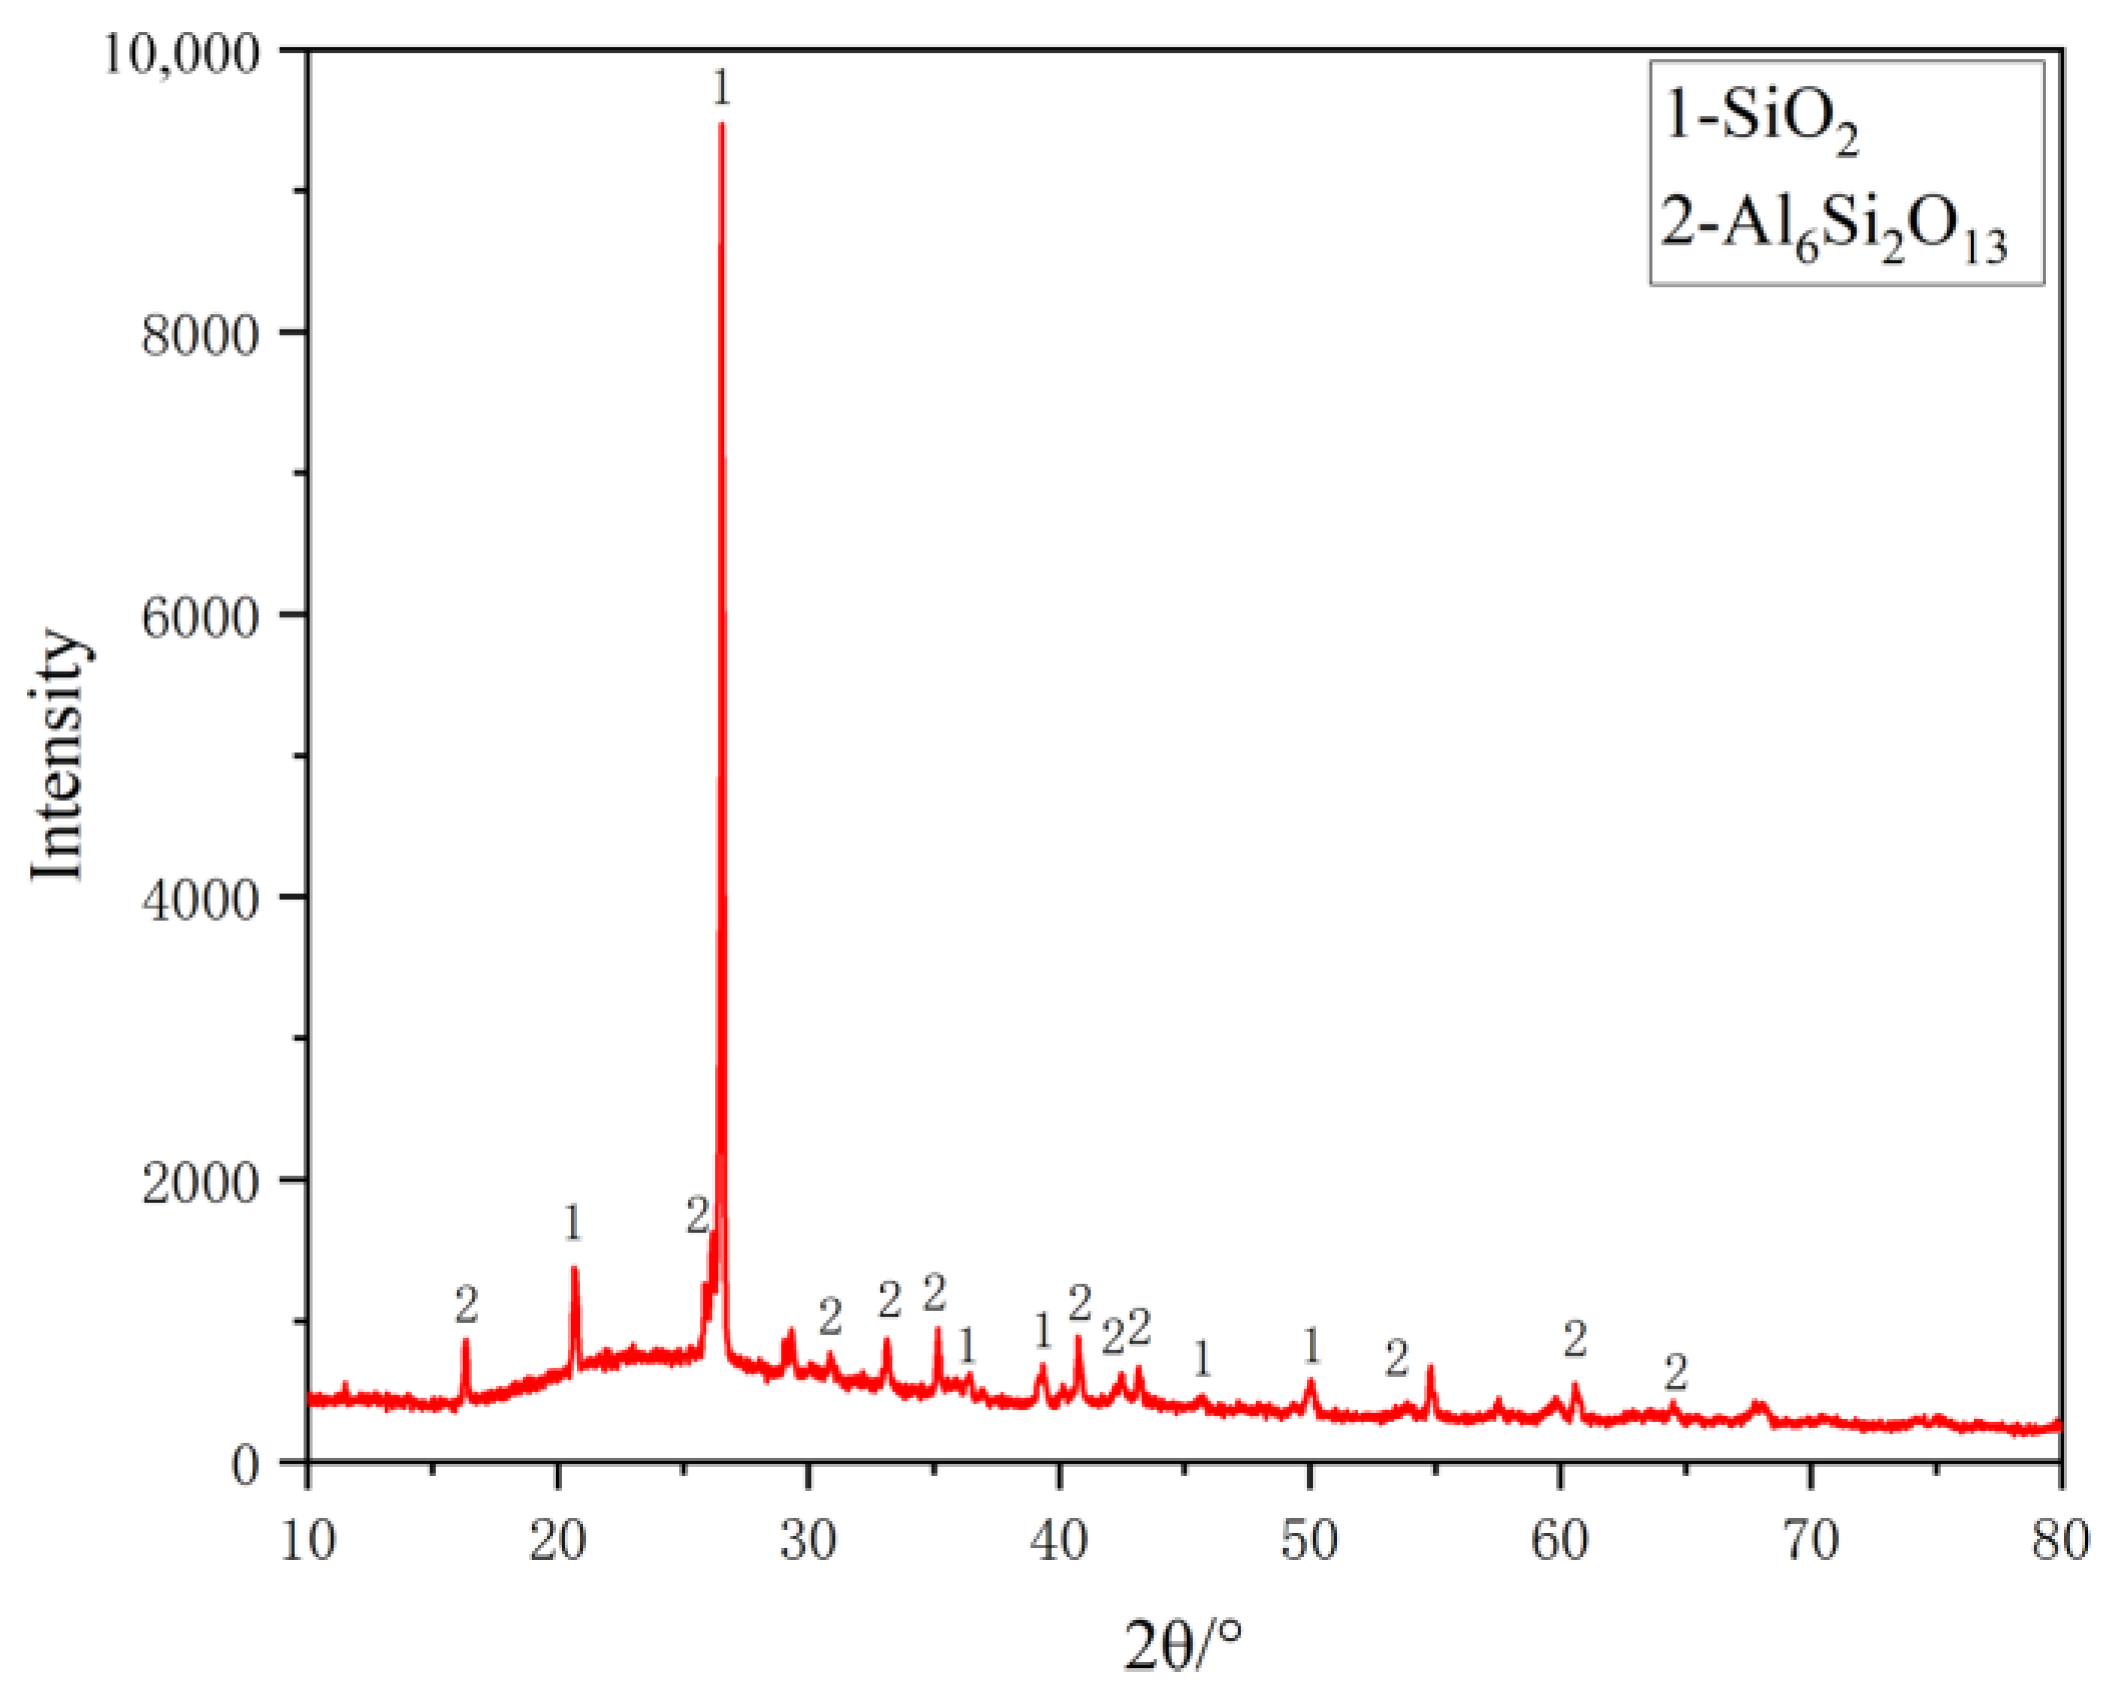
2.1.1. Fly Ash
2.1.2. Desulfurization Gypsum
2.1.3. Cement
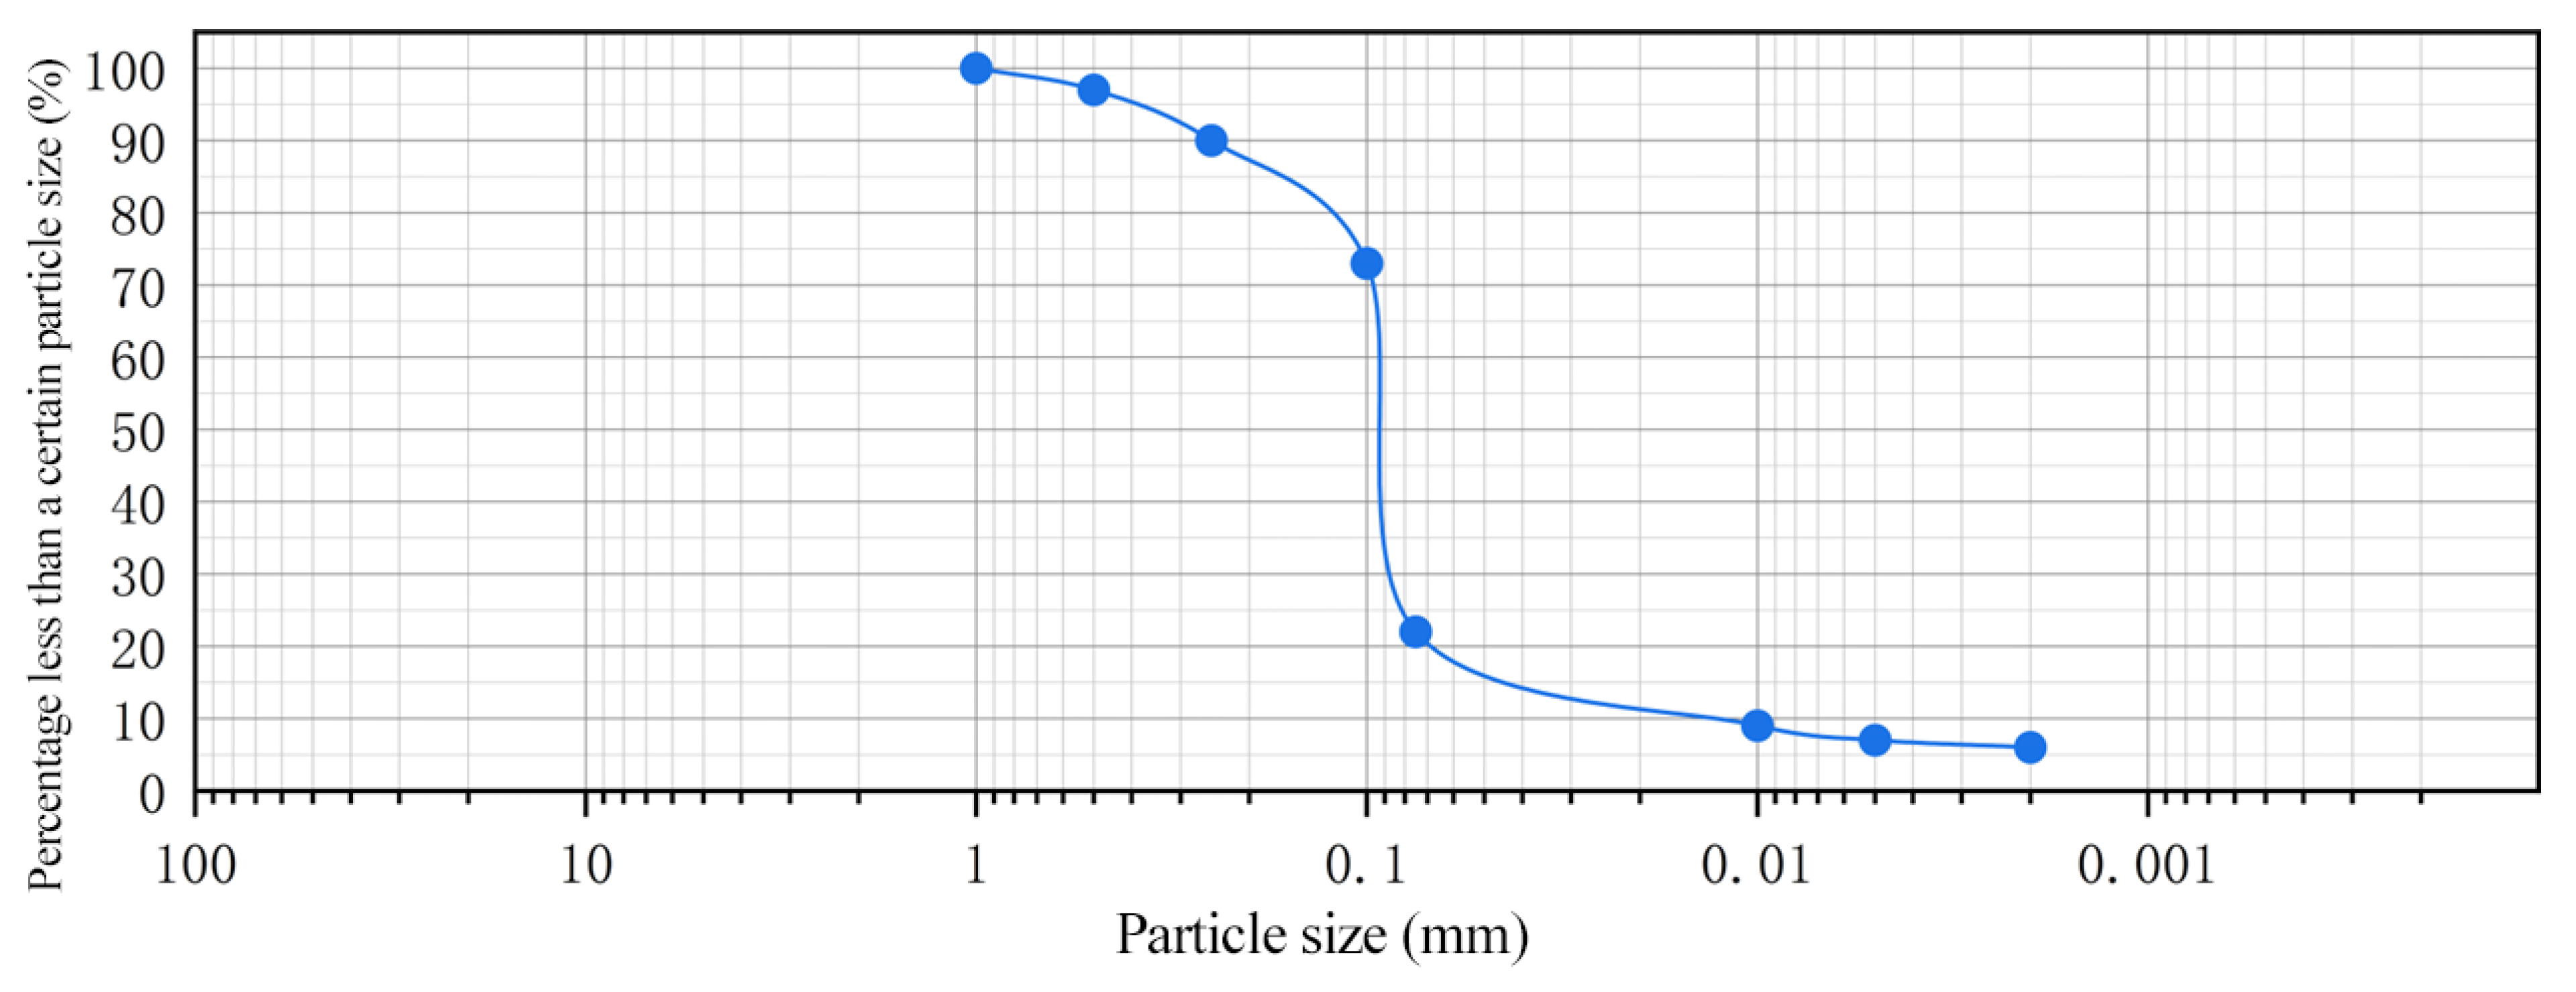
2.1.4. Silt
2.2. Material Preparation and Mix Ratio Plan
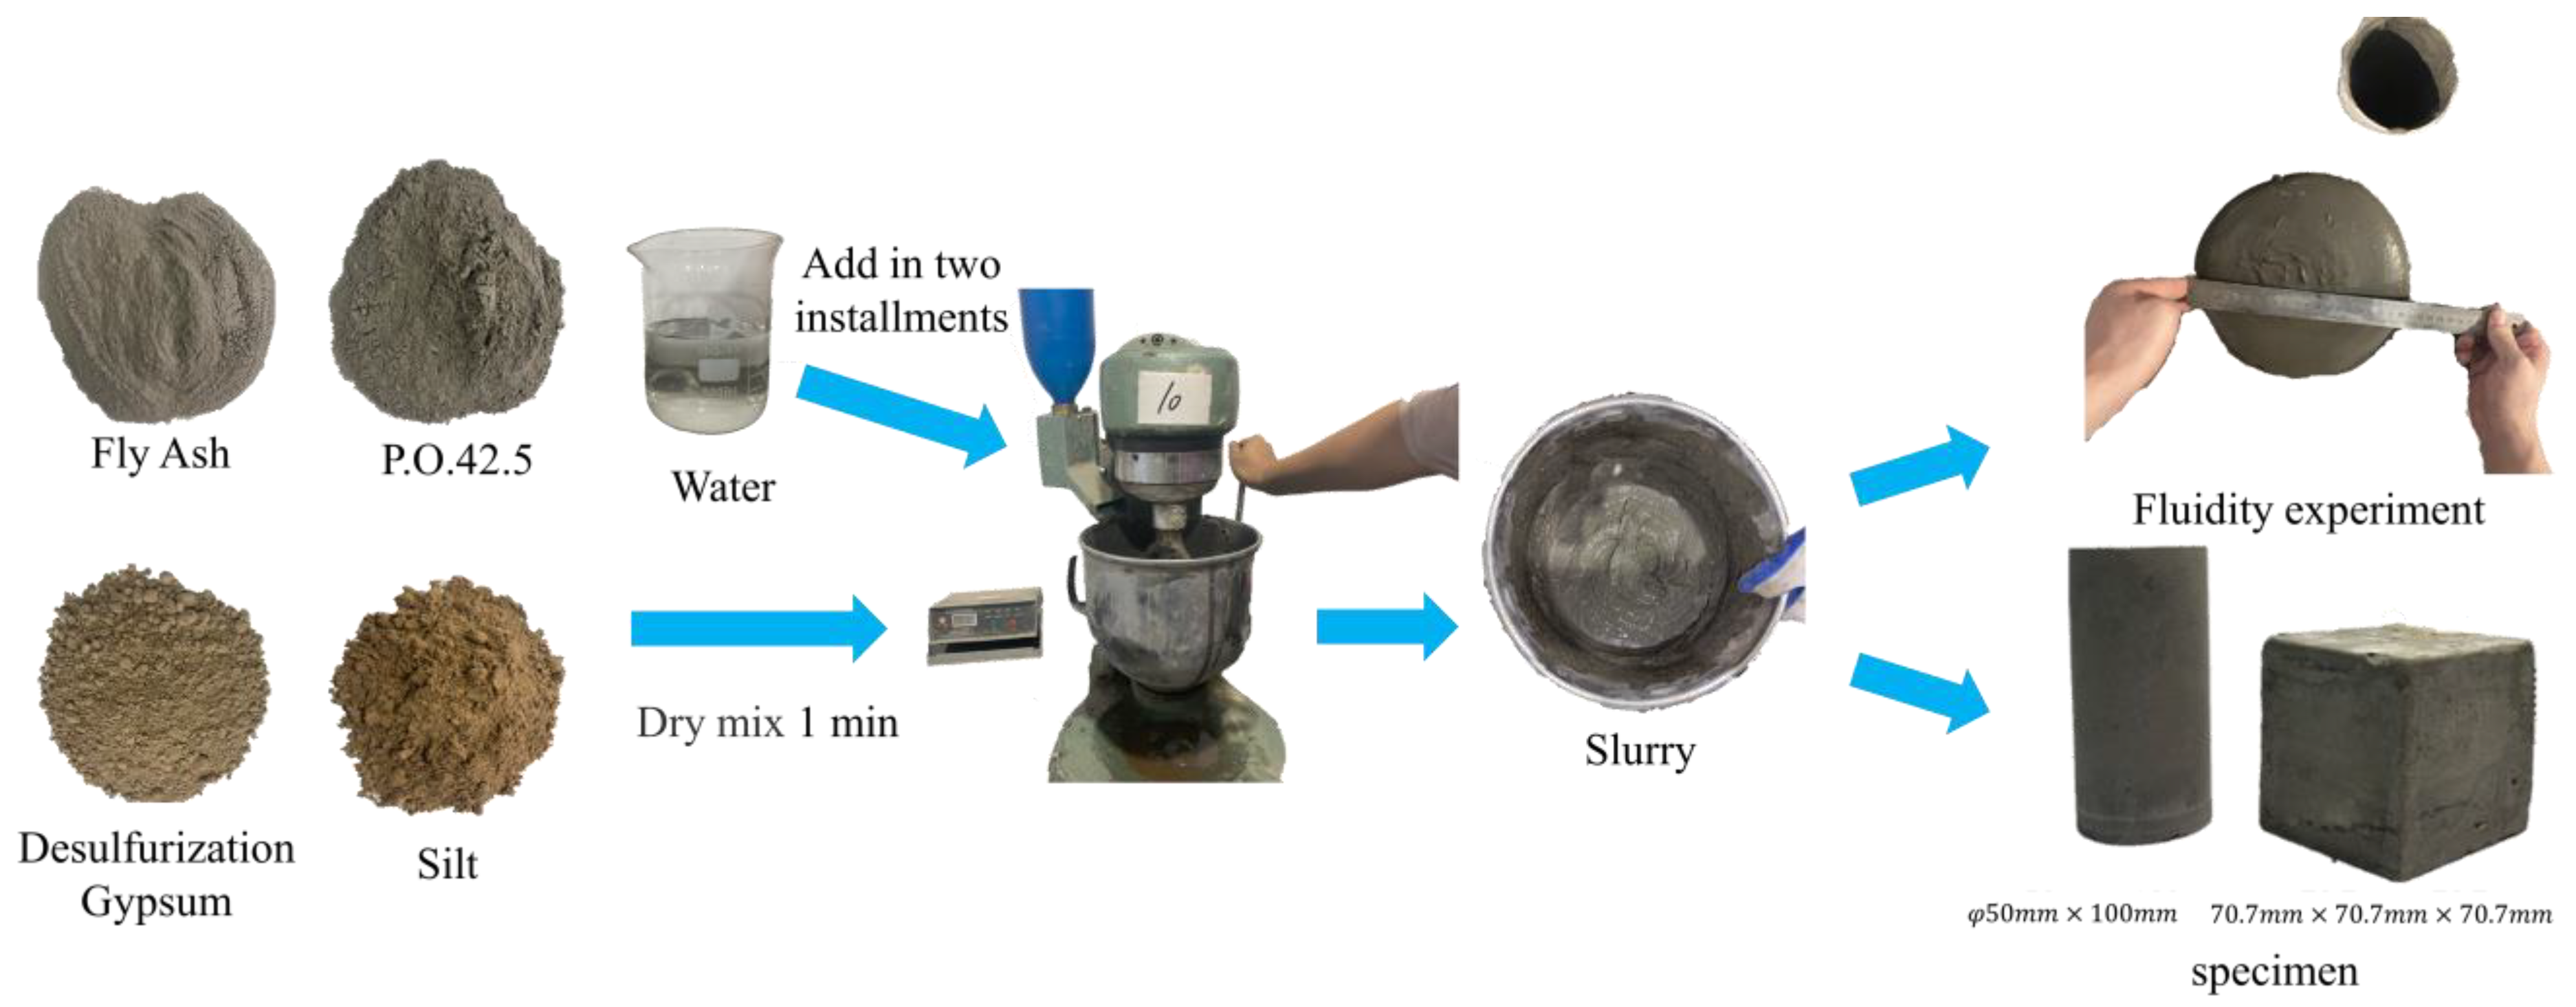
2.2.1. Material Preparation
2.2.2. Mix Proportion Design Plan
2.3. Experimental Plan
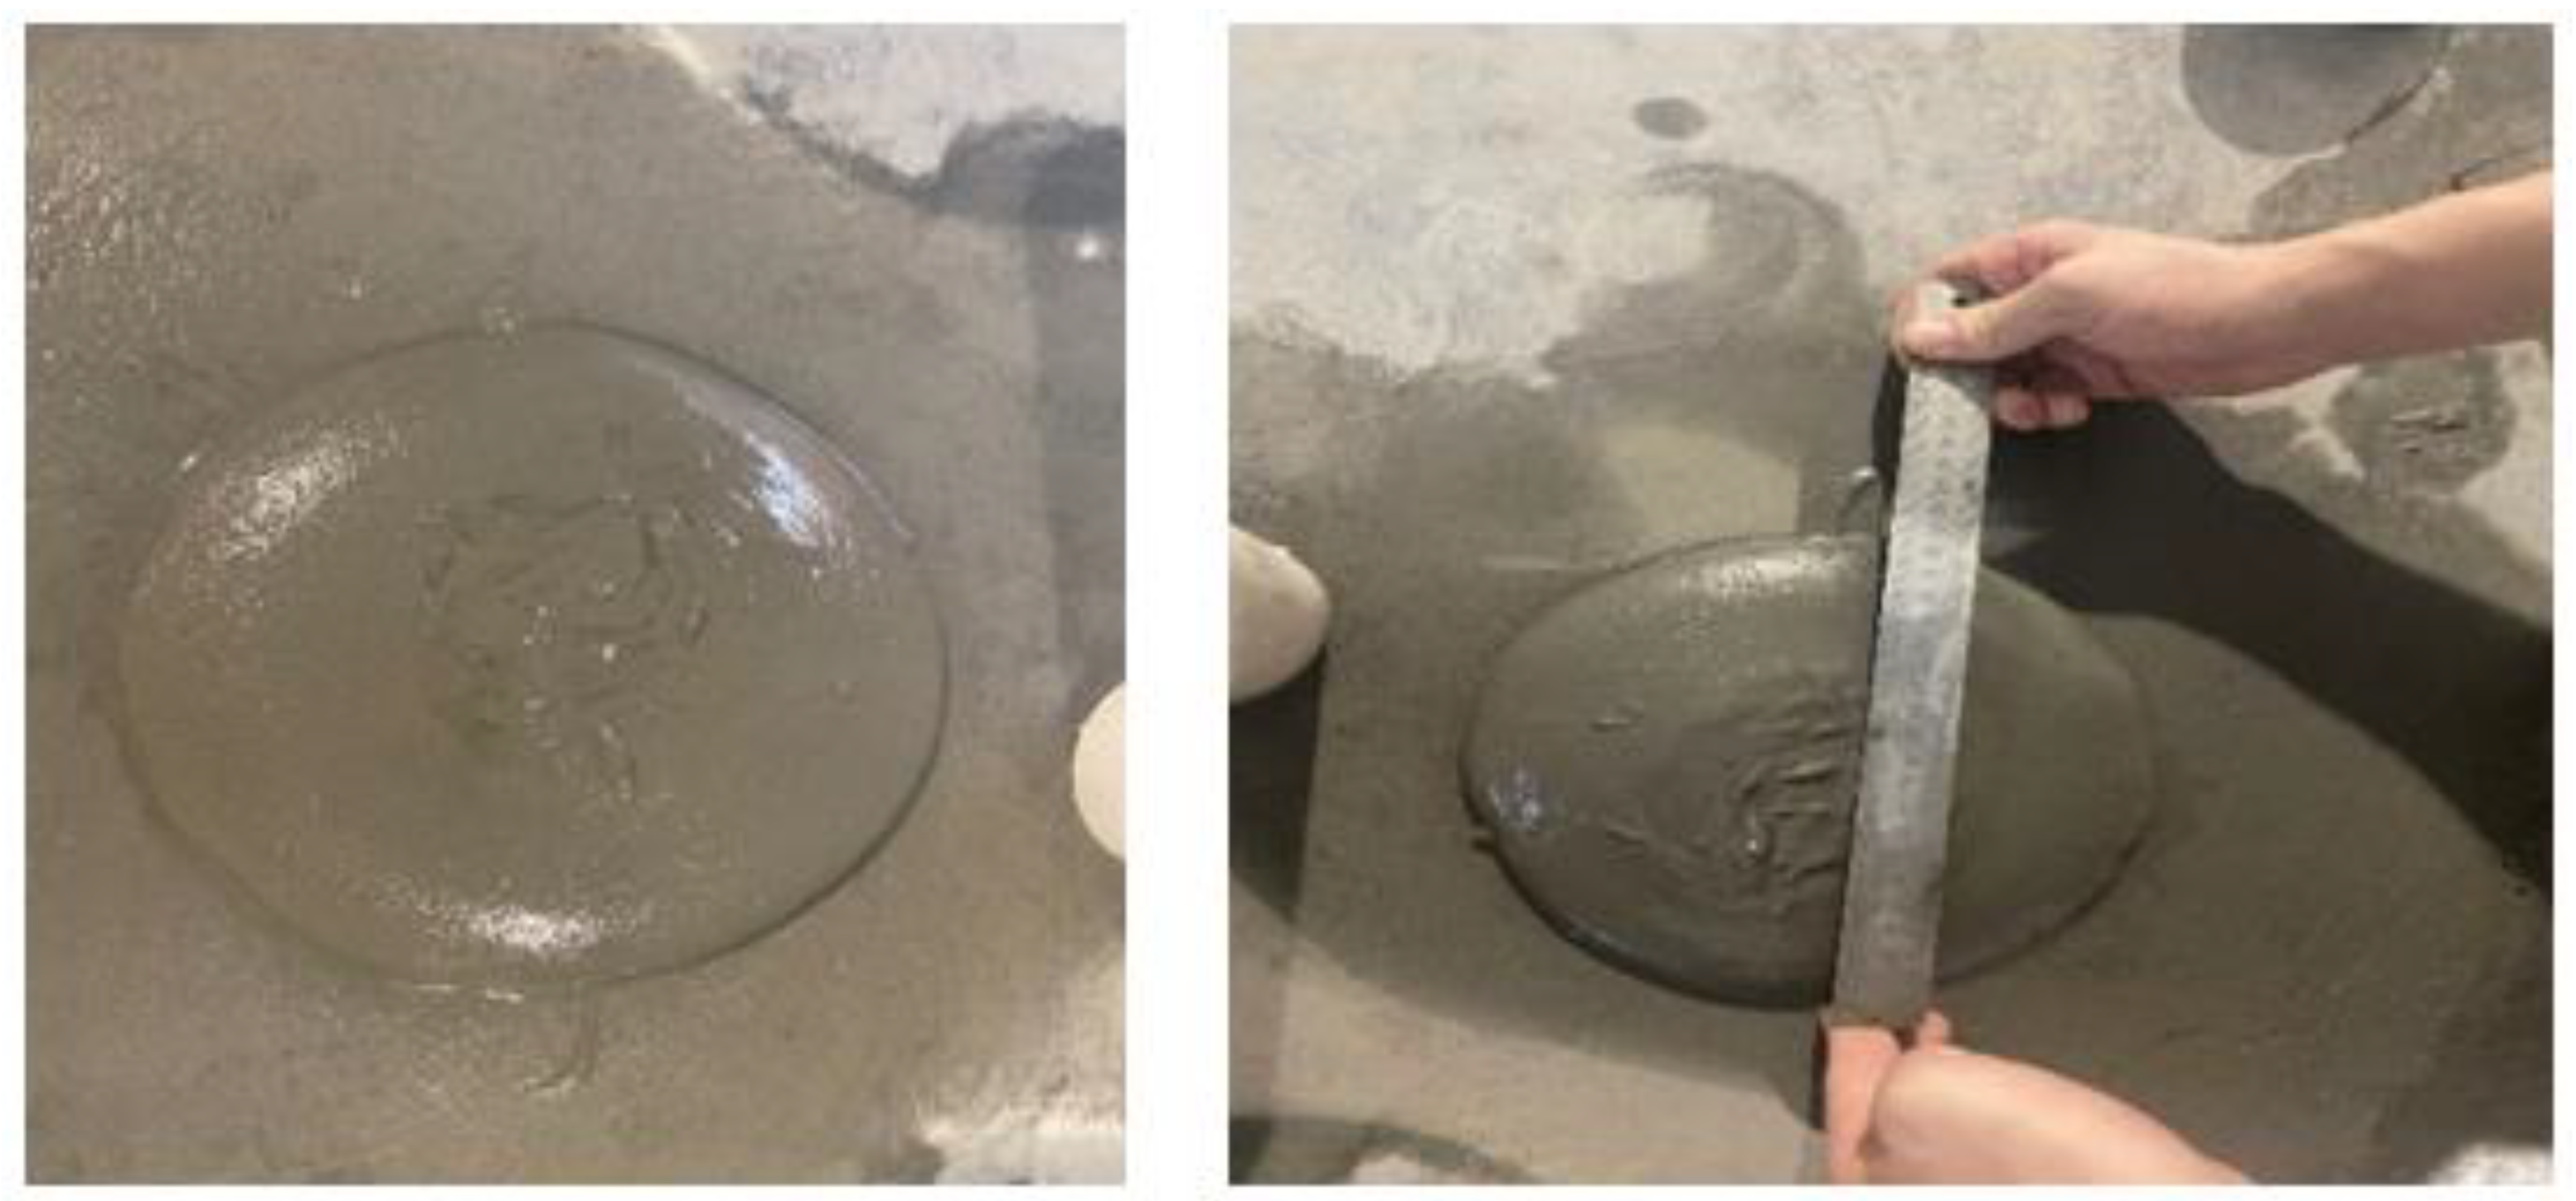
2.3.1. Flowability Test Method and Evaluation Index
Flowability Test Method
Liquidity Evaluation Indicators
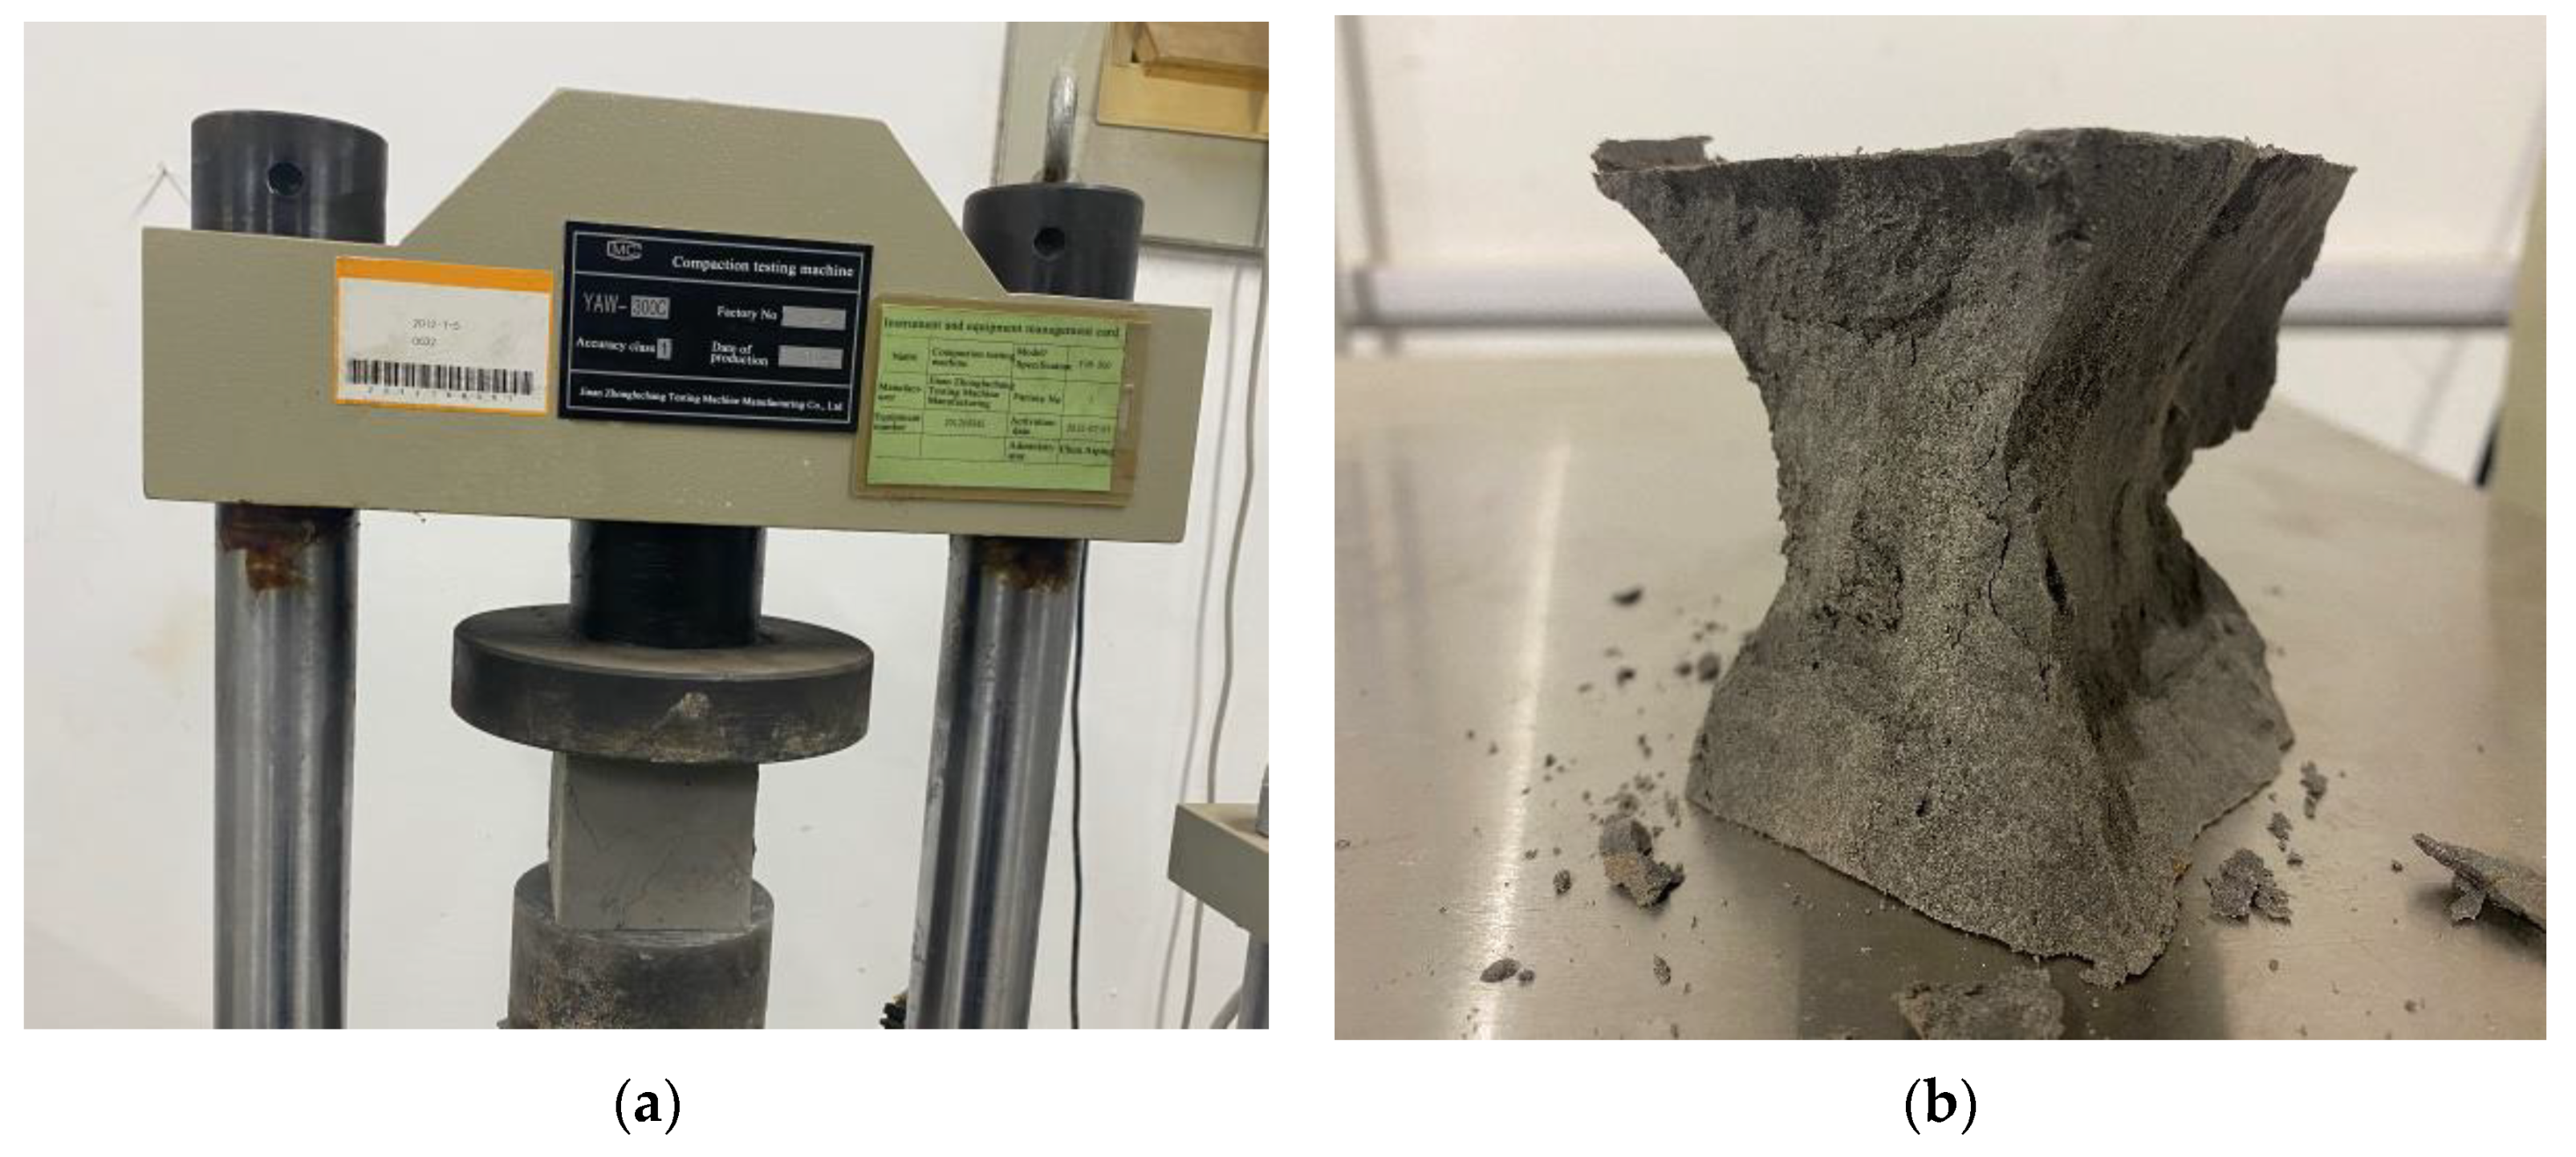
2.3.2. Unconfined Compressive Strength Test
2.3.3. Uniaxial and Biaxial Compressive Test
3. Results and Discussion
3.1. Flowability Research
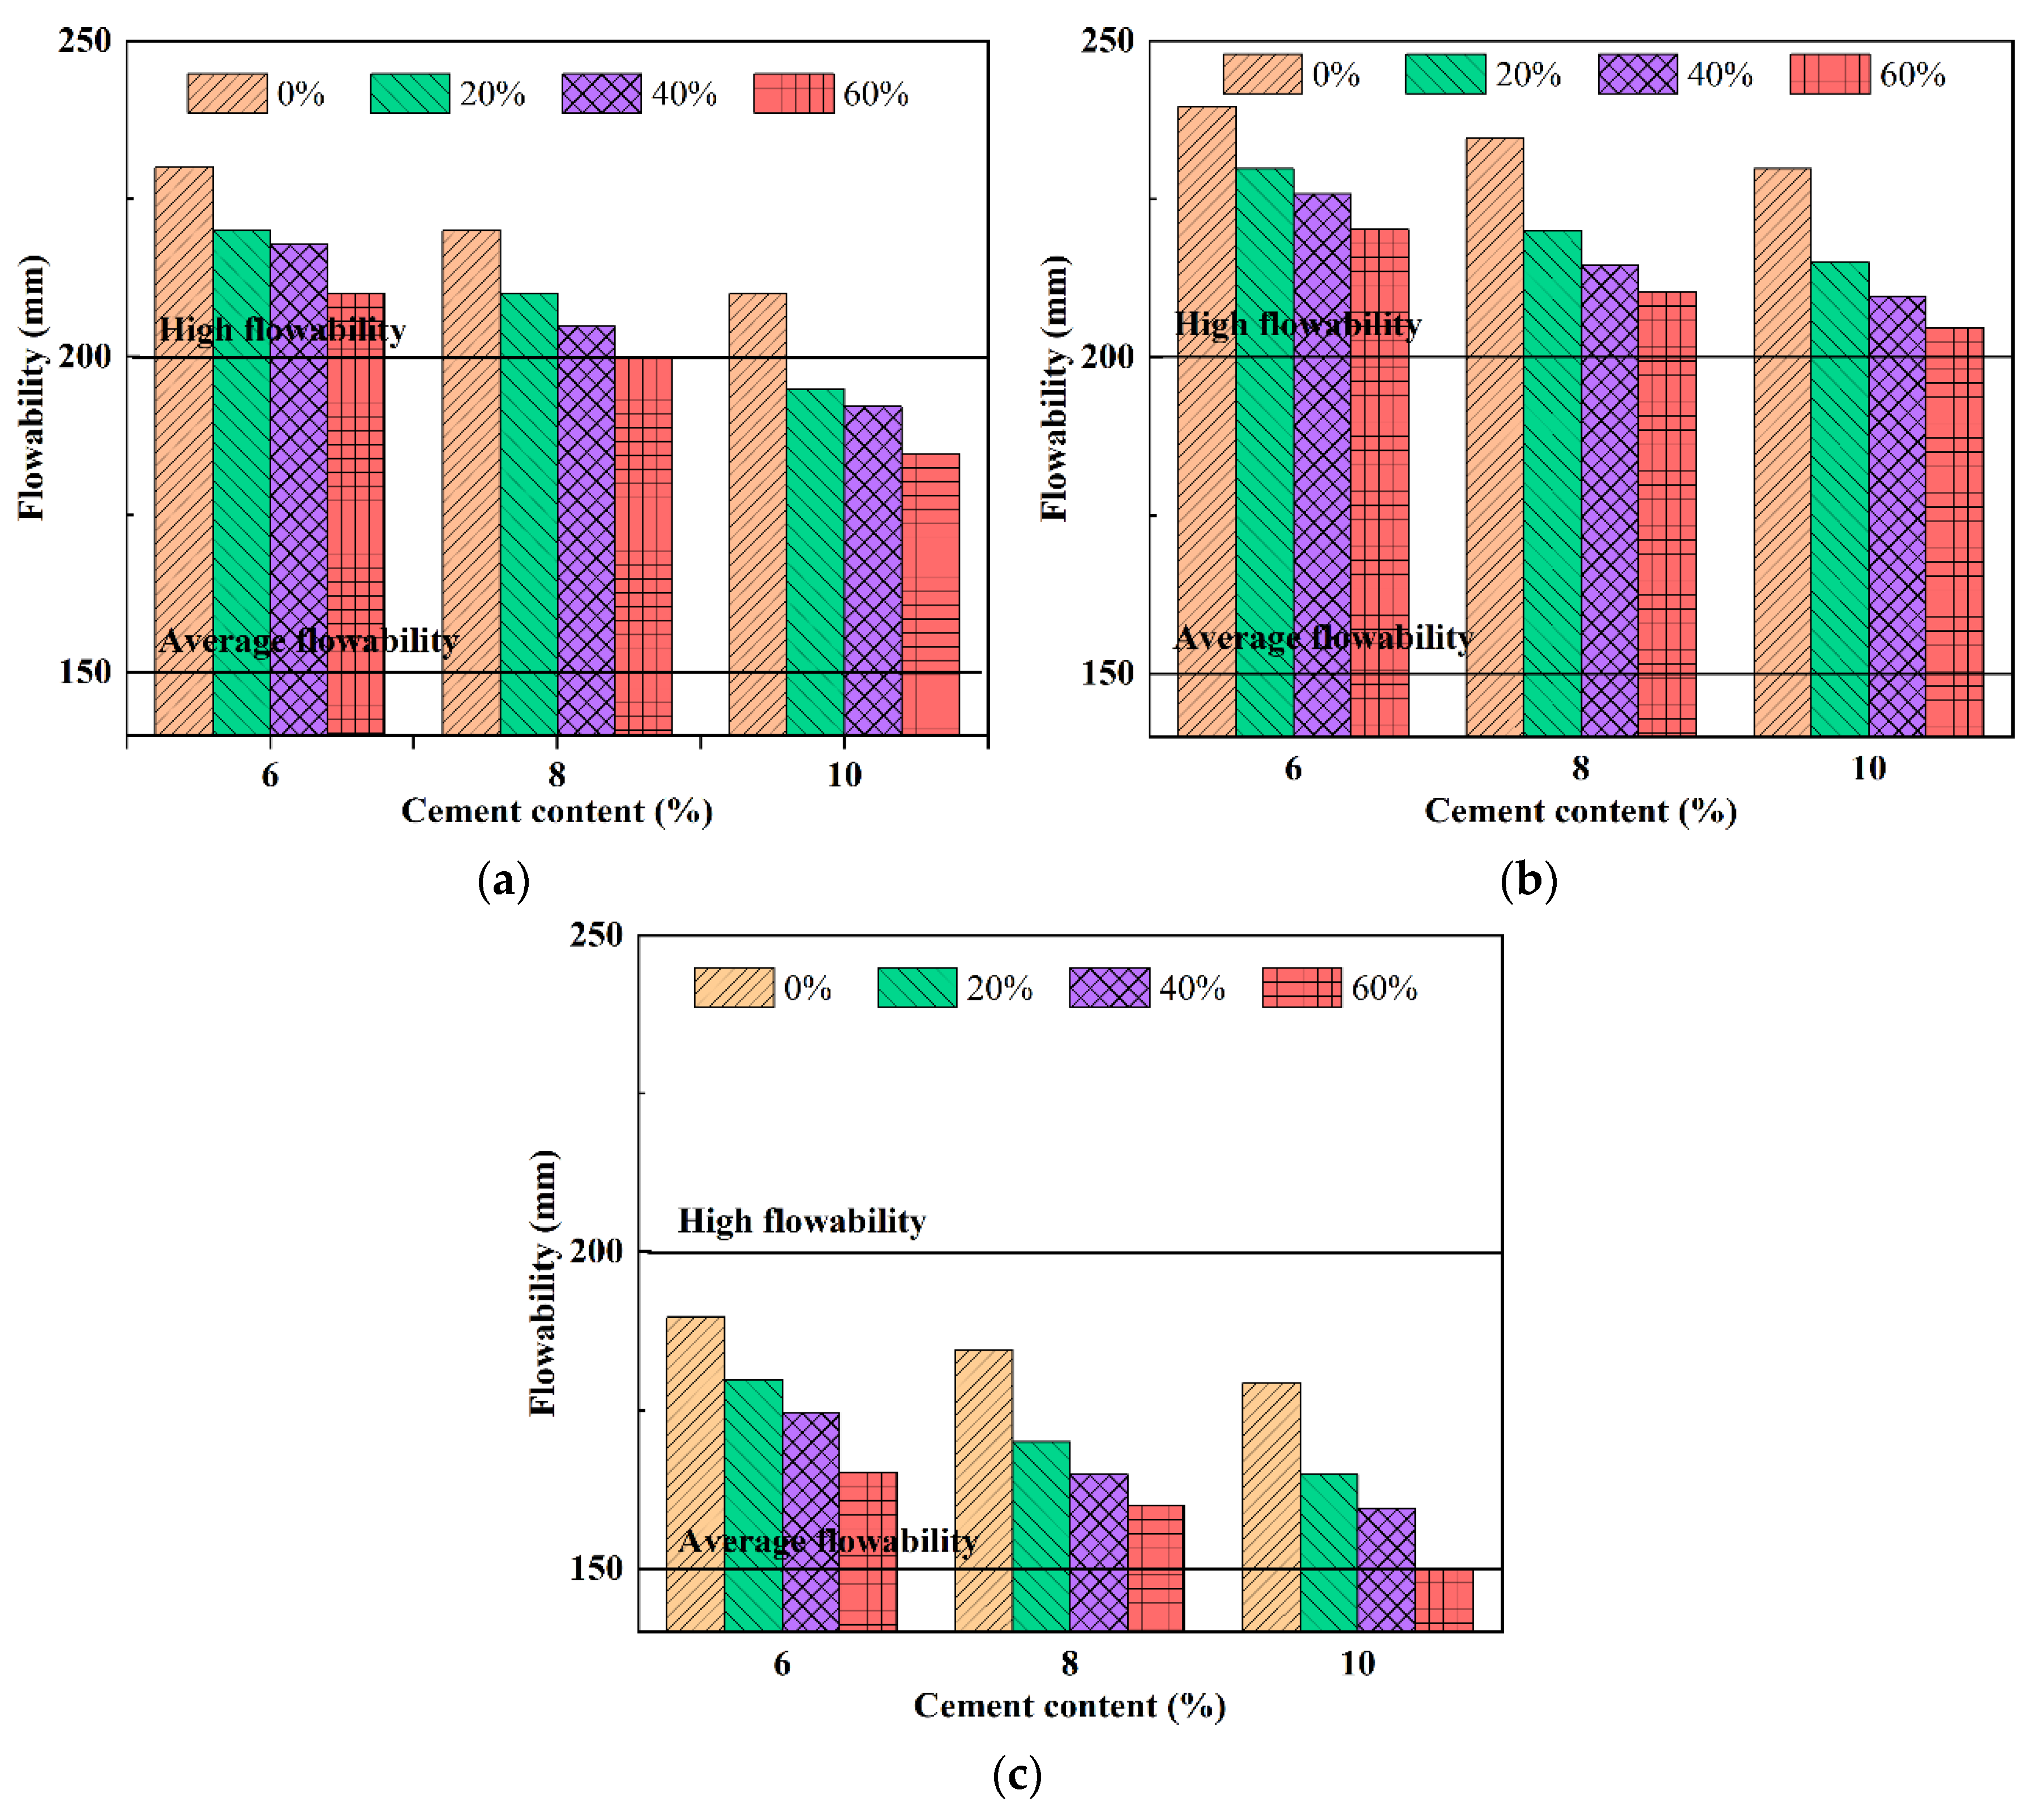
3.1.1. The Influence of Cement Content and Silt Content on Fluidity
- (1)
- Cement has high activity. The hydration reaction can take place in a relatively short time, and the more hydration products generated, the more unfavorable the flowability of the desulfurization gypsum–fly ash flowable lightweight soil.
- (2)
- When the water solid ratio is fixed, the specific surface area of cement is relatively large. An increase in cement content will lead to a decrease in the fluidity of the slurry.
- (3)
- The cement content selected in this study is relatively small, and the increasing gradient of the content is only 2%. Therefore, the influence of cement content on the fluidity of the slurry is also relatively small.
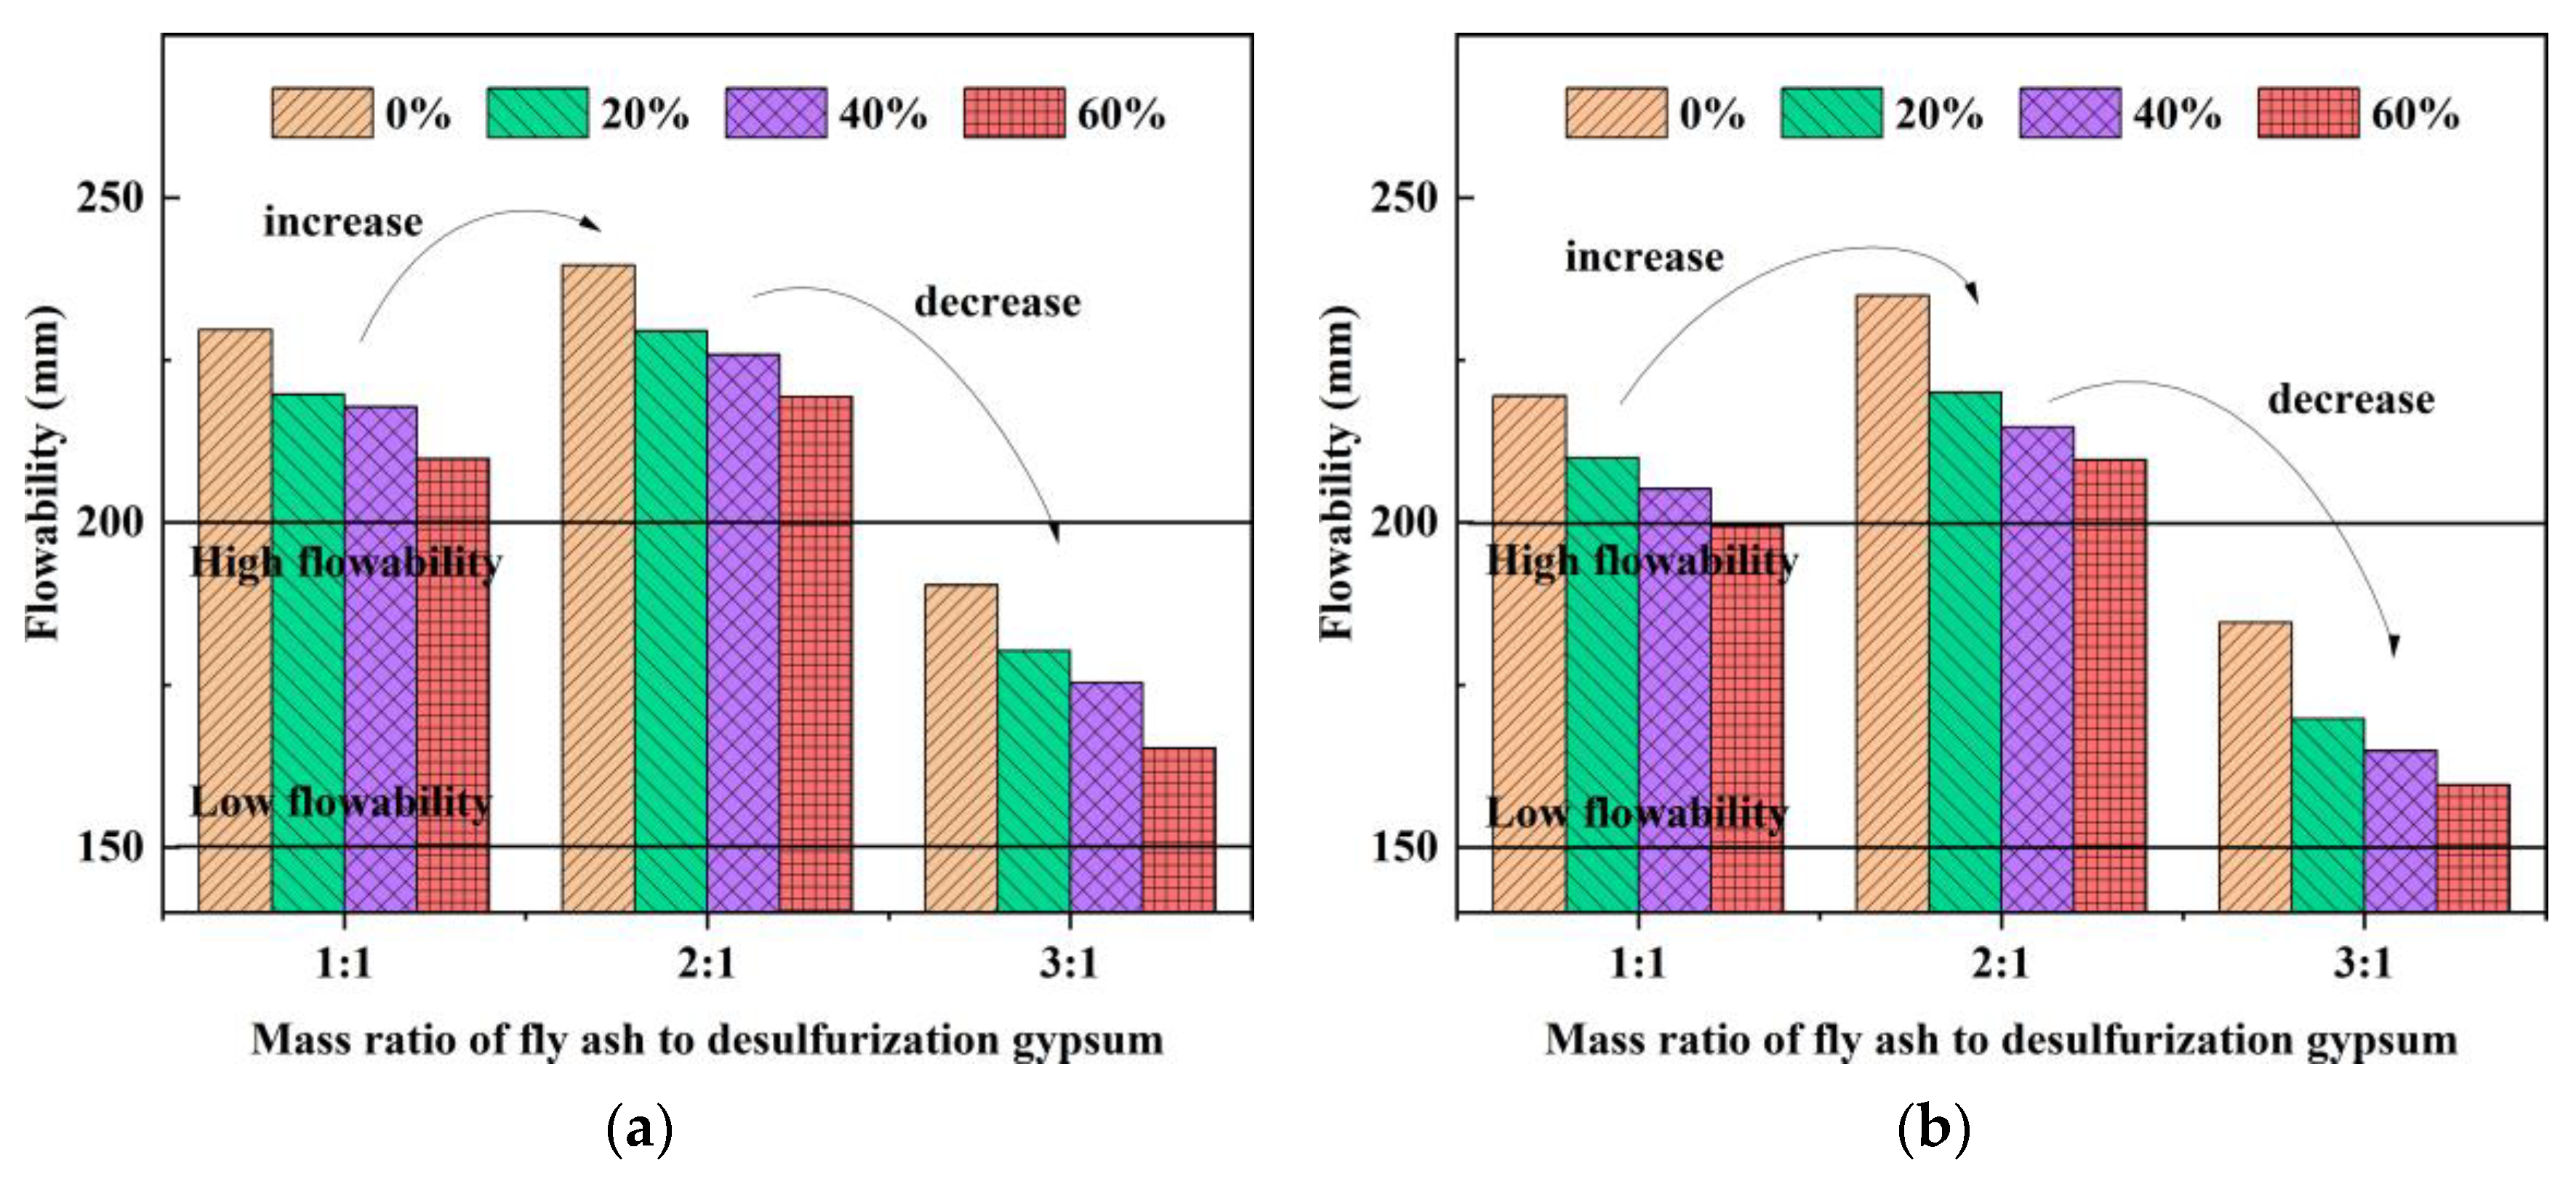
3.1.2. The Influence of the Mass Ratio of Fly Ash to Desulfurization Gypsum on Fluidity
3.2. Research on Unconfined Compressive Strength
The Influence of Age and Mass Ratio of Fly Ash to Desulfurization Gypsum on Compressive Strength
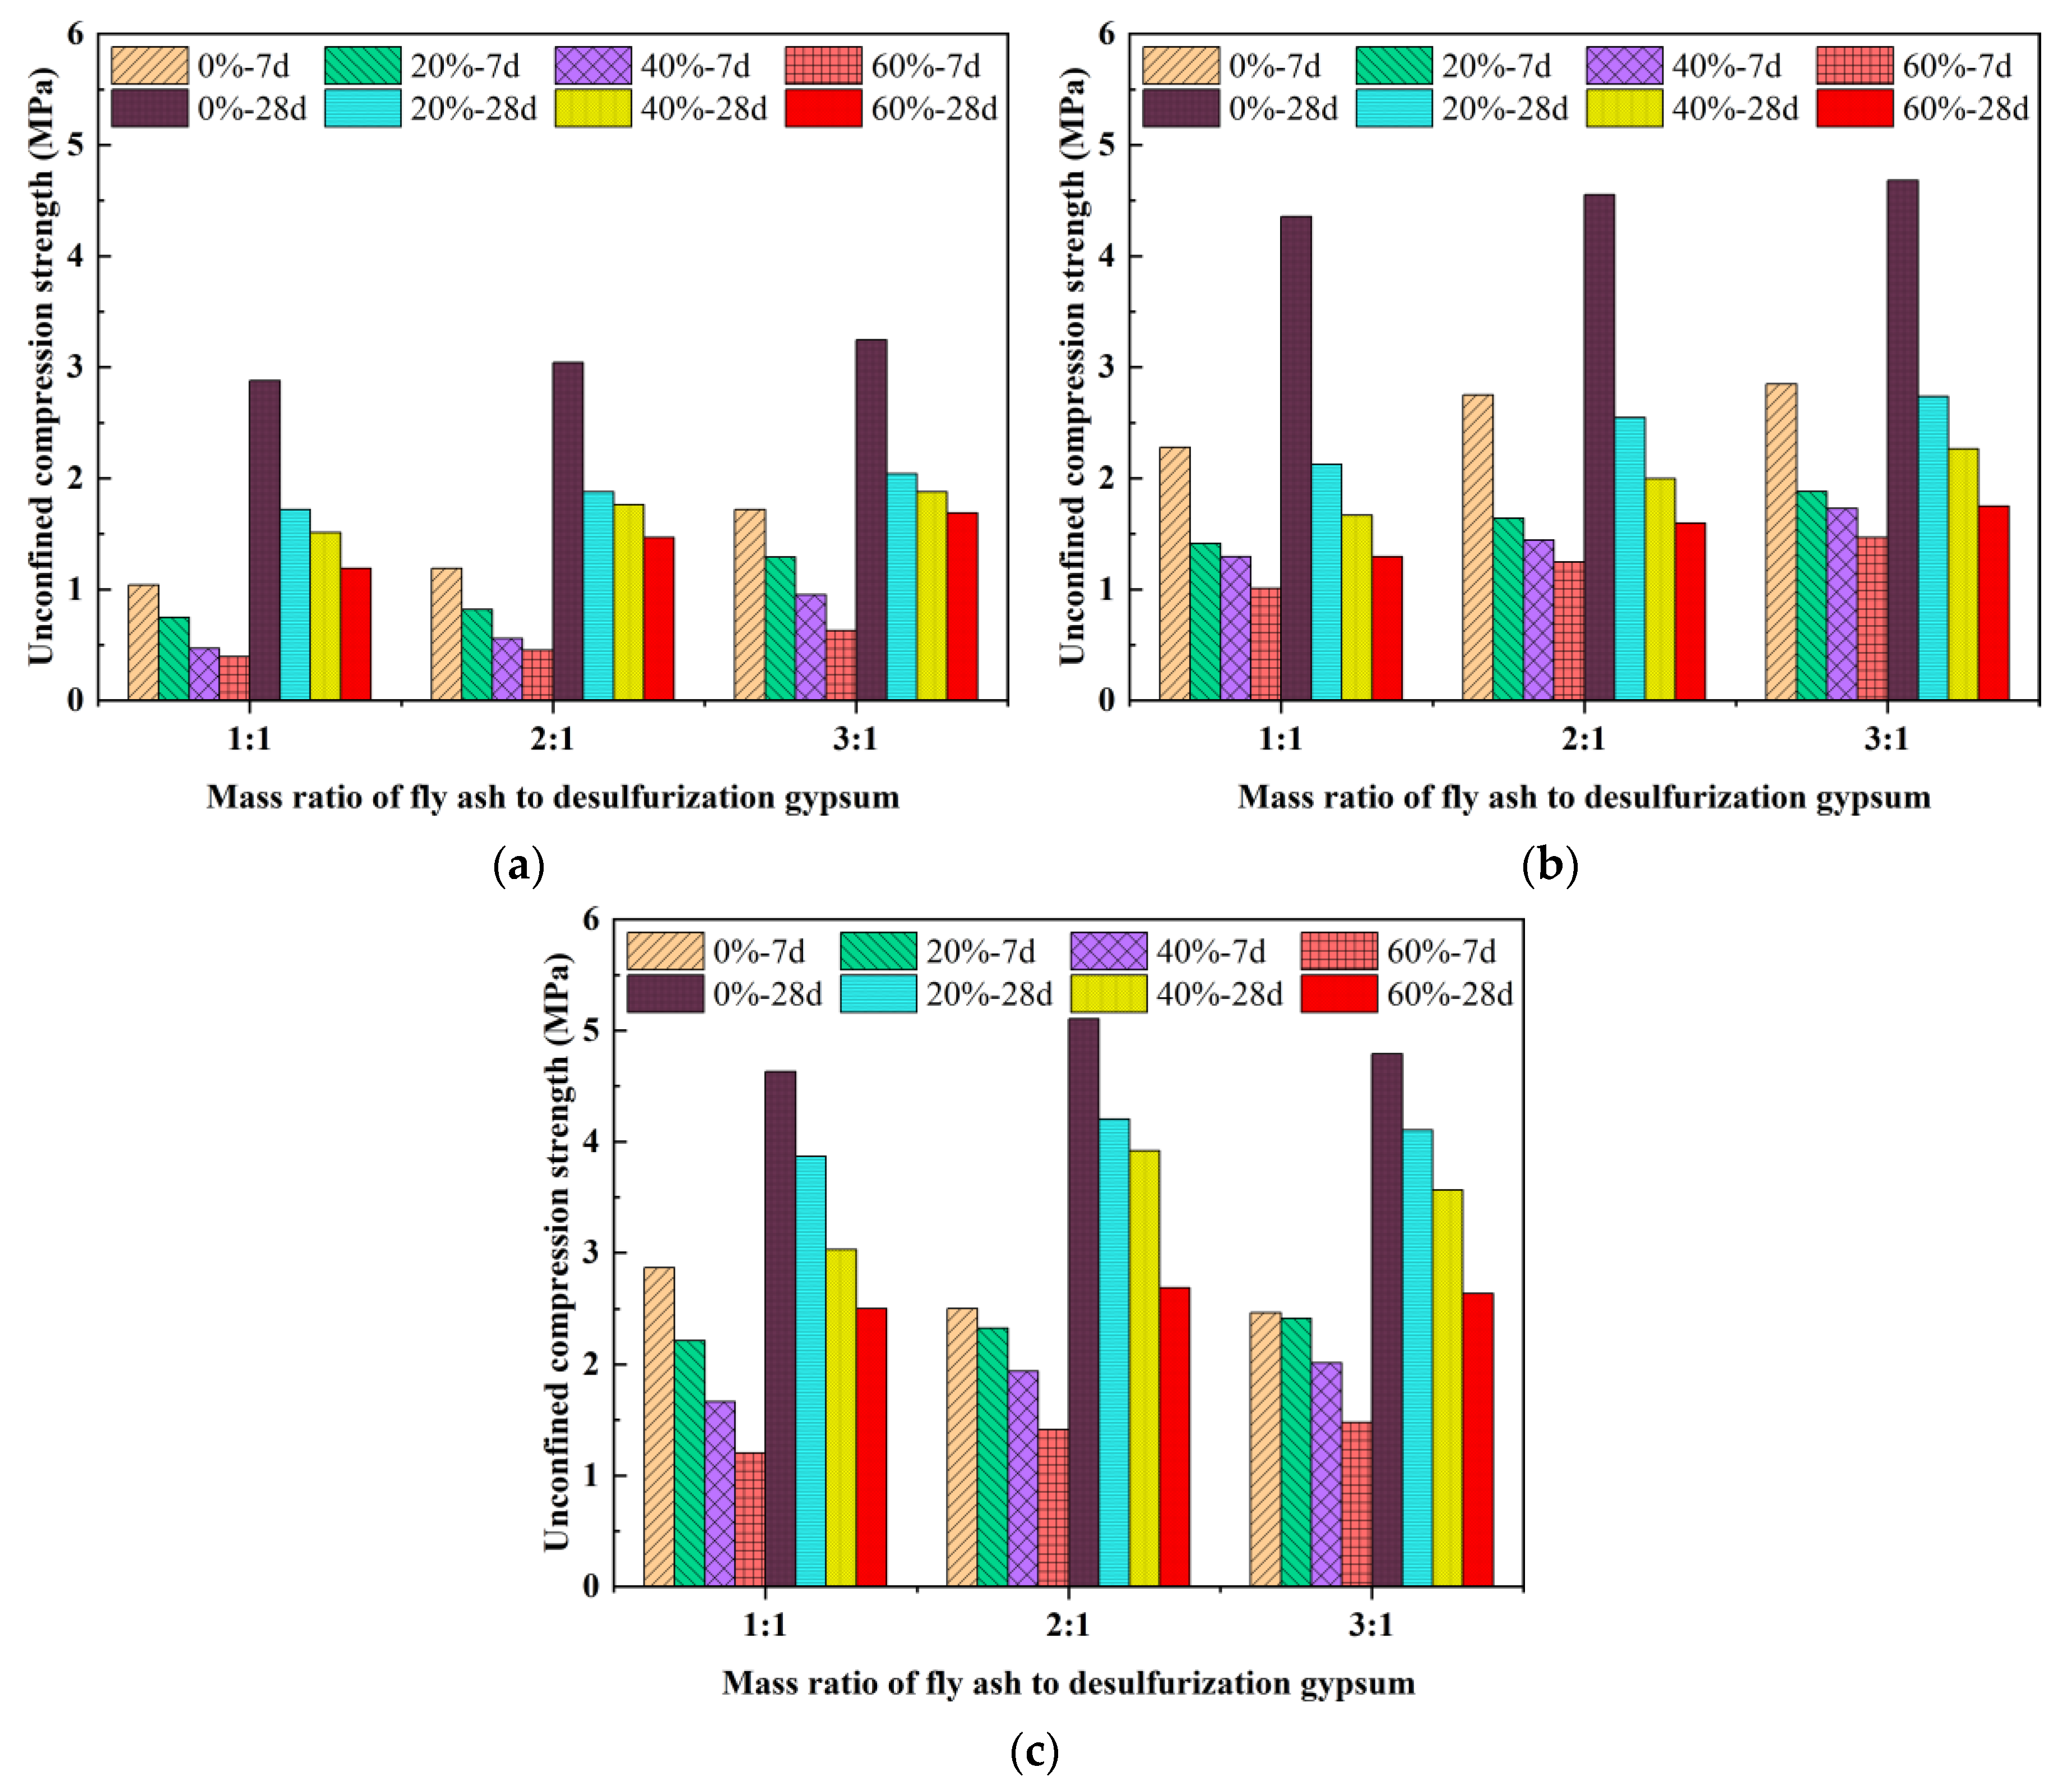
- (1)
- In Figure 11a,b, when the cement contents are 6% and 8%, the compressive strength of the specimen increases with the increase in the mass ratio of fly ash to desulfurization gypsum. It has a good positive proportional relationship. In Figure 11c, when the cement content is 10%, the compressive strength of the specimen first increases and then decreases with the increase in the mass ratio of fly ash to desulfurization gypsum. When the mass ratio is 2:1, the compressive strength is the highest.
- (2)
- When the mass ratio of fly ash to desulfurization gypsum increases from 1:1 to 2:1, the compressive strength of the specimen increases significantly. Its growth rate ranges from 5% to 29%. When the mass ratios are 2:1 and 3:1, the compressive strength of the specimen is relatively close. Its amplitude of change is very small.
3.3. Study on Stress–Strain Relationship under Uniaxial Compression
3.3.1. Complete Stress–Strain Curve
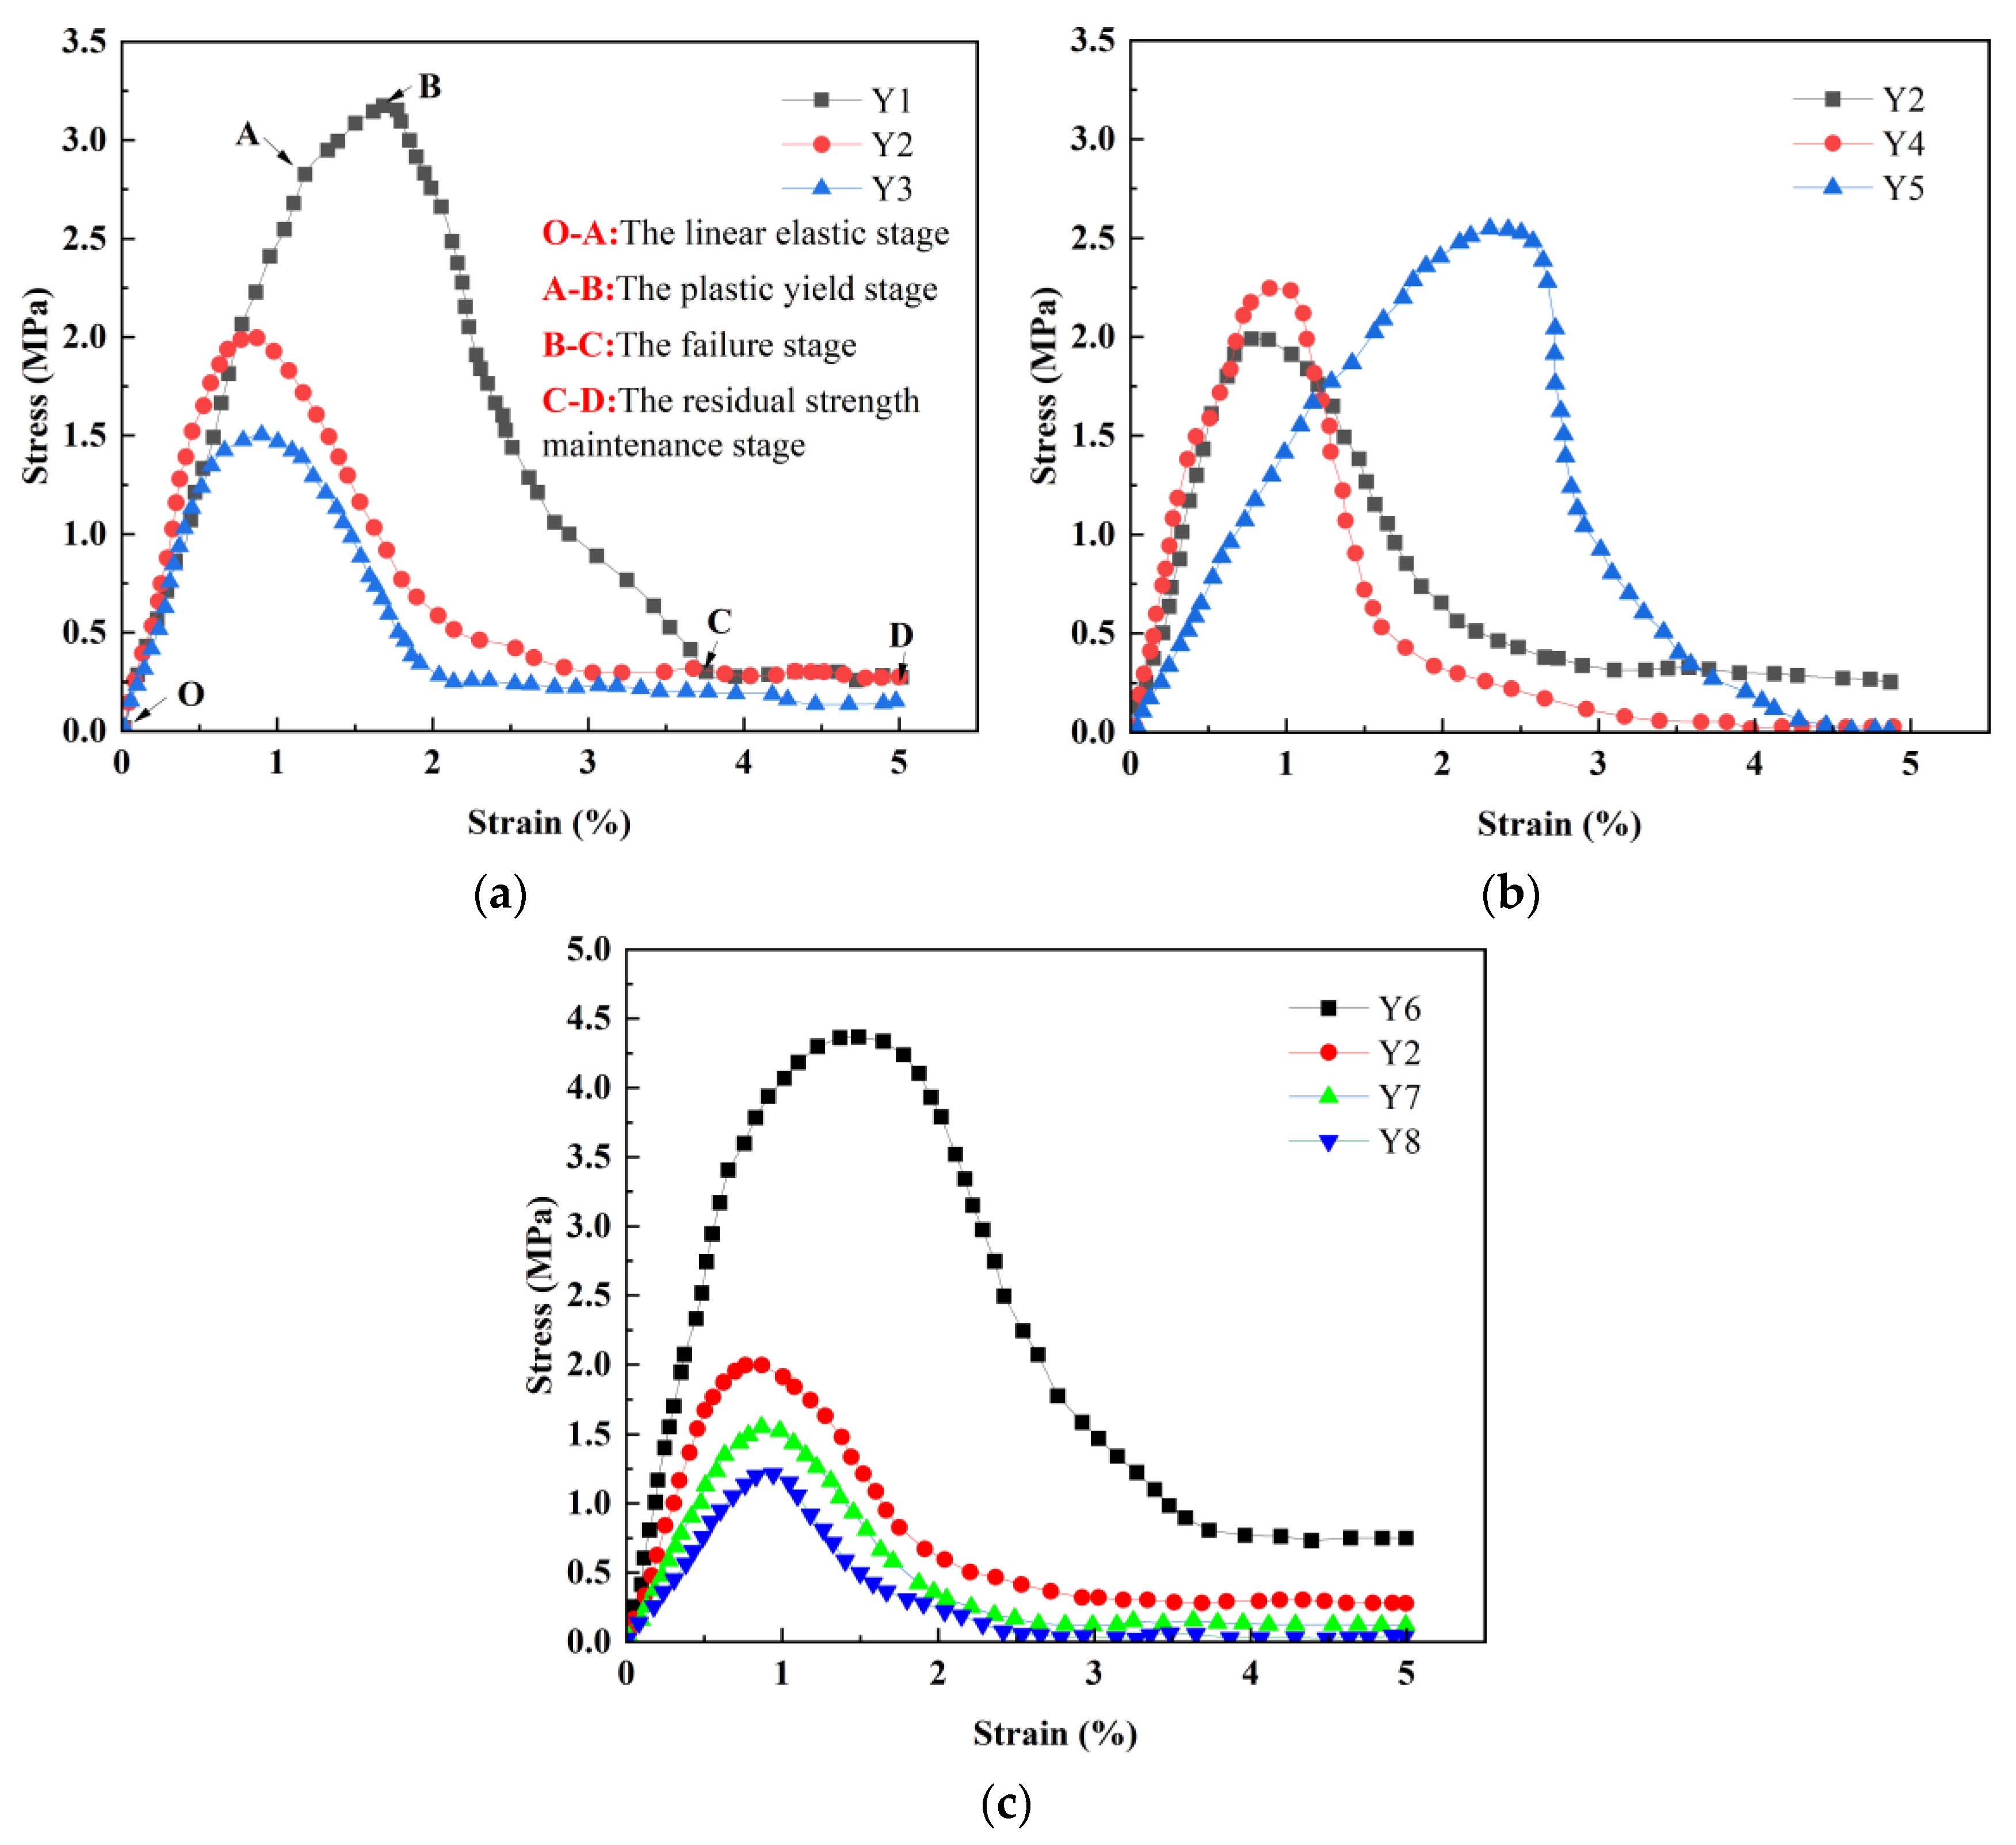
- (1)
- The OA segment of the curve is in the linear elastic stage. The stress–strain curve of the desulfurization gypsum–fly ash flowable lightweight soil changes approximately in a straight line. At this stage, the desulfurization gypsum–fly ash flowable lightweight soil gradually hardens. The stress increases rapidly with strain. The stress at point A is the proportional limit.
- (2)
- The AB segment of the curve represents the plastic yield stage. The slope of the stress–strain curve gradually decreases. The strain growth rate has significantly accelerated. The increase in stress is relatively small. At this stage, cracks or micro defects begin to appear in the internal structure of the desulfurization gypsum–fly ash flowable lightweight soil, and its stress level is close to the material threshold. The stress at point B is the peak stress.
- (3)
- The BC segment of the curve is in the failure stage. The stress–strain curve shows a downward trend. The stress decays continuously with the increase in strain. At this stage, the desulfurization gypsum–fly ash flow-state lightweight soil specimen exhibits cracks and reaches failure.
- (4)
- The CD segment of the curve represents the residual strength maintenance stage. The stress–strain curve can be approximately represented as a horizontal straight line. During this stage, the stress of the desulfurization gypsum–fly ash flow-state lightweight soil is a relatively small and fixed value. The strain keeps on rising. The stress depicted in point D of the figure corresponds to residual strength.
3.3.2. Elastic Modulus
3.3.3. Uniaxial Compressive Constitutive Model
Establishment of Constitutive Model
Analysis and Verification of Constitutive Models
3.4. Mechanism of Strength Formation of Desulfurization Gypsum–Fly Ash Flowable Lightweight Soil
3.4.1. Cement Hydration Reaction
3.4.2. Activation of Fly Ash Activity
3.4.3. Promoting Reaction of Desulfurization Gypsum
4. Conclusions
- (1)
- When the cement content ranges from 6% to 10%, the fly ash/desulfurization gypsum mass ratio ranges from 1:1 to 3:1, and the fly ash content ranges from 0% to 60%. The flowability, 7 d compressive strength, and 28 d compressive strength of the desulfurization gypsum–fly ash flowable lightweight soil vary from 150 mm to 240 mm, 0.38 to 2.89 MPa, and 1.2 to 5.13MPa, respectively. It is recommended to select specific mix proportions based on actual engineering requirements.
- (2)
- The increases in cement content and silt content both lead to a decrease in the flowability of desulfurization gypsum–fly ash flowable lightweight soil. However, as the mass ratio of fly ash to desulfurization gypsum increases, the flowability reaches its maximum at a mass ratio of 2:1. The mass ratio of fly ash/desulfurization gypsum has the greatest impact on its fluidity, with a maximum decrease of 27% when it increases from 2:1 to 3:1; The flowability of desulfurized gypsum–fly ash fluidized lightweight soil shows a loss after standing for 30 min, with a decrease range of 1.36% to 5.13%.
- (3)
- The compressive strength of the desulfurization gypsum–fly ash flowable lightweight soil is positively proportional to the cement content and age and inversely proportional to the silt content. When the mass ratio of the fly ash/desulfurization gypsum increases from 1:1 to 2:1, its compressive strength increases significantly. When the mass ratios are 2:1 and 3:1, its compressive strength is very close. Considering production costs, it is recommended to choose a fly ash/desulfurization gypsum mass ratio of 2:1.
- (4)
- The development process of the stress–strain curve of the desulfurized gypsum–fly ash flowable lightweight soil can be divided into four stages: linear elastic stage, plastic yield stage, failure stage, and residual strength maintenance stage. Based on the stress–strain relationship test results, a uniaxial compressive constitutive model of the desulfurization gypsum–fly ash flowable lightweight soil was proposed. The model was fitted and analyzed with the test results, and the correlation was greater than 0.96, indicating a high degree of agreement.
- (5)
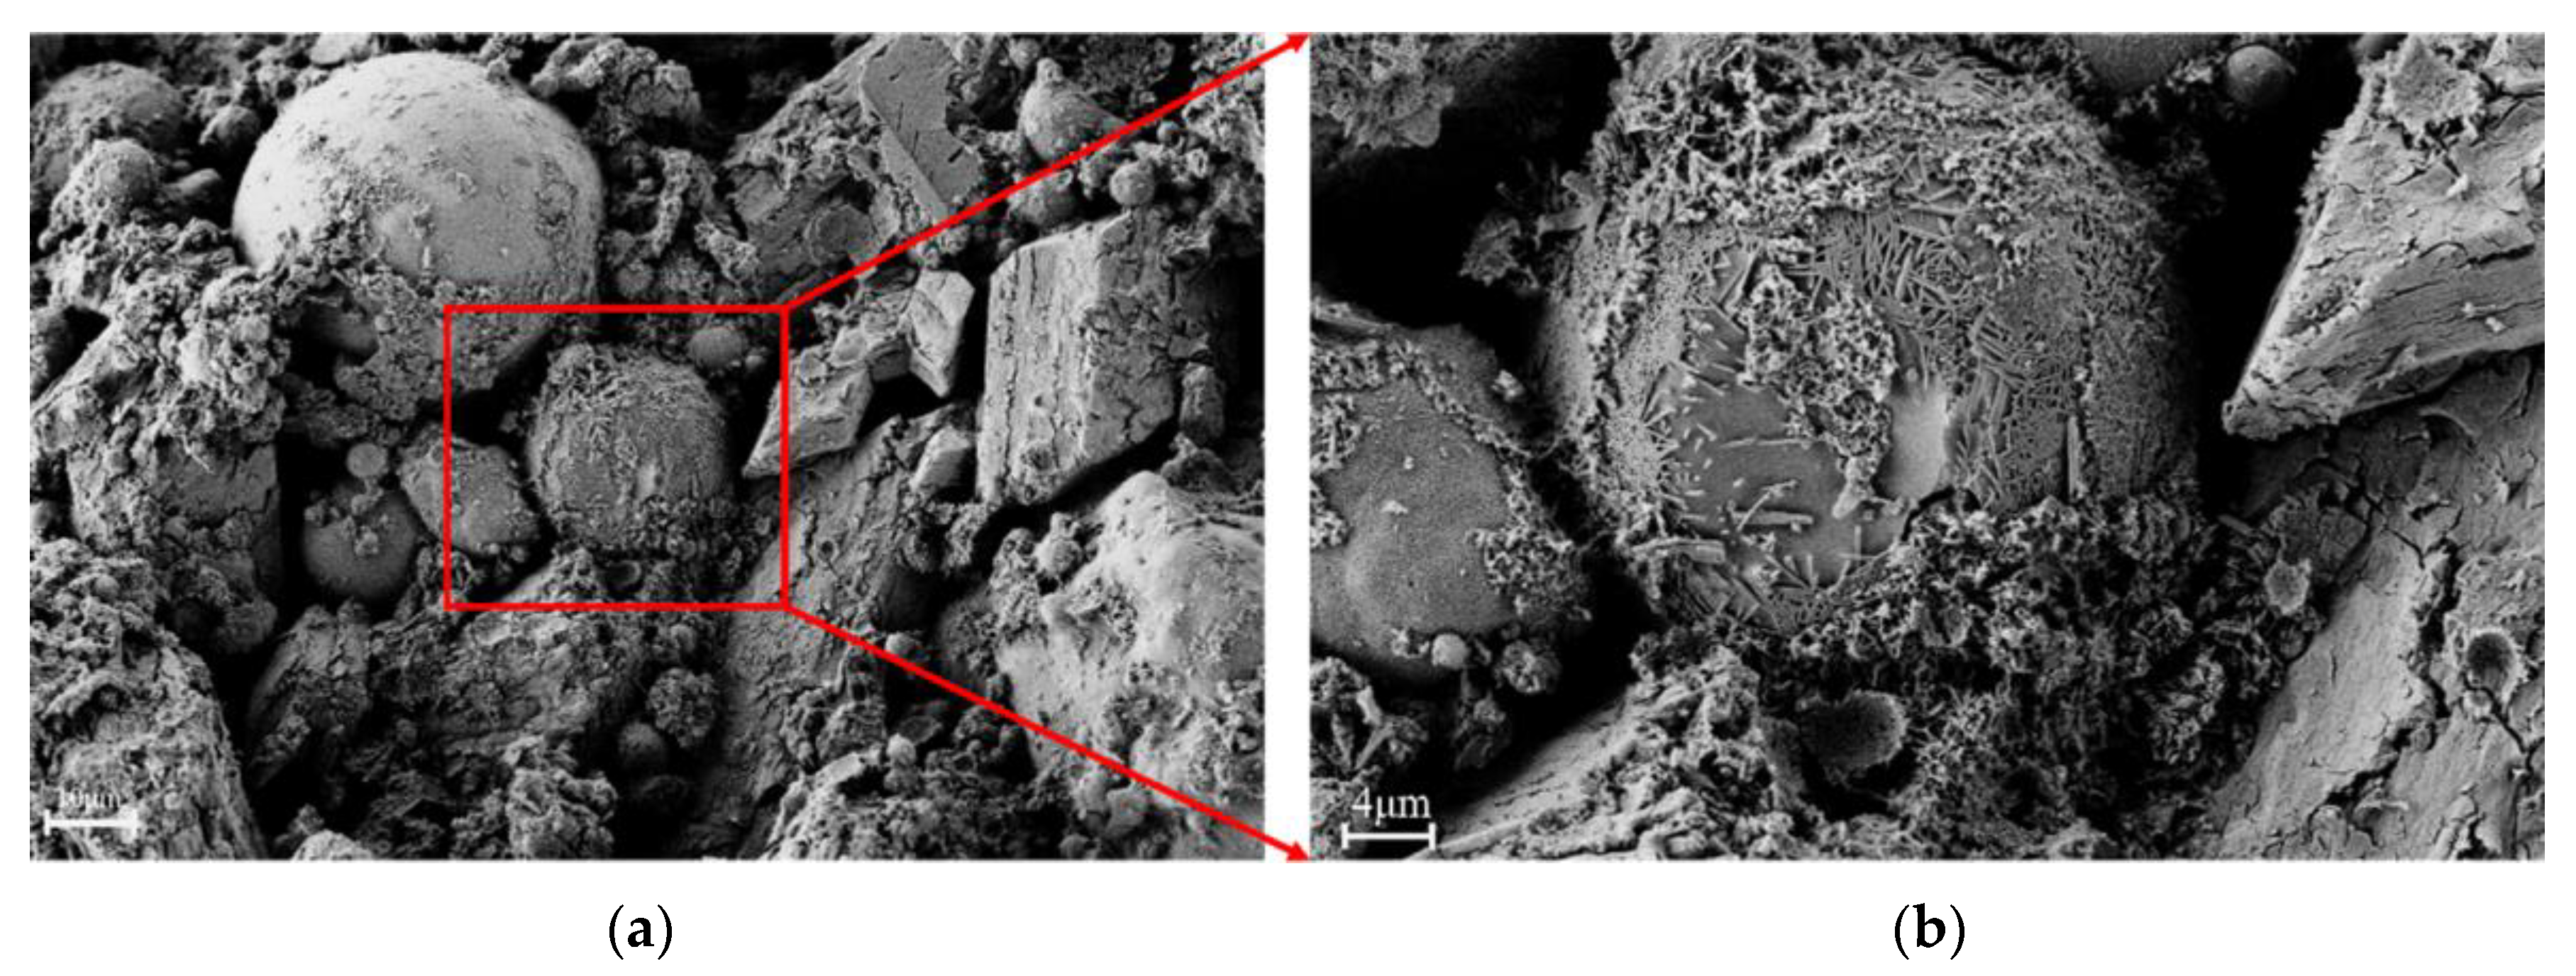
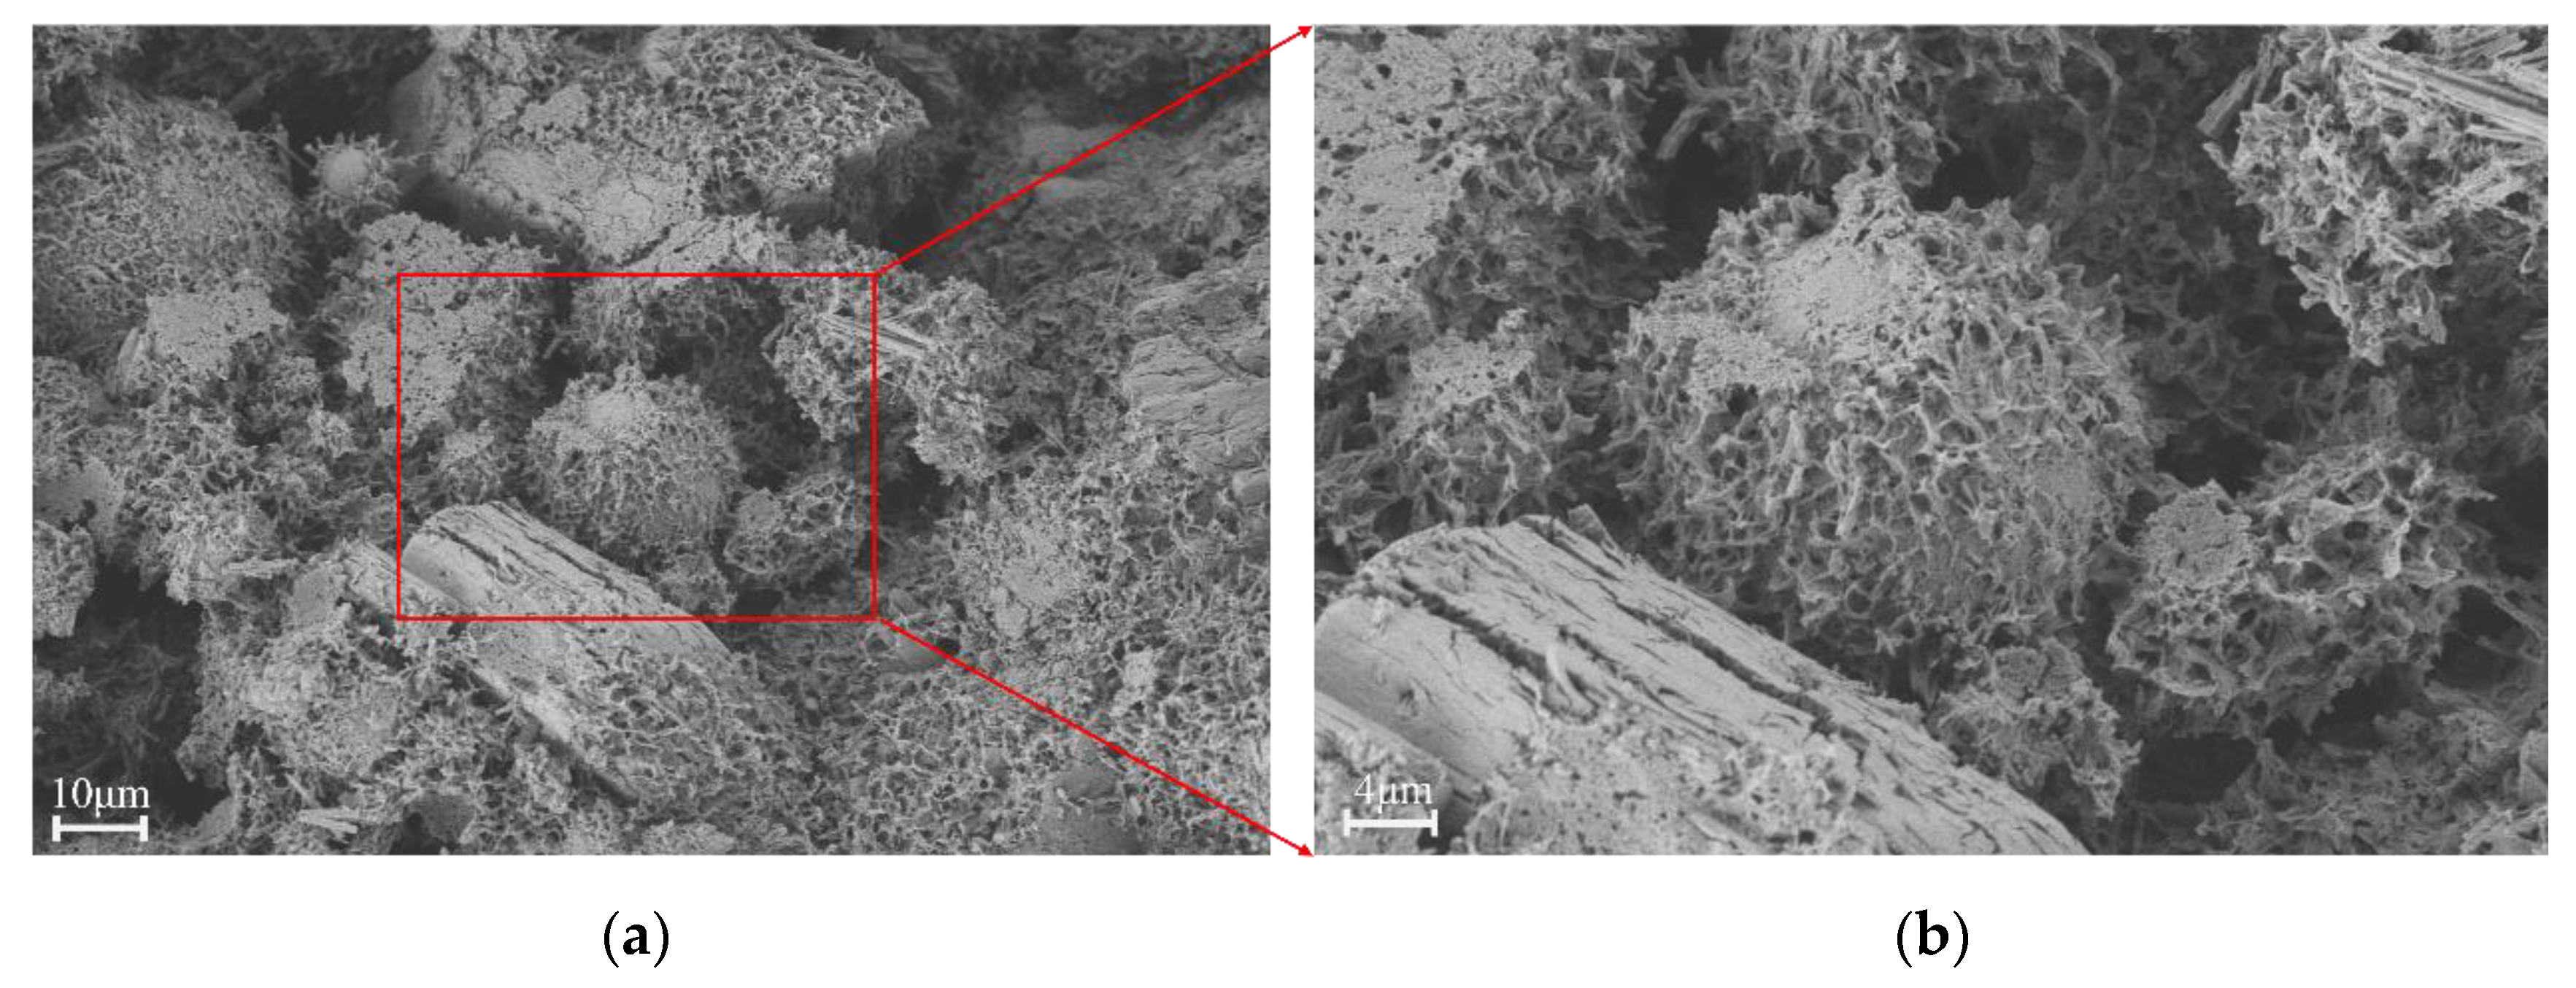
- Compared to traditional fluidized fly ash, the desulfurization gypsum in the fluidized lightweight soil of the desulfurization gypsum fly ash can promote the disintegration of fly ash, thereby increasing the specific surface area. This provides more contact points and promotes the hardening process, enhancing the interlocking force between particles and the formation of cementitious substances and further enhancing strength.
Author Contributions
Funding
Institutional Review Board Statement
Informed Consent Statement
Data Availability Statement
Conflicts of Interest
References
- Yuan, Q.; Qian, J.S.; Yang, J.J. Indoor experimental study of flowable fly ash. Coal Ash. 2011, 23, 1–3. [Google Scholar]
- Zhang, S.F.; Wang, J.Y.; Gao, L.Y.; Guo, G.M.; Jiang, W.L. Experimental study on mix design and road performance of fluid fly ash subgrade filler. J. Highw. Transp. Res. Dev. 2023, 40, 84–92. [Google Scholar]
- Yuan, X.Y.; Pu, Y.D.; Gui, Z.Y. Effect of hydroxylated graphene on properties of fly ashcement matrix composites. Mat. Rep. 2023, 1–17. [Google Scholar]
- Jia, Y. Research on Application of Liquid Cement Fly Ash Filled in Bridge Abutment. Master’s Thesis, Chang’an University, Xi’an, China, 2009. [Google Scholar]
- Huang, Z.Q.; Yu, Y.Y. Study on the physical and mechanical properties of fly ash modified red layer filler. Sci. Technol. Innov. 2022, 21–23. [Google Scholar]
- An, S.; Wang, B.M.; Chen, W.X. Interaction mechanism of carbide slag activating slag-fly ash composite cementitious materials. Bull. Chin. Ceram. Soc. 2023, 42, 1333–1343. [Google Scholar]
- Liu, Y.; Ceng, X.; Wang, B.W. Preparation and strength mechanism of alkali-activated fly ash-slag-carbide slag based geopolymer. Bull. Chin. Ceram. Soc. 2023, 42, 1353–1362. [Google Scholar]
- Zhang, T.T.; Wang, C.L.; Zhang, Y.X. Effect of fly ash content on performance of high performance concrete with seawater and sea sand. Bull. Chin. Ceram. Soc. 2022, 41, 1677–1688. [Google Scholar]
- Mao, Y.; Zhang, H.; Luo, C.W. Simulation study on compactness of fly ash cement block based on discrete element method. Ind. Miner. Process. 2020, 49, 36–40. [Google Scholar]
- Ma, C.C.; Xu, F.X.; Yang, Y. Study on tensile creep characteristics of high volume fly ash concrete at early ages. J. Zhejiang Univ. Technol. 2023, 51, 131–138. [Google Scholar]
- Liu, J.; Li, Z.L.; Zhang, W.Z. Research advances in cold-bonded artificial lightweight aggregates made from industrial solid waste materials. Mat. Rep. 2023, 1–31. [Google Scholar]
- Janardhanatn, R.; Burns, F.; Peindl, R.D. Mix design for flowable fly-ash backfill material. J. Mater. Civil Eng. 1992, 4, 252–263. [Google Scholar] [CrossRef]
- Wang, Y.Z. Application Research of Casting Type of Cement Fly Ash in Backfilling on Back of Bridge Abutments and Culverts. Master’s Thesis, Chang’an University, Xi’an, China, 2008. [Google Scholar]
- Dapeng, Z.; Dongmin, W.; Hongzhi, C. Hydration characteristics of cement with high volume circulating fluidized bed fly ash. Constr. Build. Mater. 2023, 380, 131310. [Google Scholar]
- He, P.; Zhang, X.; Chen, H. Waste-to-resource strategies for the use of circulating fluidized bed fly ash in construction materials: A mini review. Powder Technol. 2021, 393, 773–785. [Google Scholar] [CrossRef]
- Lin, S.; Jiang, X.; Zhao, Y. Zeolite greenly synthesized from fly ash and its resource utilization: A review. Sci. Total Environ. 2022, 851, 158182. [Google Scholar] [CrossRef] [PubMed]
- Yang, C.F.; Wang, S.; Sun, J.S. The best water content of liquid fly ash. J. Hebei Univ. Technol. 2014, 43, 92–95. [Google Scholar]
- Qi, Z.L. The Optimization of Liquid Fly Ash Embankment in the Tang-Jin Freeway Rebuid. Master’s Thesis, Hebei University of Technology, Tianjin, China, 2015. [Google Scholar]
- Wang, S. The Application of Liquid Fly Ash in Tang Jin High-Speed Expansion Project. Master’s Thesis, Hebei University of Technology, Tianjin, China, 2015. [Google Scholar]
- Wan, C.C.; Jiang, T.H.; Yu, Y. Basic Mechanical Properties Study of Polypropylene Foam Concrete Based on Orthogonal Test. Bull. Chin. Ceram. Soc. 2023, 1–14. [Google Scholar]
- Sun, J.S.; Lu, X.; Li, H.L. Study on mix design and properties of foamed fluid fly ash. J. Guangxi Univ. Nat. Sci. Ed. 2017, 42, 352–358. [Google Scholar]
- Zhen, W.K.; Zhao, Y.Y.; Wang, Y.C. The Simulation study on static mixer for foamed concrete preparation. Mater. Rep. 2023, 1–20. [Google Scholar]
- Gao, Z.H.; Chen, B.; Chen, J.L. Pore structure and mechanical properties of foam concrete under freeze-thaw environment. Acta Mater. Compos. Sin. 2023, 1–11. [Google Scholar]
- Chen, Z.C.; Guo, L.P.; Li, Y.Q. Experimental study on paraffin emulsion phase change foamed concrete. Bull. Chin. Ceram. Soc. 2023, 42, 1623–1629+1649. [Google Scholar]
- Yong, Y.; Bing, C. Potential use of soil in lightweight foamed concrete. KSCE J. Civ. Eng. 2016, 20, 2420–2427. [Google Scholar] [CrossRef]
- Gabr, M.; Bowders, J.J. Controlled low-strength material using fly ash and AMD sludge. J. Hazard. Mater. 2000, 76, 251–263. [Google Scholar] [CrossRef]
- Do, M.T.; Kim, Y. Engineering properties of controlled low strength material (CLSM) incorporating red mud. Int. J. Geo-Eng. 2016, 7, 7. [Google Scholar] [CrossRef]
- Wu, H.; Huang, B.; Shu, X. Utilization of solid wastes/byproducts from paper mills in Controlled Low Strength Material (CLSM). Constr. Build. Mater. 2016, 118, 155–163. [Google Scholar] [CrossRef]
- Do, M.T.; Kim, S.Y.; Kang, O.G. Thermal conductivity of controlled low strength material (CLSM) made entirely from by-products. Key Eng. Mater. 2018, 773, 244–248. [Google Scholar] [CrossRef]
- Türkel, S. Long-term compressive strength and some other properties of controlled low strength materials made with pozzolanic cement and Class C fly ash. J. Hazard. Mater. 2006, 137, 261–266. [Google Scholar] [CrossRef]
- Chittoori, B.; Puppala, A.J.; Raavi, A. Strength and stiffness characterization of controlled low-strength material using native high-plasticity clay. J. Mater. Civ. Eng. 2014, 26, 04014007. [Google Scholar] [CrossRef]
- Bui, A.T.; Pham, H.V.; Nguyen, T.D. Effectiveness of Lubricants and Fly Ash Additive on Surface Damage Resistance under ASTM Standard Operating Conditions. Coatings 2023, 13, 851. [Google Scholar] [CrossRef]
- Ionescu, B.A.; Barbu, A.-M.; Lăzărescu, A.-V.; Rada, S.; Gabor, T.; Florean, C. The Influence of Substitution of Fly Ash with Marble Dust or Blast Furnace Slag on the Properties of the Alkali-Activated Geopolymer Paste. Coatings 2023, 13, 403. [Google Scholar] [CrossRef]
- Liu, C.; Jia, Y. Effect of Redispersible Latex Powder and Fly Ash on Properties of Mortar. Coatings 2022, 12, 1930. [Google Scholar] [CrossRef]
- ASTM D6103-2004; Standard Test Method for Flow Consistency of Controlled Low Strength Material (CLSM). ASTM: West Conshohocken, PA, USA, 2004.
- ASTM D6103-2017; Standard Test Method for Flow Consistency of Controlled Low Strength Material (CLSM). ASTM: West Conshohocken, PA, USA, 2017.
- JCJ/T70-2009; Standard for Basic Performance Testing of Building Mortar. Ministry of Housing and Urban-Rural Development of the People’s Republic of China: Beijing, China, 2009.
- Li, Q.; Fan, Y.; Shah, S.P. Effect of nano-metakaolin on establishment of internal structure of fly ash cement paste. J. Build. Eng. 2023, 77, 107484. [Google Scholar] [CrossRef]
- Feng, Z.; Shen, D.; Huang, Q.; Zhang, T. Effect of fly ash on early-age properties and viscoelastic behaviors of supersulfated cement concrete under different degrees of restraint. Constr. Build. Mater. 2023, 401, 132895. [Google Scholar] [CrossRef]


| Chemical Composition | Fe2O3 | CaO | SO3 | Al2O3 | SiO2 |
|---|---|---|---|---|---|
| Mass fraction/% | 7.50 | 4.63 | 1.50 | 23.67 | 56.96 |
| Density/(kg·m−3) | Specific Surface Area/(m2·kg−1) | Fineness/% | Loss on Ignition/% |
|---|---|---|---|
| 2389 | 467 | 16.8 | 7.5 |
| Water Requirement of Normal Consistency/% | Setting Time/min | Flexural Strength/MPa | Compressive Strength/MPa | |||||
|---|---|---|---|---|---|---|---|---|
| Initial | Final | 3 d | 7 d | 28 d | 3 d | 7 d | 28 d | |
| 26.9 | 205 | 265 | 5.6 | 7.5 | 9.6 | 30.2 | 36.7 | 48.4 |
| Control Grain Size d60/mm | Effective Grain Diameter d10/mm | Median Diameter d30/mm | Coefficient of Nonuniformity Cu | Coefficient of Curvature Cc |
|---|---|---|---|---|
| 0.092 | 0.013 | 0.087 | 7.1 | 6.3 |
| Sample | Mass Ratio of Fly Ash to Desulfurization Gypsum | Cement Content | Silt Content | Composition of Fluidized Fly Ash/m3 | ||||
|---|---|---|---|---|---|---|---|---|
| Cement/kg | Desulfurization Gypsum/kg | Fly Ash/kg | Silt/kg | Water/kg | ||||
| 1 | 1:1 | 6% | 0% | 77.02 | 603.34 | 603.34 | 436.46 | |
| 2 | 20% | 64.94 | 508.70 | 508.70 | 216.47 | 441.60 | ||
| 3 | 40% | 56.14 | 439.73 | 439.73 | 374.24 | 445.34 | ||
| 4 | 60% | 49.43 | 387.22 | 387.22 | 494.33 | 448.19 | ||
| 5 | 8% | 0% | 103.02 | 592.39 | 592.39 | 437.85 | ||
| 6 | 20% | 86.82 | 449.22 | 449.22 | 217.05 | 442.78 | ||
| 7 | 40% | 75.02 | 431.37 | 431.37 | 375.11 | 446.38 | ||
| 8 | 60% | 66.04 | 379.76 | 379.76 | 495.34 | 449.11 | ||
| 9 | 10% | 0% | 129.19 | 581.36 | 581.36 | 439.25 | ||
| 10 | 20% | 108.82 | 489.68 | 489.68 | 217.64 | 443.98 | ||
| 11 | 40% | 93.99 | 422.98 | 422.98 | 375.98 | 447.42 | ||
| 12 | 60% | 82.73 | 372.27 | 372.27 | 496.35 | 450.03 | ||
| 13 | 2:1 | 6% | 0% | 77.96 | 814.20 | 407.10 | 441.75 | |
| 14 | 20% | 65.60 | 685.18 | 342.59 | 218.68 | 446.10 | ||
| 15 | 40% | 56.63 | 591.46 | 295.73 | 377.53 | 449.26 | ||
| 16 | 60% | 49.82 | 520.30 | 260.15 | 498.16 | 451.66 | ||
| 17 | 8% | 0% | 104.25 | 799.24 | 399.62 | 443.06 | ||
| 18 | 20% | 87.69 | 672.28 | 336.14 | 219.22 | 447.21 | ||
| 19 | 40% | 75.67 | 580.13 | 290.06 | 378.34 | 450.23 | ||
| 20 | 60% | 66.55 | 510.19 | 255.10 | 499.10 | 452.52 | ||
| 21 | 10% | 0% | 130.70 | 784.20 | 392.10 | 444.38 | ||
| 22 | 20% | 109.89 | 659.31 | 329.66 | 219.77 | 448.33 | ||
| 23 | 40% | 94.79 | 568.74 | 284.37 | 379.16 | 451.2 | ||
| 24 | 60% | 83.34 | 500.05 | 250.02 | 500.05 | 453.38 | ||
| 25 | 3:1 | 6% | 0% | 78.43 | 921.56 | 307.19 | 444.44 | |
| 26 | 20% | 65.94 | 774.78 | 258.26 | 219.80 | 448.39 | ||
| 27 | 40% | 56.88 | 668.34 | 222.78 | 379.20 | 451.25 | ||
| 28 | 60% | 50.01 | 587.61 | 195.87 | 500.10 | 453.42 | ||
| 29 | 8% | 0% | 104.87 | 904.52 | 301.51 | 445.71 | ||
| 30 | 20% | 88.13 | 760.12 | 253.37 | 220.32 | 449.46 | ||
| 31 | 40% | 76.00 | 655.47 | 218.49 | 379.98 | 452.18 | ||
| 32 | 60% | 66.80 | 576.15 | 192.05 | 501.00 | 454.24 | ||
| 33 | 10% | 0% | 131.47 | 887.40 | 295.80 | 446.99 | ||
| 34 | 20% | 110.42 | 745.39 | 248.46 | 220.85 | 450.54 | ||
| 35 | 40% | 95.19 | 642.55 | 214.18 | 380.77 | 453.12 | ||
| 36 | 60% | 83.65 | 564.65 | 188.22 | 501.92 | 455.07 | ||
| Level | Flowability/mm | Applicability |
|---|---|---|
| Low flowability | <150 | Reclamation work for large-scale pipe trenches, roadbeds, etc. |
| Average flowability | 150–200 | General backfilling project |
| High flowability | >200 | Backfilling projects with narrow operating space or dead corners |
| Sample | Mass Ratio of Fly Ash to Desulfurization Gypsum | Cement Content | Silt Content |
|---|---|---|---|
| Y1 | 1:1 | 6% | 20% |
| Y2 | 8% | ||
| Y3 | 10% | ||
| Y4 | 2:1 | 8% | |
| Y5 | 3:1 | ||
| Y6 | 1:1 | 0% | |
| Y7 | 40% | ||
| Y8 | 60% |
| Sample | Elastic Modulus |
|---|---|
| Y1 | 246.2 |
| Y2 | 321.1 |
| Y3 | 267.7 |
| Y4 | 436.7 |
| Y5 | 150.1 |
| Y6 | 564.5 |
| Y7 | 217.3 |
| Y8 | 121.2 |
Disclaimer/Publisher’s Note: The statements, opinions and data contained in all publications are solely those of the individual author(s) and contributor(s) and not of MDPI and/or the editor(s). MDPI and/or the editor(s) disclaim responsibility for any injury to people or property resulting from any ideas, methods, instructions or products referred to in the content. |
© 2023 by the authors. Licensee MDPI, Basel, Switzerland. This article is an open access article distributed under the terms and conditions of the Creative Commons Attribution (CC BY) license (https://creativecommons.org/licenses/by/4.0/).
Share and Cite
Zuo, X.; Zuo, S.; Li, J.; Hou, N.; Zuo, H.; Zhou, T. Study of the Design and Mechanical Properties of the Mix Proportion for Desulfurization Gypsum–Fly Ash Flowable Lightweight Soil. Coatings 2023, 13, 1591. https://doi.org/10.3390/coatings13091591
Zuo X, Zuo S, Li J, Hou N, Zuo H, Zhou T. Study of the Design and Mechanical Properties of the Mix Proportion for Desulfurization Gypsum–Fly Ash Flowable Lightweight Soil. Coatings. 2023; 13(9):1591. https://doi.org/10.3390/coatings13091591
Chicago/Turabian StyleZuo, Xianglong, Shen Zuo, Jin Li, Ning Hou, Haoyu Zuo, and Tiancheng Zhou. 2023. "Study of the Design and Mechanical Properties of the Mix Proportion for Desulfurization Gypsum–Fly Ash Flowable Lightweight Soil" Coatings 13, no. 9: 1591. https://doi.org/10.3390/coatings13091591
APA StyleZuo, X., Zuo, S., Li, J., Hou, N., Zuo, H., & Zhou, T. (2023). Study of the Design and Mechanical Properties of the Mix Proportion for Desulfurization Gypsum–Fly Ash Flowable Lightweight Soil. Coatings, 13(9), 1591. https://doi.org/10.3390/coatings13091591