Article

Improved Numerical Modeling of Terahertz Wave Propagation in Epoxy Coating with the Finite-Difference Time-Domain Method

1
Marine Engineering Institute, Jimei University, Xiamen 361021, China
2
Key Laboratory of Ship and Ocean Engineering, Xiamen 361021, China
3
School of Mechanical Engineering and Automation, Fuzhou University, Fuzhou 350108, China
4
Fujian Provincial Key Laboratory of Terahertz Functional Devices and Intelligent Sensing, Fuzhou University, Fuzhou 350108, China
5
School of Mechanical, Electrical and Information Engineering, Putian University, Putian 351100, China
*
Author to whom correspondence should be addressed.
Coatings 2023, 13(9), 1593; https://doi.org/10.3390/coatings13091593
Submission received: 2 August 2023 / Revised: 5 September 2023 / Accepted: 11 September 2023 / Published: 12 September 2023

Abstract

:
Electromagnetic theoretical analysis was usually used to investigate the pulsed terahertz wave interaction with the medium. For epoxy coatings, the material dispersion of the coating was often simplified or ignored in the traditional propagation model. It is difficult to elaborate on the propagation mechanism and to differentiate the coating deterioration as serving time increases. An improved propagation model based on the finite-difference time domain was established to characterize the propagation in the epoxy protective coating under broad-band terahertz radiation. Either an intact or defective coating structure was investigated, and the simulated results were compared with the experimental test. The dissipation mechanism was considered in the proposed model. The results indicated that the terahertz reflections varied with the change in optical and dielectric properties caused by coating aging, which influences the intrinsic impedance of the medium. Moreover, it could well elucidate the propagation mechanism of pulsed terahertz waves in rusted, defective coating structures.

1. Introduction

The terahertz region of the electromagnetic spectrum spans the frequency range of 0.1 THz–10 THz. Terahertz time-domain spectroscopy (TD-THz) technology provides the capability for standoff inspection in many industries. Due to its advantage of sub-picosecond time resolution, the inspection ability based on terahertz nondestructive testing technology for protective coatings has been extensively studied over the past few years [1,2].
In addition to the experimental research, researchers also use electromagnetic theoretical analysis and numerical calculation methods (frequency domain, time domain method, etc.) to study the propagation mechanism of terahertz waves in media structures [3]. The frequency domain method has been used to investigate the loss and efficiency of the photonic crystal fiber structure in the terahertz regime [4], the thermally tunable scattering of terahertz waves by an infinitely long cylinder comprising a solid dielectric core with an InSb coating (shell) [5], etc. A modeled measurement system, in its operating principle, uses pulses of electromagnetic field. For terahertz pulsed imaging in which a transient terahertz pulse is used, a time-domain method, such as the finite difference time domain (FDTD) method, is a natural solution and is more applicable than a frequency-domain method because a differential equation is simpler to solve than an integral equation [6]. The FDTD algorithm analyzes continuous electromagnetic problems by using finite differences and obtains the electric field value at the sampling point, which offers several advantages, such as robustness and the ability to study dispersive, nonlinear, or anisotropic materials. Thus, the FDTD method has been successfully used to analyze complex mediums, including glass fiber-reinforced plastics [7,8], thermal barrier coatings [9,10,11], epoxy resin [12], etc. This work group carried out a theoretical analysis of the interaction of terahertz radiation with marine protective coatings using the FDTD method, in which the model was simplified and the coating was treated as a non-dispersive medium, that is a Nondispersive model. The simulation results were used for the structural analysis, including the paint layer thickness calculation and resolving the thin paint layer, combined with some signal processing methods [13,14]. When considering the layer thickness of interest, the time interval between the series reflection peaks caused by the various medium interfaces is the primary concern. Since the Nondispersive model could obtain relatively sufficient information for layer thickness analysis, the dispersive nature of the propagation medium was not involved in the FDTD calculation. However, for the defective coating structure, although the simplified model could also help to qualitatively analyze the non-defective and defective structures, it was not enough to further characterize the changing structure caused by the gradual aging of the coating.
As the service time increases, the optical and dielectric properties (such as dielectric constant, electric conductivity, etc.) of the coating will change, which means much of the information within the reflected wave will also be different. In order to characterize the propagation of pulsed terahertz waves in epoxy coating structures, in the present work, an improved model using the FDTD method was established, the dissipation mechanism of the coating medium under broad-band terahertz radiation was analyzed, and coating aging structures were investigated.

2. FDTD Model of Terahertz Non-Destructive Testing of Coating Structure
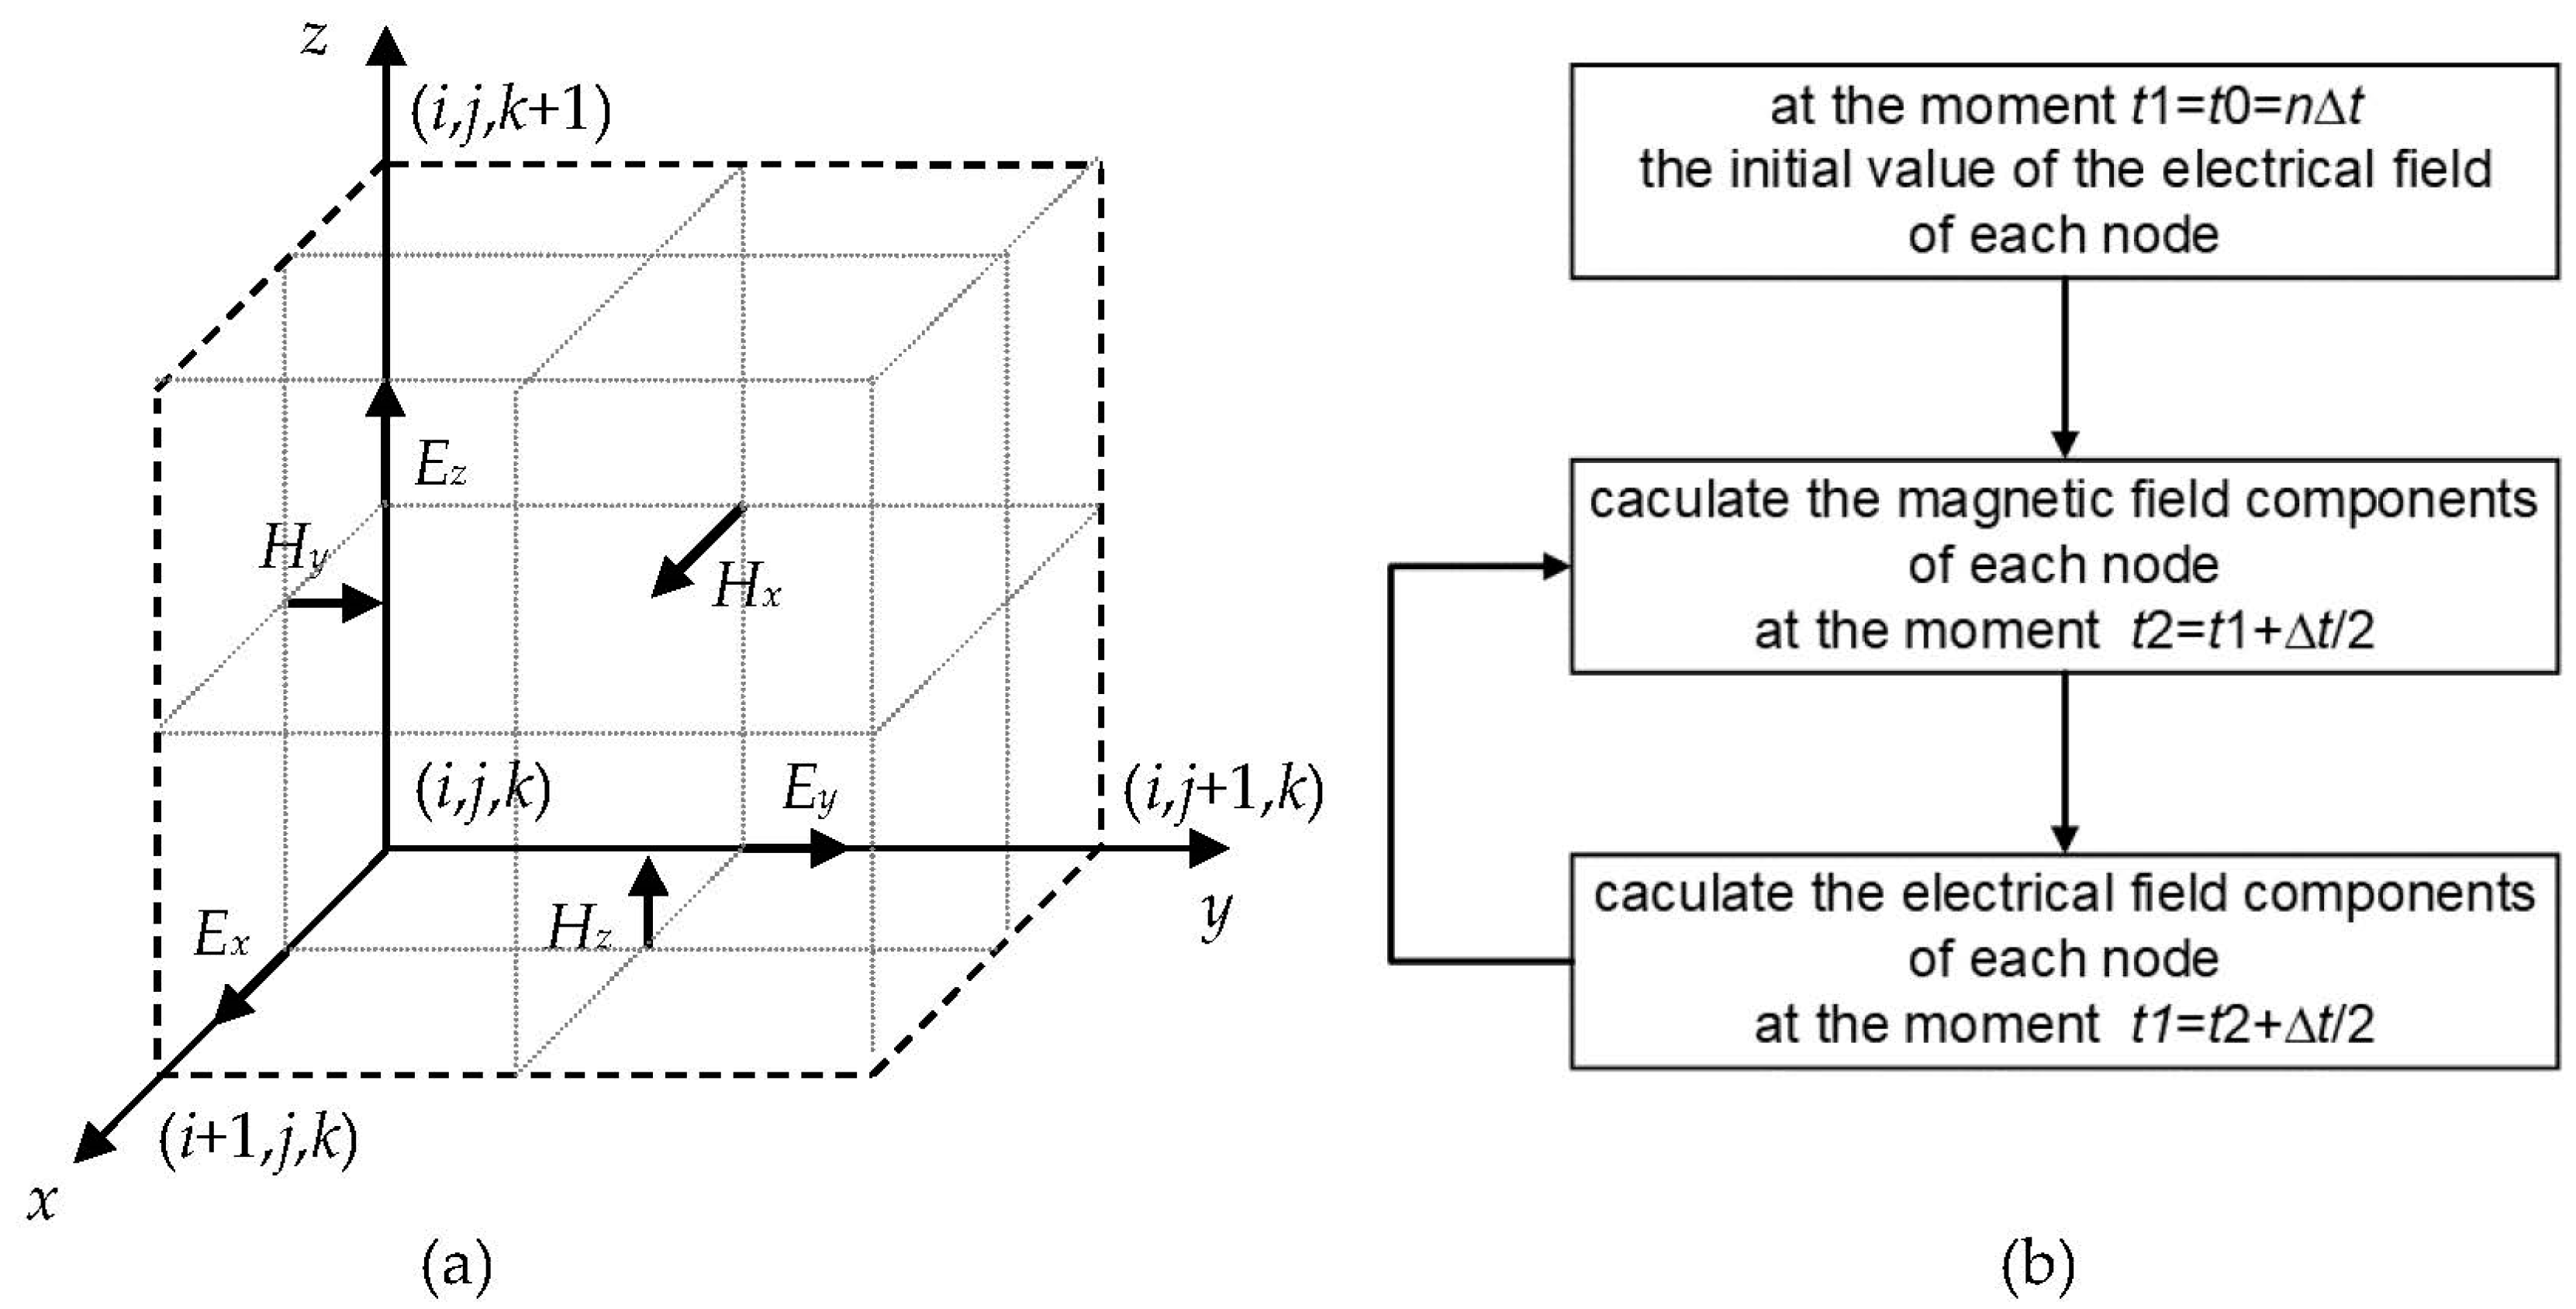
The terahertz pulse was incident upon the coating sample, and the reflected pulses were indicted, collected, and recorded, as Figure 1 shows. The electric field of terahertz pulses is detected after reflection of the pulse from the sample surface. The structural information of a sample can be ultimately extracted by analysis of the recorded terahertz wave in the time domain.

2.1. FDTD Alrightm

Under Cartesian coordinates, the time-dependent Maxwell’s curl equations could be expressed as a partial differential equation form in which electromagnetic field components are coupled to each other as follows [15]:
× H = D t + J = ε E t + σ E = | i               j               k x           y           z H x           H y           H z |
× E = B t J m = μ H t σ m H = | i               j               k x           y           z E x           E y           E z |
where E is the electric field intensity, V/m; H is the magnetic field intensity, A/m; D is the electric flux density, C/m2; B is the magnetic flux density, Wb/m2; J is the electric current density, A/m2; and Jm is the magnetic current density, V/m2. And D = ε E , B = μ H , J = σ E , J m = σ m H , where ε is the electric permittivity, F/m; μ is the magnetic permeability, H/m; σ is the electric conductivity, S/m; and σm is the magnetoresistivity, Ω/m. In addition, Ex, Ey, and Ez represent electric field components, and Hx, Hy, and Hz represent magnetic field components. When the magnetic field loss of the coating medium is ignored, σm = 0.
Based on electromagnetic scattering theory, the FDTD algorithm employs finite difference to solve the Maxwell’s equation. The space is divided into small cubes called Yee cells with a size less than the size of relevant features, and the time is divided into small steps much less than the period of the interested electromagnetic wave, as Figure 2a shows. i, j, and k represent the node numbers of the Yee cell, and ∆x, ∆y, and ∆z represent discrete spatial steps in the x, y, and z directions, respectively. Generally, with the cubical cell mode, the algorithm is stable if δ λ 10 and Δ t δ 3 c , where δ is the side length of a cubical cell, ∆t is the time step, λ is the wavelength in the considered material, and c is the optical velocity in the vacuum [16]. Associated with each cell are six numbers, three describing the E-field vector (Ex, Ey, and Ez) and three describing the H-field vector (Hx, Hy, and Hz). Using the notation ( i , j , k ) = ( i Δ x , j Δ y , k Δ z ) , then F n ( i , j , k ) = F ( i Δ x , j Δ y , k Δ z , n Δ t ) represents some field vector at the moment nt and the values are updated incrementally over a time period.
The Yee algorithm discretizes the Maxwell-Curl equation with time variables in the spatial domain and time domain and takes the central differential approximation of the first-order partial derivative of time and space into a set of difference equations (Formulas (3)–(6)), then obtains the electromagnetic field value at the sampling point, which solves the spatial electromagnetic field on the time axis. The calculation of the electric and magnetic field components is upgraded step by step [17]. E and H are alternately sampled in chronological order, and the time interval differs by half a time step, as Figure 2b shows.
F n ( i , j , k ) x 1 Δ x [ F n ( i + 1 2 , j , k ) F n ( i 1 2 , j , k ) ]
F n ( i , j , k ) y 1 Δ y [ F n ( i , j + 1 2 , k ) F n ( i , j 1 2 , k ) ]
F n ( i , j , k ) z 1 Δ z [ F n ( i , j , k + 1 2 ) F n ( i , j , k 1 2 ) ]
F n ( i , j , k ) t 1 Δ t [ F n + 1 2 ( i , j , k ) F n 1 2 ( i , j , k ) ]
Taking the electrical field component Ex as an example, the equation E x t + σ E x = 1 ε ( H z y H y z ) can be derived from Equation (1). Thus, at the moment t = Δ t ( n + 1 2 ) , the iterative calculation of the node ( i , j , k ) is
E x n + 1 ( i + 1 2 , j , k ) E x n + 1 ( i + 1 2 , j , k ) Δ t + σ E x n + 1 ( i + 1 2 , j , k ) E x n ( i + 1 2 , j , k ) 2 = 1 ε [ H z n + 1 2 ( i + 1 2 , j + 1 2 , k ) H z n + 1 2 ( i + 1 2 , j 1 2 , k ) Δ y H y n + 1 2 ( i + 1 2 , j , k + 1 2 ) H y n + 1 2 ( i + 1 2 , j , k 1 2 ) Δ z ]
Then, the time advance calculation formula for the electric field can be obtained as
E x n + 1 ( i + 1 2 , j , k ) = 1 σ Δ t 2 ε 1 + σ Δ t 2 ε · E x n ( i + 1 2 , j , k )   + Δ t ε 1 + σ Δ t 2 ε [ H z n + 1 2 ( i + 1 2 , j + 1 2 , k ) H z n + 1 2 ( i + 1 2 , j 1 2 , k ) Δ y H y n + 1 2 ( i + 1 2 , j , k + 1 2 ) H y n + 1 2 ( i + 1 2 , j , k 1 2 ) Δ z ]
Other electric field components Ey, and Ez components can be obtained by analogy.
And for the magnetic field component Hx, the equation H x t = 1 μ ( E z y E y z ) can be derived from Equation (2). Thus, at the moment   t = n Δ t , the iterative calculation of the node ( i , j + 1 2 , k + 1 2 ) is
H x n + 1 2 ( i , j + 1 2 , k + 1 2 ) H x n 1 2 ( i , j + 1 2 , k + 1 2 ) Δ t = 1 μ [ E z n ( i , j + 1 , k + 1 2 ) E z n ( i , j , k + 1 2 ) Δ y E y n ( i , j + 1 2 , k + 1 ) E y n ( i , j + 1 2 , k ) Δ z ]
Then, the time advance calculation formula for the magnetic field can be obtained as
H x n + 1 2 ( i , j + 1 2 , k + 1 2 ) = H x n 1 2 ( i , j + 1 2 , k + 1 2 ) Δ t μ [ E z n ( i , j + 1 , k + 1 2 ) E z n ( i , j , k + 1 2 ) Δ y E y n ( i , j + 1 2 , k + 1 ) E y n ( i , j + 1 2 , k ) Δ z ]
Other magnetic field components Hy and Hz components can be obtained from the analogy.

2.2. Coating Parameter Setting

The optical and dielectric properties of the medium would have a big impact. For a non-dispersive medium, D ( t ) = ε ( r ) E ( t ) , the ε ( r ) is a function of space. While for a dispersive medium, the electric permittivity ε is also frequency dependent, that is, D ( ω ) = ε ( ω ) E ( ω ) .
Various models for dielectric relaxation with a frequency-domain relative permittivity have been given by the Haavriliak-Negami equation as below [18,19]:
ε ( ω ) = ε r i ε i = ε + ε s ε [ 1 + ( i ω τ ) σ c c ] σ C D
where ω is the angular frequency, rad/s; εs is the static relative permittivity, that is, the permittivity at zero frequency; ε is the permittivity at infinite frequency; τ is the relaxation time; εr and εi are the real and imaginary parts of the experimentally determined relative permittivity at the angular frequency. ω. In addition, 0 < σ c c   1 and 0 < σ c D 1 , σCC and σCD are adjustable fit parameters, respectively altering the width and symmetry of the relaxation mode.
There are various kinds of formulations for epoxy coatings; therefore, the optical parameters are different. Generally, the main components of epoxy coating are epoxy resin and curing agent; the optical properties and spectroscopy of their mixtures play the main role in the epoxy coating. Thus, the spectral characteristics of the epoxy resin mixtures in the terahertz band range have been investigated by many researchers in recent years [20,21]. Terahertz-pulsed spectroscopy uses short pulses of terahertz radiation with a wideband spectrum to measure the terahertz optical properties of media. According to the refractive index and absorption spectra of the epoxy resin mixtures studied [22,23], the Debye dispersive model was suitable for describing the material dispersion of epoxy coatings in the terahertz low frequency band. Thus, with Equation (11), for the Debye dispersive model, σ c c = σ c D = 1 . That is
ε ( ω ) = ε + ε s ε 1 + i ω τ
Studies have shown that the refractive index value of an epoxy resin mixture has little volatility in a certain frequency range [24,25], therefore the refractive index n of the epoxy coating was supposed to not be dependent on frequency. It could be measured first by the experimental test, and subsequently the high-frequency permittivity ε could be calculated as it approximately equals n2.

2.3. Simulation Parameter Setting

The commercial software XFdtd 7.3.0 (Remcom Inc., State College, PA, USA) was used to carry out the FDTD calculation. The coating surface is set at the Oxy plane, with the Gaussian pulse plane wave incident on the sample. The side length of the cubical cell was set at 0.0075 mm, and the frequency range was about 0–4 THz. A perfectly matched layer’s (PML) absorbing boundary was used. The time step was determined according to the stability criteria of the FDTD algorithm of 0.0144166 ps, and the program was run for 4096 time steps. With experimental detection, the terahertz probe pulse generally obliquely impacts the sample. The simulations with the vertical incidence mode (theta = 0°, phi = 0°) and the oblique incidence mode (theta = 30°, phi = 0°) were investigated, respectively, and then compared. In commercial software, the planar sensor is often used to record time-varying electric and magnetic fields during the whole calculation period, and the reflected waveforms at the interface can be recorded and identified. Figure 3 shows the interaction of the terahertz wave with the coating collected by the planner sensors in two incidence situations. Figure 3a-1–a-8 show the situation in vertical incidence mode, and Figure 3b-1–b-8 show the situation in 30° theta incidence mode. The sample model (2 mm × 2 mm size) was one epoxy coating layer (380 μm thickness) painted on the steel substrate, where the delamination defect (100 μm thickness) was set beneath the coating. With the planner sensors, transmission of the terahertz pulse through the sample and reflection of the pulse from the sample surface were obvious, either with the oblique incidence or with the vertical incidence. It would help to investigate the interaction of the pulse terahertz wave with the coating sample. It needs to be noted that the vertical incidence mode was more intuitive and convenient; therefore, the following simulations adopted this mode.
In addition, simulated results obtained by the preset point sensors ((−1, 0, 1.2) and (−1, 0, 1.0), respectively, with the vertical incidence mode were shown in Figure 4, where (a) was the recorded reflection of the coating with no defect and (b) was that of the coating with a delamination defect. Due to the energy loss of the wave propagation, the collected time domain data were different for various locations of the point sensors. When the point sensor was set far away from the coating surface (here the point sensor (−1, 0, 1.2) was farther than the point sensor (−1, 0, 1.0)), the sidelobe effect of the reflected pulse was more evident. This performance was not beneficial for the defective structural analysis because the sidelobe effect would overlap with the defect information.
Accordingly, the point sensor seems unsuitable for data acquisition and further structural analysis. Thus, the far-zone sensor was adopted to record the electric fields of the reflected pulses. Figure 5 shows the data collected by the far zone sensor with various incident modes.
Figure 5a presented the recorded reflection of the coating with no defect, and Figure 5b was that of the coating with a delamination defect. As can be seen from the figures, the sidelobe effect was more evident with the oblique incidence mode, which increases the difficulty of analyzing the subsequent reflected waves while the vertical incidence mode had a smaller sidelobe effect. With the Far Zone sensor, the collected time domain data were more suitable for the subsequent deconvolution process and then for further structural analysis. The deconvolution was performed by dividing the raw terahertz detected signal by a reference signal in the frequency domain; please refer to our precious work [26].

3. Results

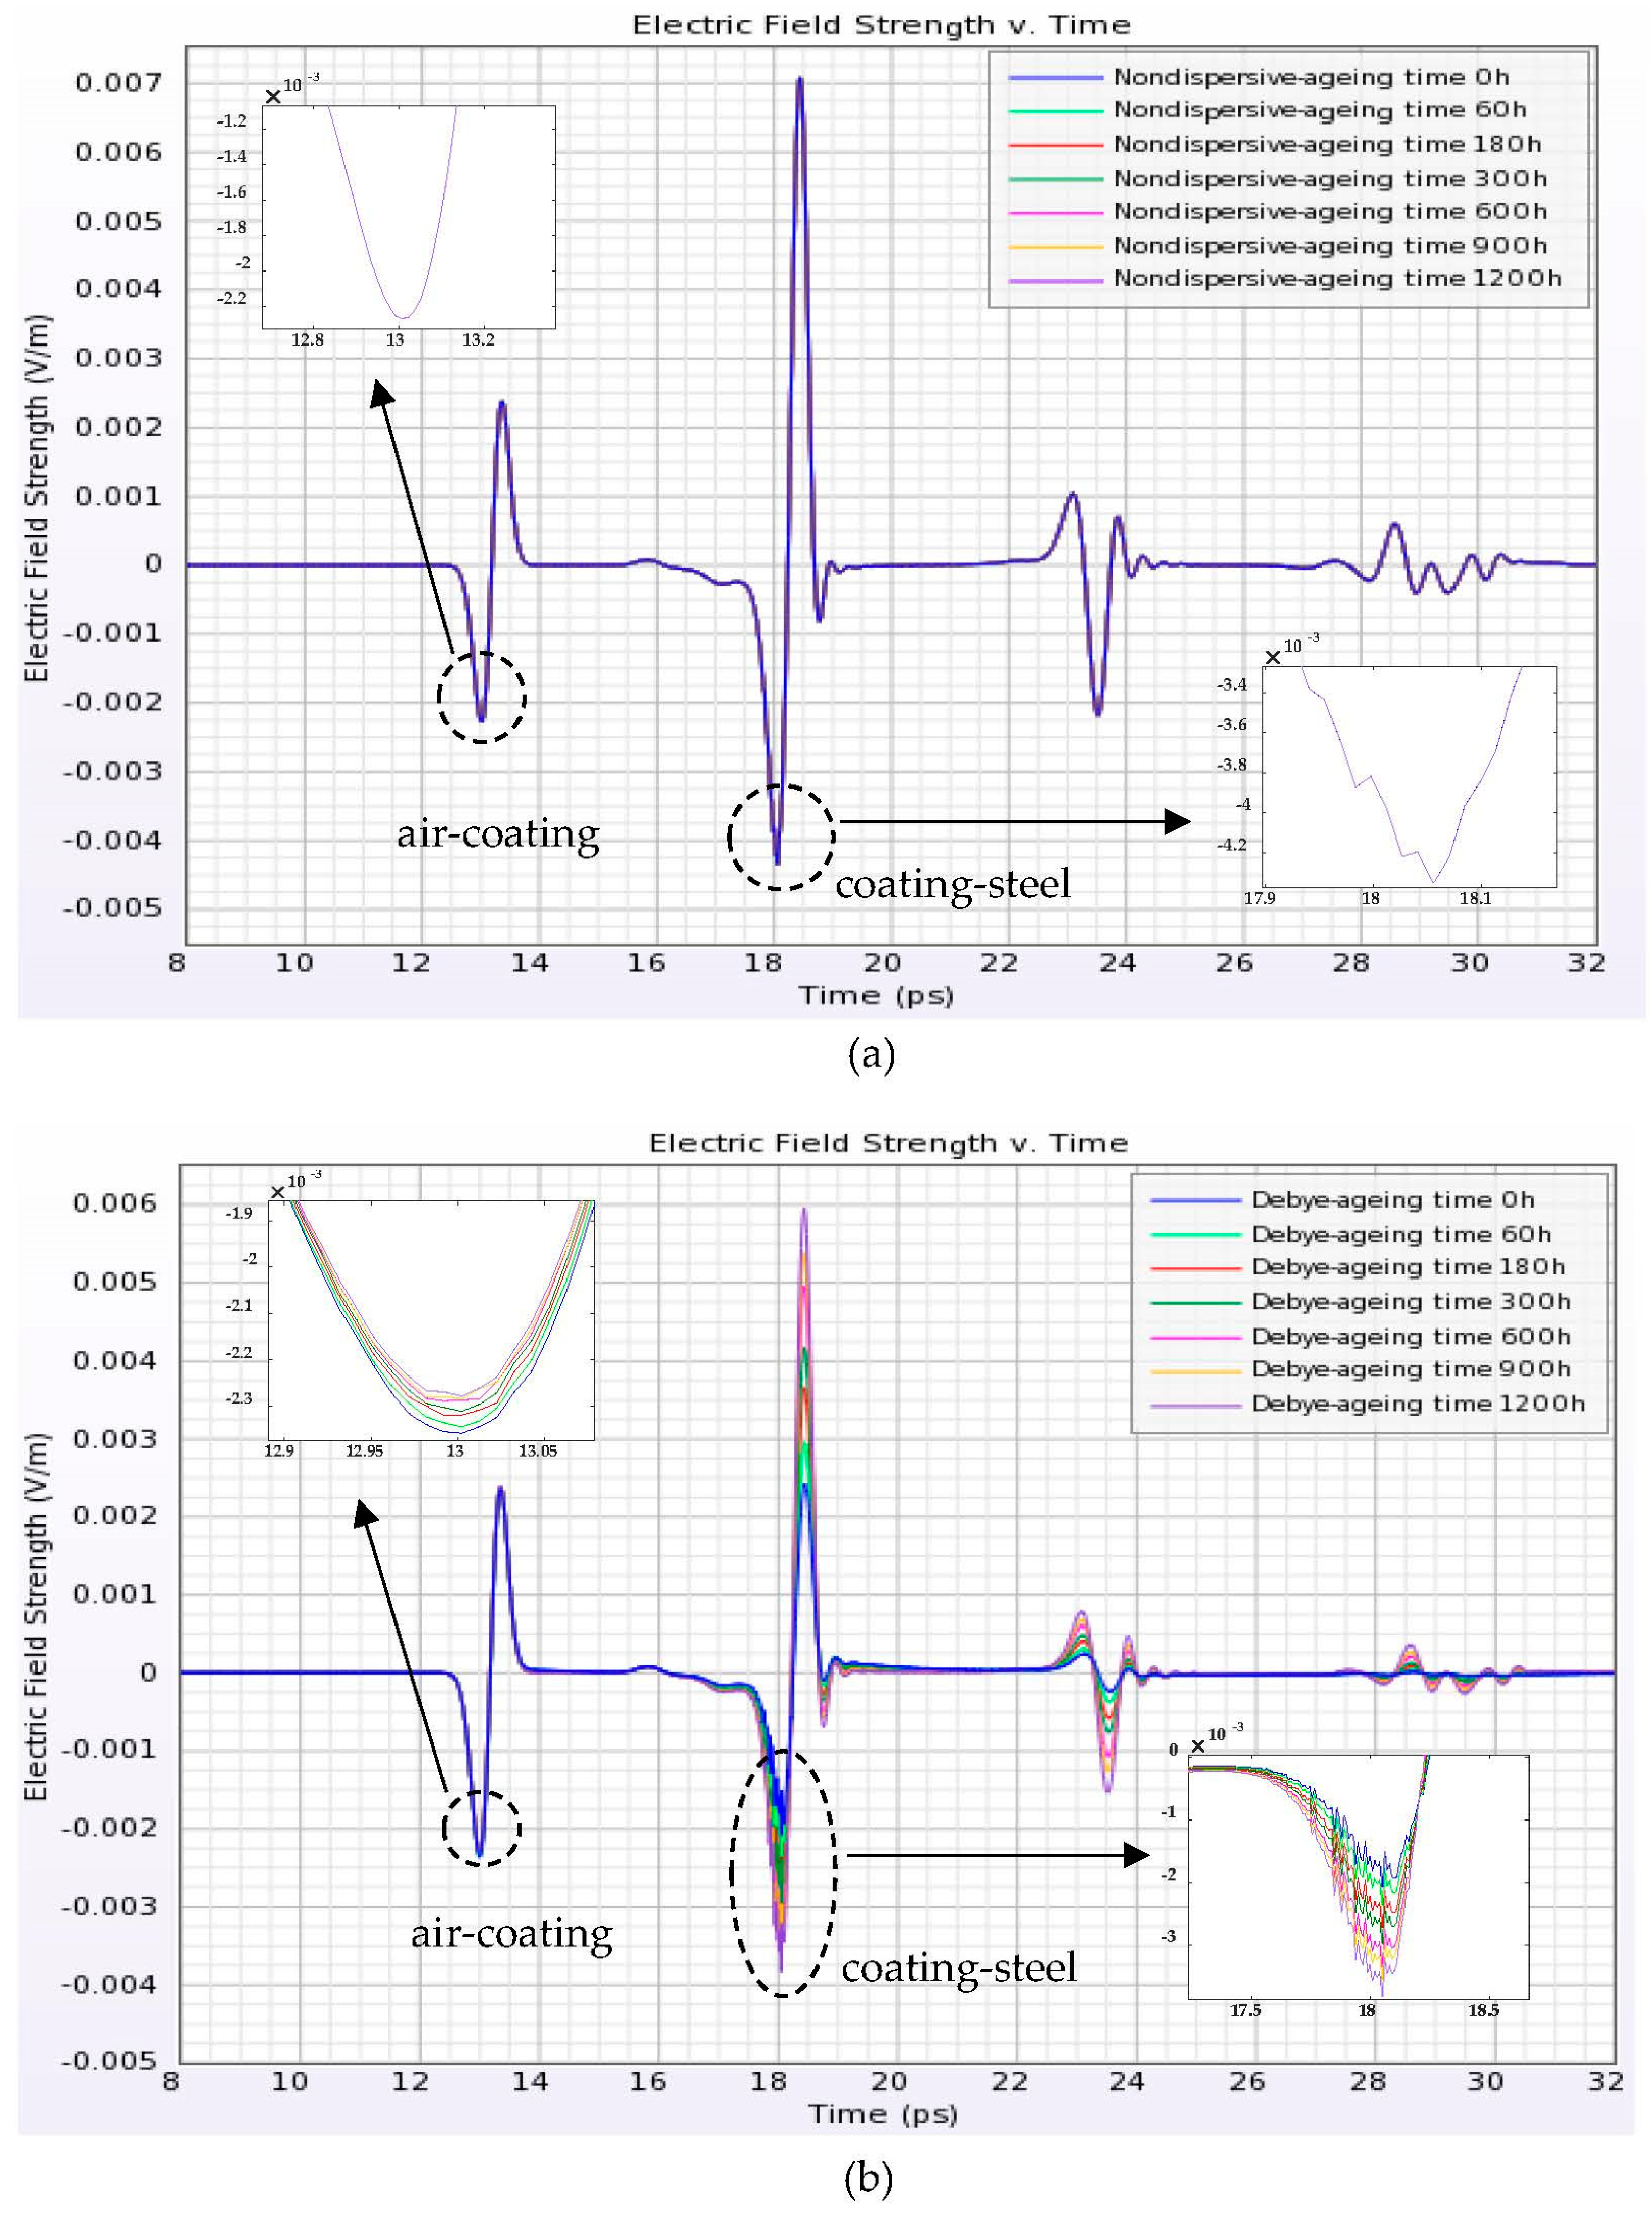
3.1. Simulation of Epoxy Coating Aging

Here, the experimental epoxy coating samples adopted one kind of commercial anticorrosive paint (commonly used in marine structural parts), which consists of epoxy resins, polyurethane, etc. The intact coating sample was made at 1.5 cm × 1.5 cm size with a 310 μm thick epoxy paint layer on the steel substrate. The measurement was carried out by the Reflection Imaging Module (RIM) of the TeraPulse 4000 (TeraView Ltd., Cambridge, UK) system, with the spectrum ranging from 0.1 to 4 THz. Meanwhile, simulations were carried out, where the traditional Nondispersive model and Debye model were established for the epoxy coating, respectively. With the Debye model, the refractive index of the nepoxy coating can be deduced through the terahertz experimental signal, and it was about 1.9589; therefore, in the simulation model, the high-frequency permittivity ε was set as 3.83729. The static relative permittivity was about 5.2, measured with the digital bridge analyzer. Anyway, the time scale of electric conductivity was set at 10−13 s/m according to the reference [27]. And a picosecond time scale was set for the relaxation time [28,29]. With Nondispersive model, the refractive index and the electrical conductivity should be set. Here the parameters were set to the value mentioned above, the same as in the Debye model. After the deconvolution process, the simulation results were compared with the experimental detection results. Figure 6 shows the impulse functions derived from the deconvolution process for the experimental test signal and various simulation models.
The comparison showed that for the series reflected pulses caused by the different interface layers, the reflection arrival time was consistent with the two models, and both can be in good agreement with the experimental results. The Nondispersive model had been used in the previous studies to perform structural analysis and calculate the coating thickness, where satisfactory results could be obtained [13,14]. However, the amplitude relationship of the reflection peak in simulation with Nondispersive model was very different from the experimental test. That was mainly because the dispersive properties and the specific conductivity of coatings were negligible in the model, and the wave reflected by the coating/steel interface has great energy reservations. Actually, the paint layer would dissipate some energy, and the signal reflected by the coating/steel interface would inevitably get smaller. From the figure, using the proposed Debye model could obtain a better fit to the experimental data, indicating that the Debye dispersive mechanism is more suitable to characterize the epoxy protective coating.
Anyway, for the coated steel plate, the epoxy protective layer may degrade with long-term service. The gradually aged process would cause the medium’s characteristics to change. It has been verified that the dielectric constant of the coating would decrease due to aging, which is the main reason for the weakened inhibition of the coating on particles [30]. Therefore, the coating layer degradation monitoring during its service process can provide an important reference for the engineers to prevent the premature appearance of corrosion degradation. Herein, the situation of coating deterioration was simulated: One was adopting the Nondispersive model, where the conductivity change with the service time was taken into account but the static permittivity was not; the other established the epoxy coating as the Debye model, where both the dielectric parameters and conductivity change with the service time according to the values provided by the reference [30]. Figure 7 shows the simulation results of the aging coating using various medium models, where the epoxy coating layer was set at 380 μm thickness (a) in Nondispersive mode and (b) in Debye model. With the Nondispersive model, if only considering the conductivity change of paint, there was hardly any change as the service time increased; therefore, it was impossible to provide more information about the aging of the coating. While using the Debye model, it can be seen that the change in the electromagnetic properties of the coating caused by the aging could be manifested significantly with terahertz wave propagation. The electrical conductivity of the coating increases with aging and deterioration, and as the dielectric constant becomes smaller, the dielectric loss decreases. Therefore, the results obtained with Debye model simulation could better reflect the pulsed terahertz wave propagation in organic coatings.

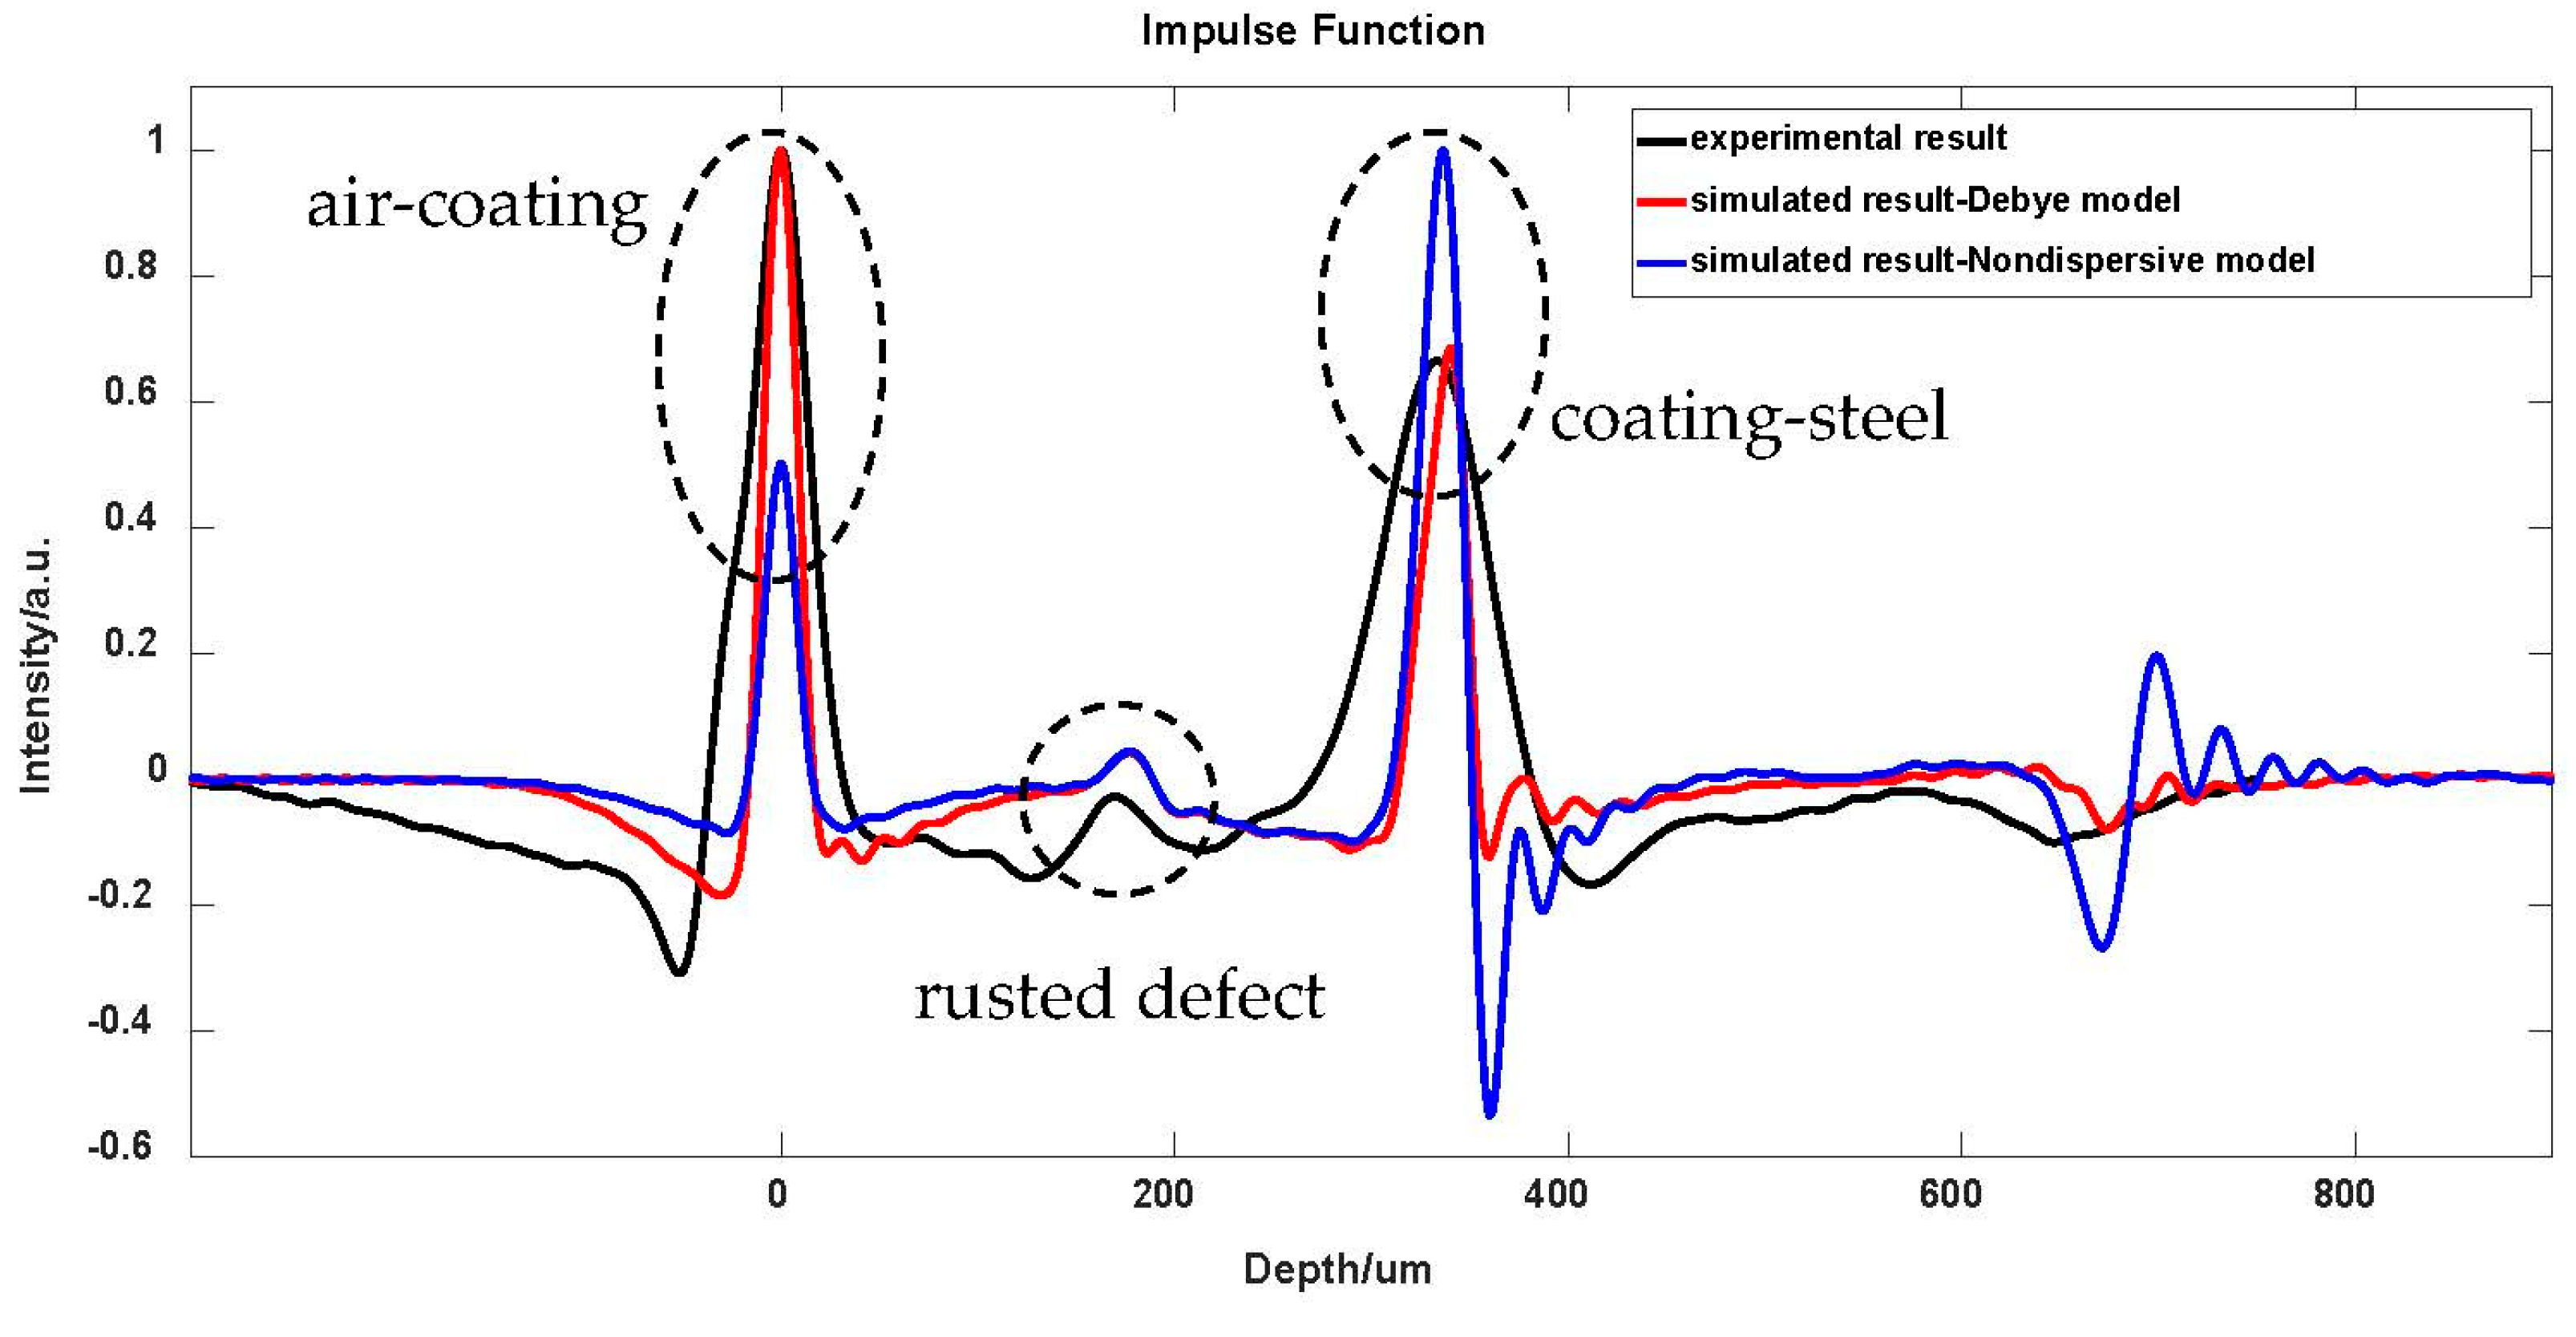
3.2. Simulation of Epoxy Coating with Rusted Defect

It has been demonstrated that the detection of rust regions in coated steel plates can be well implemented by terahertz imaging technology [31,32]. Sometimes the rust residue would stay on the steel substrate if the pre-cleaning was not enough before paint spraying. Both simulation and experiment were investigated here. The defective sample was also cut at 1.5 cm × 1.5 cm with a 330 μm thick epoxy paint layer sprayed on the steel substrate and a 160 μm thick corroded steel area beneath the coating. Both the Nondispersive model and the Debye model were established. With the Debye model, the coating parameters were set the same as in the last section. The refractive index of the rusted defect was set at 3.1 [31]. The iron oxide, which belongs to n-type conductive materials with semiconductor properties, is the main component of the rust. However, many researchers have verified that corrosion rust is a mixture with excellent electrical conductivity, and its electrical conductance increases with the rate of corrosion. Anyway, although its dielectric parameter would also change with the corrosion state, it has little effect on the detection result due to the higher conductivity [33,34]. With the simulation, the conductivity of the rusted defect was set at 0.75 × 10⁶ S/m, and the dielectric parameter was 14.2 [35]. The coating parameters were set according to the unaged state. Figure 8 shows the impulse functions obtained by the deconvolution process, where the two kinds of simulation results were compared with the experimental results. With Nondispersive model, the refractive index and the electrical conductivity were also set to the same value as the Debye model. Apparently, the Debye model could obtain a more satisfied result, which is in good agreement with the experimental result.
In addition to the coating layer’s deterioration, corrosion of the metal substrate also gradually appears. Generally, rusting on coated steel plates is often observed after the film degrades. Furthermore, the expanded rust layer causes coating cracking and spalling, which would make it more vulnerable to corrosion. Herein, the situation of coating deterioration along with steel corrosion was simulated. Both Nondispersive model and the Debye model were established. The epoxy coating layer was set at 380 μm thickness, and the depth of the rusted defect increased from 50 μm to 100 μm as the service time increased. Figure 9 shows the simulation results of the aging coating with various sizes of rusted defects using various medium models, where (a) was Nondispersive mode and (b) was the Debye model. Obviously, compared with the Nondispersive model, using the Debye model could reflect more changes in structural information along with the aging deterioration, which would provide important reference value.

4. Conclusions

This work presents an improved model using the FDTD method to calculate the propagation and reflection of terahertz radiation from an epoxy coating structure, either intact or defective. Debye relaxation mechanism was taken into account, especially for the aging and deterioration of the epoxy coating. Epoxy coating samples were also made for experimental testing by a commercial terahertz pulsed imaging system. The results of various simulation models were then compared with the experimental results, and the results indicated that the Debye model could obtain better consistent with the experiments. Compared with the traditional Nondispersive model, the reflected terahertz wave varied obviously in amplitude and spectral characteristics as a function of the optical and dielectric properties of the coating. The analysis showed the improved model was more suitable to explain the coating change along with the aging deterioration, and it could provide an important reference value for further analysis of various defective coating structures.

Author Contributions

Conceptualization, W.T. and S.Z.; methodology, W.T. and S.Z.; software, W.T.; validation, W.T. and M.L.; formal analysis, W.T.; investigation, W.T., Q.Z. and Y.H.; resources, W.T. and S.Z.; data curation, W.T. and Q.Z.; writing—original draft preparation, W.T.; writing—review and editing, S.Z., Q.Z., Y.H. and M.L.; visualization, W.T. and Q.Z.; supervision, W.T.; project administration, W.T. and S.Z.; funding acquisition, W.T., S.Z. and M.L. All authors have read and agreed to the published version of the manuscript.

Funding

This research was funded by the Youth Fund of the National Natural Science Foundation of China, grant number 52101355; the National Natural Science Foundation of China, grant number 51905102; and the Youth Fund of the Fujian Provincial Natural Science Foundation, grant number 2022J05256.

Institutional Review Board Statement

Not applicable.

Informed Consent Statement

Not applicable.

Data Availability Statement

The data presented in this study are available on request from the corresponding author.

Conflicts of Interest

The authors declare no conflict of interest.

References

  1. Ellrich, F.; Bauer, M.; Schreiner, N.; Keil, A.; Pfeiffer, T.; Klier, J.; Weber, S.; Jonuscheit, J.; Friederich, F.; Molter, D. Terahertz quality inspection for automotive and aviation industries. J. Infrared Millim. Terahertz Waves 2020, 41, 470–489. [Google Scholar] [CrossRef]
  2. Fuse, N.; Fukuchi, T.; Mizuno, M.; Fukunaga, K. High-speed underfilm corrosion imaging using a terahertz camera. Electr. Commun. Jpn. 2016, 99, 86–92. [Google Scholar] [CrossRef]
  3. Roqueta, G.; Jofre, L.; Feng, M.Q. Analysis of the electromagnetic signature of reinforced concrete structures for nondestructive evaluation of corrosion damage. IEEE T. Instrum. Meas. 2012, 61, 1090–1098. [Google Scholar] [CrossRef]
  4. Rana, S.; Rakin, A.S.; Hasan, M.R.; Reza, M.S.; Leonhardt, R.; Abbott, D.; Subbaraman, H. Low loss and flat dispersion Kagome photonic crystal fiber in the terahertz regime. Opt. Commun. 2018, 410, 452–456. [Google Scholar] [CrossRef]
  5. Serebryannikov, A.E.; Alici, K.B.; Ozbay, E.; Lakhtakia, A. Thermally sensitive scattering of terahertz waves by coated cylinders for tunable invisibility and masking. Opt. Express 2018, 26, 1–14. [Google Scholar] [CrossRef] [PubMed]
  6. Lopato, P.; Chady, T.; Sikora, R.; Gratkowski, S.; Ziolkowski, M. Full wave numerical modelling of terahertz systems for nondestructive evaluation of dielectric structures. COMPEL-Int. J. Comput. Math. Electr. Electron. Eng. 2013, 32, 736–749. [Google Scholar] [CrossRef]
  7. Zhou, T.Y.; Li, L.J.; Ren, J.J.; Zhang, D.D.; Zhang, J.Y. Pulsed terahertz nondestructive testing of glass fiber reinforced plastics based on FDTD. Acta Opt. Sin. 2020, 40, 1226002. (In Chinese) [Google Scholar] [CrossRef]
  8. Zhu, L.L.; Ren, J.J.; Zhang, D.D.; Li, L.J. Analysis of debonding defects of GFRP in terahertz nondestructive testing based on FDTD. In Proceedings of the 2021 46th International Conference on Infrared, Millimeter and Terahertz Waves (IRMMW-THz), Chengdu, China, 29 August–3 September 2021; p. 9566879. [Google Scholar] [CrossRef]
  9. Xu, Z.; Ye, D.D.; Chen, J.; Zhou, H.T. Novel terahertz nondestructive method for measuring the thickness of thin oxide scale using different hybrid machine kearning models. Coatings 2020, 10, 805. [Google Scholar] [CrossRef]
  10. Ye, D.D.; Wang, W.Z.; Yin, C.D.; Xu, Z.; Zhou, H.T.; Fang, H.J.; Li, Y.J.; Huang, J.B. Pulsed terahertz spectroscopy combined with hybrid machine learning approaches for structural health monitoring of multilayer thermal barrier coatings. Opt. Express 2020, 28, 34875–34893. [Google Scholar] [CrossRef]
  11. Cao, B.H.; Cai, E.; Fan, M.B. NDE of discontinuities in thermal barrier coatings with terahertz time-domain spectroscopy and machine learning classifiers. Mater. Eval. 2021, 79, 125–135. [Google Scholar] [CrossRef]
  12. Jiang, X.L.; Xu, Y.; Zhao, D.C. Terahertz Non-destructive testing and imaging of corrosion in coated steel plates. Constr. Build. Mater. 2023, 385, 131427. [Google Scholar] [CrossRef]
  13. Tu, W.L.; Zhong, S.C.; Shen, Y.C.; Incecik, A.; Fu, X.B. Neural network-based hybrid signal processing approach for resolving thin marine protective coating by terahertz pulsed imaging. Ocean Eng. 2019, 173, 58–67. [Google Scholar] [CrossRef]
  14. Tu, W.L.; Zhong, S.C.; Shen, Y.C.; Incecik, A. Nondestructive testing of marine protective coatings using terahertz waves with stationary wavelet transform. Ocean Eng. 2016, 111, 582–592. [Google Scholar] [CrossRef]
  15. Sullivan, D.M. Electromagnetic Simulation Using FDTD Method; IEEE Microwave Theory Society: Piscataway, NJ, USA, 2013; pp. 67–99. [Google Scholar]
  16. Taflove, A.; Umashankar, K.R. The finite-difference time-domain method for numerical modeling of electromagnetic wave interactions. Electromagnetics 1990, 10, 105–126. [Google Scholar] [CrossRef]
  17. Hu, S.; Liu, L.; Gao, T.C.; Zhang, T.; Chen, M. A scattering simulation model for nonspherical aerosol particles based on parallel FDTD scheme. Int. Arch. Photogramm. Remote Sens. Spat. Inf. Sci. 2019, 42, 71–76. [Google Scholar] [CrossRef]
  18. Barden, P.; Sosiak, C.E.; Grajales, J.; Hawkins, J.; Rizzo, L.; Clark, A.; Gatley, S.; Gatley, I.; Federici, J. Non-destructive comparative evaluation of fossil amber using terahertz time-domain spectroscopy. PLoS ONE 2022, 17, e0262983. [Google Scholar] [CrossRef] [PubMed]
  19. Roggero, A.; Caussé, N.; Dantras, E.; Villareal, L.; Santos, A.; Pebere, N. Thermal activation of impedance measurements on an epoxy coating for the corrosion protection: 1. dielectric spectroscopy response in the dry state. Electrochim. Acta 2019, 303, 239–245. [Google Scholar] [CrossRef]
  20. Macutkevic, J.; Seliuta, D.; Valusis, G.; Adomavicius, R.; Kuzhir, P.; Paddubskaya, A.; Shuba, M.; Maksimenko, S.; Coderoni, L.; Micciulla, F.; et al. Terahertz time domain spectroscopy of epoxy resin composite with various carbon inclusions. Chem. Phys. 2012, 404, 129–135. [Google Scholar] [CrossRef]
  21. Kusano, M.; Kubouchi, M.; Bulgarevich, D.S.; Shiwa, M. Non-destructive evaluation by terahertz spectroscopy for penetration of acid solutions into epoxy resin. Express Polym. Lett. 2016, 10, 941–949. [Google Scholar] [CrossRef]
  22. Miao, Q.; Zhao, K.; Tian, L.; Zhao, G.Z.; Liu, L.M. Research on spectroscopy of epoxy resin and its mixture in terahertz range. Mod. Sci. Instrum. 2011, 6, 31–33. (In Chinese) [Google Scholar]
  23. Zhang, J.; Cui, H.L.; Shi, C.C.; Chen, J.D.; Zhang, Z.Y.; Han, X.H. Terahertz spectroscopic study on the property of epoxy resin adhesive. Spectrosc. Spectr. Anal. 2016, 36, 919–932. (In Chinese) [Google Scholar]
  24. Cheng, B.; Ren, J.; Gu, J.; Li, L.; Gao, T. High-precision thickness detection of coatings based on terahertz propagation simulation model. Acta Opt. Sinica. 2020, 40, 80–86. (In Chinese) [Google Scholar]
  25. Rutz, F.; Koch, M.; Khare, S.; Moneke, M.; Richter, H.; Ewert, U. Terahertz quality control of polymeric products. Int. J. Infrared Millim. Waves 2006, 27, 547–556. [Google Scholar] [CrossRef]
  26. Tu, W.L.; Zhong, S.C.; Luo, M.T.; Zhang, Q. Non-destructive evaluation of hidden defects beneath the multilayer organic protective coatings Based on terahertz technology. Front. Phys. 2021, 9, 676851. [Google Scholar] [CrossRef]
  27. Ma, H.B.; Tang, C.; Tang, A.B.; Ma, Q.K.; Yang, B.; Wang, G. Study on dielectric constant and dielectric loss factor of epoxy resin _DDS curing agent system. Transformer 2007, 44, 41–42. (In Chinese) [Google Scholar]
  28. Yakovlev, E.V.; Zaytsev, K.I.; Dolganova, I.N.; Yurchenko, S.O. Non-destructive evaluation of polymer composite materials at the manufacturing stage using terahertz pulsed spectroscopy. IEEE Trans. Terahertz Sci. Technol. 2015, 5, 810–816. [Google Scholar] [CrossRef]
  29. Prevosto, D.; Bartolini, P.; Torre, R.; Ricci, M.; Taschin, A.; Capaccioli, S.; Lucchesi, M.; Rolla, P. Relaxation processes in an epoxy resin studied by time-resolved optical kerr effect. Phys. Rev. E Stat. Nonlinear Soft Matter Phys. 2002, 66, 011502. [Google Scholar] [CrossRef]
  30. Wang, J.; Wang, Z.; Liu, R.Y.; Xiao, R.F.; Li, Q.M. Study on adhesion reliability and particle inhibition of epoxy resin coating in DC GIL after thermal ageing experiment. Coatings 2022, 12, 858. [Google Scholar] [CrossRef]
  31. Fuse, N.; Fukuchi, T.; Takahashi, T.; Mizuno, M.; Fukunaga, K. Evaluation of applicability of noncontact analysis methods to detect rust regions in coated steel plates. IEEE Trans. Terahertz Sci. Technol. 2012, 2, 242–249. [Google Scholar] [CrossRef]
  32. Wu, R.K.; Zhang, H.; Yang, R.Z.; Chen, W.H.; Chen, G.T. Nondestructive testing for corrosion evaluation of metal under coating. J. Sens. 2021, 2021, 6640406. [Google Scholar] [CrossRef]
  33. Cheng, Y.; Hanif, A.; Chen, E.; Ma, G.C.; Li, Z.J. Simulation of a novel capacitive sensor for rebar corrosion detection. Constr. Build. Mater. 2018, 174, 613–624. [Google Scholar] [CrossRef]
  34. Madhavi, T.C.; Annamalai, S. Electrical conductivity of concrete. ARPN J. Eng. Appl. Sci. 2016, 11, 5980–5982. [Google Scholar]
  35. He, Y.Z.; Tian, G.Y.; Zhang, H.; Alamin, M.; Simm, A.; Jackson, P. Steel corrosion characterization using pulsed eddy current systems. IEEE Sens. J. 2012, 12, 2113–2119. [Google Scholar] [CrossRef]
Figure 1. Terahertz pulses reflected from the sample.
Coatings 13 01593 g001
Figure 2. FDTD algorithm (a) the Yee cell (b) electric and magnetic field components upgraded step by step.
Coatings 13 01593 g002
Figure 3. The interaction of terahertz waves with coating structures collected by the planner sensors (a-1)–(a-8) vertical incidence mode (b-1)–(b-8) 30° theta incidence mode.
Coatings 13 01593 g003
Figure 4. Time domain data collected by point sensors (a) with no defect (b) with delamination defect.
Coatings 13 01593 g004
Figure 5. Time domain data collected by Far Zone sensors (a) with no defect (b) with delamination defect.
Coatings 13 01593 g005
Figure 6. Impulse functions of the experimental test signal and various simulation models for an intact coating sample.
Coatings 13 01593 g006
Figure 7. Simulation results for an intact coating sample (a) Nondispersive mode (b) Debye model.
Coatings 13 01593 g007
Figure 8. Impulse functions of the experimental test signal and various simulation models for coating sample with rusted defect.
Coatings 13 01593 g008
Figure 9. Simulation results for coating sample with rusted defect (a) Nondispersive mode (b) Debye model.
Coatings 13 01593 g009
Disclaimer/Publisher’s Note: The statements, opinions and data contained in all publications are solely those of the individual author(s) and contributor(s) and not of MDPI and/or the editor(s). MDPI and/or the editor(s) disclaim responsibility for any injury to people or property resulting from any ideas, methods, instructions or products referred to in the content.

