Article

Effect of Re Addition on Microstructure and Oxidation Resistance of Co-Cr-Ta-Ti-C Alloys

by
Louis Etienne Moreau
1,2,
Santhosh Banoth
2,3,
Akira Ishida
2 and
Hideyuki Murakami
1,2,*
1
Department of Nanoscience and Nanoengineering, Waseda University, 3-4-1 Okubo, Shinjuku, Tokyo 169-8555, Japan
2
Research Center for Structural Materials, National Institute for Materials Science, 1-2-1 Sengen, Tsukuba 305-0047, Japan
3
Department of Mechanical Systems Engineering, Tokyo Metropolitan University, 1-1, Tokyo 192-0397, Japan
*
Author to whom correspondence should be addressed.
Coatings 2024, 14(1), 26; https://doi.org/10.3390/coatings14010026
Submission received: 15 November 2023 / Revised: 17 December 2023 / Accepted: 22 December 2023 / Published: 25 December 2023
(This article belongs to the Section Surface Characterization, Deposition and Modification)

Abstract

:
This study investigated the effect of Re addition on the microstructural evolution and oxidation resistance of Co-Cr-Ta-Ti-C alloys. The alloys tested in this study consisted of a Co-rich matrix with mixed HCP and FCC phases, together with TaTiC2- and Ti-based carbides. The addition of Re promotes the precipitation and growth of a CoCr-rich σ-phase. Differential thermal analysis (DTA) showed that the melting temperatures did not drastically change up to 10 at% Re addition, whereas 15 at% Re addition significantly increased the melting temperature of the alloys. Oxidation tests in air at 1200 °C showed that an excessive Re content could lead to a deterioration in oxidation resistance, mainly due to the accelerated formation of volatile Re oxides.

1. Introduction

In high-temperature industrial processes, increasing the operating temperature generally increases the efficiency of the processes. For example, in internal combustion engines such as jet engines and gas turbines, increasing the turbine inlet temperature increases the efficiency and thus contributes to CO2 reduction [1]. Developing materials that can withstand higher-temperature environments is therefore an ongoing challenge for materials scientists.
Currently, Ni-based and Co-based superalloys are the primary materials used in the hottest sections of gas turbines because they are known to possess a good balance of high-temperature mechanical strength and oxidation resistance [2,3,4,5,6]. In Ni-based or Co-based superalloys, L12-structured Ni3Al or Co3Al-based precipitates mainly improve their mechanical properties. Alloying addition of Al also effectively improves their oxidation resistance by forming a stable Al2O3 layer on their surfaces.
On the other hand, the glass industry also urgently needs to develop materials that can withstand harsh, high-temperature environments. For example, short glass fibers are produced using a spinner, which is a cylindrical component with many small holes on its side. Molten glass is poured into the spinner, which is rotated at high speed, and the glass is drawn out of the small holes via the centrifugal force. Therefore, spinners need to have high-temperature mechanical strength and erosion resistance to withstand contact with hot molten glass as well as oxidation resistance. However, the use of superalloys strengthened with Ni3Al- or Co3Al-type precipitates is not feasible due to the reaction between Al in the alloys and oxygen, resulting in the formation of Al2O3. This could lead to dissolution in the liquid glass and subsequent contamination. Si-containing alloys are also unsuitable for this purpose. Employing Co-Cr-based alloys might be the sole feasible resolution for the glass industry.
Berthod et al. proposed Co-Cr-Ta-Ti-C alloys with reasonable mechanical properties at high temperatures [7,8]. The alloy system is strengthened by the formation of Ti and Ta carbides [9,10], having a reasonable combination of mechanical properties and oxidation resistance at high temperatures. The alloys are frequently used as components in glass fiber fabrication due to their lack of Al or Si [9,10].
However, the alloy system requires further improvement to enhance its fiber producibility. The design of alloys with superior mechanical properties and oxidation resistance is necessary. Increasing the melting point of alloys is one potential approach, as metallic materials typically experience strength loss when heated near melting temperatures. Since the Co-Cr-Ta-Ti-C alloy system developed by Berthod et al. is predicted to have a melting point of 1200 to 1400 °C [7], further alloy design is needed to increase the melting point, considering its applications at temperatures above 1000 °C. Oxidation properties are another issue. In the Co-Cr-Ta-Ti-C alloy system, Cr2O3 is formed on the alloy surface. While Cr2O3 remains stable up to 1000 °C, it rapidly loses its protective properties at higher temperatures due to its favored transformation into gaseous CrO3 [11,12,13,14,15]. Therefore, there is a pressing need to develop a material with increased resistance to oxidation and a higher melting point.
To increase the melting temperature of alloys, the addition of the refractory element of Re (3182 °C) is promising. Re readily dissolves into Co and forms a continuous solid solution system. Consequently, the melting temperatures of Co-Re-based alloys with specific strengths exceed those in Ni-based superalloys [16,17]. Superalloys used in gas turbines also need good mechanical properties at elevated temperatures [18], which can be achieved by adding Re [19,20].
Conversely, prior research [21] has indicated that Co-Re binary alloys exhibit poor oxidation resistance due to the development of a non-protective and porous Co-oxide layer. This results in the significant loss of Re caused by the formation of volatile ReO3 [21,22]. To enhance oxidation resistance, it is crucial to incorporate more than 25 at% of Cr into the Co-Re alloy to form Cr2O3 [23,24]. This hinders the Re oxide’s evaporation, guarding against severe oxidation at elevated temperatures. Alternatively, the possible formation of CrTaO4 could also protect Co-Re alloys against oxidation [25]. Investigation into how the addition of Re affects the oxidation resistance of Co-Cr-Ta-Ti-C is needed.
From these viewpoints, we investigated the impact of Re addition on the microstructure, melting temperature, and oxidation resistance of the Co-Cr-Ta-Ti-C alloy system.
Four alloys with varying Re contents (ranging from 0 at% to 15 at%, with the base Co-Cr-Ta-Ti-C alloy) were characterized, and their microstructures, changes in phase constitution, melting temperatures, and oxidation kinetics were examined at 1200 °C. The experimental results were compared with thermodynamic calculation predictions to evaluate the applicability of thermodynamic calculations for the design of this alloy system.

2. Experimental Procedures

The compositions of alloys investigated in this study are listed in Table 1. Cobalt was chosen as the primary component due to its high-temperature performance, chromium was added for improved oxidation resistance, and titanium and tantalum were added to strengthen the alloys by forming (Ta and Ti) carbides, respectively. The composition of Re-0 was determined based on the design of Berthod et.al., as described in Section 1 in the literature [7,8]. Rhenium was included in the range of 0–15 at% to examine its effect on the microstructure and oxidation kinetics. The alloys were fabricated using the arc melting method, where a mixture of source elements with a purity of higher than 99.9% was placed in a water-cooled copper mold and melted to form approximately 15 g of alloy buttons. These buttons were then sealed in quartz ampoules under argon and heat-treated at 1200 °C in a box furnace (SANSYO, MSFT-1520, Japan) followed by air cooling to homogenize the samples.
Phase identification was conducted using X-ray diffractometry (XRD) (MINIFLEX, Rigaku, Tokyo, Japan). In the XRD analysis, the Cr Kα X-ray (λ = 2.2909 Å) target was used, with the scanning angle (2θ) ranging from 30 to 140°. After screening the possible phases using the Smartlab Studio II software, they were confirmed by comparing the interplanar distance (dhkl) calculated from the diffraction patterns with those from the International Centre for Diffraction Data (ICDD) cards of the highest quality [26]. From the set of d-values, the crystal structure and the lattice parameter a (Å) of a specific phase were identified using codes such as d h k l = a h 2 + k 2 + l 2   for a cubic phase and d h k l = a h 2 + k 2 + a 2 c 2 l 2   for a tetragonal phase for a given (hkl) crystal orientation.
Microstructural observation and local chemical analysis of the specimens were carried out using scanning electron microscopy with energy-dispersive spectroscopy (SEM-EDS) (JSM-7200F, JEOL, Akishima, Japan), respectively. For the microstructural and local chemical analyses, the backscattered electron (BSE) mode was mainly used. Samples were first mounted using conductive resin (Polyfast), heated at 180 °C for 3 min, and cooled for 2 min. They were then polished using Emery paper up to 400 grit (38 µm), followed by the Metadi Supreme Polycrystalline Diamond suspension up to 1 µm, and finished with a Chemomet cloth and Mastermet colloidal silica polishing suspension etching (up to 0.5 µm). EDS analysis was utilized to determine the composition of each phase, with the composition of each phase being averaged over a minimum of twenty measurements.
The melting temperatures for each alloy composition were measured using differential thermal analysis (DTA) (Labsys, Setaram) [27]. DTA samples were cut into small cylinders with a diameter of approximately 3 mm. They were then heated from room temperature to 1550 °C and cooled at a heating/cooling rate of 10 °C/min in a flowing Ar atmosphere. An empty Al2O3 crucible was used as a reference. To characterize the microstructural changes in the alloys after oxidation, small pieces of samples were oxidized in a muffle furnace at 1200 °C in air for 20 h. The samples were placed on an Al2O3 plate, which was then slid into the furnace after it reached the target temperature. After 20 h of oxidation, the samples were removed from the furnace and air-cooled to room temperature. The sample mass changes were measured by weighing the samples, excluding spalled oxides.
The phase constitutions of the Co-Cr-Re-Ta-Ti-C alloy system as a function of temperature were predicted using Pandat 2020 software with the PanNi-2020 database [28], which included all the elements available in the present study, which was applied for the thermodynamic predictions.

3. Results and Discussions

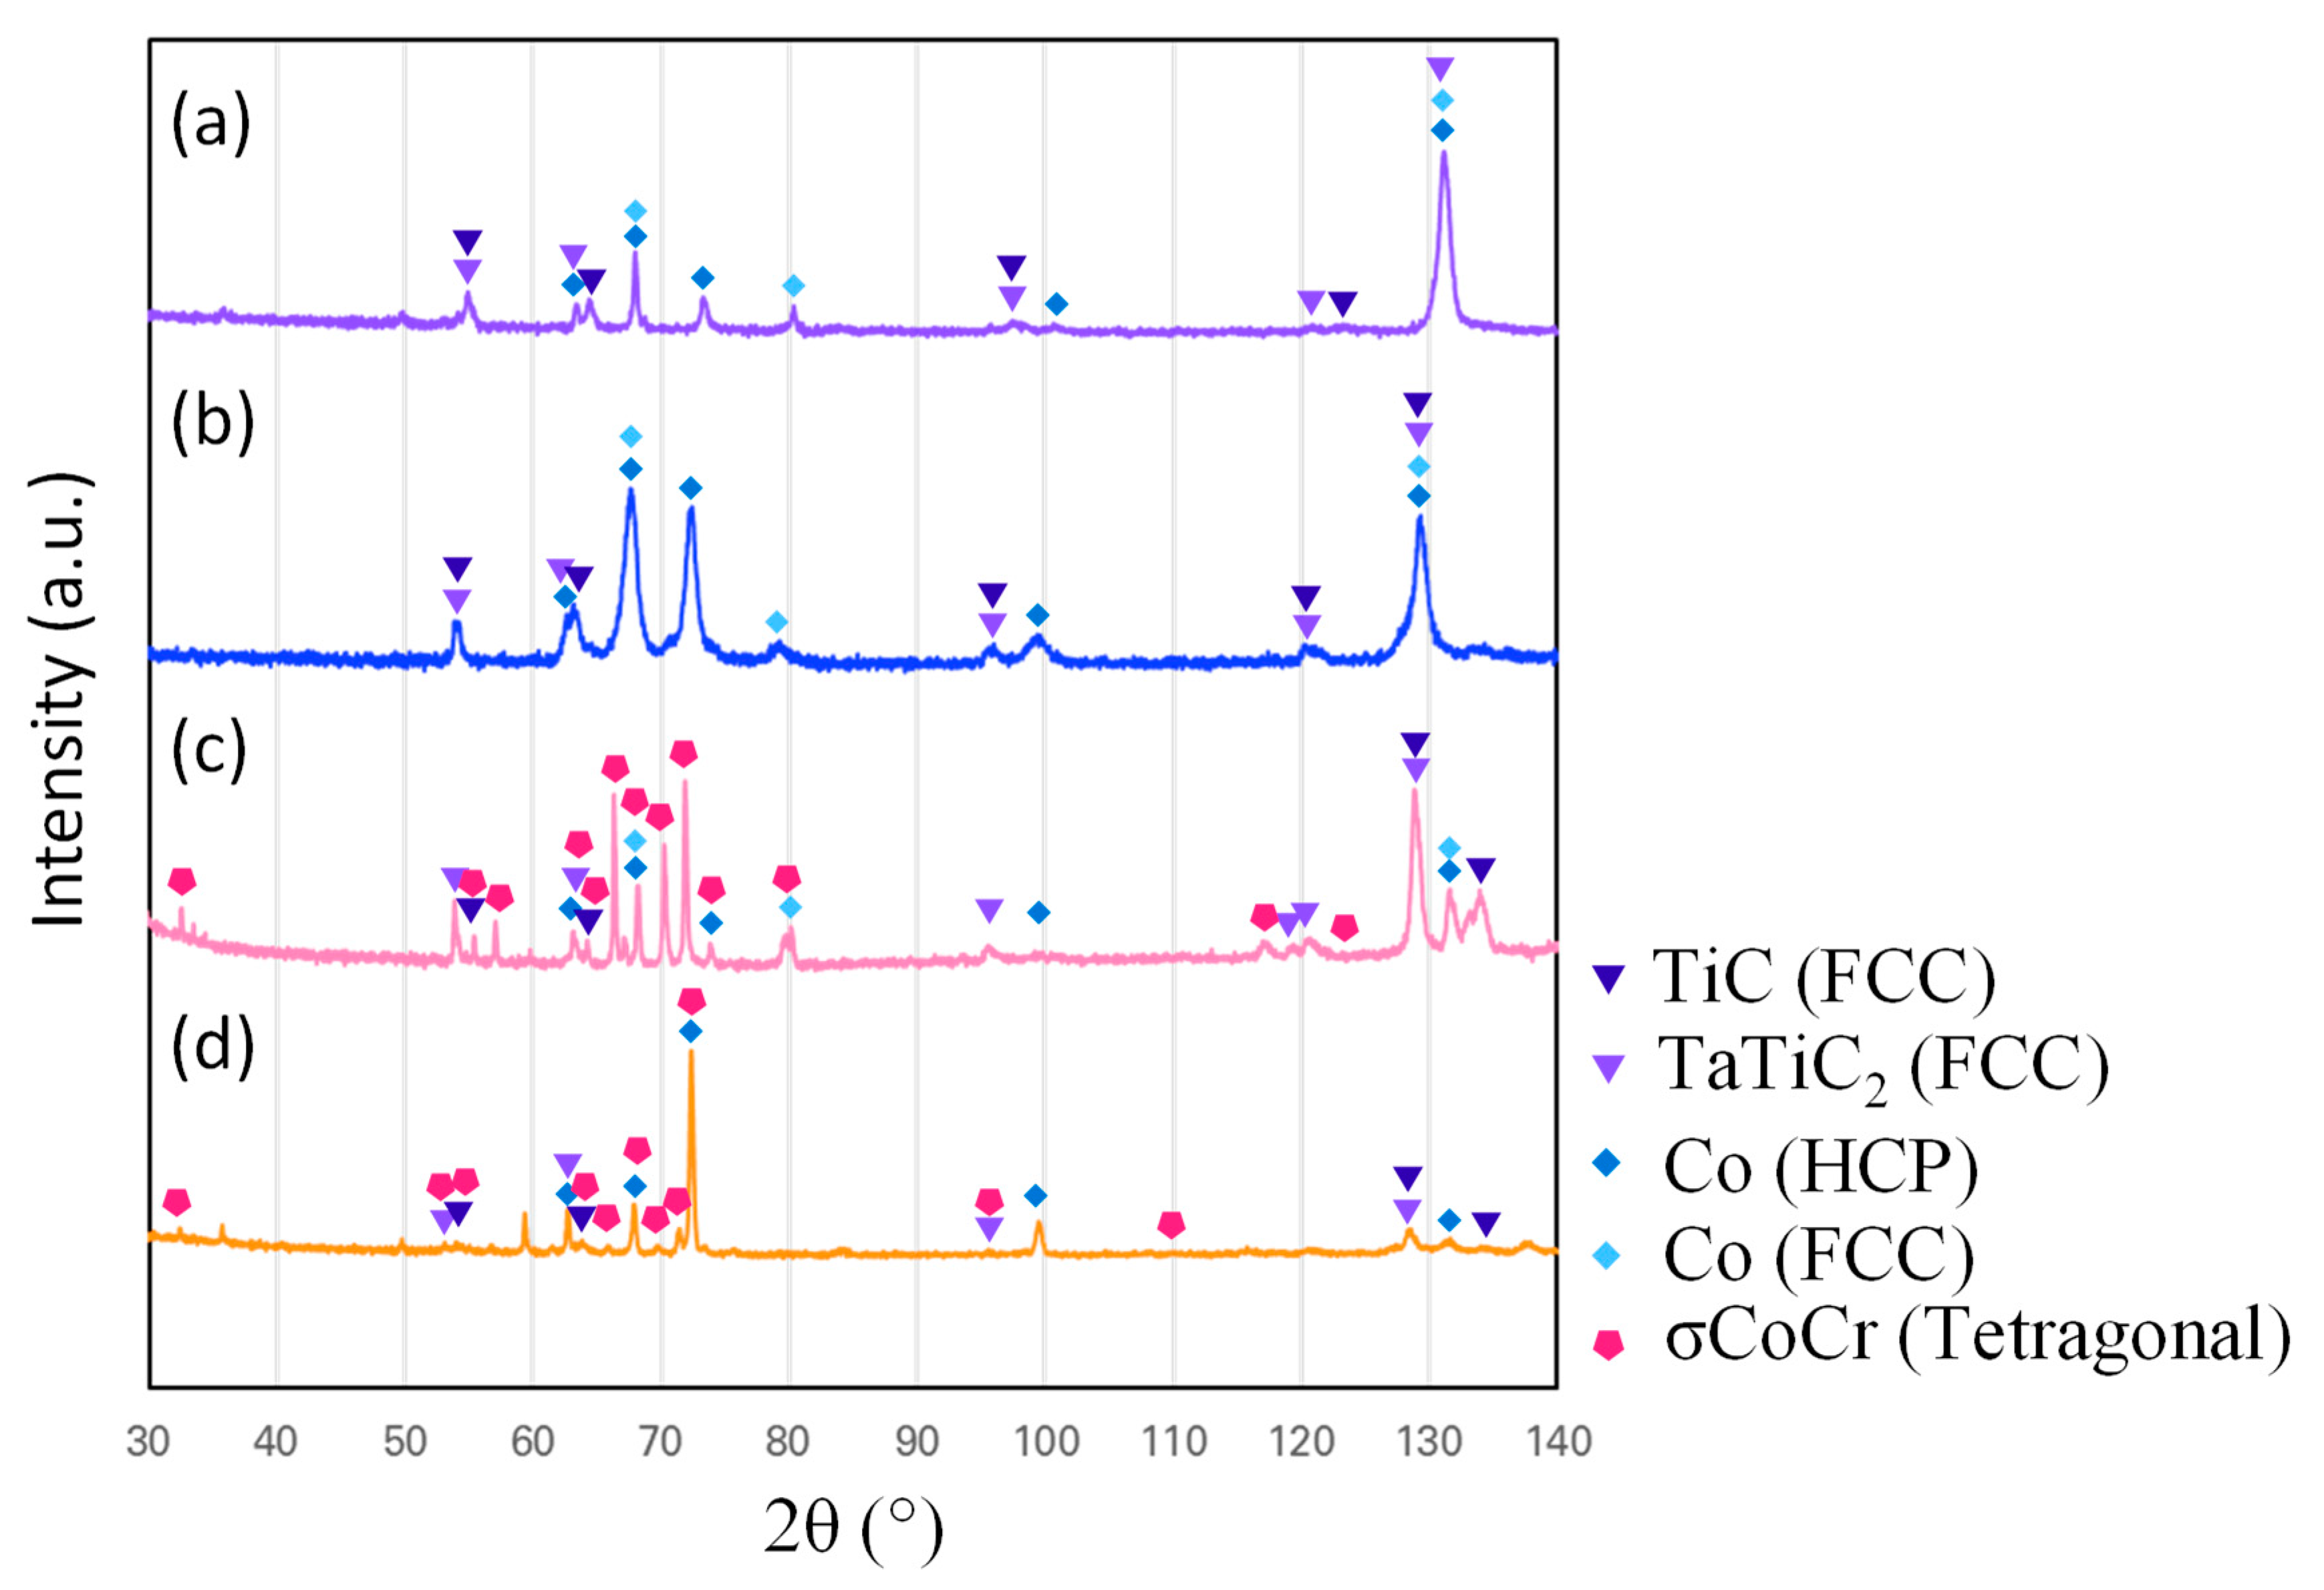
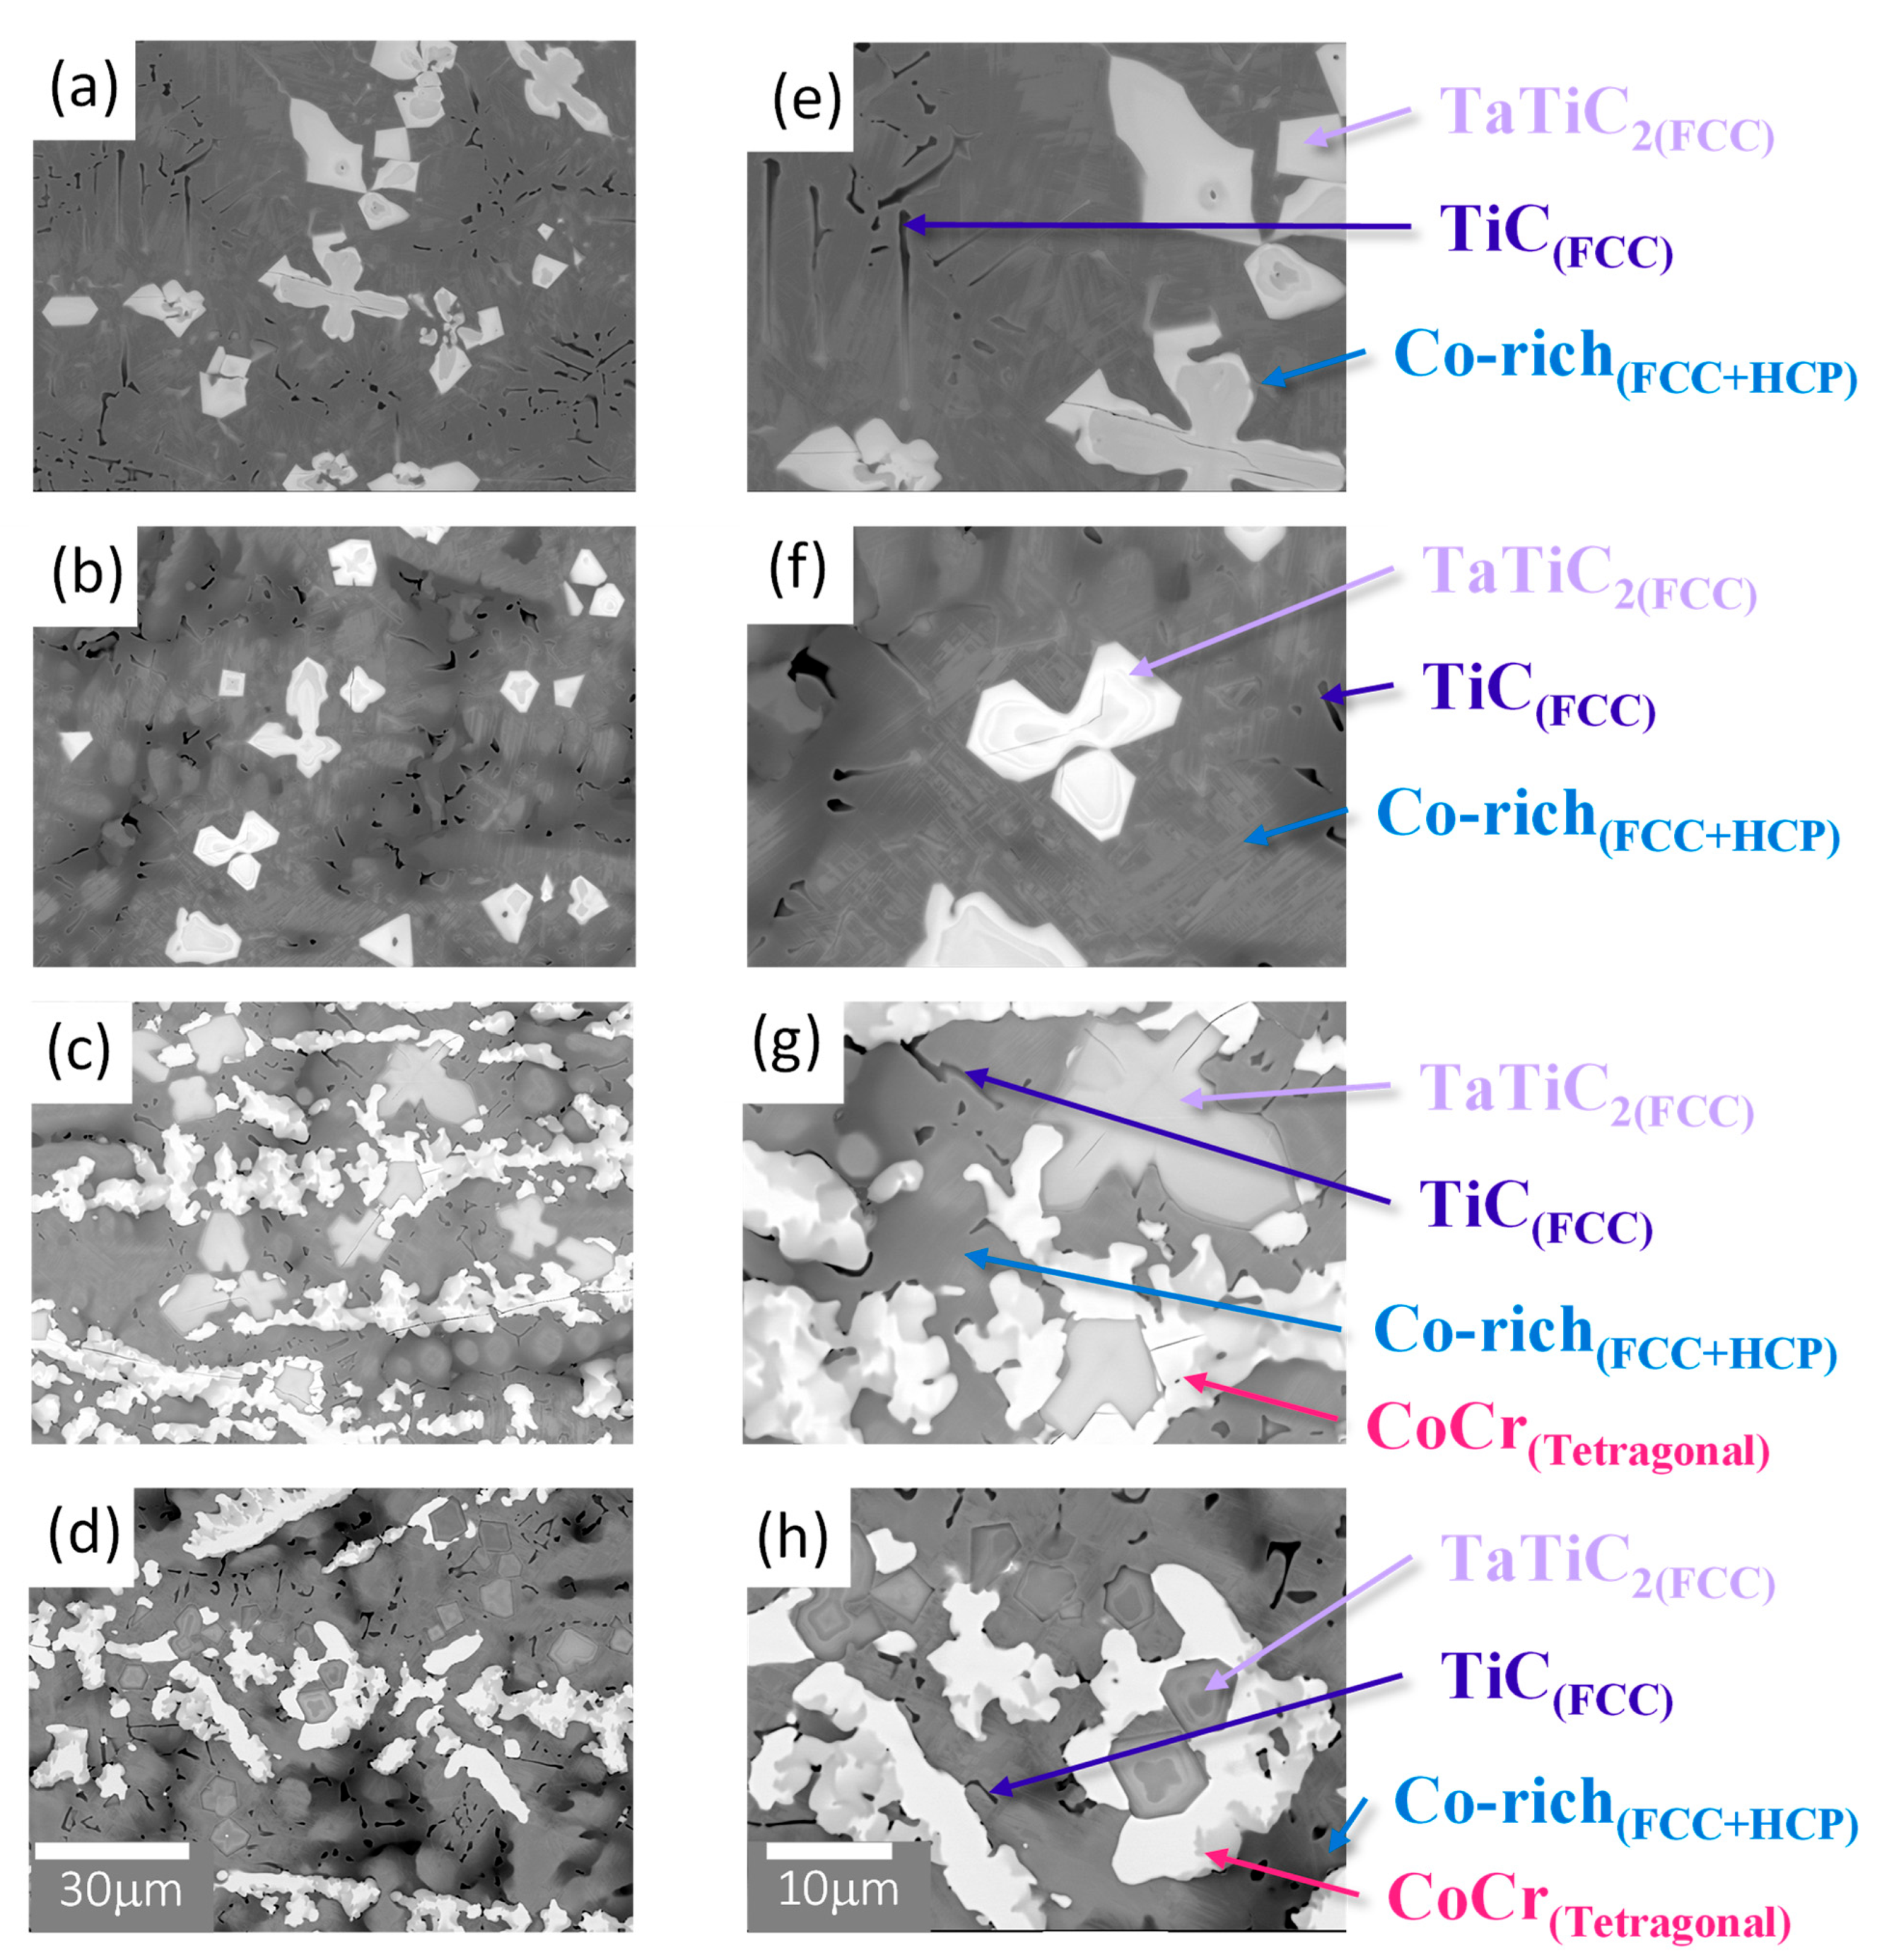
3.1. Microstructures of the Alloys

The X-ray diffraction patterns of the arc-melted Co-Cr-Re-Ta-Ti-C alloys after annealing at 1200 °C for 24 h and air cooling are shown in Figure 1. All the alloys had three face-centered cubic (FCC) phases and one hexagonal close-packed (HCP) phase. A tetragonal phase was also detected in alloys Re-10 and Re-15. Figure 2 provides SEM-BSE images of the microstructures, and Table 2 summarizes the corresponding EDS analysis results, respectively. The microstructures of alloys Re-0 and Re-5 (Figure 2a,b,e,f) consisted of two Co-rich phases (darker region) forming the matrices of the alloys, large star-shaped (Ta and Ti)-rich carbides (grey region), and Ti-rich carbides (black region). The morphology of the (Ta and Ti)-rich carbides appeared to result from the agglomeration of various carbides, and the size of the carbides reduced with an increasing Re content. More isolated carbides are observed in Re-5. In alloys Re-10 and Re-15, the distribution of the carbides changed so that they were arranged in a row. Also, increasing the Re content from Re-5 to Re-15 (Figure 2b–d,f–h) caused a decrease in the volume fraction of Co FCC and HCP phases and the formation of an additional CoCr-rich tetragonal phase. Using XRD, EDS, and SEM-BSE characterization, the matrix of the material was identified as a mixture of Co (HCP) and Co (FCC) phases. (Ta and Ti)-rich carbides were identified as TaTiC2 (FCC, a = 4.387Å) with the observed presence of TiC (FCC, 4.328 Å). The tetragonal phase present in the Re-10 and Re-15 alloys was identified as the CoCr-rich sigma phase.
The experimental results for the microstructure and the composition of each phase in the Co-Cr-Re-Ta-Ti-C alloys were compared with the thermodynamic phase simulation, as shown in Figure 3. The predicted phase compositions at 1200 °C generally agreed with the experimental results, although there were some differences. The Re-0 and Re-5 alloys were mainly composed of the FCC phase with an additional FCC-MC phase. The main FCC phase is likely to correspond to the Co-rich FCC phase, and the FCC-MC2 corresponds to the TaTiC2 (FCC) phase.
On the other hand, the HCP phase observed in all the alloys, as shown in Figure 2 and Table 2, does not appear in the predicted phase diagrams for Re-0 and Re-5 at 1200 °C. From the simulations, this phase is predicted to form at 898.2 °C for Re-0 and at 1045.3 °C for Re-5, respectively. Therefore, the formation of the HCP phase in Re-0 and Re-5 may have occurred during the air-cooling process after the heat treatment, which could explain its presence confirmed by the microstructural characterization as well as its predicted formation at lower temperatures. The TiC phase, which may correspond to MC-1 in the anticipated phase diagram, could also precipitate during the cooling stage. The presence of the σ-phase was also expected for Re-10 and Re-15, corresponding to the observed CoCr-rich σ-phase (tetragonal). The volume fraction of the σ-phase was expected to increase significantly with the addition of Re, reaching approximately 10% in the Re-15 alloy, which corresponds to the observations in the BSE images (Figure 2c,d,g,h). According to the phase predictions, the volume fraction of TaTiC2 remained constant across the range of alloys from Re-0 to Re-15. This finding is consistent with the SEM microstructural observations made using the BSE mode (Figure 2). However, in the predictions, it was found that increasing the Re content of the alloys increased the temperature at which the Co-rich FCC phase formed and decreased the volume fraction of the HCP phase. Further observations are needed to confirm the trend of phase formation with temperature in the Co-Cr-Re-Ta-Ti-C system. It should be noted that the thermodynamic database (PanNi-2020) used in this study was optimized for Ni-based alloys. Nevertheless, these results appear to be consistent with observations for samples heat treated at 1200 °C and predictive tools such as Pandat show promise for optimizing the compositions and microstructures of complex alloys in the future.

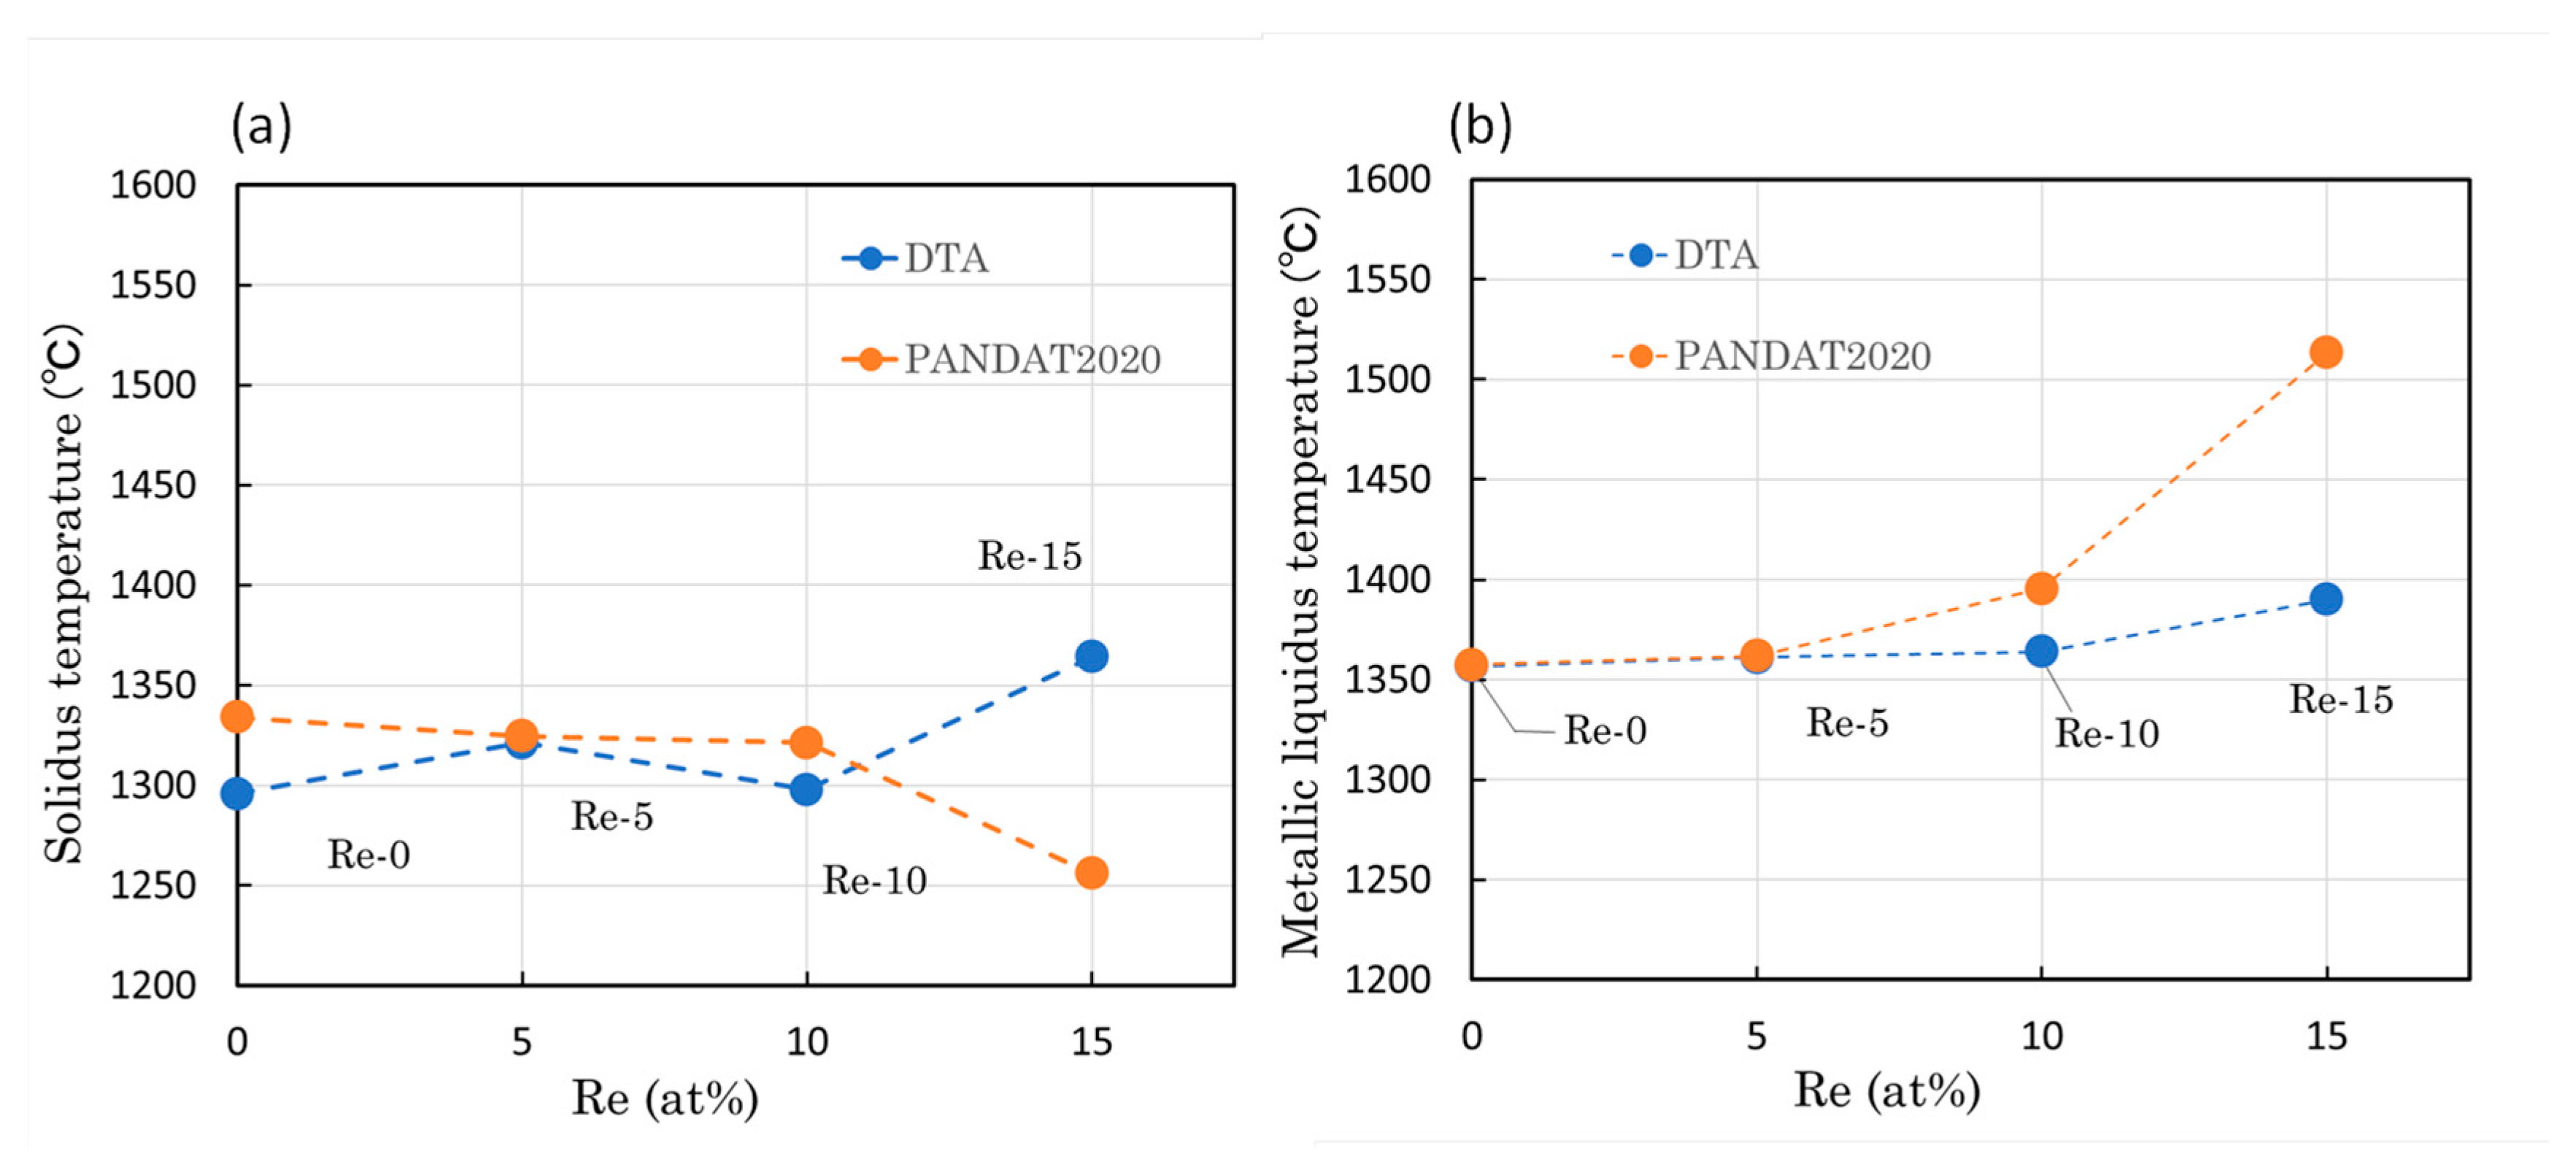
3.2. Evolution of Melting Temperatures

In addition to predicting equilibrium phase compositions as a function of temperature, the diagrams also provide information on the temperatures at which phase transformations occur. Therefore, the calculations of the phase diagram software can be used to estimate the melting temperatures of Co-Cr-Ta-Ti-C alloys. From the calculation shown in Figure 3, the solidus temperature decreased slightly with increasing Re addition up to 10 at%, 1334.1 °C for Re-0, 1324.8 °C for Re-5, and 1321.2 °C for Re-10, respectively. Then, the 15 at% Re addition was predicted to drastically reduce the solidus temperature to 1255.9 °C.
Figure 4 shows the DTA heat flow curves of the Co-Cr-Re-Ta-Ti-C alloys obtained from (a) the heating phase from room temperature to 1550 °C and (b) the cooling phase from 1550 °C to room temperature, respectively. As the sample temperature rises and melting starts, the temperature rise of the sample stops, and the heat flow from the reference to the sample increases. Therefore, the endothermic reaction of the sample, such as melting, is shown as a negative slope in the heat flow curve. When the melting stops, the heat flow curve quickly returns to the baseline, forming a negative peak.
In contrast, the exothermic change in the sample results in positive heat flow from the sample to the reference and is therefore shown as a positive peak in the heat flow curve [27]. These changes in the heat flow curves can be used to determine the transition temperatures and the reaction temperatures of the samples.
The beginning of the endothermic peak during the heating stage can be used to estimate the temperature at which melting begins in the Co-Cr-Re-Ta-Ti-C samples, which could be assigned as the “solidus temperature”. The results show that the solidus points of Re-0, Re-5, and Re-10 are 1295.9 °C, 1321.4 °C, and 1297.9 °C, respectively, suggesting that up to the 10 at% addition of Re does not drastically change the solidus temperature of the alloys investigated, which agrees well with the Pandat predictions. However, the addition of 15 at% Re significantly increased the solidus temperature (1364.3 °C).
On the other hand, the onset of the exothermic peak during the cooling phase, derived from the DTA measurement, can be considered as the temperature at which the samples begin to solidify. In the calculated phase diagrams in Figure 3, this corresponds to the point where the rapid increase in the volume fraction of the liquid phase abruptly stops, as indicated by the arrow in Figure 3a. Above this point, all metallic phases melt completely. Hence, the point is referred to as the “metallic liquidus point” in the present study. In the DTA analysis, Re-0 for 1356.8 °C, Re-5 for 1361.1 °C, and Re-10 for 1364 °C were assigned as the metallic liquidus points. Again, there is no significant difference between 0 and 10 at% Re. Further addition of Re (15 at%) increased the liquidus temperature to 1389.9 °C. Figure 5a compares the solidus temperatures measured using DTA with the predicted values shown in Figure 3 to assess the reliability of the prediction software and database. The results from Re-0 to Re-10 show reasonable agreement between the experimental and predicted values, with differences of 38.2 °C, 3.4 °C, and 23.3 °C, respectively. The result for sample Re-15, which has the highest content of Re (15 at%), shows a significant discrepancy, with the predicted temperature being lower than any of the other samples and differing from the experimental results by 108.4 °C. Regarding the “metallic liquidus” temperature at which metallic phases are completely melted, the trend is similar for both experimental and predicted results, with the melting temperature increasing with increasing addition of Re (Figure 5b). It is noteworthy that there is excellent agreement for Re-0 and Re-5 within 1 °C of the deviations. However, the difference becomes much larger with increasing Re content. The predicted temperatures are 31.5 °C higher than the experimental results for Re-10 and 123.4 °C higher for Re-15.
The comparison showed generally good agreement up to 10 at% Re addition, whereas for Re-15, there was a large gap between the calculated predictions and the experimental results. In particular, the metallic liquidus temperature was estimated to be higher and the solidus temperature was estimated to be lower. In the calculation, the initial solidification of the metallic phase in Re-15 is predicted to be the Re-rich HCP phase, and the lower solidus point is due to the predicted occurrence of eutectic reactions. On the other hand, the microstructural analysis and DTA measurement did not confirm the possible eutectic reactions, suggesting that the PanNi-2020 database is not suitable for predicting the phases of the Co-Cr-Ta-Ti-Re-C alloy system when the Re content exceeds 10 at% in this alloy system.
Nevertheless, excellent agreement between Pandat predictions and experimental results was obtained for Re-0 and Re-5, confirming the usefulness of the simulation tool for phase prediction.
Further experiments in the Co-Cr-Ta-Ti-Re-C alloy system could help to improve the accuracy of the predictions, especially for alloys with higher alloying additions such as Ta, Ti, and Re.

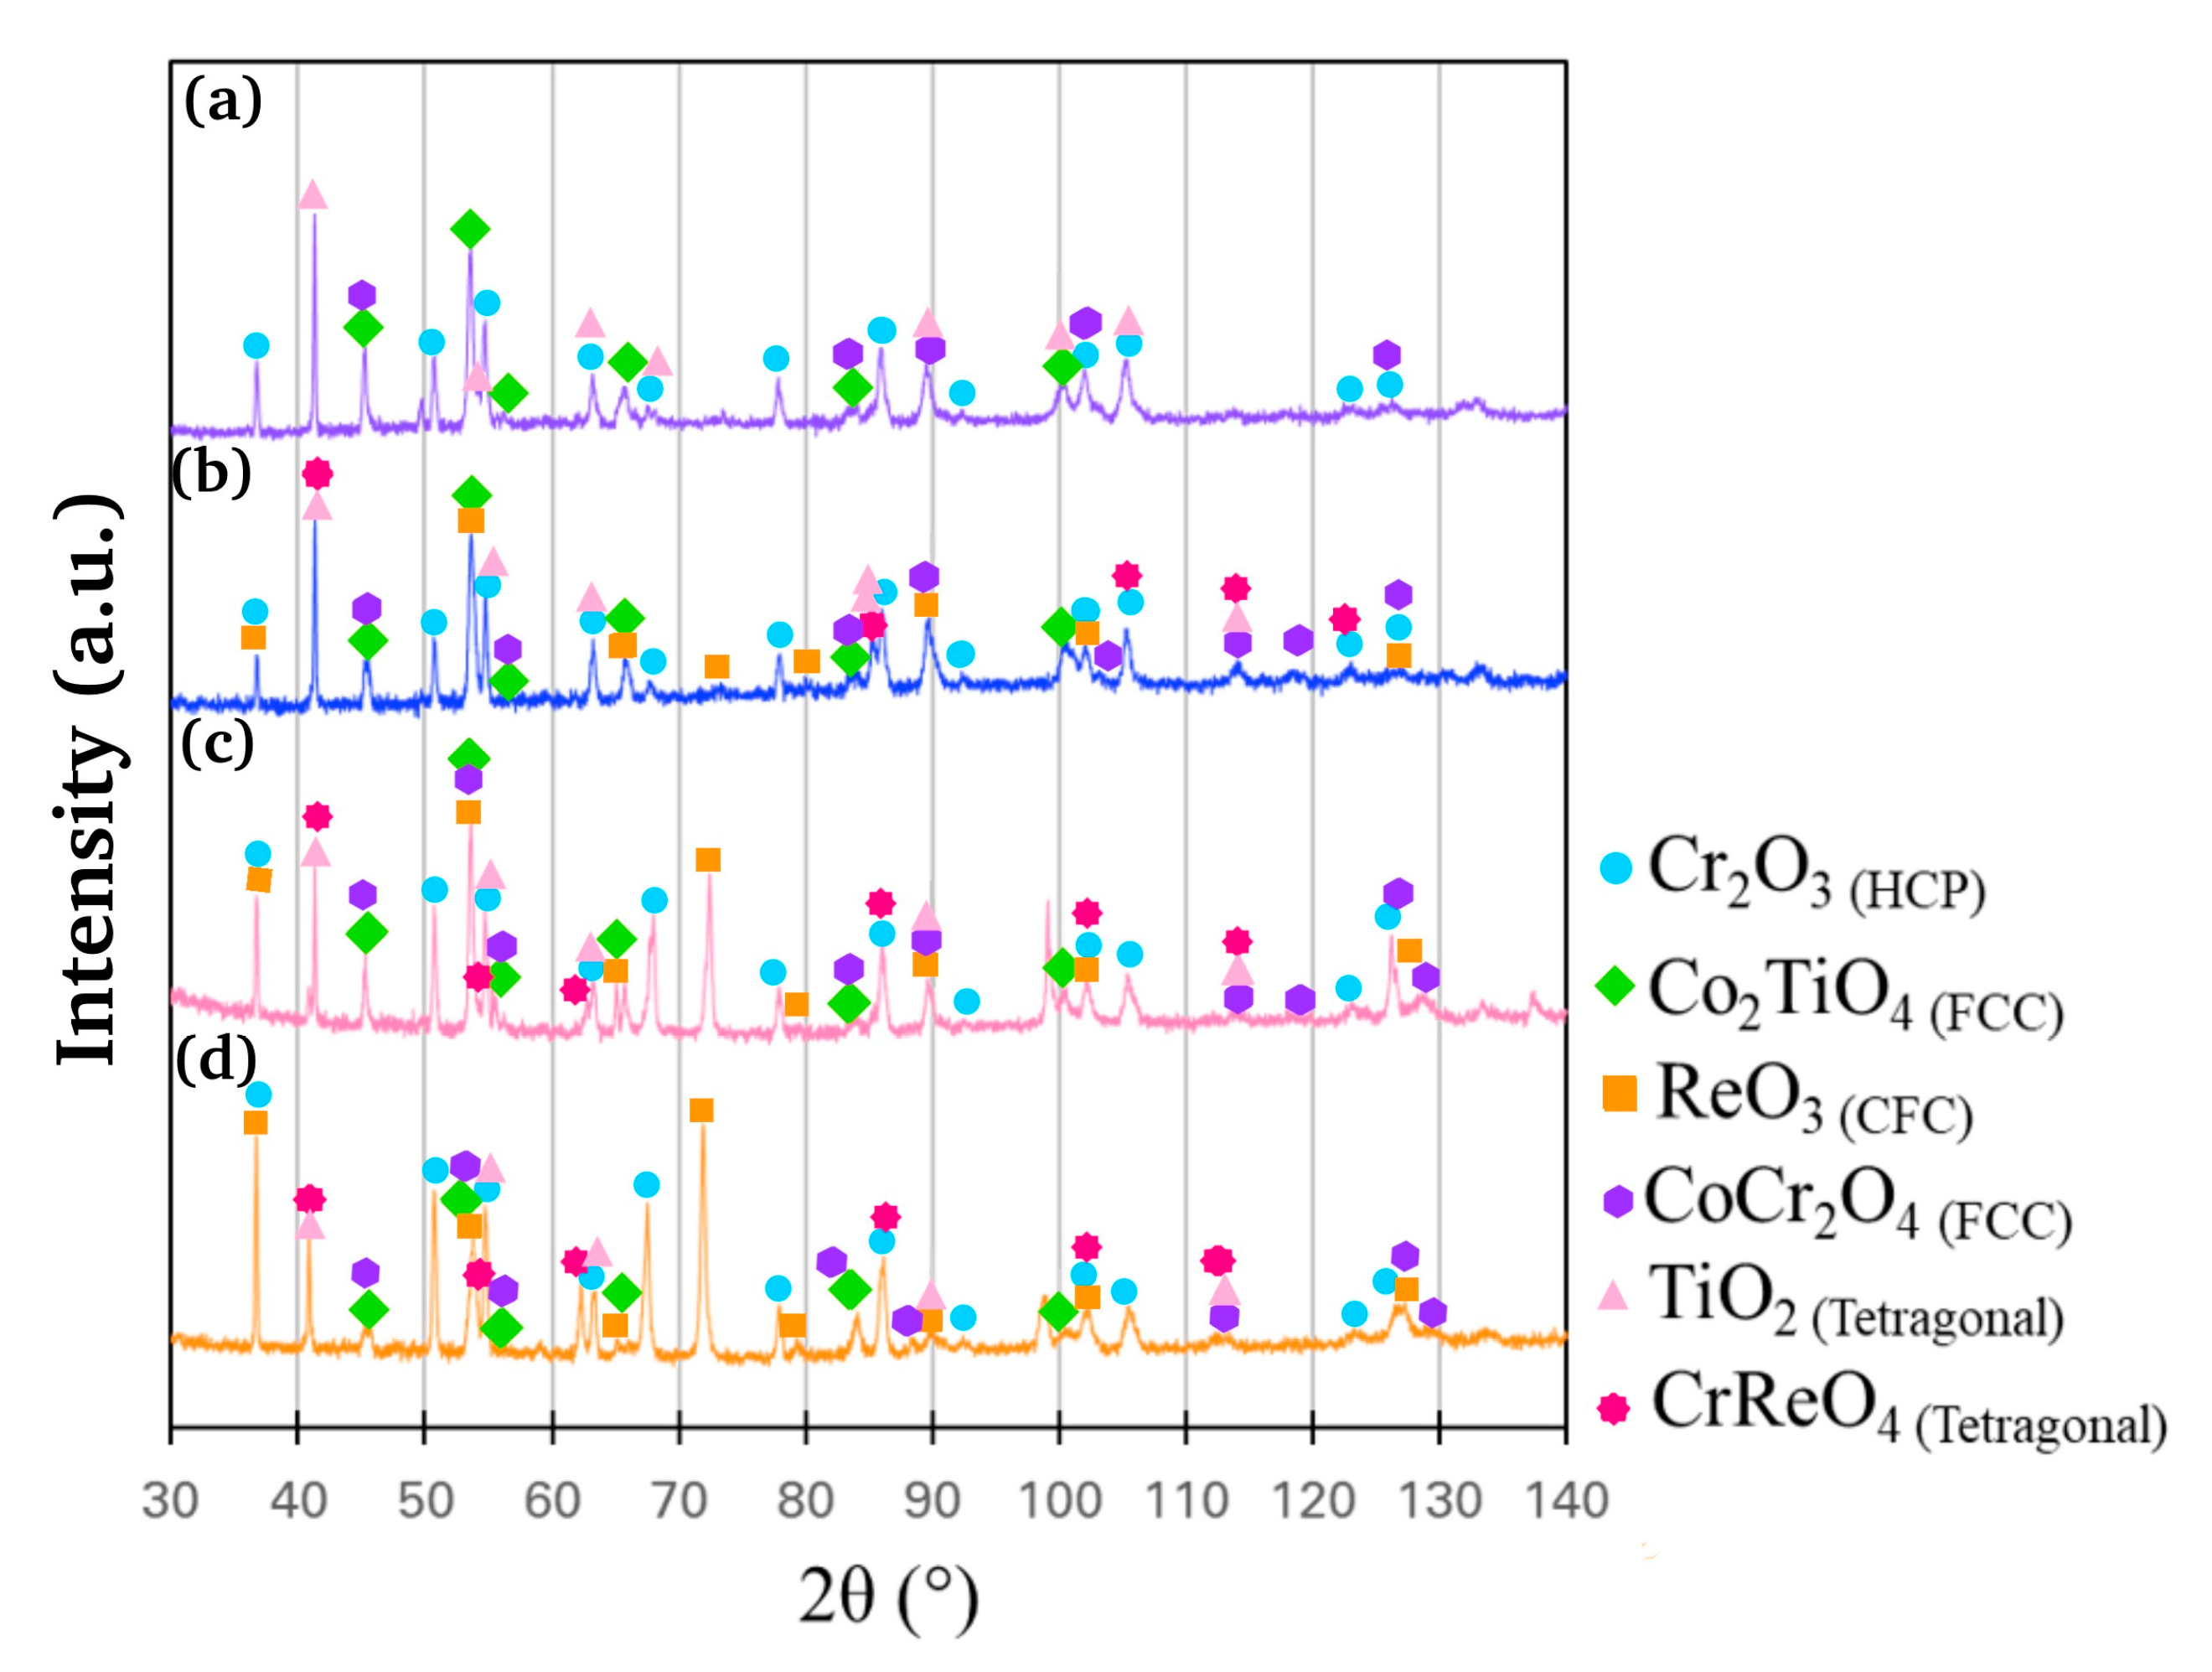
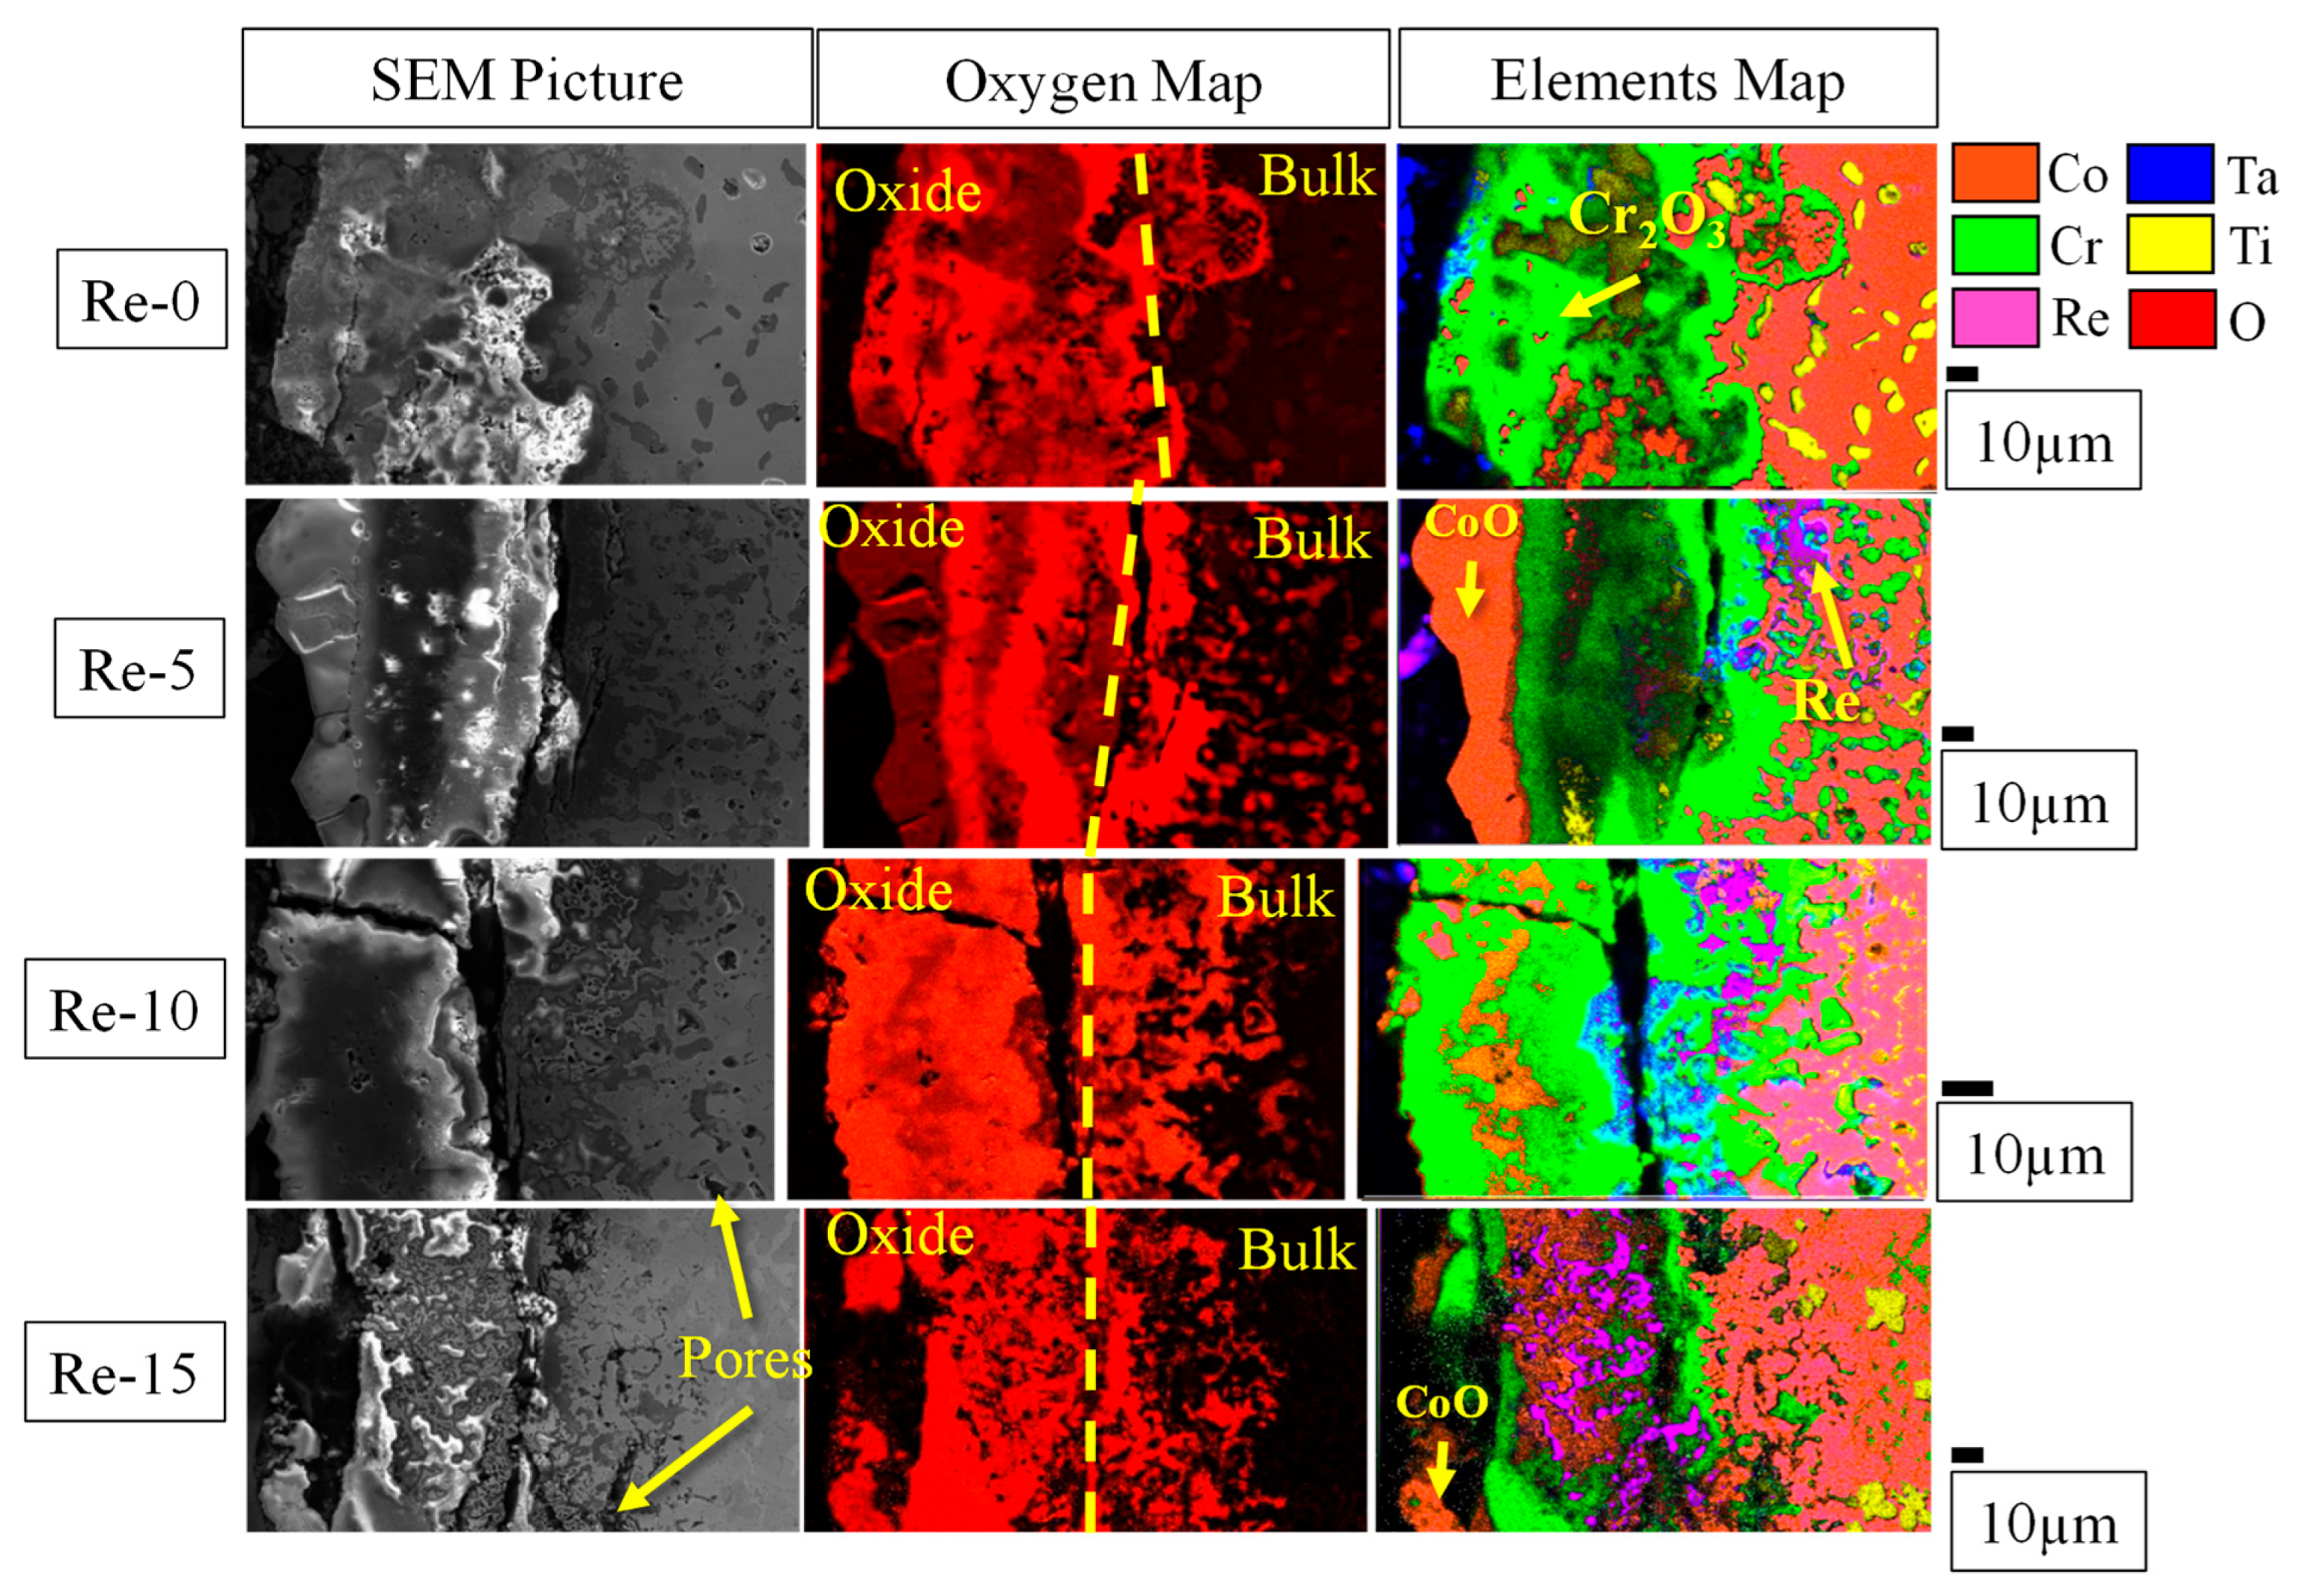
3.3. Oxidation Resistance at 1200 °C

Figure 6a shows the morphological appearance of the samples after 20 h of air exposure at 1200 °C, along with the spalled oxides left on the Al2O3 plate (Figure 6b). The photographs show a blue halo on the alumina plate, indicating that blue oxides, such as Cr-rich oxide, were formed, evaporated, and deposited on the alumina plate. It is also likely that Co-rich oxides were melted or spalled and deposited. The Re-0, Re-5, and Re-10 alloys have similar amounts of spalled oxide in the form of a powder that has spalled from the samples. On the other hand, the Re-15 alloy shows a greater amount of spalled oxides in both powder and solid forms. In order to semi-quantitatively compare the oxidation behaviors of the samples, the mass change per surface area, m / S , was estimated, where the surface area “S” is defined as S = S T o p   S u r f a c e + S S i d e   S u r f a c e , and the results are summarized in Figure 6c. Note that the sample mass does not include the spalled oxides. Figure 6c suggests that Re-15 has lost a significant amount of surface oxide via evaporation or spalling, indicating poor oxidation resistance.
Figure 7 shows XRD profiles taken from the top surface of the alloys after 20 h of oxidation at 1200 °C. All the alloys show the presence of two FCC oxide phases, one HCP oxide phase, and one tetragonal oxide phase. The addition of 5 at% Re contributes to the formation of two additional oxide phases: a Cr- and Re-rich tetragonal phase and a Re-rich cubic-centered oxide. The peak intensity of the Re-rich oxide appears to increase at 37.05° (corresponding to the (200) diffraction), 72.93° (corresponding to the (321) diffraction), and 127.94° (corresponding to the (440) diffraction). To further identify the oxides formed, cross-sectional analyses were performed using SEM-BSE and EDS and are summarized in Figure 8. It should be noted that these images were taken from the top surface of the samples placed on the Al2O3 plate (see Figure 6a).
The presence of Cr2O3 (shown as the green area in the elemental mapping in Figure 8) is observed in all alloys, but its volume fraction decreases drastically in Re-15. In addition, internal oxidation seems to be promoted with increasing Re-content, indicating reduced protection against oxidation at 1200 °C. For Re-5 and higher, the presence of CoO (shown in orange in Figure 8) is observed. This oxide is present above the Cr2O3 layer for Re-5 but is mixed with Cr2O3 in Re-10. In Re-15, the Co oxide is present both on the top surface and in the Cr, Re, and Co mixed oxide layer. As mentioned earlier, the formation of Co oxide is not favorable due to its porous nature and poor oxidation resistance. The formation of porous oxides does little to reduce the oxygen partial pressure beneath this layer, thus suppressing the formation of a continuous protective Cr2O3 layer.
The presence of Re appears to facilitate the oxidation of other elements, leading to accelerated internal oxidation and the formation of pores on the surfaces of the alloys. The Re oxide is volatile [21,22] and therefore easily evaporates during heat exposure, so the presence of Re oxides (shown in purple with the oxygen enrichment in Figure 8) is not easily observed. In addition, the continuous evaporation of Re oxide promotes pore formation, thereby suppressing the formation of dense and continuous surface oxide layers, resulting in the accelerated oxidation of other elements. The thinner Cr2O3 layer observed in Re-15 could be explained by the accelerated formation and evaporation of non-continuous Cr2O3 due to the high rate of Re evaporation. The accelerated oxidation of other elements, such as Co, Ti, and Ta, also promotes the spallation of their oxides, as shown in Figure 6b. Thus, it is concluded that Re-10 and Re-15 suffer from the rapid formation of volatile oxides and their evaporation, together with the formation of other oxides and their spallation, resulting in significant mass loss via the oxidation test. On the other hand, the mass change in Re-5 is the smallest among the alloys studied. However, by comparing the cross-sectional microstructures between Re-0 and Re-5, the thickness of the oxidized region is greater in Re-5, where internal oxidation is also observed. These results suggest that Re-0 and Re-5 have almost identical mass loss caused by vaporization and spallation of oxides, but the remaining oxidized region is larger in Re-5, concluding that 5 at% Re addition may not necessarily improve oxidation resistance in this alloy system.
In this study, the addition of Re to the Co-Cr-Ta-Ti-C alloys did not modify the melting temperatures or oxidation resistance. In fact, excessive addition (15 at%) drastically worsened the oxidation resistance. However, Re is still an attractive element because it is expected to improve the mechanical properties [16,17].
One of the solutions to improve the oxidation resistance is to design alloys that can form CrTaO4, as this complex and protective oxide layer has been shown to be stable and effective up to 1200 °C [25], whereas no CrTaO4 was observed in all the alloys investigated in this study. The optimization of the Co-Cr-Ti-Ta-C alloy composition with the small addition of Re, using thermodynamic calculation software, would help to develop new alloys with a good combination of mechanical properties and oxidation resistance, which should be investigated in the future.

4. Conclusions

To investigate the effect of Re on the microstructures and oxidation resistance of Co-Cr-Ta-Ti-C alloys, four samples with different levels of Re were investigated. Microstructural characterization revealed that all samples consist of a Co-rich matrix of mixed HCP and FCC phases with TaTiC2 carbides. The addition of Re appears to affect the microstructure from 10 at% due to the formation of the sigma phase. These results were compared with predictions using the Pandat 2020 software. This type of software could greatly facilitate the development of new alloys in the future by providing optimal compositions with a reduced number of experiments. The predictions were generally in agreement with the observations, although some differences were observed for alloys with high levels of Re, probably due to the limited number of data with high levels of alloying additions in the PanNi-2020 database used for the predictions. The predictions can also be used to estimate the melting temperatures of new alloy compositions, which were compared with the DTA results for the Co-Cr-Re-Ta-Ti-C samples. The results show that the addition of 15 at% Re significantly changes the melting temperature, while the addition of up to 10 at% Re does not change the melting temperature. In comparison with the predictions made with Pandat, generally good agreement was obtained with the experimental results up to 10 at% Re addition, but there was a large discrepancy for Re-15. Finally, the oxidation resistance of the alloys at 1200 °C was tested and showed that increasing the amount of Re had a negative effect on the protection against oxidation, with the formation of a large amount of porous CoO and volatile ReO3 and an evaporation of protective Cr2O3.
In conclusion, the addition of Re does not drastically increase the melting temperatures, which is expected to improve the properties at high temperatures up to 10 at%, but the addition of 15% abruptly modifies the melting temperatures. However, this improvement comes at the cost of a deterioration in the oxidation resistance with the formation of detrimental oxides and evaporation of protective Cr2O3. This study also demonstrated the potential of predictive software such as Pandat to accurately predict phase constitutions, but the accuracy of the predictions is dependent on the database and the compositional range.

Author Contributions

Conceptualization, L.E.M. and H.M.; methodology, L.E.M. and S.B.; investigation, all the authors.; writing—original draft preparation, L.E.M.; writing—review and editing, A.I. and H.M.; supervision, H.M. All authors have read and agreed to the published version of the manuscript.

Funding

This research received no external funding.

Institutional Review Board Statement

Not applicable.

Informed Consent Statement

Not applicable.

Data Availability Statement

The data of this study are available from the corresponding author upon reasonable request.

Acknowledgments

The authors would like to thank Po Heng Chou, National Tsing Hua University, Taiwan, for assisting the authors with the thermodynamic calculations and Takanobu Hiroto, NIMS, for the XRD analysis. L.M. also acknowledges the NIMS Joint Graduate Program for supporting his living expenses.

Conflicts of Interest

The authors declare no conflicts of interest.

References

  1. Wright, L.G.; Gibbons, T.B. Recent developments in gas turbine materials and technology and their implications for syngas firing. Int. J. Hydrogen Energy 2007, 32, 3610–3621. [Google Scholar] [CrossRef]
  2. Mouritz, A.P. Superalloys for Gas Turbine Engines, Introduction to Aerospace Materials; Woodhead Publishing: Sawston, UK, 2012; pp. 251–267. ISBN 9781855739468. [Google Scholar] [CrossRef]
  3. Kirka, M.M.; Fernandez-Zelaia, P. Additive Materials for High Temperature Applications. In Encyclopedia of Materials: Metals and Alloys; Caballero, F.G., Ed.; Elsevier: Amsterdam, The Netherlands, 2022; Volume 1, pp. 529–536. [Google Scholar] [CrossRef]
  4. Reed, R.C. The Superalloys, Fundamentals and Applications; Cambridge University Press: Cambridge, UK, 2006; ISBN 0-521-85904-2. [Google Scholar]
  5. Makineni, S.K.; Sharma, A.; Pandey, P.; Chattopadhyay, K. An Overview on Co-Base Alloys for High Temperature Applications. In Encyclopedia of Materials: Metals and Alloys; Caballero, F.G., Ed.; Elsevier: Amsterdam, The Netherlands, 2022; Volume 1, pp. 323–334. [Google Scholar] [CrossRef]
  6. Coutsouradis, D.; Davin, A.; Lamberigts, M. Cobalt-based superalloys for applications in gas turbines. Mater. Sci. Eng. 1987, 88, 11–19. [Google Scholar] [CrossRef]
  7. Berthod, P.; Himeur, Z.; Panteix, P.-J. Influences of the Co content and of the level of high temperature on the microstructure and oxidation of cast {Ni, Co}-based Cr-rich TaC-containing cast alloys. J. Alloy. Compd. 2018, 739, 447–456. [Google Scholar] [CrossRef]
  8. Bernard, J.-L.; Berthod, P.; Hericher, L.; Liebaut, C.; Michon, S. Refractory Alloy, Fibre-Forming Plate and Method for Producing Mineral Wool. U.S. Patent 826,296,4B2, 11 September 2012. [Google Scholar]
  9. Selvam, J.D.R.; Dinaharan, I.; Rai, R.S. Matrix and Reinforcement Materials for Metal Matrix Composites. In Encyclopedia of Materials: Composites; Brabazon, D., Ed.; Elsevier: Amsterdam, The Netherlands, 2021; Volume 2, pp. 615–639. ISBN 9780128197318. [Google Scholar] [CrossRef]
  10. Durlu, N. Titanium carbide based composites for high temperature applications. J. Eur. Ceram. Soc. 1999, 19, 2415–2419. [Google Scholar] [CrossRef]
  11. Gu, Y.F.; Harada, H.; Ro, Y. Chromium and chromium-based alloys: Problems and possibilities for high-temperature service. JOM 2004, 56, 28–33. [Google Scholar] [CrossRef]
  12. Birks, N.; Meier, G.H.; Pettit, F.S. Introduction to the High. Temperature Oxidation of Metals, 2nd ed.; Cambridge University Press: New York, NY, USA, 2006. [Google Scholar]
  13. Khalid, F.; Hussain, N.; Shahid, K. Microstructure and morphology of high temperature oxidation in superalloys. Mater. Sci. Eng. A 1999, 265, 87–94. [Google Scholar] [CrossRef]
  14. Sahlaoui, H.; Makhlouf, K.; Sidhom, H.; Philibert, J. Effects of ageing conditions on the precipitates evolution, chromium depletion and intergranular corrosion susceptibility of AISI 316L: Experimental and modeling results. Mater. Sci. Eng. A 2004, 372, 98–108. [Google Scholar] [CrossRef]
  15. Sahlaoui, H.; Sidhom, H.; Philibert, J. Prediction of chromium depleted-zone evolution during aging of Ni–Cr–Fe alloys. Acta Mater. 2002, 50, 1383–1392. [Google Scholar] [CrossRef]
  16. Rösler, J.; Mukherji, D.; Baranski, T. Co-Re-based Alloys: A New Class of High Temperature Materials? Adv. Eng. Mater. 2007, 9, 876–881. [Google Scholar] [CrossRef]
  17. Mukherji, D.; Strunz, P.; Gilles, R.; Karge, L.; Rösler, J. Current status of Co-Re-based alloys being developed to supplement Ni-based superalloys for ultra-high temperature applications in gas turbines. Met. Mater. 2015, 53, 287–294. [Google Scholar] [CrossRef]
  18. Muktinutalapati, N.R. Materials for Gas Turbines—An Overview. In Advances in Gas Turbine Technology; Benini, E., Ed.; IntechOpen: London, UK, 2011. [Google Scholar] [CrossRef]
  19. Bochenek, K.; Węglewski, W.; Morgiel, J.; Basista, M. Influence of rhenium addition on microstructure, mechanical properties and oxidation resistance of NiAl obtained by powder metallurgy. Mater. Sci. Eng. A 2018, 735, 121–130. [Google Scholar] [CrossRef]
  20. Skoczylas, P.; Kaczorowski, M. Preliminary Study of the Rhenium Addition on the Structure and Mechanical Properties of Tungsten Heavy Alloy. Materials 2021, 14, 7365. [Google Scholar] [CrossRef] [PubMed]
  21. Gorr, B.; Trindade, V.; Burk, S.; Christ, H.-J.; Klauke, M.; Mukherji, D.; Rösler, J. Oxidation Behaviour of Model Cobalt-Rhenium Alloys During Short-Term Exposure to Laboratory Air at Elevated Temperature. Oxid. Met. 2009, 71, 157–172. [Google Scholar] [CrossRef]
  22. Karge, L.; Gilles, R.; Mukherji, D.; Beran, P.; Strunz, P.; Hoelzel, M.; Rosler, J. Beyond Ni-base Superalloys: Influence of Cr Addition on Co-Re base alloys strengthened by nano-sized TaC particles. Phys. B Phys. Condens. Matter 2018, 551, 1–5. [Google Scholar] [CrossRef]
  23. Ma, S.; Ding, Q.; Wei, X.; Zhang, Z.; Bei, H. The Effects of Alloying Elements Cr, Al, and Si on Oxidation Behaviors of Ni-Based Superalloys. Materials 2022, 15, 7352. [Google Scholar] [CrossRef] [PubMed]
  24. Whittle, D.P.; Stringer, J. Improvements in high temperature oxidation resistance by additions of reactive elements or oxide dispersions. Philos. Trans. R. Soc. London. Ser. A Math. Phys. Sci. 1980, 295, 309–329. [Google Scholar] [CrossRef]
  25. Etienne, M.L.; Stéphane, G.; Guillaume, L.; Hideyuki, M. Microstructure and oxidation behavior of Co–Cr–Ta ternary alloys. J. Alloys Compd. 2023, 936, 167968. [Google Scholar] [CrossRef]
  26. Faber, J.; Fawcett, T. The Powder Diffraction File: Present and future. Acta Cryst. 2002, B58, 325–332. [Google Scholar] [CrossRef] [PubMed]
  27. Principle of Differential Thermal Analysis (DTA). Available online: https://www.hitachi-hightech.com/global/products/science/tech/ana/thermal/descriptions/dta.html (accessed on 1 July 2022).
  28. Pandat Software: CALPHAD-Based Materials Design. Available online: https://computherm.com/software (accessed on 1 July 2020).
Figure 1. X-ray diffraction patterns of (a) Re-0, (b) Re-5, (c) Re-10, and (d) Re-15 prepared via casting followed by annealing at 1200°C for 24 h.
Coatings 14 00026 g001
Figure 2. SEM-BSE images of studied alloys prepared via casting followed by annealing at 1200°C for 24 h: low-magnification images ((a): Re-0, (b): Re-5, (c): Re-10, and (d): Re-15), and high-magnification images showing the detailed images of precipitates ((e): Re-0, (f): Re-5, (g): Re-10, and (h): Re-15).
Coatings 14 00026 g002
Figure 3. Predicted phase diagrams of (a) Re-0, (b) Re-5, (c) Re-10, and (d) Re-15 derived from Pandat 2020 software with PanNi-2020 database. Dashed lines indicate the phase at 1200 °C.
Coatings 14 00026 g003
Figure 4. DTA heat flow curves of CoCrReTaTiC alloys: (a) from room temperature to 1550 °C; (b) from 1550 °C to room temperature.
Coatings 14 00026 g004
Figure 5. Comparison of melting temperatures experimentally determined using DTA and predicted using Pandat software: (a) solidus temperature and (b) metallic liquidus temperature.
Coatings 14 00026 g005
Figure 6. (a) Appearances of the alloys oxidized at 1200 °C for 20 h followed by air cooling, (b) oxides spalled and deposited on the alumina plate, and (c) mass changes in the alloys per exposed surface area.
Coatings 14 00026 g006
Figure 7. XRD profiles of the surfaces of samples after 20 h of air oxidation at 1200 °C. (a) Re-0, (b) Re-5, (c) Re-10, and (d) Re-15.
Coatings 14 00026 g007
Figure 8. Cross-sectional micrographs of alloys after 20 h of oxidation at 1200 °C and corresponding oxygen and element mapping with EDS.
Coatings 14 00026 g008
Table 1. Compositions of alloys investigated in this study.
AlloyCo
(at.%)
Cr
(at.%)
Re
(at.%)
Ta
(at.%)
Ti
(at.%)
C
(at.%)
Re-058.827 1.76.46.1
Re-553.82751.76.46.1
Re-1048.827101.76.46.1
Re-1543.827151.76.46.1
Table 2. Compositions of the phases observed in the studied Co-Cr-Ta alloys prepared via arc melting followed by annealing at 1200 °C for 24 h (in at%).
PhasesCoCrReTaTiC
Re-058.82701.76.46.1
Dark grey region (HCP+FCC)64.126.6/0.041.94.6
Black region (TiC)28.715.7/4.529.321.9
Light grey region (TaTiC2)2.14.0/19.647.127.1
Re-553.82751.76.46.1
Dark grey region (HCP+FCC)60.127.82.80.33.25.7
Black region (TiC)18.510.90.49.738.921.9
Light grey region (TaTiC2)2.51.6/27.741.127.1
Re-1048.827101.76.46.1
Dark grey region (HCP+FCC)61.824.34.40.32.66.6
Black region (TiC)23.813.92.48.429.222.4
Light grey region (TaTiC2)3.92.5/22.344.227.0
White region (σ-phase)42.431.710.61.46.27.6
Re-1543.827151.76.46.1
Dark grey region (HCP+FCC)62.421.18.70.31.46.0
Black region (TiC)19.19.52.88.335.824.5
Light grey region (TaTiC2)1.81.5/24.844.727.1
White region (σ-phase)39.229.520.80.82.47.2
Disclaimer/Publisher’s Note: The statements, opinions and data contained in all publications are solely those of the individual author(s) and contributor(s) and not of MDPI and/or the editor(s). MDPI and/or the editor(s) disclaim responsibility for any injury to people or property resulting from any ideas, methods, instructions or products referred to in the content.

