

An Experimental Study on Blade Surface De-Icing Characteristics for Wind Turbines in Rime Ice Condition by Electro-Thermal Heating


Abstract
:
1. Introduction
- (a)
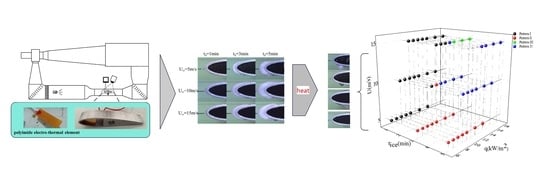
- the de-icing process on the blade section with electro-thermal elements in rime ice conditions was characterized under different wind speed, input power, and ice thickness conditions;
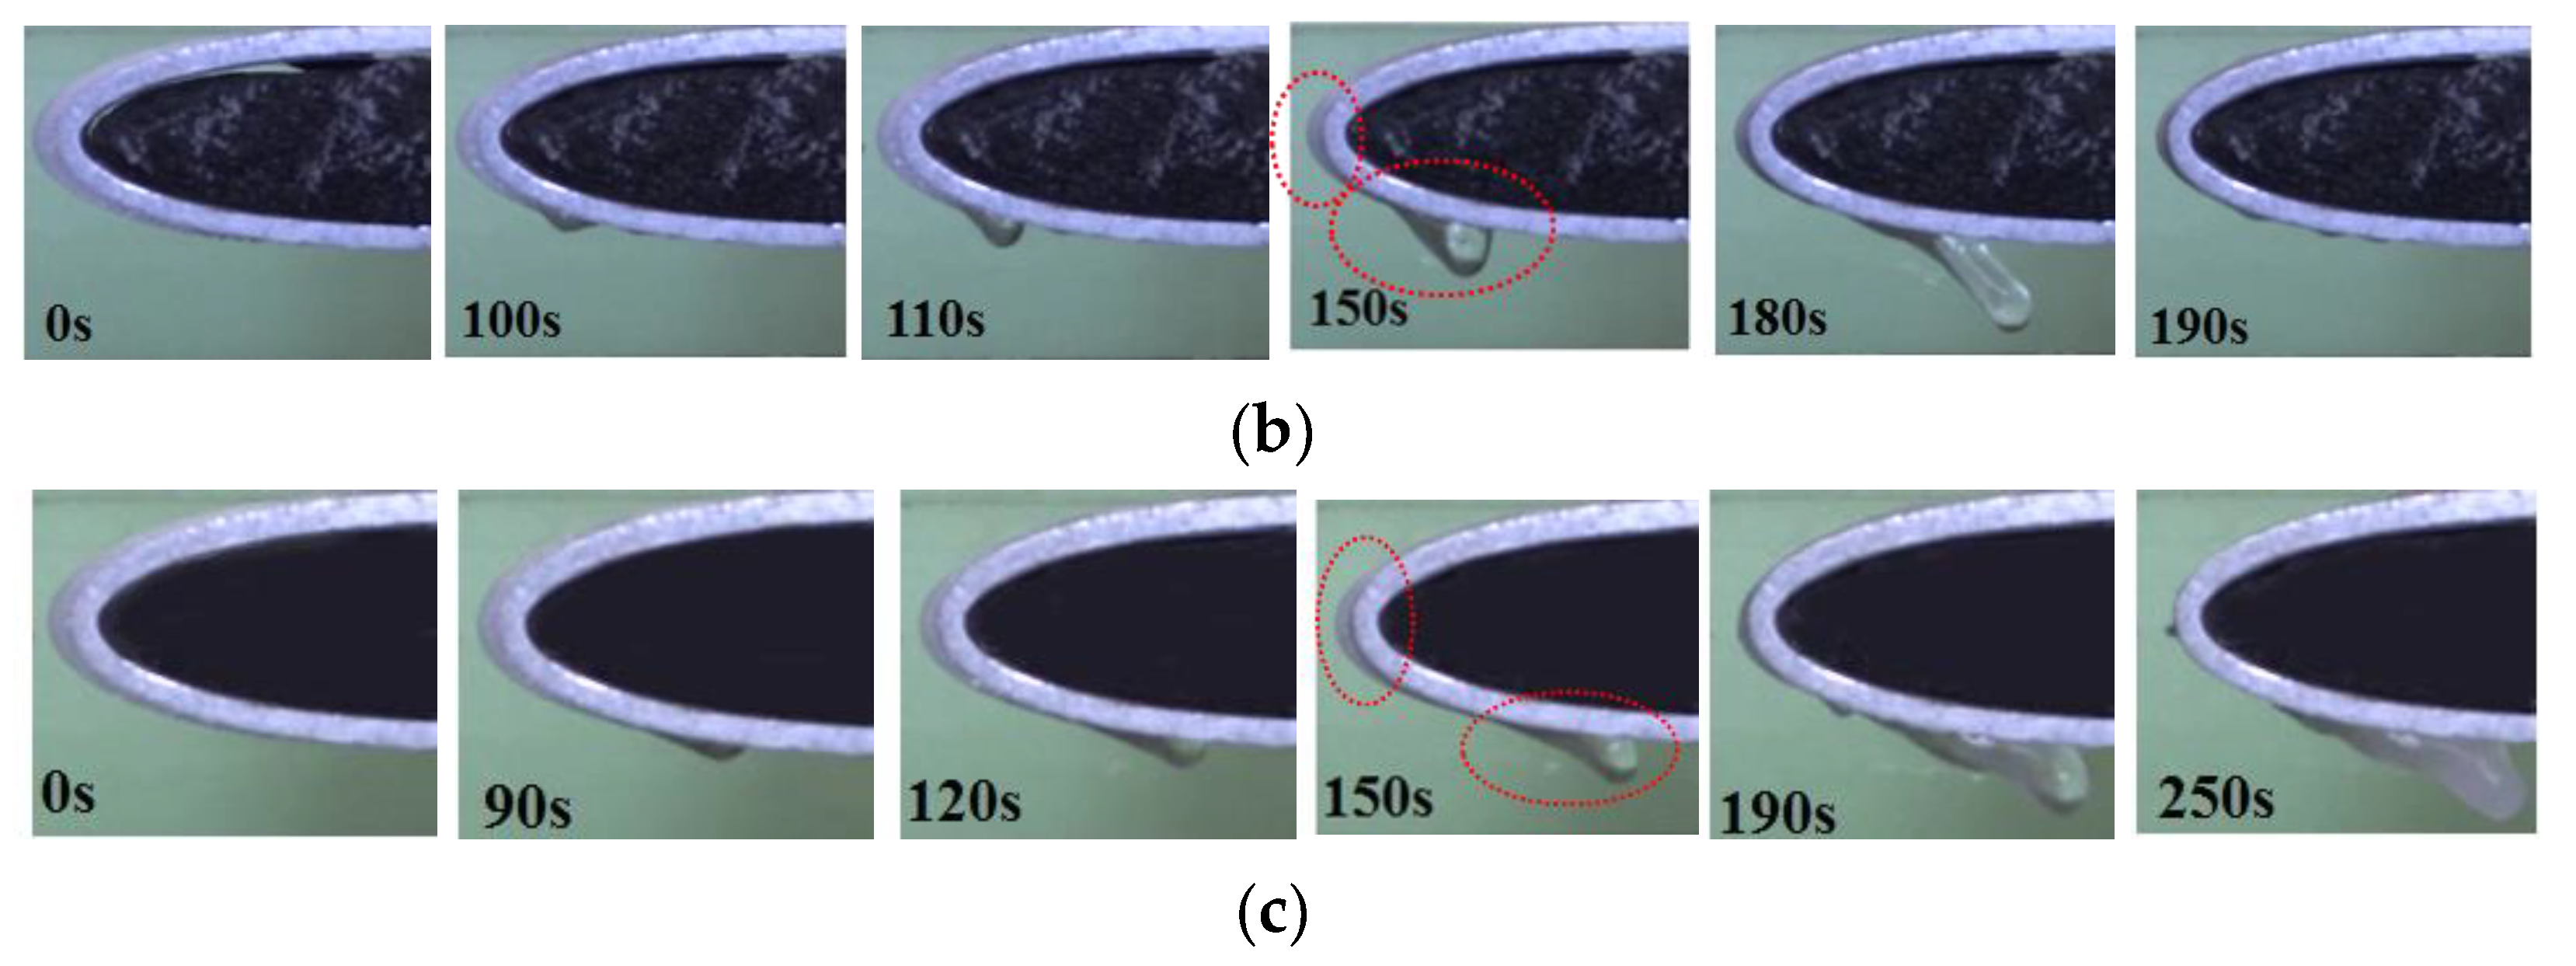
- (b)
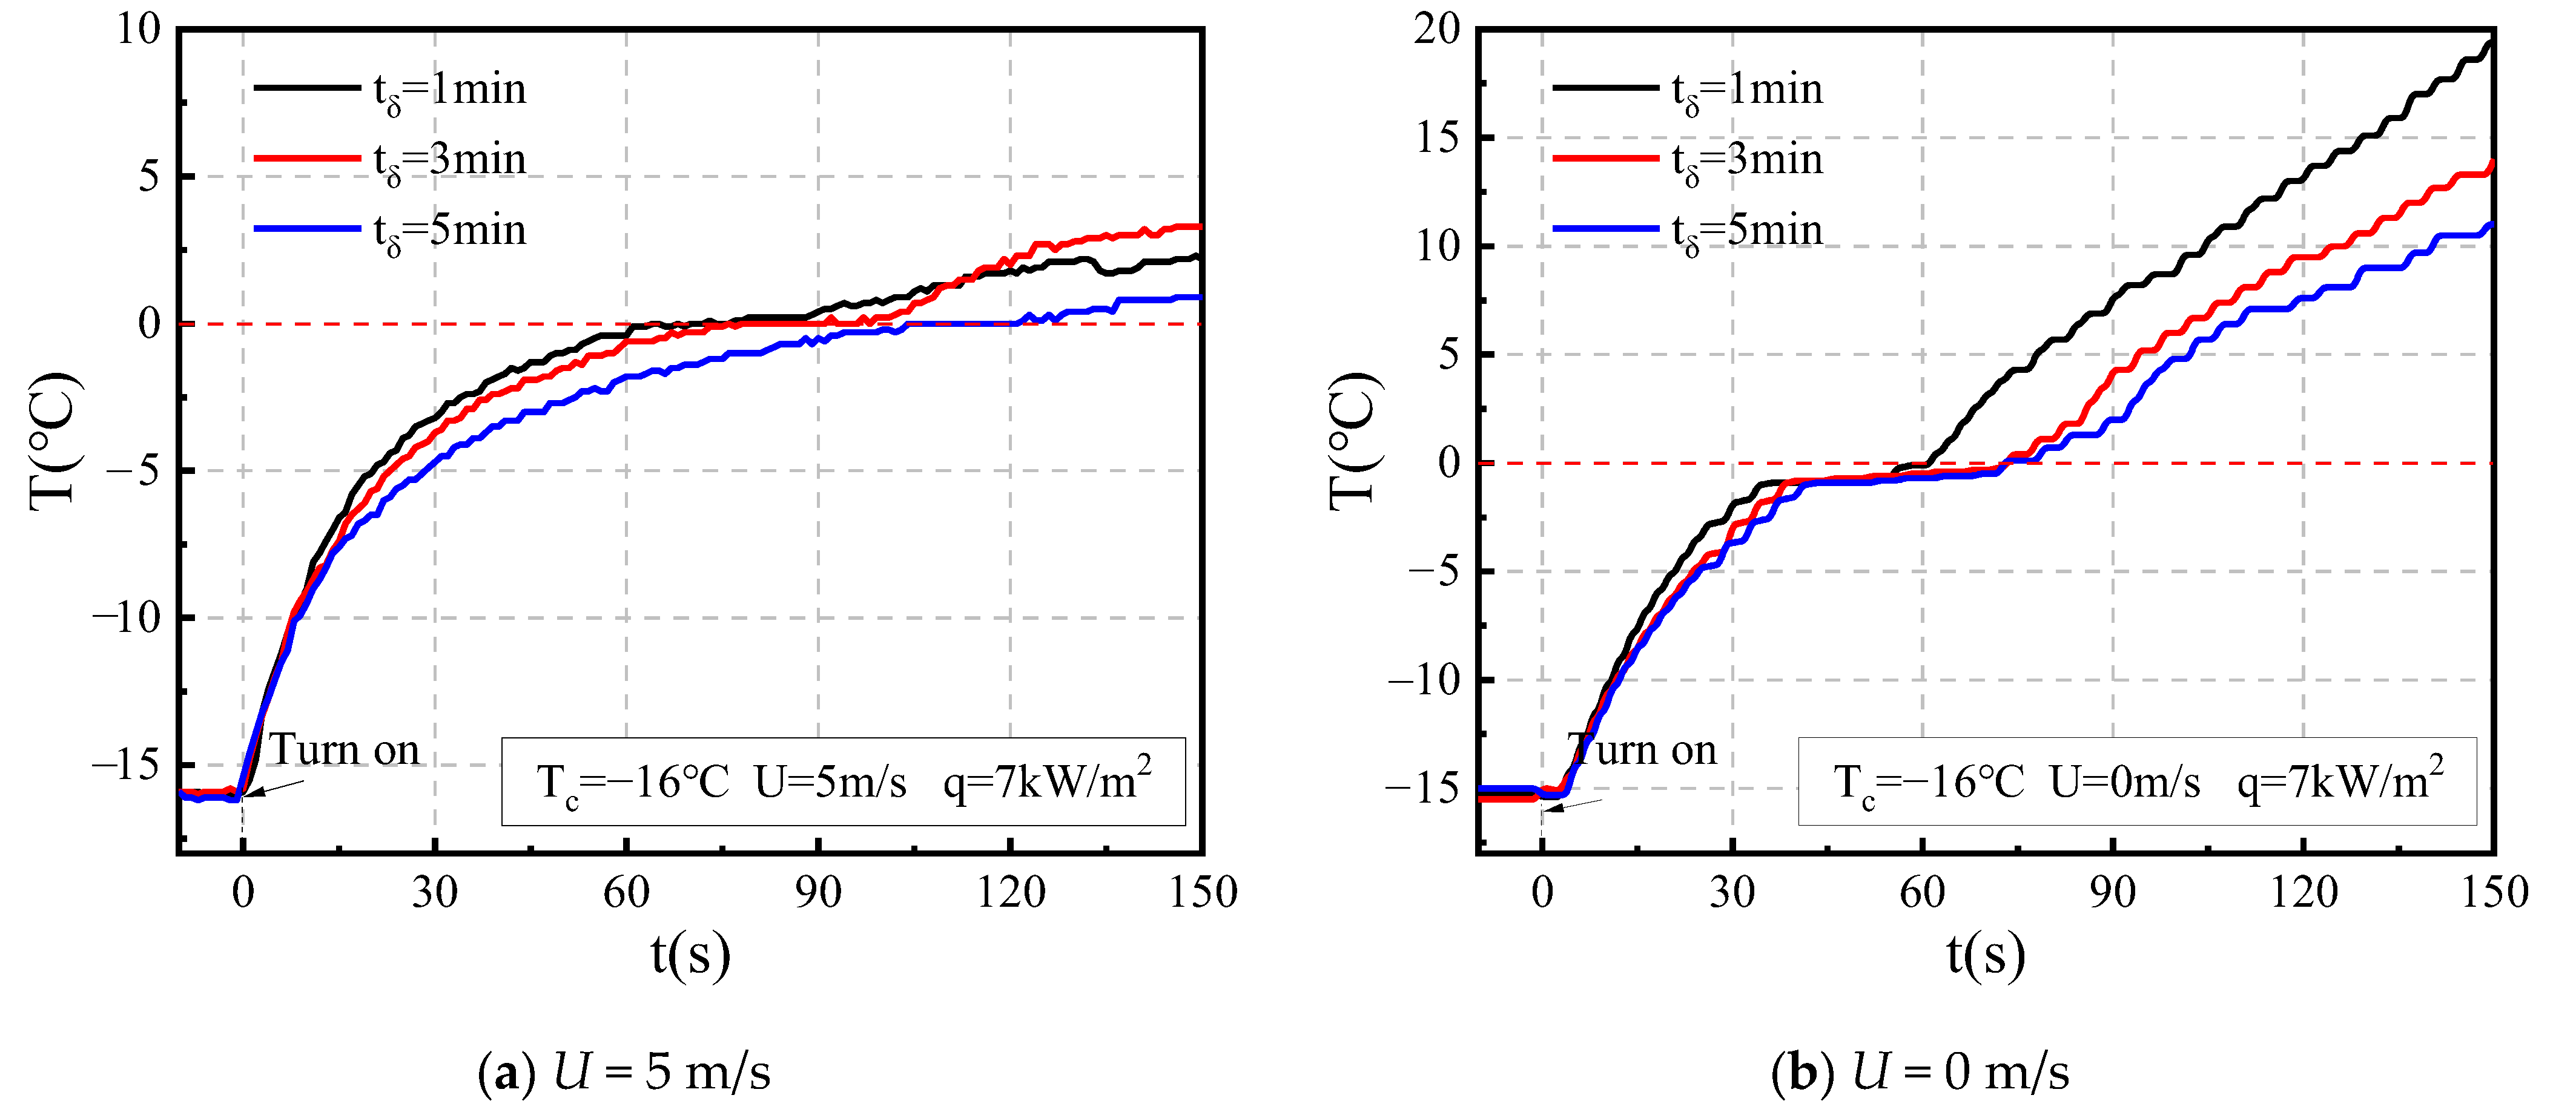
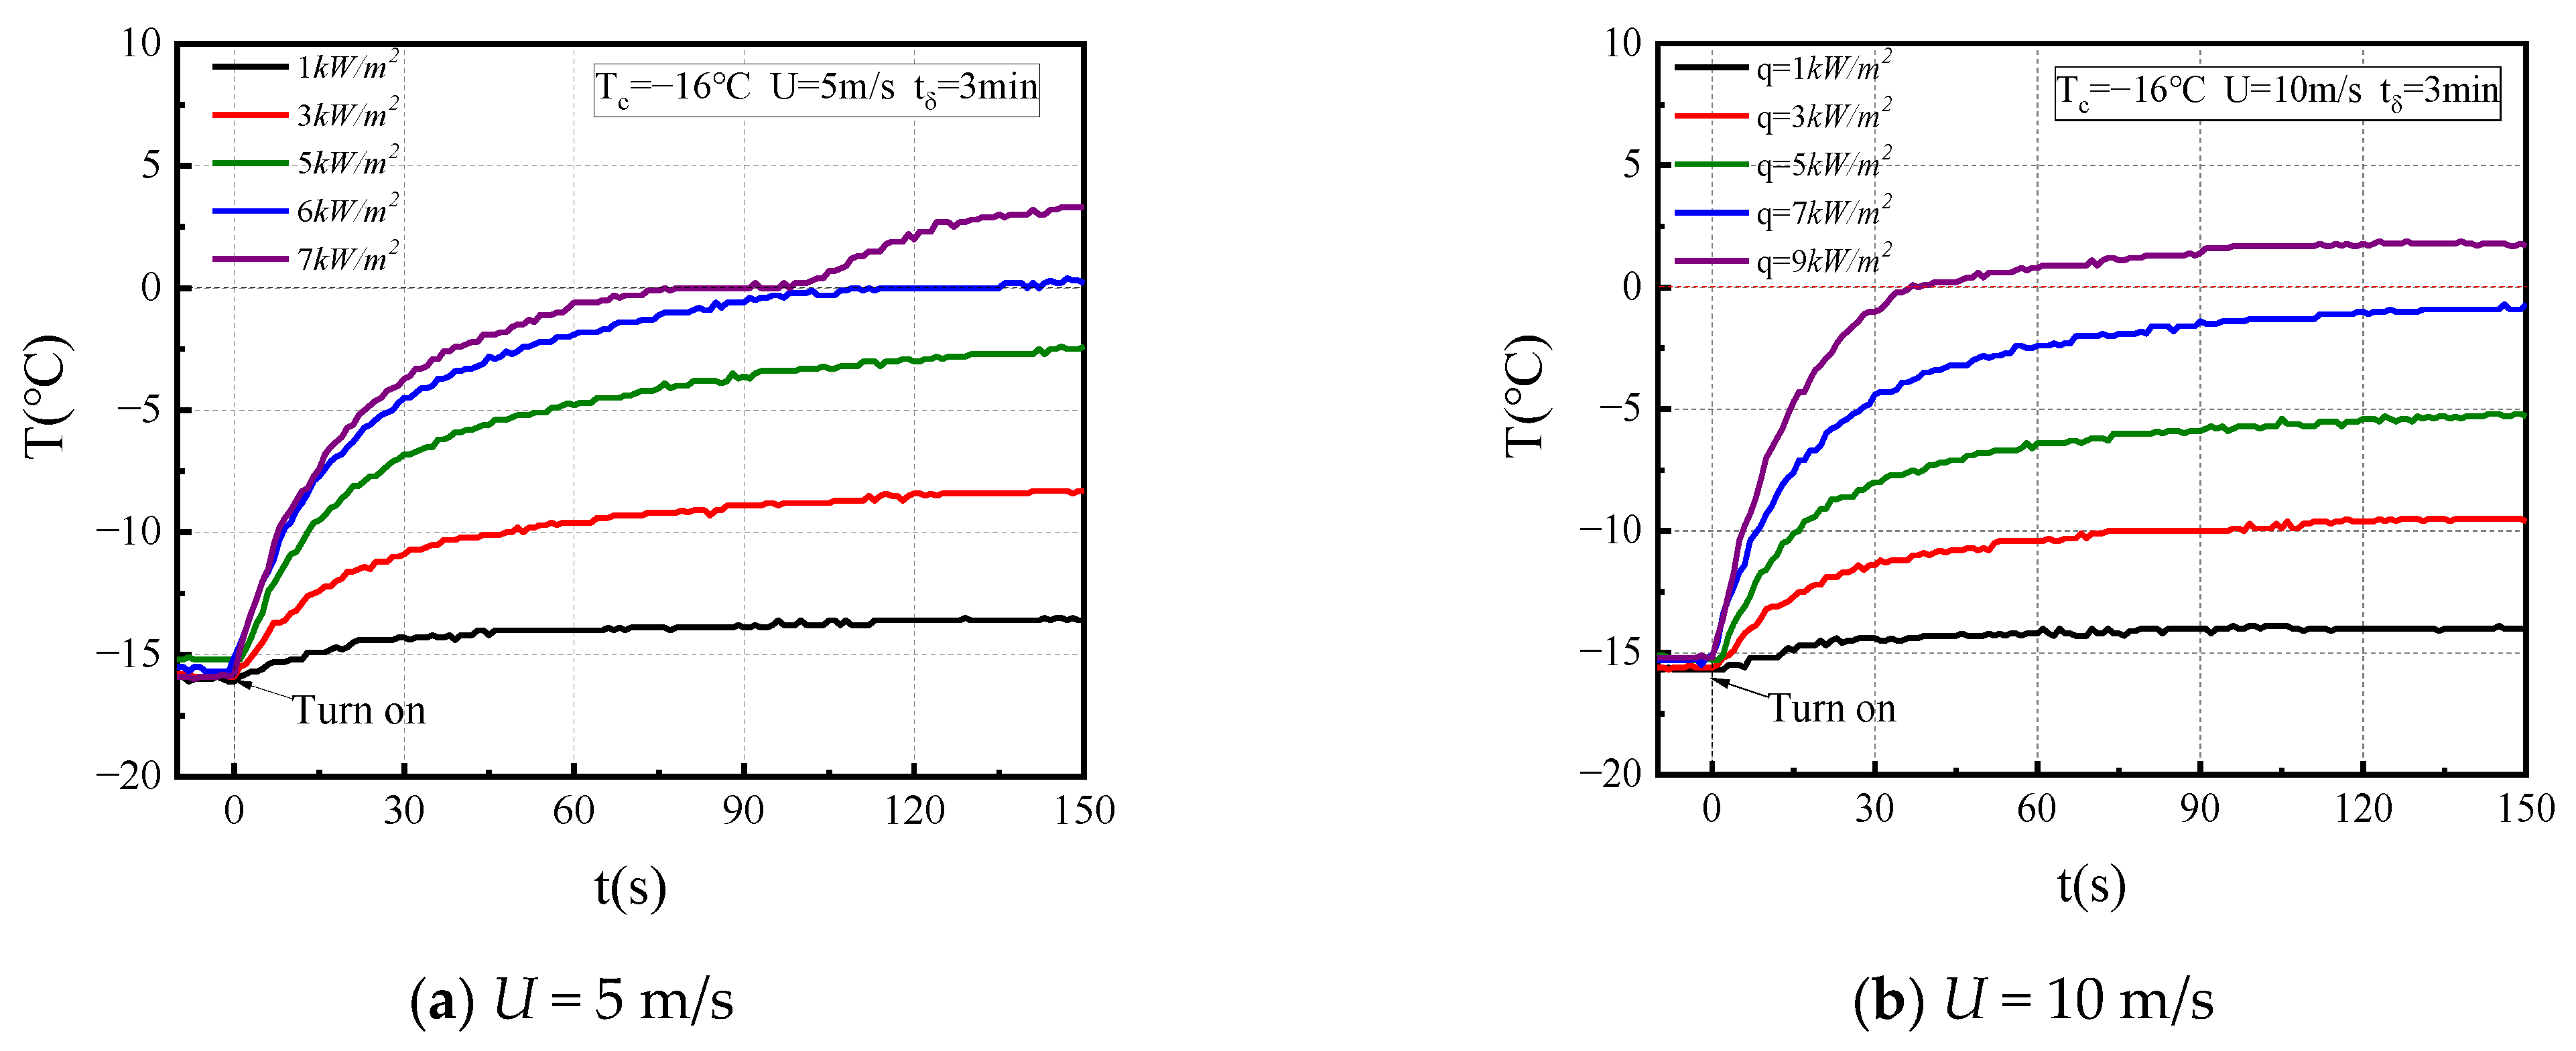
- the surface temperature during the de-icing process was obtained under different conditions;
- (c)
- the energy consumption changes were observed under the same degree of ice melting under different heat fluxes.
2. Experimental Method
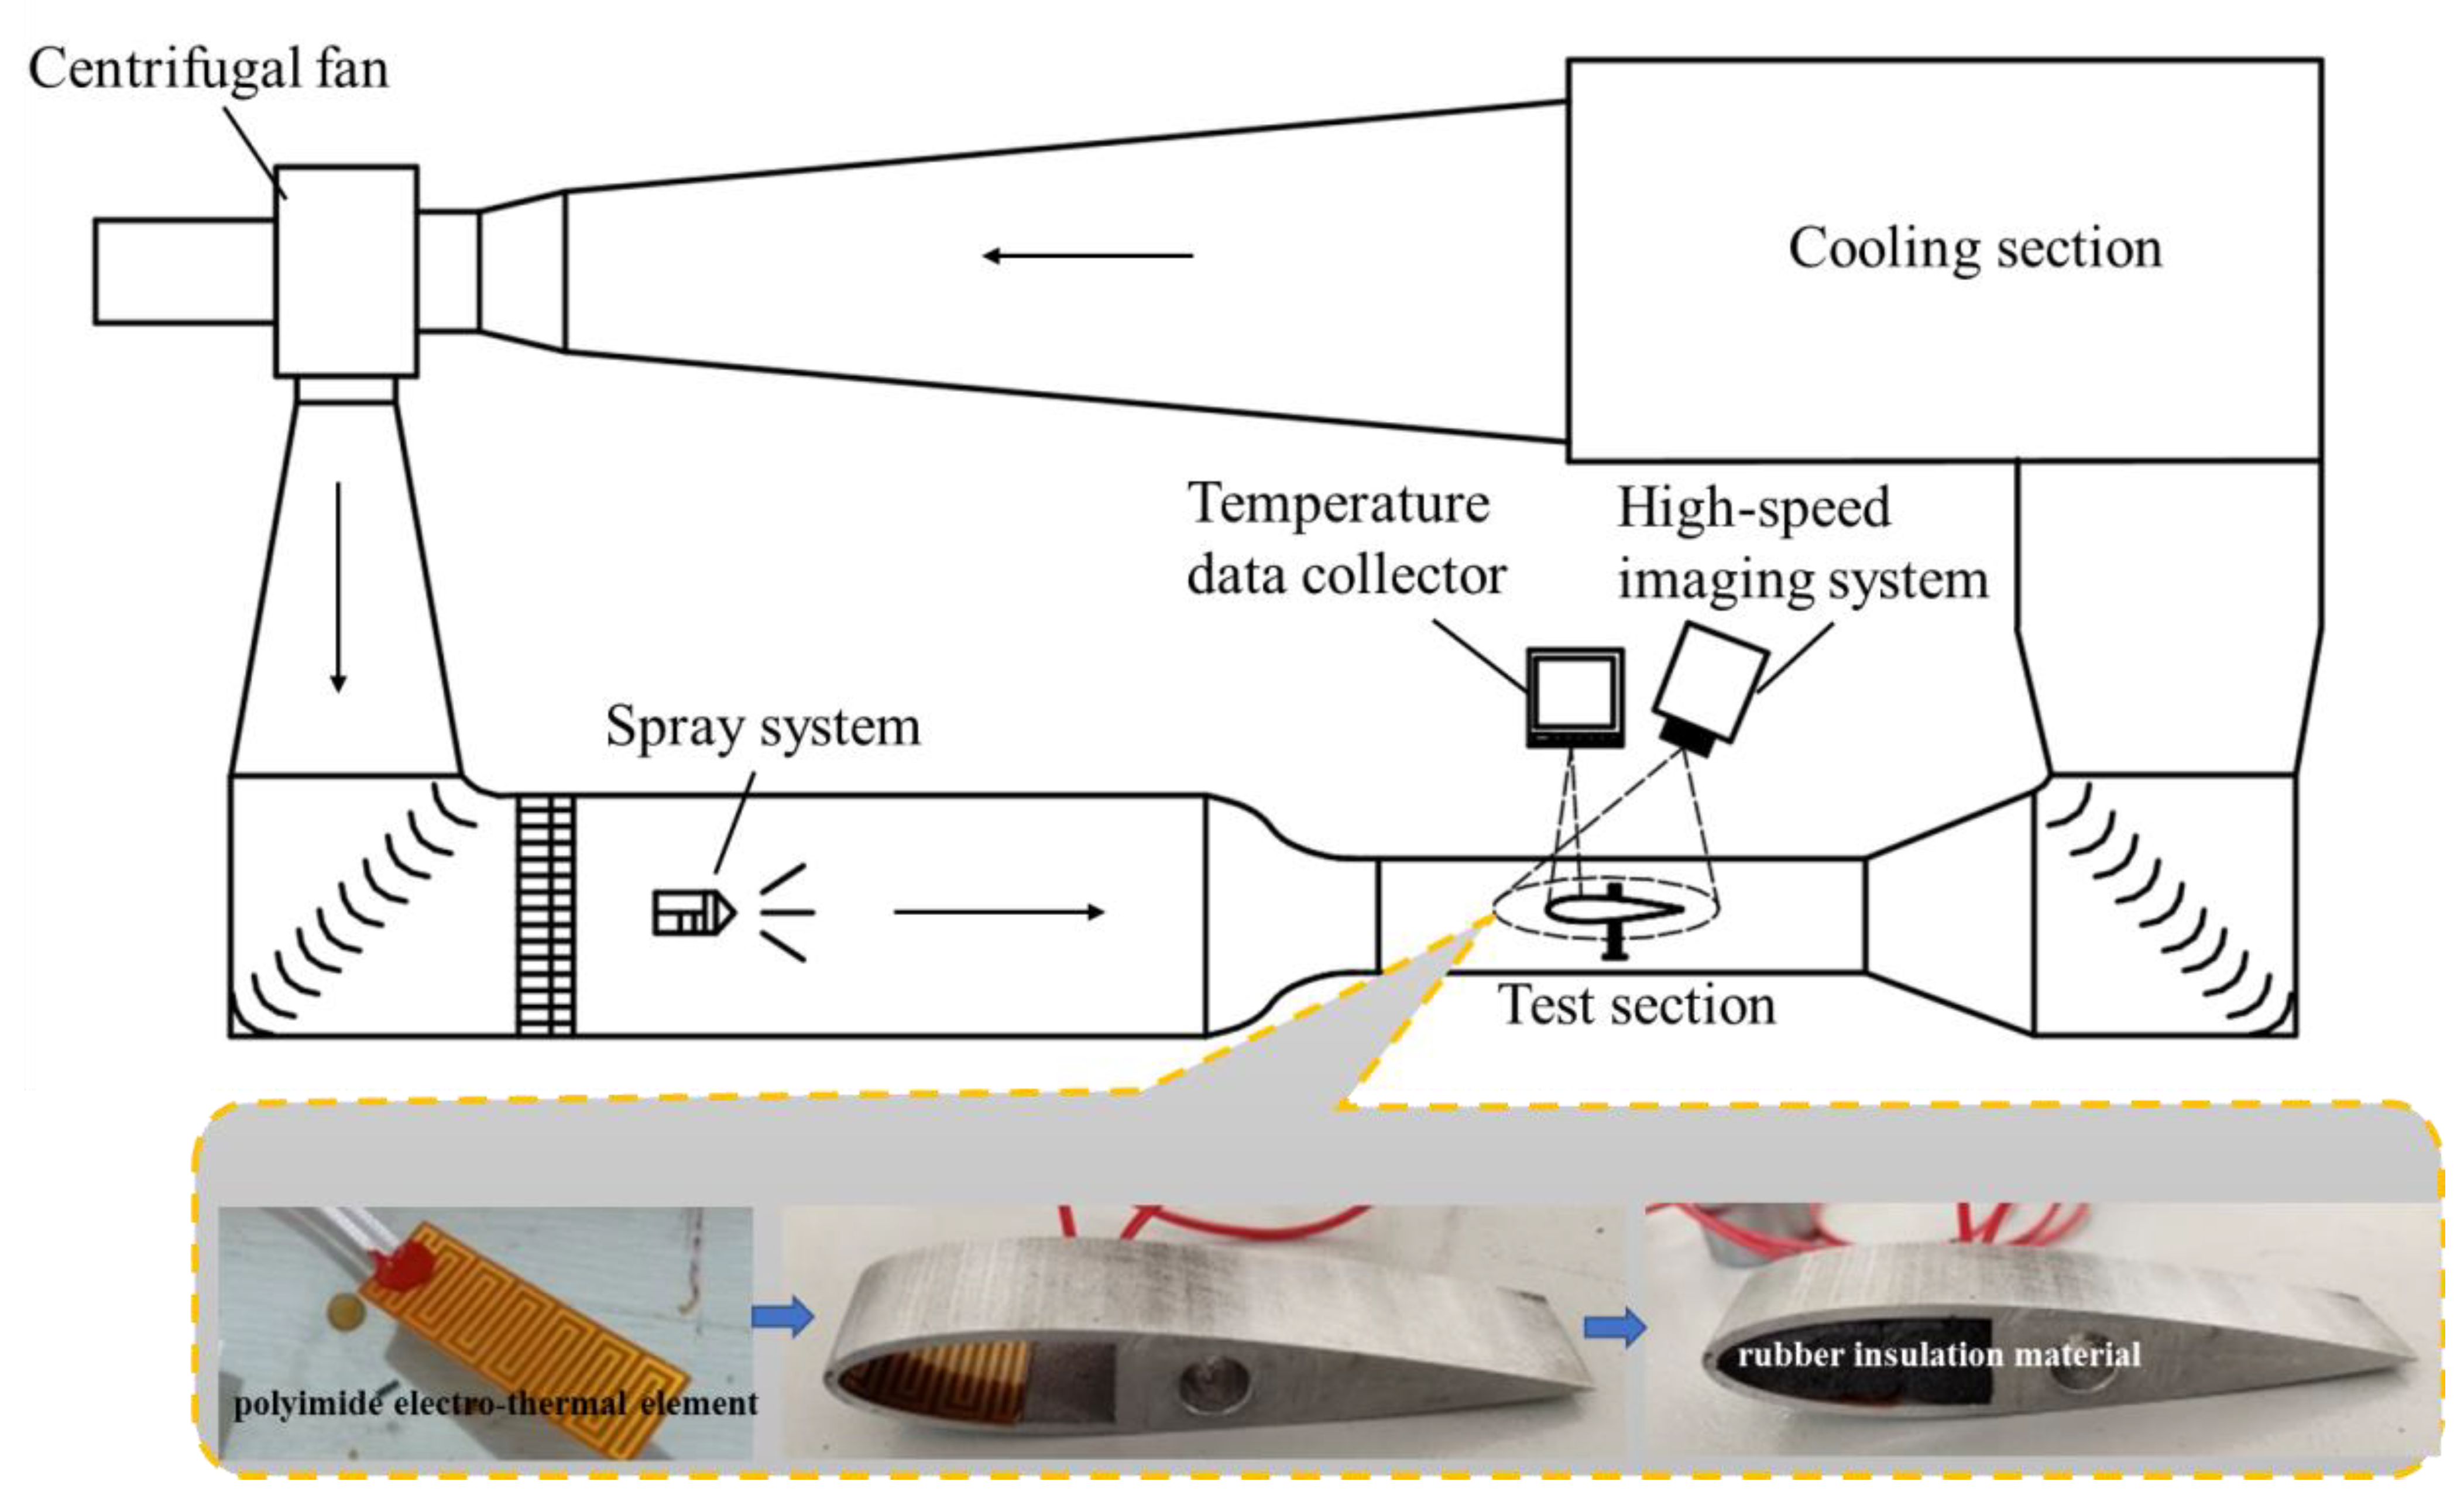
2.1. Setup
2.2. Data Acquisition
2.3. Experimental Procedure
2.4. Uncertainty Analysis
3. Results and Discussion
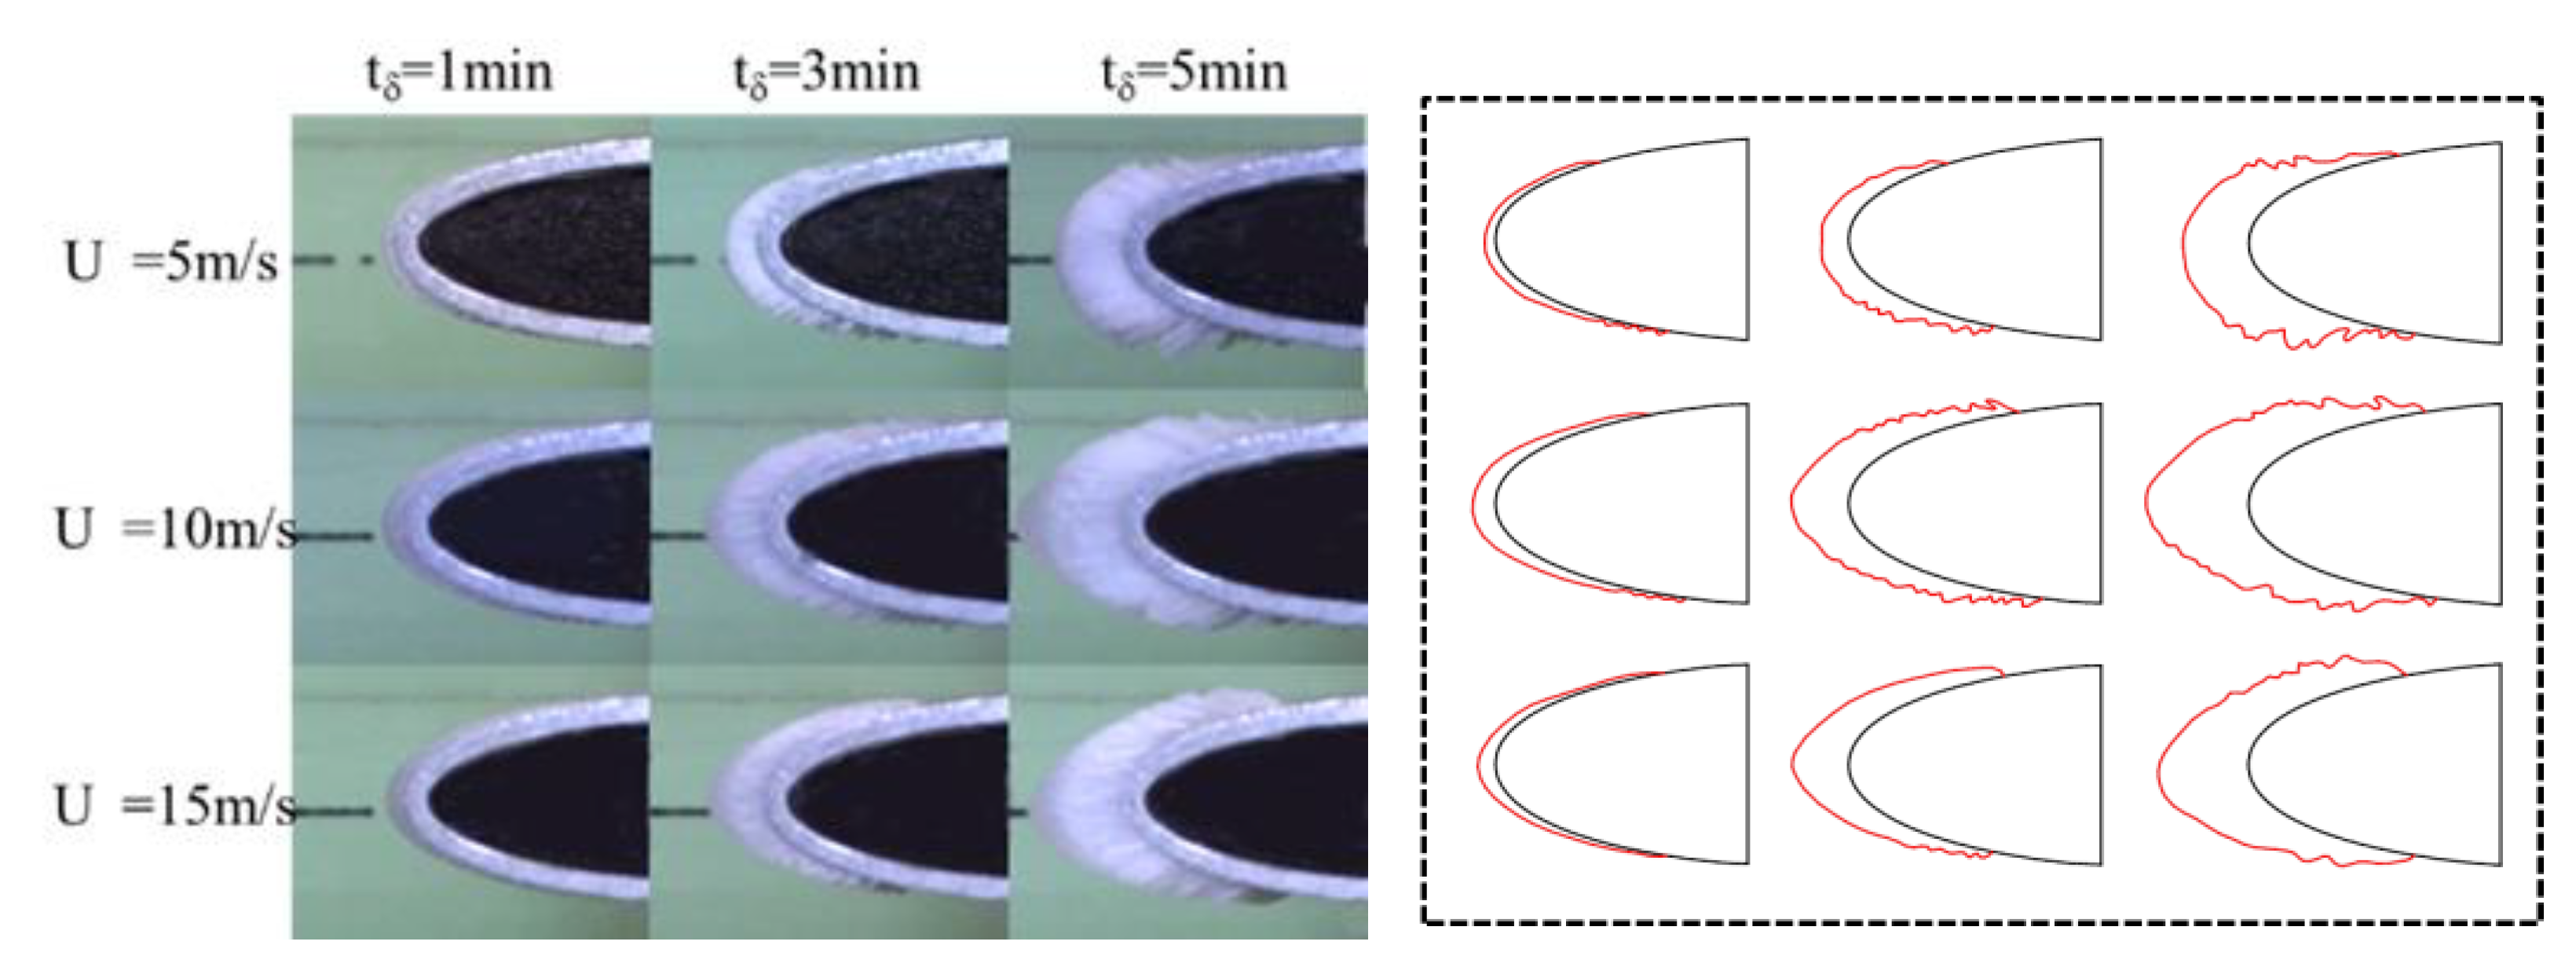
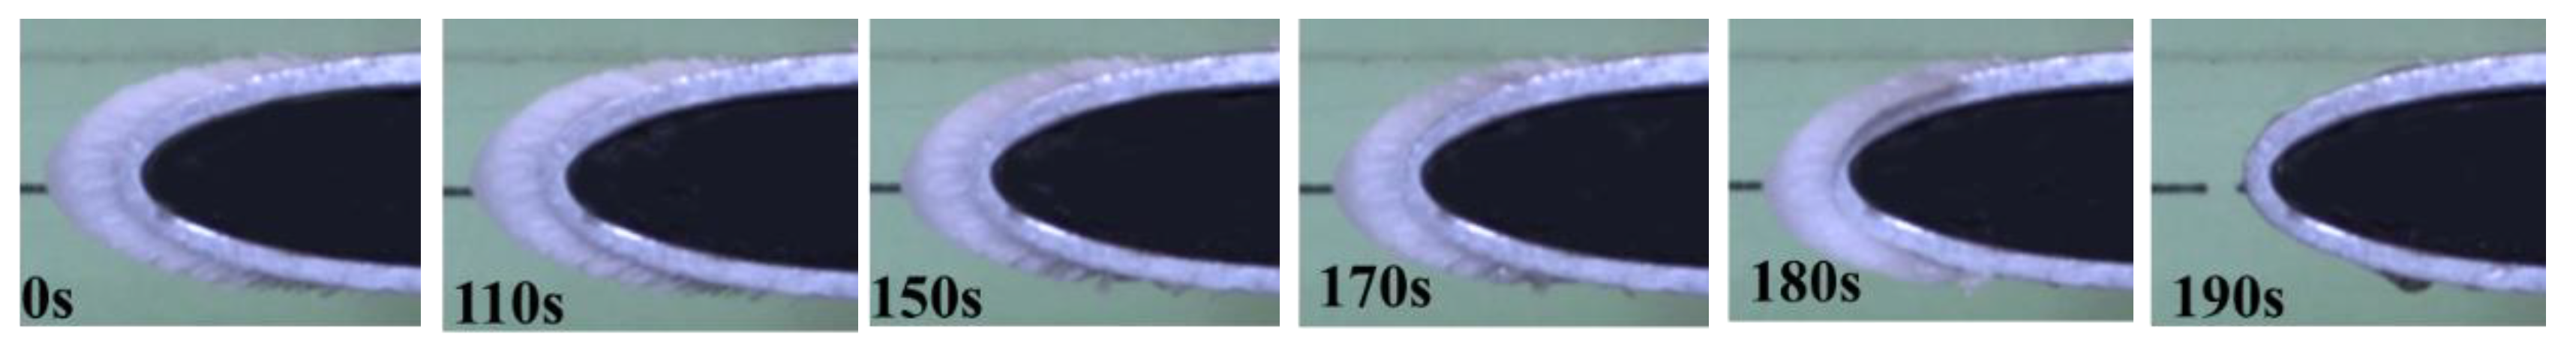
3.1. Ice-Melting Shapes under Different Conditions
3.2. Temperature and Total Energy Consumption during De-Icing
4. Conclusions
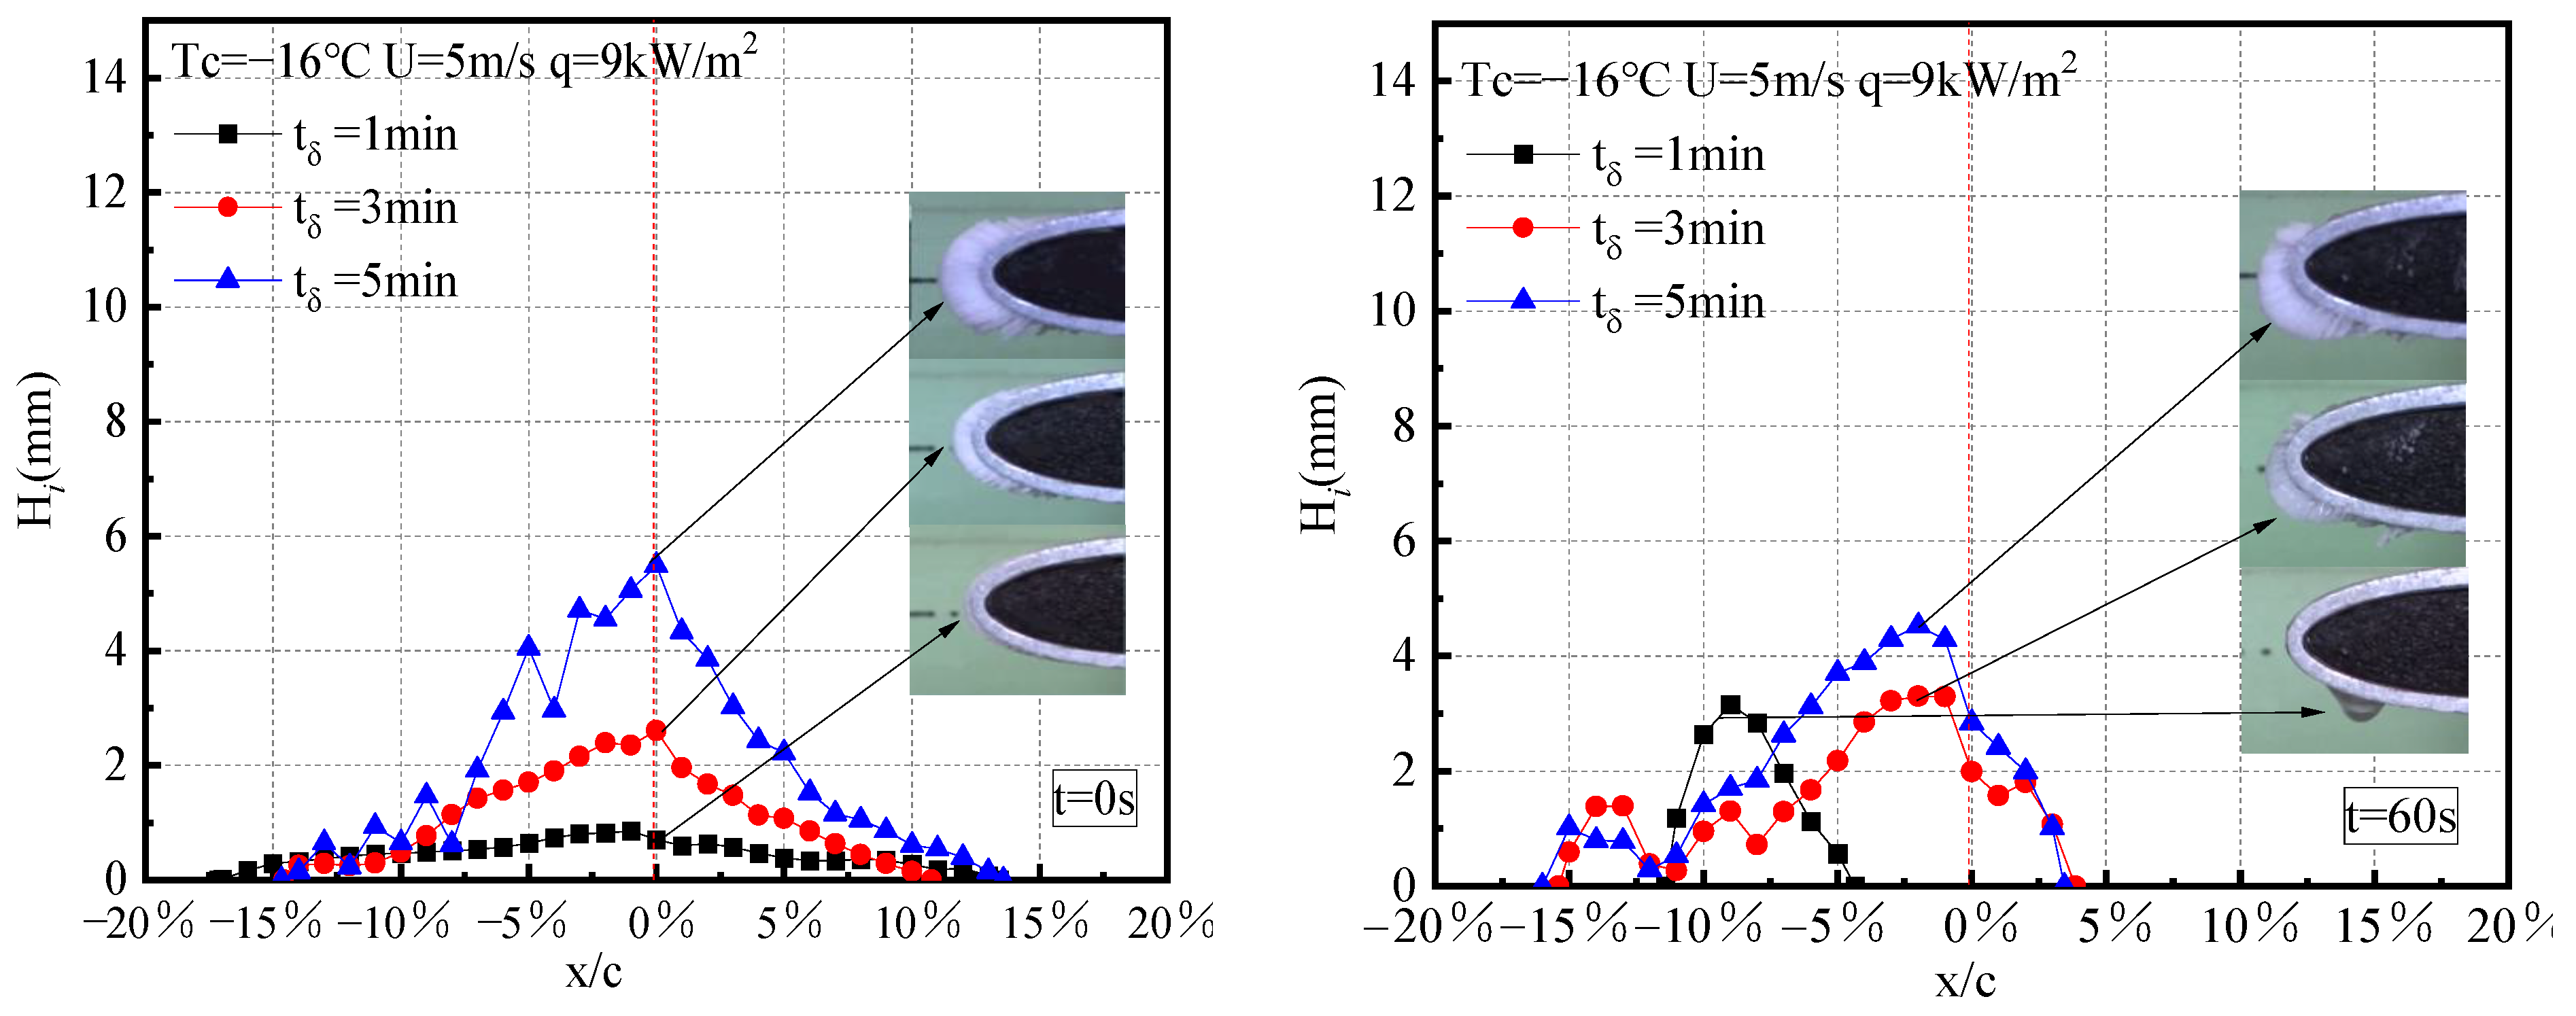
- When de-icing occurs during a short freezing time (1 min), the ice layer becomes thin, and runback water flows out;
- With an increase in freezing time (3–7 min), the melting ice induced by the dominant action of inertial force moves backward at a low wind speed (5 m/s) due to the reduction in adhesion between the ice and blade surface;
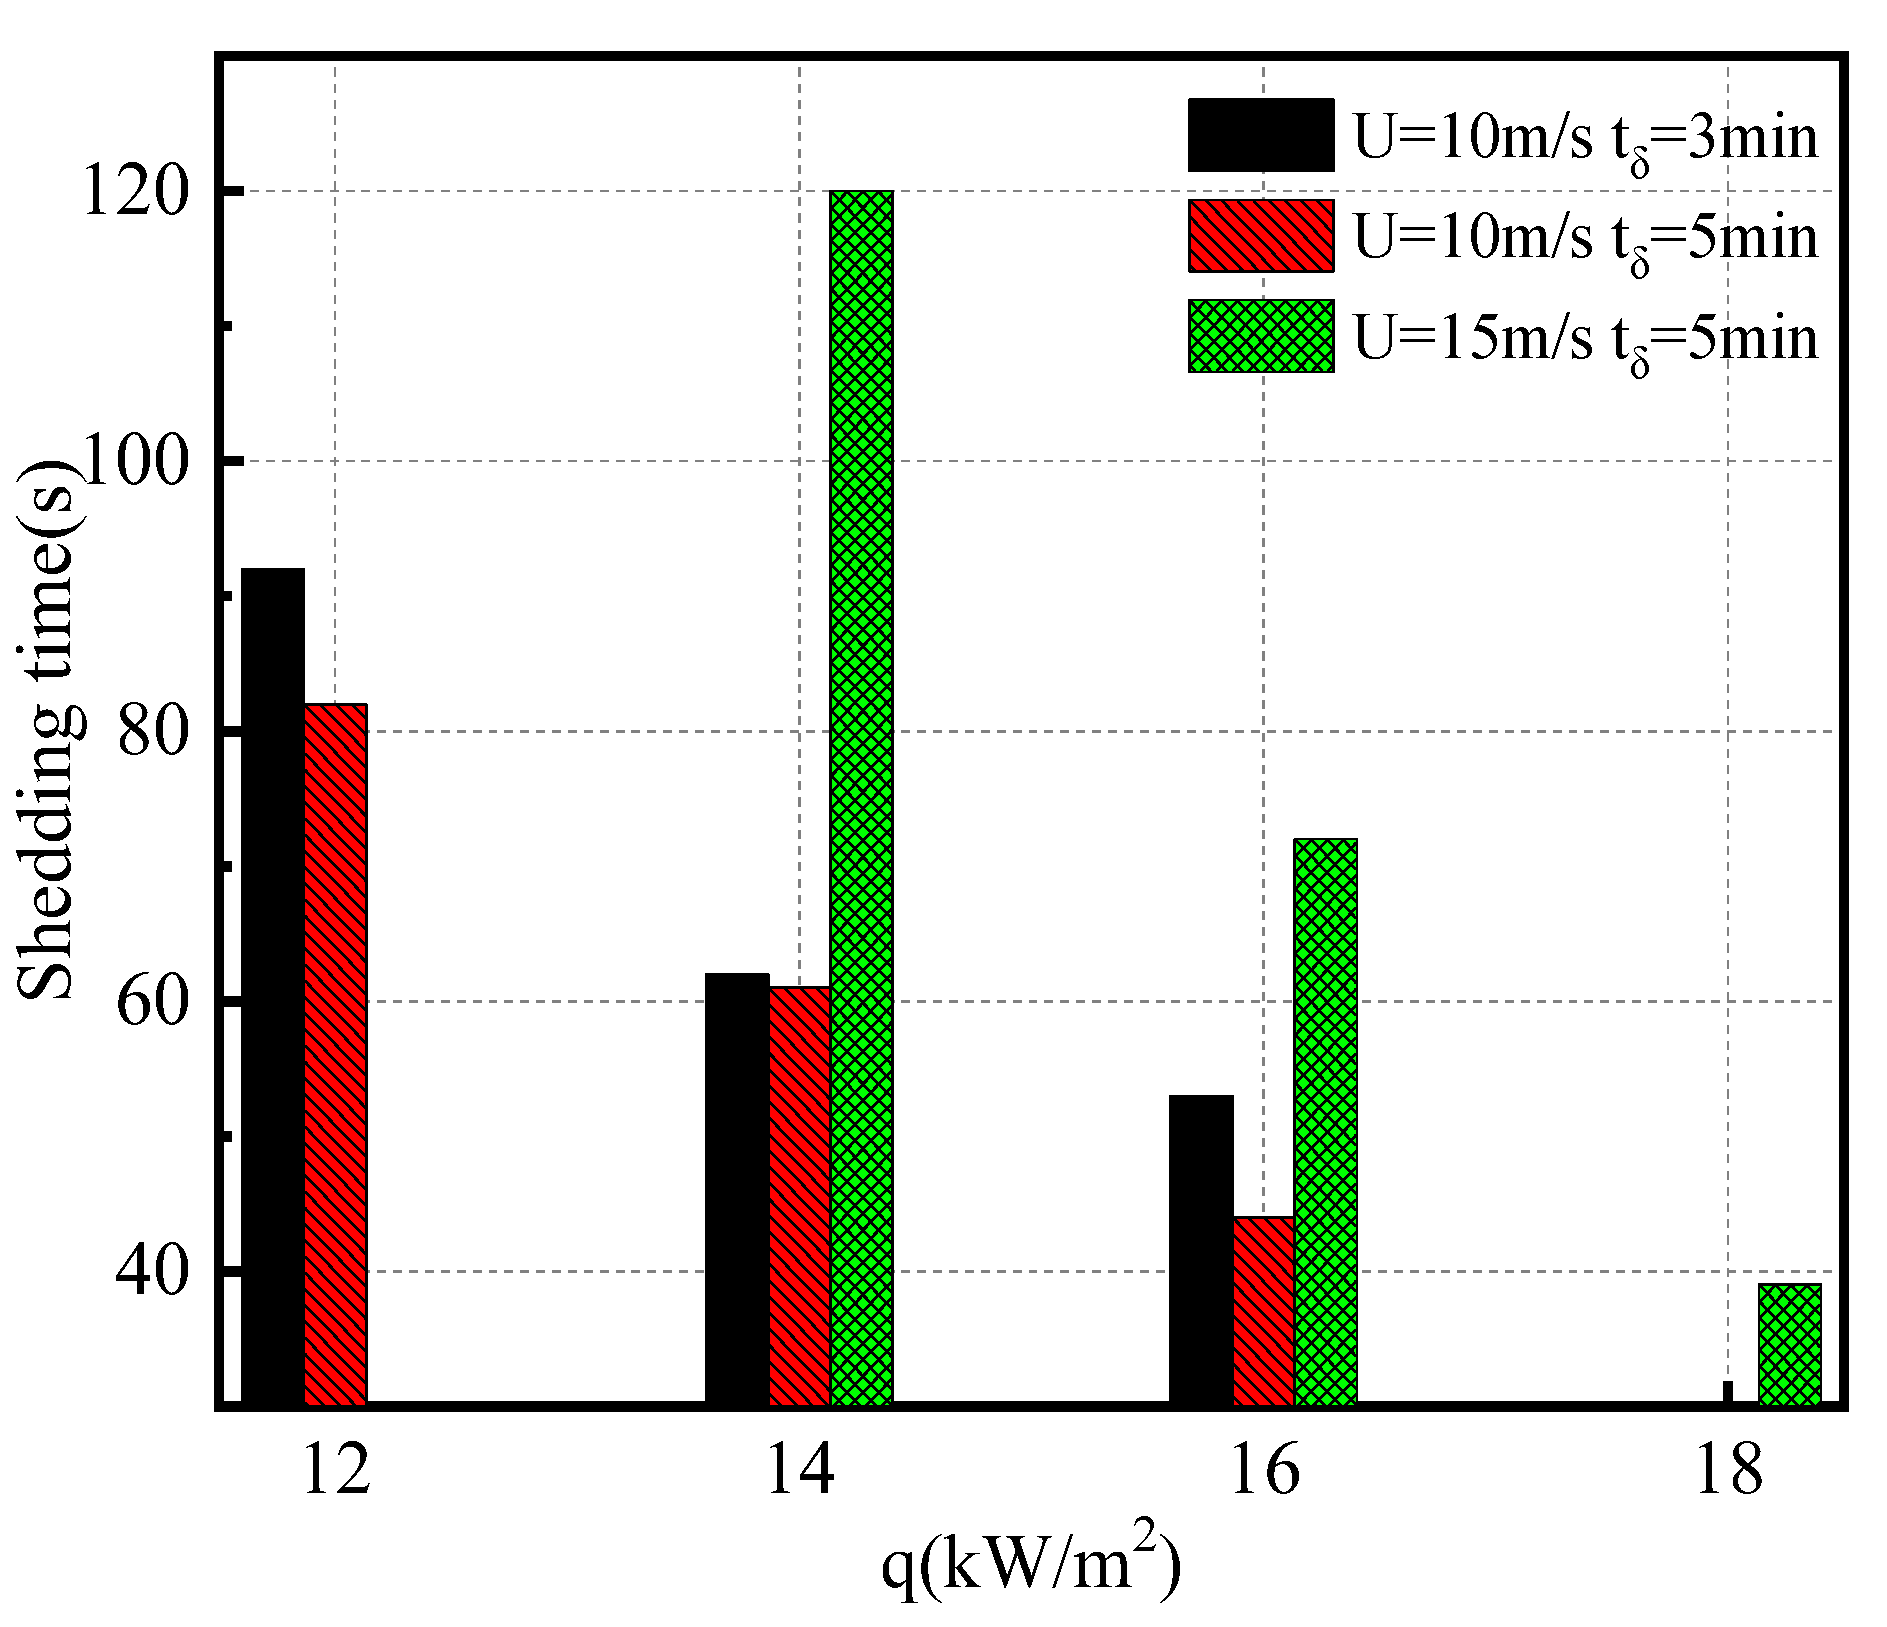
- As the wind speed increases (10–15 m/s), it exhibits various de-icing states, including refreezing to ice at the trailing edge and ice shedding;
- The total energy consumption of ice melting decreases as the heat flux increases and the ice melting time shortens. The reference de-icing heat fluxes of 5 m/s and 10 m/s are 10 kW/m2 and 12 kW/m2, respectively.
Author Contributions
Funding
Institutional Review Board Statement
Informed Consent Statement
Data Availability Statement
Conflicts of Interest
Nomenclature
| LWC | Liquid Water Content, g/m3 |
| MVD | Medium Volume Droplet Diameter, μm |
| c | Chord length of airfoil, mm |
| EA | Total energy consumption, kJ |
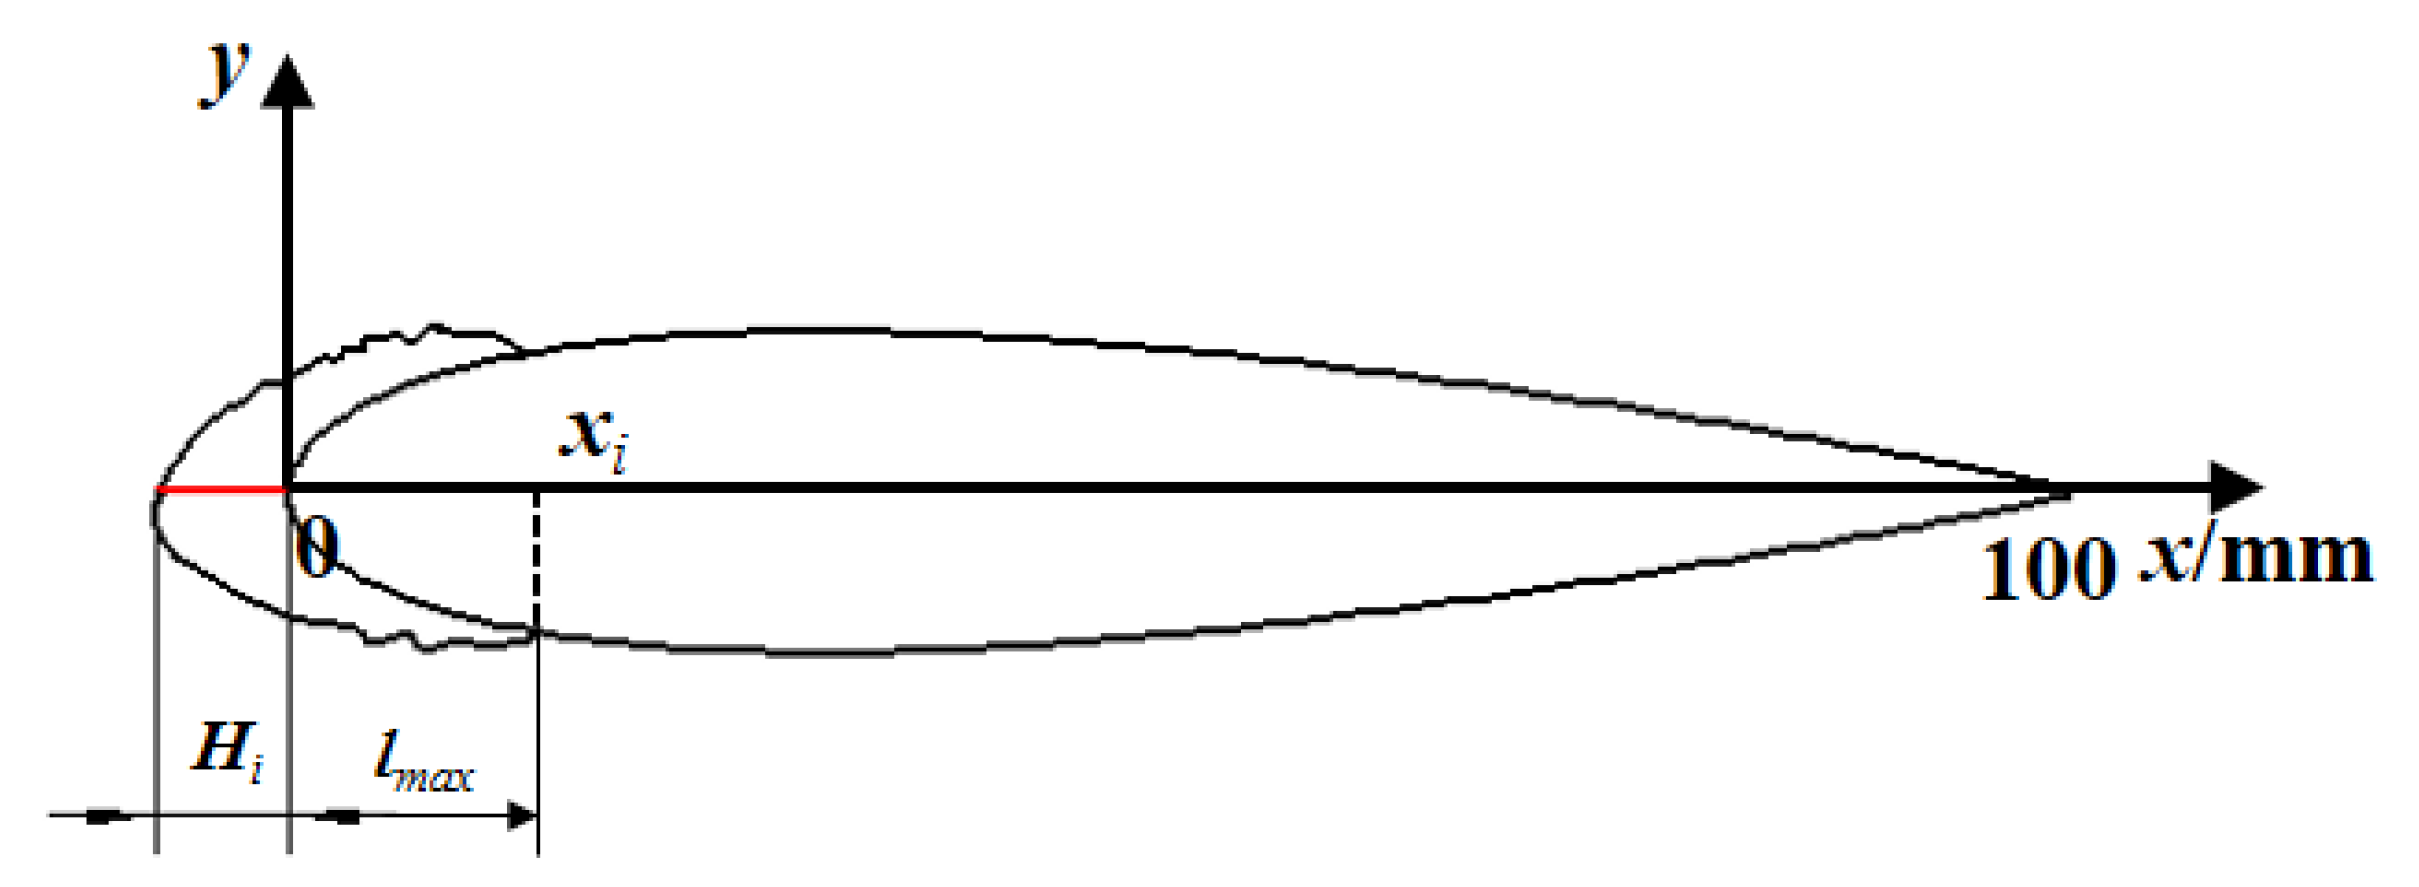
| Hi | Maximum ice thickness, mm |
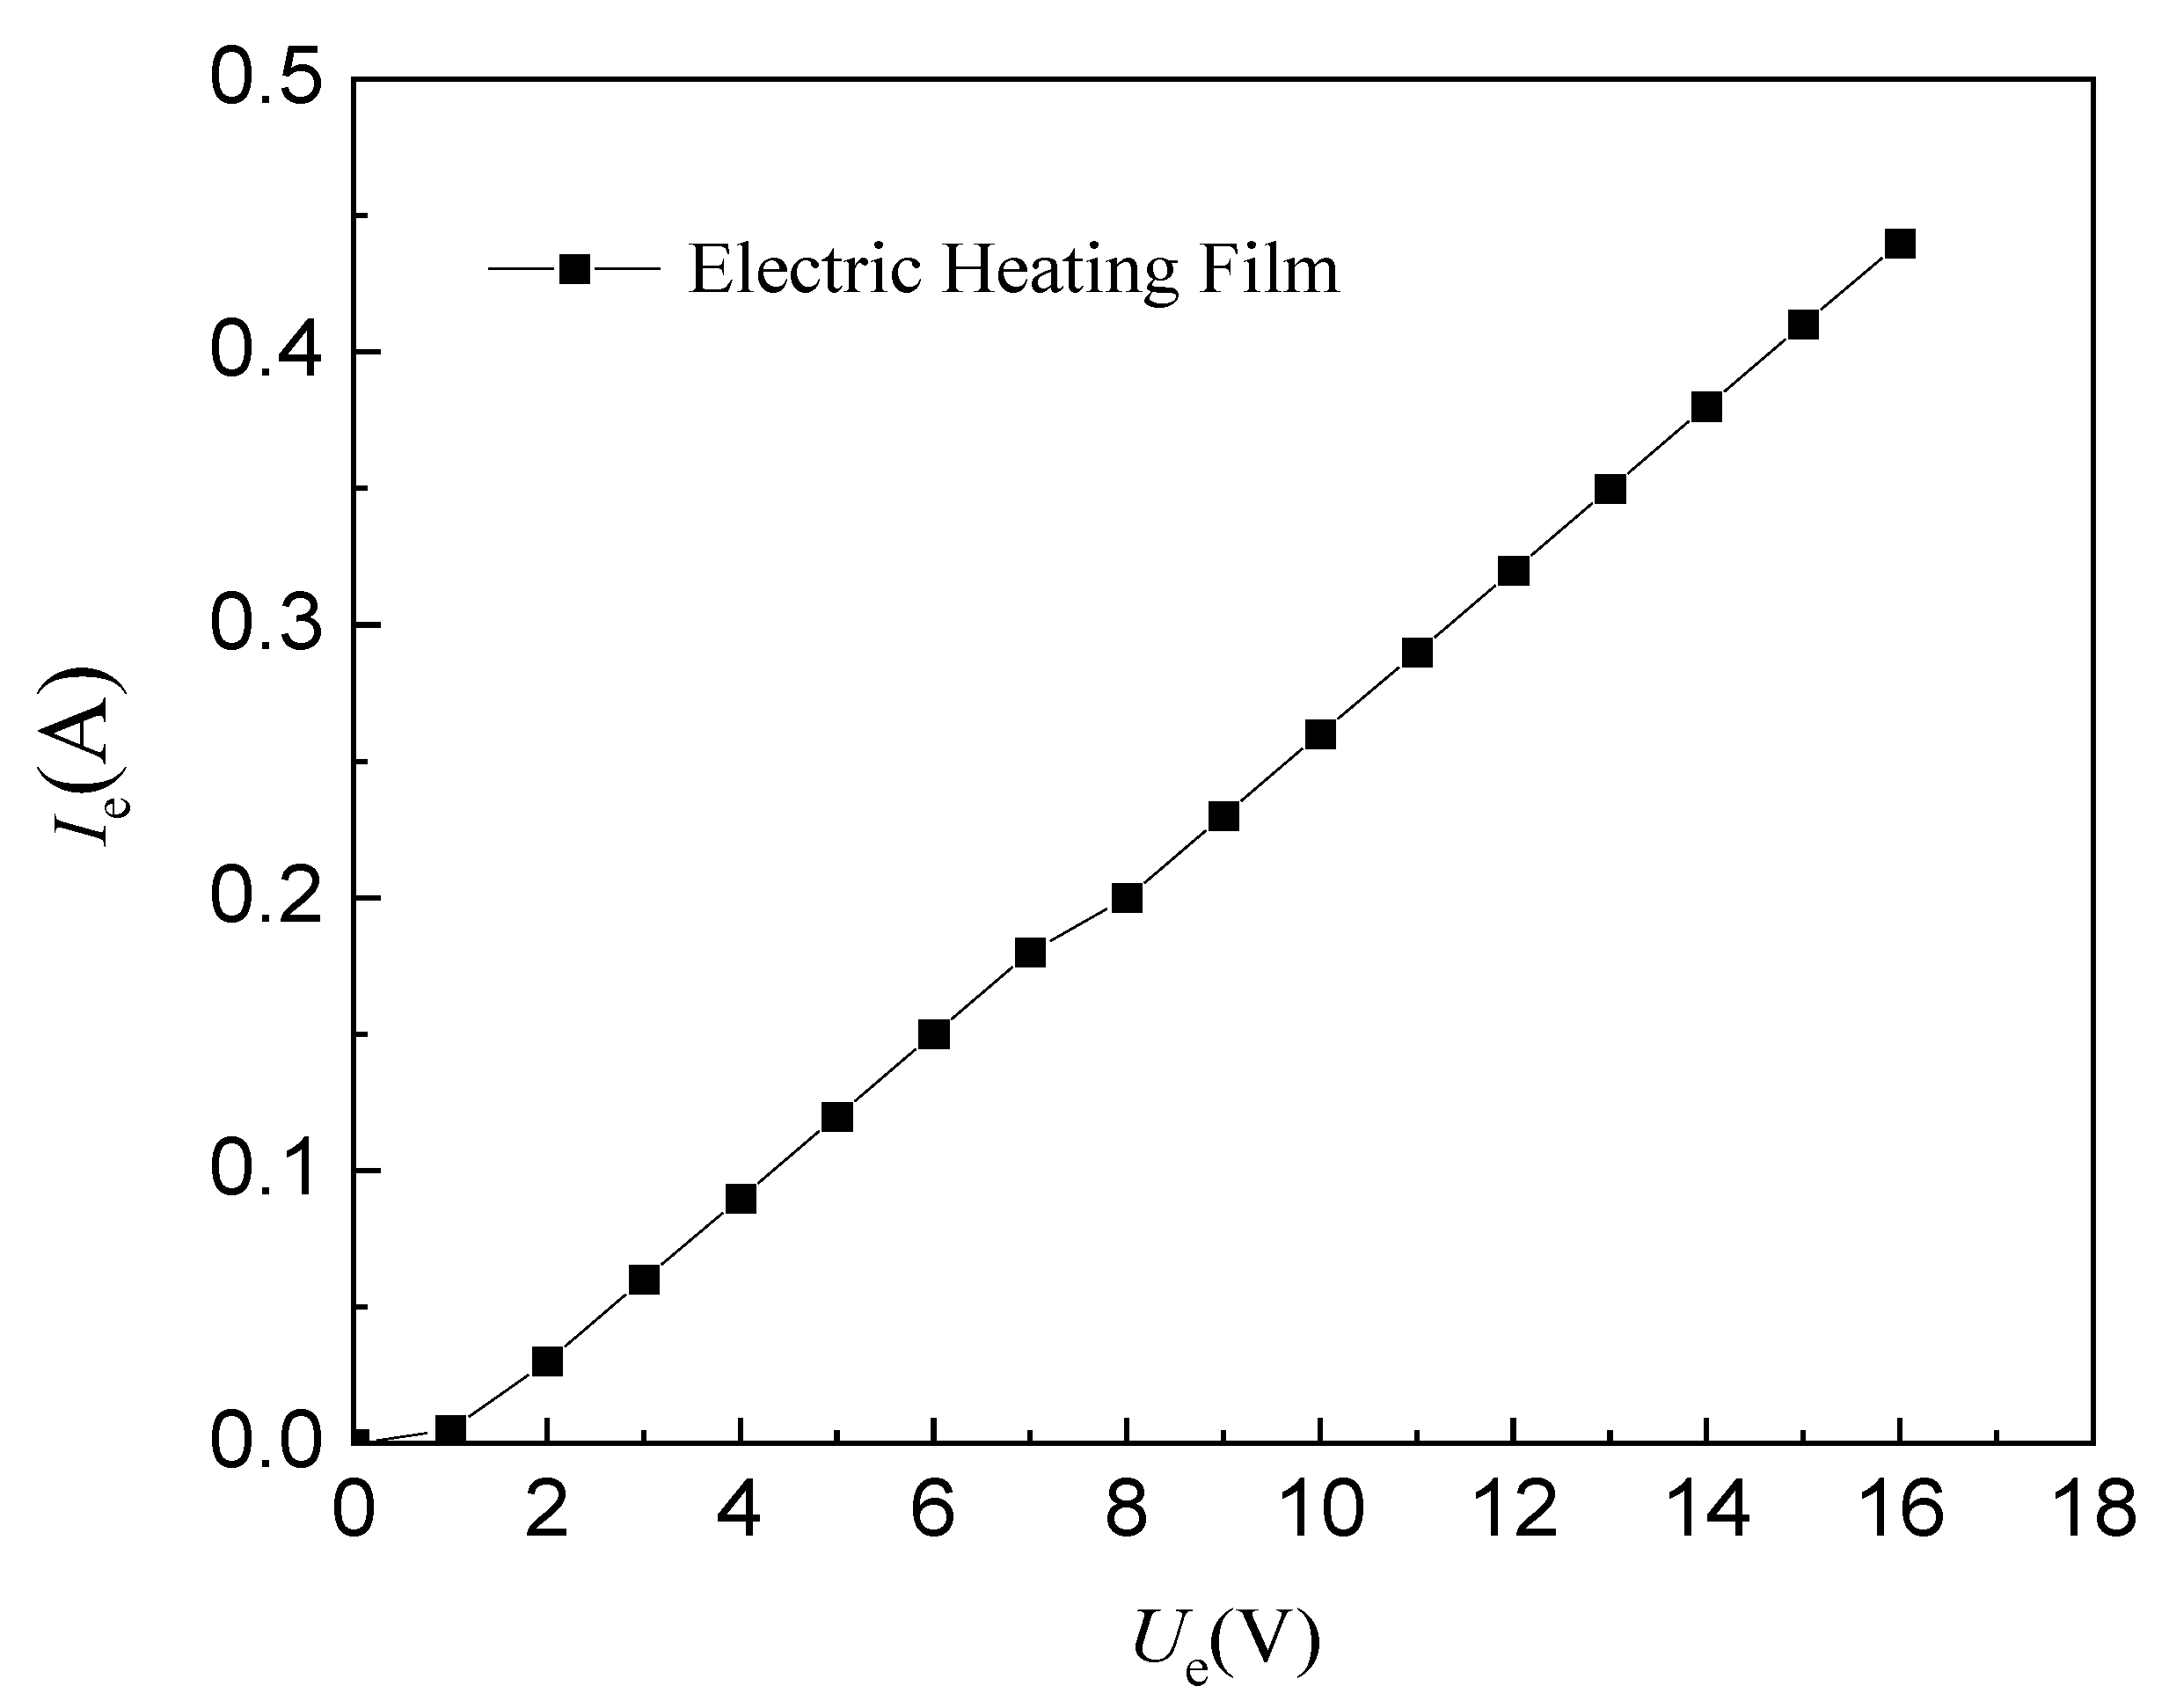
| Ie | Current, A |
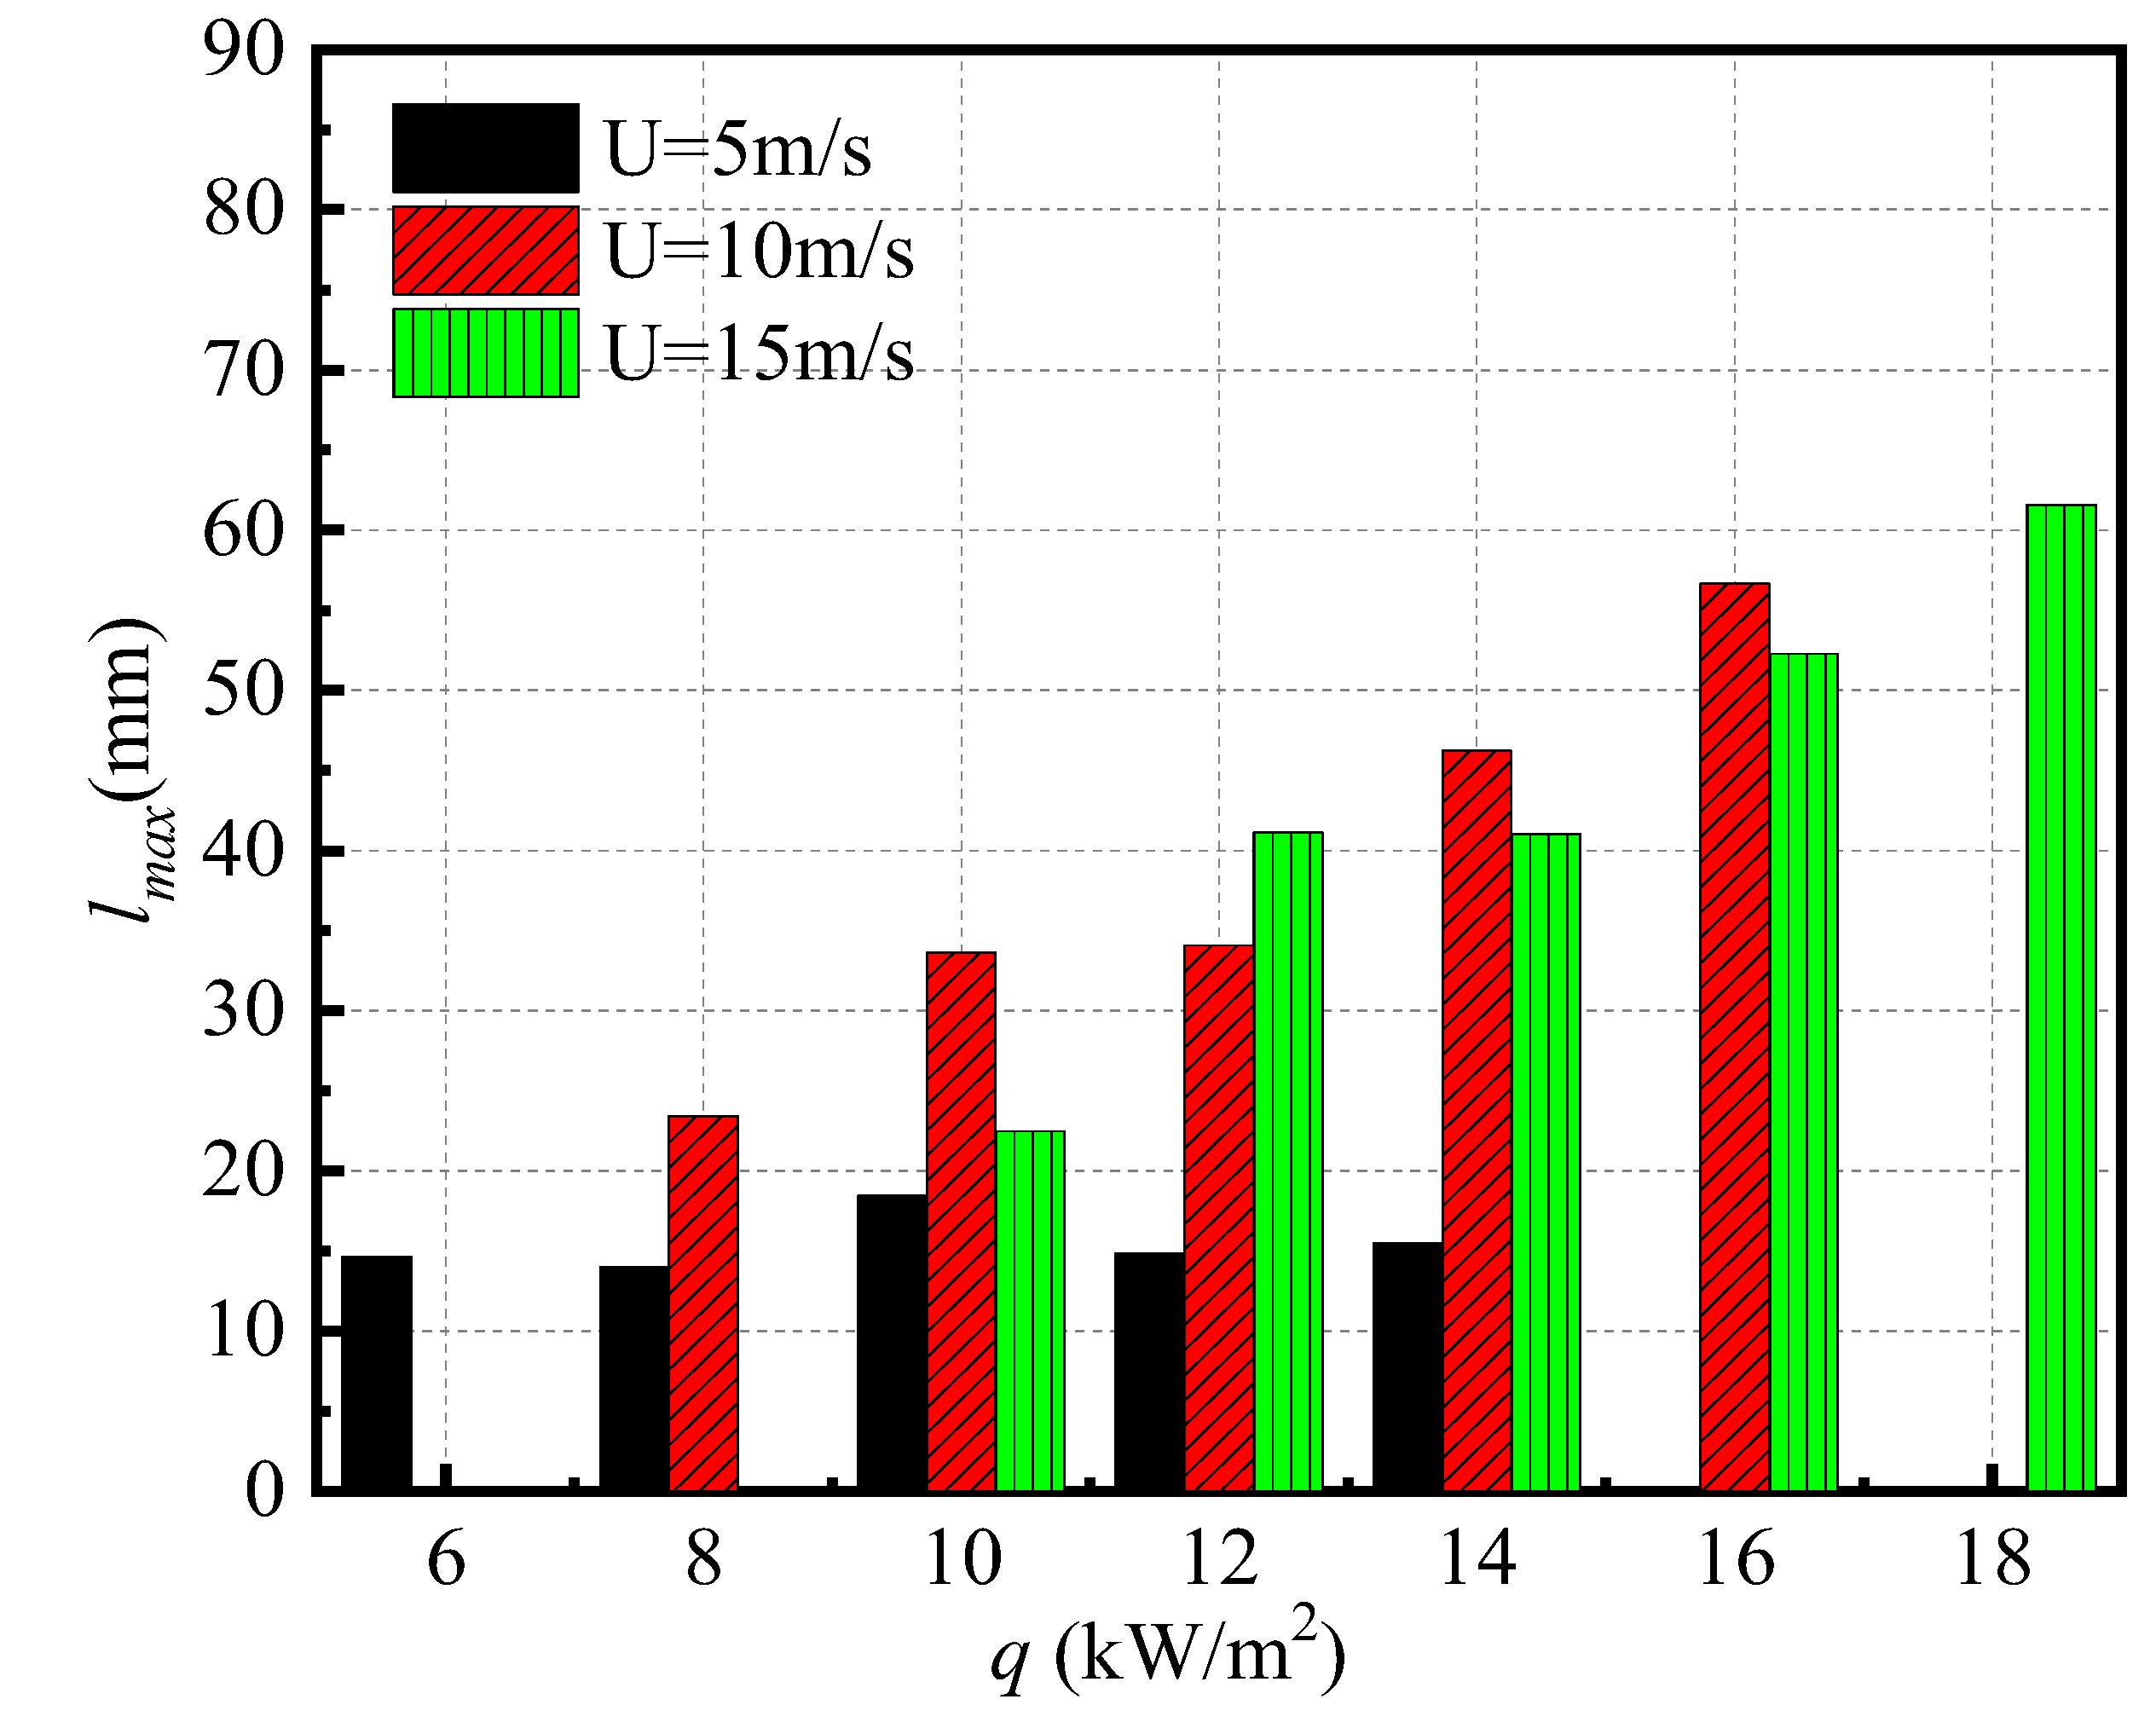
| lmax | Flow distance of runback water, mm |
| q | Heat flux of electro-thermal elements, kW/m2 |
| tA | De-icing time, s |
| Tc | Wind tunnel temperature, °C |
| tδ | Time of ice accretion, min |
| U | Wind speed, m/s |
| Ue | Voltage, V |
| xi | Abscissa of the intersection between the ice profile and the wing surface |
References
- BP. BP Statistical Review of World Energy 2022 71st Edition. Available online: https://www.bp.com/en/global/corporate/energy-economics/statistical-review-of-world-energy.html (accessed on 1 September 2023).
- Fortin, G.; Perron, J.; Ilinca, A. Behaviour and modeling of cup anemometers under Icing conditions. In Proceedings of the IWAIS 2005, Montreal, QC, Canada, 12–16 June 2005; pp. 1–6. [Google Scholar]
- Technical Research Centre of Finland (VTT). Cold Climate Wind Energy Showing Huge Potential. Science Daily (2013). Available online: https://www.sciencedaily.com/releases/2013/05/130528091611.htm (accessed on 1 September 2023).
- Lehtomäki, V.; Task, I.E.A.W. Wind Energy in Cold Climates Available Technologies-Report. Task 19, Tech. Rep., IEA 2018. 2018. Available online: https://www.researchgate.net/publication/305881044_IEA_Wind_Task_19_-_Available_Technologies_report_of_Wind_Energy_in_Cold_Climates (accessed on 1 September 2023).
- Gao, L.Y.; Hu, H. Wind turbine icing characteristics and icing-induced power losses to utility-scale wind turbines. Proc. Natl. Acad. Sci. USA 2021, 18, 42. [Google Scholar] [CrossRef] [PubMed]
- Jolin, N.; Bolduc, D.; Swytink-Binnema, N.; Rosso, G.; Godreau, C. Wind turbine blade ice accretion: A correlation with nacelle ice accretion. Cold Reg. Sci. Technol. 2018, 157, 235–241. [Google Scholar] [CrossRef]
- Li, Y.; Tagawa, K.; Feng, F.; Li, Q.; He, Q.B. A wind tunnel experimental study of icing on wind turbine blade airfoil. Energy Convers. Manag. 2014, 85, 591–595. [Google Scholar] [CrossRef]
- Jasinski, W.J.; Noe, S.C.; Selig, M.S.; Bragg, M.B. Wind turbine performance under icing conditions. J. Sol. Energy Eng. 1998, 120, 60–65. [Google Scholar] [CrossRef]
- Lamraoui, F.; Fortin, G.; Benoit, R.; Perron, J.; Masson, C. Atmospheric icing impact on wind turbine production. Cold Reg. Sci. Technol. 2014, 100, 36–49. [Google Scholar] [CrossRef]
- Gao, L.Y.; Tao, T.; Liu, Y.Q.; Hu, H. A field study of ice accretion and its effects on the power production of utility-scale wind turbines. Renew. Energy 2021, 167, 917–928. [Google Scholar] [CrossRef]
- Barber, S.; Wang, Y.; Jafari, S. The Impact of Ice Formation on Wind Turbine Performance and Aerodynamics. J. Sol. Energy Eng. 2011, 133, 1. [Google Scholar] [CrossRef]
- Drapalik, M.; Zajicek, L.; Purker, S. Ice aggregation and ice throw from small wind turbines. Cold Reg. Sci. Technol. 2021, 192, 103399. [Google Scholar] [CrossRef]
- Madi, E.; Pope, K.; Huang, W.M.; Iqbal, T. A review of integrating ice detection and mitigation for wind turbine blades. Renew. Sustain. Energy Rev. 2019, 103, 269–281. [Google Scholar] [CrossRef]
- Parent, O.; Ilinca, A. Anti-icing and de-icing techniques for wind turbines: Critical review. Cold Reg. Sci. Technol. 2011, 65, 88–96. [Google Scholar] [CrossRef]
- Liu, Z.; Zhang, Y.; Li, Y. Superhydrophobic coating for blade surface ice-phobic properties of wind turbines: A review. Prog. Org. Coat. 2024, 187, 108145. [Google Scholar] [CrossRef]
- Khedir, K.R.; Kannarpady, G.K.; Ryerson, C.; Biris, A.S. An outlook on tunable superhydrophobic nanostructural surfaces and their possible impact on ice mitigation. Prog. Org. Coat. 2017, 112, 304–318. [Google Scholar] [CrossRef]
- Khadak, A.; Subeshan, B.; Asmatulu, R. Studies on de-icing and anti-icing of carbon fiber-reinforced composites for aircraft surfaces using commercial multifunctional permanent superhydrophobic coatings. J. Mater. Sci. 2021, 56, 3078–3094. [Google Scholar] [CrossRef]
- Xie, Z.T.; Wang, H.; Geng, Y.; Li, M.; Deng, Q.Y.; Tian, Y.; Chen, R.; Zhu, X.; Liao, Q. Carbon-based photothermal superhydrophobic materials with hierarchical structure enhances the anti-icing and photothermal de-icing properties. ACS Appl. Mater. Interfaces 2021, 13, 48308–48321. [Google Scholar] [CrossRef] [PubMed]
- Liu, Z.; Li, Y.; He, Z. Ice-phobic properties of mos2-loaded rice straw biogas residue biochar-based photothermal and anti-corrosion coating with low oxygen to carbon ratio. Biochar 2023, 5, 74. [Google Scholar] [CrossRef]
- Ma, L.Q.; Zhang, Z.C.; Gao, L.Y.; Hu, H. An exploratory study on using Slippery-Liquid-Infused-Porous-Surface (SLIPS) for wind turbine icing mitigation. Renew. Energy 2020, 162, 2344–2360. [Google Scholar] [CrossRef]
- Wang, Y.Y.; Jiang, X.L. Design research and experimental verification of the electro-Impulse de-Icing system for wind turbine blades in the xuefeng mountain natural icing station. IEEE Access 2020, 8, 28915–28924. [Google Scholar] [CrossRef]
- Habibi, H.; Cheng, L.; Zheng, H.T.; Kappators, V.; Selcuk, C.; Gan, T.H. A dual de-icing system for wind turbine blades combining high-power ultrasonic guided waves and low-frequency forced vibrations. Renew. Energy 2015, 83, 859–870. [Google Scholar] [CrossRef]
- Yin, C.B.; Zhang, Z.D.; Wang, Z.J.; Gao, H. Numerical simulation and experimental validation of ultrasonic de-icing system for wind turbine blade. Appl. Acoust. 2016, 114, 19–26. [Google Scholar] [CrossRef]
- Daniliuk, V.; Xu, Y.M.; Liu, R.B.; He, T.P.; Wang, X. Ultrasonic de-icing of wind turbine blades: Performance comparison of perspective transducers. Renew. Energy 2020, 145, 2005–2018. [Google Scholar] [CrossRef]
- Fakorede, O.; Feger, Z.; Ibrahim, H.; Ilinca, A.; Perron, J.; Masson, C. Ice protection systems for wind turbines in cold climate: Characteristics, comparisons and analysis. Renew. Sustain. Energy Rev. 2016, 65, 662–675. [Google Scholar] [CrossRef]
- Shu, L.C.; Qiu, G.; Hu, Q.; Jiang, X.L.; McClure, G.; Yang, H. Numerical and field experimental investigation of wind turbine dynamic de-icing process. J. Wind Eng. Ind. Aerodyn. 2018, 175, 90–99. [Google Scholar] [CrossRef]
- Shu, L.C.; Qiu, G.; Hu, Q.; Jiang, X.L.; McClure, G.; Liu, Y.Q. Numerical and experimental investigation of threshold de-icing heat flux of wind turbine. J. Wind Eng. Ind. Aerodyn. 2018, 174, 296–302. [Google Scholar] [CrossRef]
- Xu, Z.; Zhang, T.; Li, X.J.; Li, Y. Effects of ambient temperature and wind speed on icing characteristics and anti-icing energy demand of a blade airfoil for wind turbine. Renew. Energy 2023, 217, 119135. [Google Scholar] [CrossRef]
- Roberge, P.; Lemay, J.; Ruel, J.; Begin-Drolet, A. Field analysis, modeling and characterization of wind turbine hot air ice protection systems. Cold Reg. Sci. Technol. 2019, 163, 19–26. [Google Scholar] [CrossRef]
- Xu, B.; Lu, F.; Song, G.B. Experimental study on anti-icing and deicing for model wind turbine blades with continuous carbon fiber sheets. J. Cold Reg. Eng. 2018, 32, 04017024. [Google Scholar] [CrossRef]
- Stoyanov, D.B.; Nixon, J.D.; Sarlak, H. Analysis of derating and anti-icing strategies for wind turbines in cold climates. Appl. Energy 2021, 288, 116610. [Google Scholar] [CrossRef]
- Getz, D.; Palacios, J. Design procedures and experimental verification of an electro-thermal deicing system for wind turbines. Wind Energy Sci. 2021, 6, 1291–1309. [Google Scholar] [CrossRef]
- Hann, R.; Enache, A.; MC, N. Experimental heat loads for electrothermal anti-icing and de-icing on UAVs. Aerospace 2021, 8, 83. [Google Scholar] [CrossRef]
- Fakorede, O.; Ibrahim, H.; Ilinca, A.; Perron, J. Experimental investigation of power requirements for wind turbines electrothermal anti-icing systems. In Wind Turbines-Design, Control and Applications; IntechOpen Limited: London, UK, 2016. [Google Scholar]
- Moffat, R.J. Describing the uncertainties in experimental results. Exp. Therm. Fluid Sci. 1988, 1, 3–17. [Google Scholar] [CrossRef]


| Outer Layer Material | Heating Wires | Dimension | Rated Voltage | Rated Power |
|---|---|---|---|---|
| Polyimide | Metal alloy | 49 mm × 19 mm | 12 V | 20 W |
| Wind Tunnel Temperature Tc/(°C) | LWC (g/m3) | MVD (μm) | Wind Speed U/(m/s) | Time of Ice Accretion tδ/(min) | Heat Flux q/(kW/m2) |
|---|---|---|---|---|---|
| −16 | 0.5–1.5 | 66 | 5 | 1 | 6/7/8/9/10/12/14 |
| 5 | 6/7/8/9/10/12/14 | ||||
| 7 | 6/7/8/9/10/12/14 | ||||
| 10 | 1 | 8/9/10/11/12/14/16 | |||
| 3 | 8/9/10/11/12/14/16 | ||||
| 5 | 8/9/10/11/12/14/16 | ||||
| 15 | 1 | 10/11/12/13/14/16/18 | |||
| 3 | 10/11/12/13/14/16/18 | ||||
| 5 | 10/11/12/13/14/16/18 |
| Wind Speed U/(m/s) | Time of Ice Accretion tδ/(min) | Heat Flux q/(kW/m2) | De-Icing Pattern |
|---|---|---|---|
| 5 | 1 | 6 | I |
| 7 | I | ||
| 8 | I | ||
| 9 | I | ||
| 10 | I | ||
| 12 | I | ||
| 14 | I | ||
| 3 | 6 | II | |
| 7 | II | ||
| 8 | II | ||
| 9 | II | ||
| 10 | II | ||
| 12 | II | ||
| 14 | II | ||
| 7 | 6 | II | |
| 7 | II | ||
| 8 | II | ||
| 9 | II | ||
| 10 | II | ||
| 12 | II | ||
| 14 | II | ||
| 10 | 1 | 8 | I |
| 9 | I | ||
| 10 | I | ||
| 11 | I | ||
| 12 | I | ||
| 14 | I | ||
| 16 | I | ||
| 3 | 8 | × | |
| 9 | I | ||
| 10 | II | ||
| 11 | IV | ||
| 12 | IV | ||
| 14 | IV | ||
| 16 | IV | ||
| 5 | 8 | × | |
| 9 | IV | ||
| 10 | IV | ||
| 11 | IV | ||
| 12 | IV | ||
| 14 | IV | ||
| 16 | IV | ||
| 15 | 1 | 10 | I |
| 11 | I | ||
| 12 | I | ||
| 13 | I | ||
| 14 | I | ||
| 16 | I | ||
| 18 | I | ||
| 3 | 10 | I | |
| 11 | I | ||
| 12 | I | ||
| 13 | IV | ||
| 14 | III | ||
| 16 | III | ||
| 18 | III | ||
| 5 | 10 | × | |
| 11 | × | ||
| 12 | × | ||
| 13 | IV | ||
| 14 | IV | ||
| 16 | IV | ||
| 18 | IV |
Disclaimer/Publisher’s Note: The statements, opinions and data contained in all publications are solely those of the individual author(s) and contributor(s) and not of MDPI and/or the editor(s). MDPI and/or the editor(s) disclaim responsibility for any injury to people or property resulting from any ideas, methods, instructions or products referred to in the content. |
© 2024 by the authors. Licensee MDPI, Basel, Switzerland. This article is an open access article distributed under the terms and conditions of the Creative Commons Attribution (CC BY) license (https://creativecommons.org/licenses/by/4.0/).
Share and Cite
Li, X.; Chi, H.; Li, Y.; Xu, Z.; Guo, W.; Feng, F. An Experimental Study on Blade Surface De-Icing Characteristics for Wind Turbines in Rime Ice Condition by Electro-Thermal Heating. Coatings 2024, 14, 94. https://doi.org/10.3390/coatings14010094
Li X, Chi H, Li Y, Xu Z, Guo W, Feng F. An Experimental Study on Blade Surface De-Icing Characteristics for Wind Turbines in Rime Ice Condition by Electro-Thermal Heating. Coatings. 2024; 14(1):94. https://doi.org/10.3390/coatings14010094
Chicago/Turabian StyleLi, Xiaojuan, Haodong Chi, Yan Li, Zhi Xu, Wenfeng Guo, and Fang Feng. 2024. "An Experimental Study on Blade Surface De-Icing Characteristics for Wind Turbines in Rime Ice Condition by Electro-Thermal Heating" Coatings 14, no. 1: 94. https://doi.org/10.3390/coatings14010094