Article

Effect of Smart Aggregate Size on Mesostructure and Mechanical Properties of Asphalt Mixtures

1
School of Highway, Chang’an University, Xi’an 710064, China
2
School of Business, Fuyang Normal University, Fuyang 236041, China
3
School of Civil Engineering, Chang’an University, Xi’an 710064, China
4
Shaanxi Provincial Transport Planning Design and Research Institute Co., Ltd., Xi’an 710075, China
*
Authors to whom correspondence should be addressed.
Coatings 2024, 14(10), 1238; https://doi.org/10.3390/coatings14101238
Submission received: 21 August 2024 / Revised: 23 September 2024 / Accepted: 24 September 2024 / Published: 26 September 2024
(This article belongs to the Special Issue Synthesis and Application of Functional Polymer Coatings)

Abstract

:
In recent years, smart aggregates have emerged as a promising tool for monitoring the movement of and changes in particles inside asphalt mixtures. However, there remain significant differences between smart aggregates and real rock aggregates, particularly the lack of an asphalt coating on the surface of smart aggregates. Currently, the research on the impact of smart aggregates themselves on the structure and properties of asphalt mixtures is lacking. Therefore, this study focuses on the influence of smart aggregate size on the mesostructure and mechanical properties of asphalt mixtures. Firstly, based on laboratory tests and the discrete element method (DEM), discrete element models of asphalt mixture specimens containing smart aggregates of various sizes were constructed, followed by simulated compaction tests. The effects of smart aggregate size on the mesostructure of asphalt mixture voids were then analyzed. Lastly, in this study, the changes in the dynamic modulus of asphalt mixtures were explored with increasing smart aggregate size and the underlying mechanisms. The results indicate that as the size of smart aggregates increases, the average void ratio of the asphalt mixture specimens decreases, but the heterogeneity of the void distribution increases. Additionally, with the increase in smart aggregate size, the dynamic modulus of the mixture specimens decreases. Further strain analysis of the specimens suggests that the increase in cross-sectional deformation is the primary cause of the reduction in modulus.

1. Introduction

Due to technological limitations, researchers have faced significant challenges in deeply observing and analyzing the changes in internal components and the formation processes of asphalt mixture structures [1,2]. However, the development and application of smart aggregates have provided a promising approach to monitor the movement of particles and changes in the structure inside asphalt mixtures [3]. Smart aggregates typically consist of two main components, an internal sensing module and an external shell. These aggregates can be embedded in the pavement structure in the form of aggregate particles, minimizing their impact on the pavement integrity. By integrating sensors such as accelerometers, gyroscopes, and strain gauges within the internal sensing module, smart aggregates are capable of real-time monitoring and transmitting information about their movement and state. This capability aids in observing the movement of particles and the changes in structure inside the asphalt mixture.
In early studies, smart aggregates were first applied to monitor the movement patterns of and changes in ballast gravel under train loads [4,5,6]. Liu et al. [7,8], in 2016, was the first to utilize smart aggregates in a railway ballast test box, investigating the interlocking characteristics of ballast particles under cyclic loading from the perspective of the movement and rotation patterns of individual particles. This preliminary study validated the effectiveness of smart aggregates in monitoring particle movement. In subsequent research [9,10,11], researchers further analyzed the movement of and orientation changes in ballast particles under dry and wet conditions, especially in cases of ballast pumping. The results demonstrated that the rotational information of smart aggregate particles can serve as a reference indicator for controlling compaction quality. Smart aggregates have shown significant advantages and potential in studying the movement of granular materials.
However, asphalt mixtures are different from graded aggregates in that the asphalt binder is a temperature-sensitive material [12,13]. Under the high-temperature environment of the mixing and compaction process in the field, the coarse, fine aggregates and asphalt binder in the asphalt mixtures are mixed together in a viscous and fluid state, which significantly reduces the survival rate of the smart aggregates and the stability of the transport. Therefore, the application of smart aggregates in the monitoring of compaction and properties of asphalt mixtures presents additional challenges. Wang et al. [14,15] investigated the feedback information of smart aggregates under the action of different rollers and concluded that the research results could provide a basis for intelligent compaction. Dan [16] investigated the relationship between the internal stress state and compaction state of mixtures under different maximum nominal particle size and gradation conditions using smart aggregates, and found that aggregate characteristics significantly affected the initial and final compaction state of mixtures, with coarsely graded mixtures being easier to compact in the early stage, but more difficult to compact in the late stage. In addition to this, Cheng [17] evaluated the compaction characteristics of stone mastic asphalt (SMA) mixtures with smart aggregates and obtained the relationship between the stress, angular velocity, and acceleration of smart aggregates and the locking point of the compacted structure of the mixtures. Shan [18] studied the compaction of asphalt mixtures by coupling smart aggregate and finite element methods and established a relationship between the peak acceleration in the x and z axis and the modulus of the mixtures. Wang [19] introduced smart aggregates in the study of the compaction characteristics of cold recycled asphalt mixtures and tried to explain the compaction workability, skeletal strength, and mixture stability of the cold recycled asphalt with the monitored pressures, accelerations and angular velocities. Besides monitoring the compaction process, the perception output signals provide data support for sustainable road design such as photovoltaic roads [20]. Zhang et al. [21,22] also attempted to monitor the speed of the vehicles during the service process of the pavement by using the triaxial acceleration, angular velocity, and stress data obtained from the smart aggregates in conjunction with the in situ and full-scale accelerated loading tests.
Although smart aggregates have demonstrated significant value in the compaction and service life monitoring of asphalt pavements, there are differences in the adhesion properties between smart aggregates and the asphalt binder and between rock aggregates and the asphalt binder, resulting in different surface coatings. Studies have shown that differences in adhesion between aggregates and asphalt binders can have a significant impact on the structure and properties of asphalt mixtures [23]. Currently, the glass-fiber-reinforced nylon commonly used in smart aggregates exhibits poor adhesion to the asphalt binder. The weak adhesion between the aggregate and the asphalt may result in the internal structure being more prone to deformation and cracking [24,25]. Dan [26] also pointed out that the addition of smart aggregates will inevitably affect the properties of the mixture, and how to ensure the survival rate of smart aggregates and the efficiency of real-time monitoring while minimizing the impact is still a problem to be solved.
The above studies indicate that smart aggregates can be fabricated using 3D printing technology to create encapsulation shells that match the shape of real aggregates. These smart aggregates can be applied to the compaction or property testing processes of asphalt mixtures to minimize their impact on the pavement structure. The triaxial acceleration, angular velocity, and orientation data obtained from smart aggregates can be correlated with the movement state of internal aggregates, compaction state, vehicle movement, and pavement modulus. However, despite many studies on smart aggregate output signals, there are fewer studies on the effects of smart aggregates themselves on the structural and mechanical properties of asphalt mixtures. Therefore, this study aims to analyze the effect of smart aggregate size on the internal structure and mechanical properties of asphalt mixtures. First, asphalt mixture specimens were molded in the laboratory, and dynamic modulus tests were conducted to establish and validate the discrete element model of asphalt mixtures. Subsequently, the discrete element models of asphalt mixture specimens with three different sizes of smart aggregates were established, and the compaction process of the specimens was simulated. The effect of the size of smart aggregates on the mesostructure of asphalt mixtures was analyzed. Finally, dynamic modulus simulation tests and internal strain analysis were conducted to investigate the effect of smart aggregate size on the mechanical properties of asphalt mixtures and the underlying mechanisms.

2. Materials and Methods

2.1. Asphalt and Asphalt Mixture

2.1.1. Conventional Properties of Asphalt Binders

The asphalt used in this study is A-70# matrix asphalt produced by the S-OIL Company and the conventional properties of the asphalt are listed in Table 1.

2.1.2. Gradation and Basic Properties of Asphalt Mixtures

The type of asphalt mixture is AC-13 (asphalt concrete with a nominal maximum aggregate size of 13.2 mm), with both coarse and fine aggregates composed of basalt, and mineral filler consisting of limestone powder. According to ASTM D2172 [35], the asphalt content is 4.9%. The final composite gradation is shown in Figure 1, with the upper and lower limits based on the Chinese standard JTG F40-2004 [36]. The basic volumetric parameters and properties of the asphalt mixture are presented in Table 2.

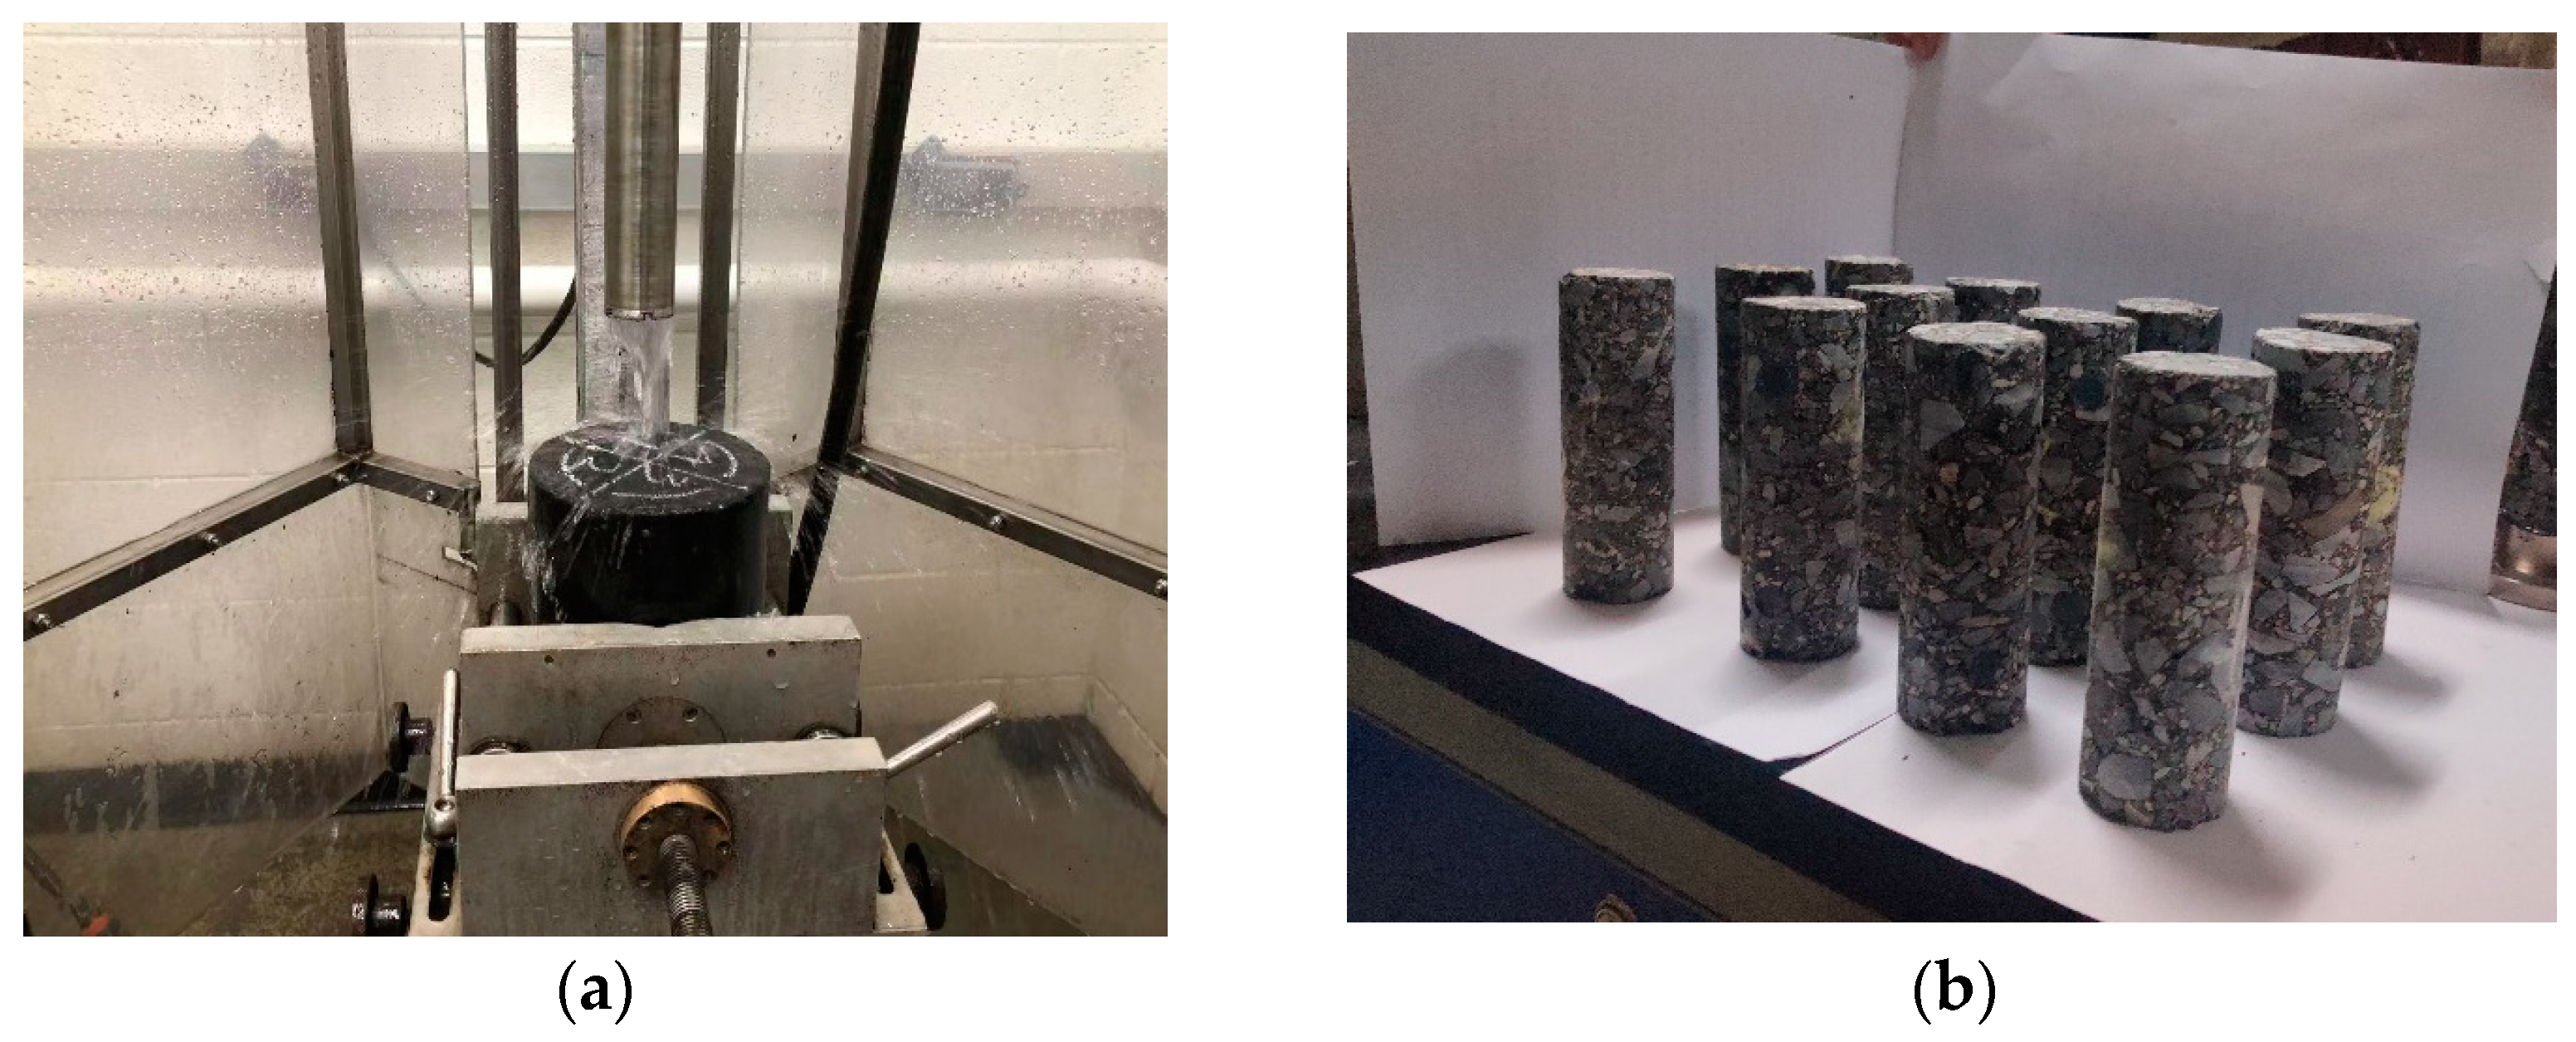
2.1.3. Dynamic Modulus Test of Asphalt Mixtures

Asphalt mixture specimens for dynamic modulus testing were prepared with a gyratory compactor (AFG2CS) (PINE, Xi’an, China), according to specification AASHTO T312 [37]. In order to reduce the time required for subsequent discrete element simulations, in this study, small-sized asphalt mixture specimens were prepared according to specification AASHTO PP 99 [38]. After obtaining asphalt mixture specimens with a radius of 150 mm and a height of 170 mm, as shown in Figure 2, four small-size asphalt mixture specimens were drilled from each larger asphalt mixture specimen, and then the ends were cut and smoothed to obtain asphalt mixture specimens with a diameter of 38 mm and a height of 100 mm.
After obtaining the small-sized specimens, dynamic modulus testing was conducted on the asphalt mixture specimens according to the AASHTO TP 132 [39]. A deviatoric half-sine wave axial compressive stress was applied to the specimens. The dynamic modulus tests were performed at temperatures of 4 °C, 20 °C, and 40 °C, with frequencies of 25.0, 10.0, 5.0, 1.0, and 0.1 Hz, following a sequence from high to low frequency. The interval between tests at different frequencies was 2 minutes.

2.2. Establishment of Discrete Element Model for Asphalt Mixture

Researchers have shown that the discrete element method has unique advantages in studying asphalt mixtures composed of non-uniform media [40,41], especially when combined with X-ray–computed tomography (X-CT) (YXLON, Xi’an, China) scanning techniques to construct coarse aggregates with complex shapes [42]. Therefore, in this paper, the particle flow code (PFC) software 5.0, combined with X-CT technology, was used to construct discrete metamodels of asphalt mixtures to analyze the effect of smart aggregate size. PFC is a discrete element modeling software that simulates the behavior of granular materials by creating individual or large numbers of particles with finite size and mass, and modeling their interactions. It has been widely used in research across fields such as geotechnical engineering, material science, and biomedical engineering [43]. Firstly, a compaction mold for the specimen was built using the PFC basic component “Wall”, and then coarse aggregates, smart aggregates, and mortar particles were placed into the mold based on the volumetric gradation.

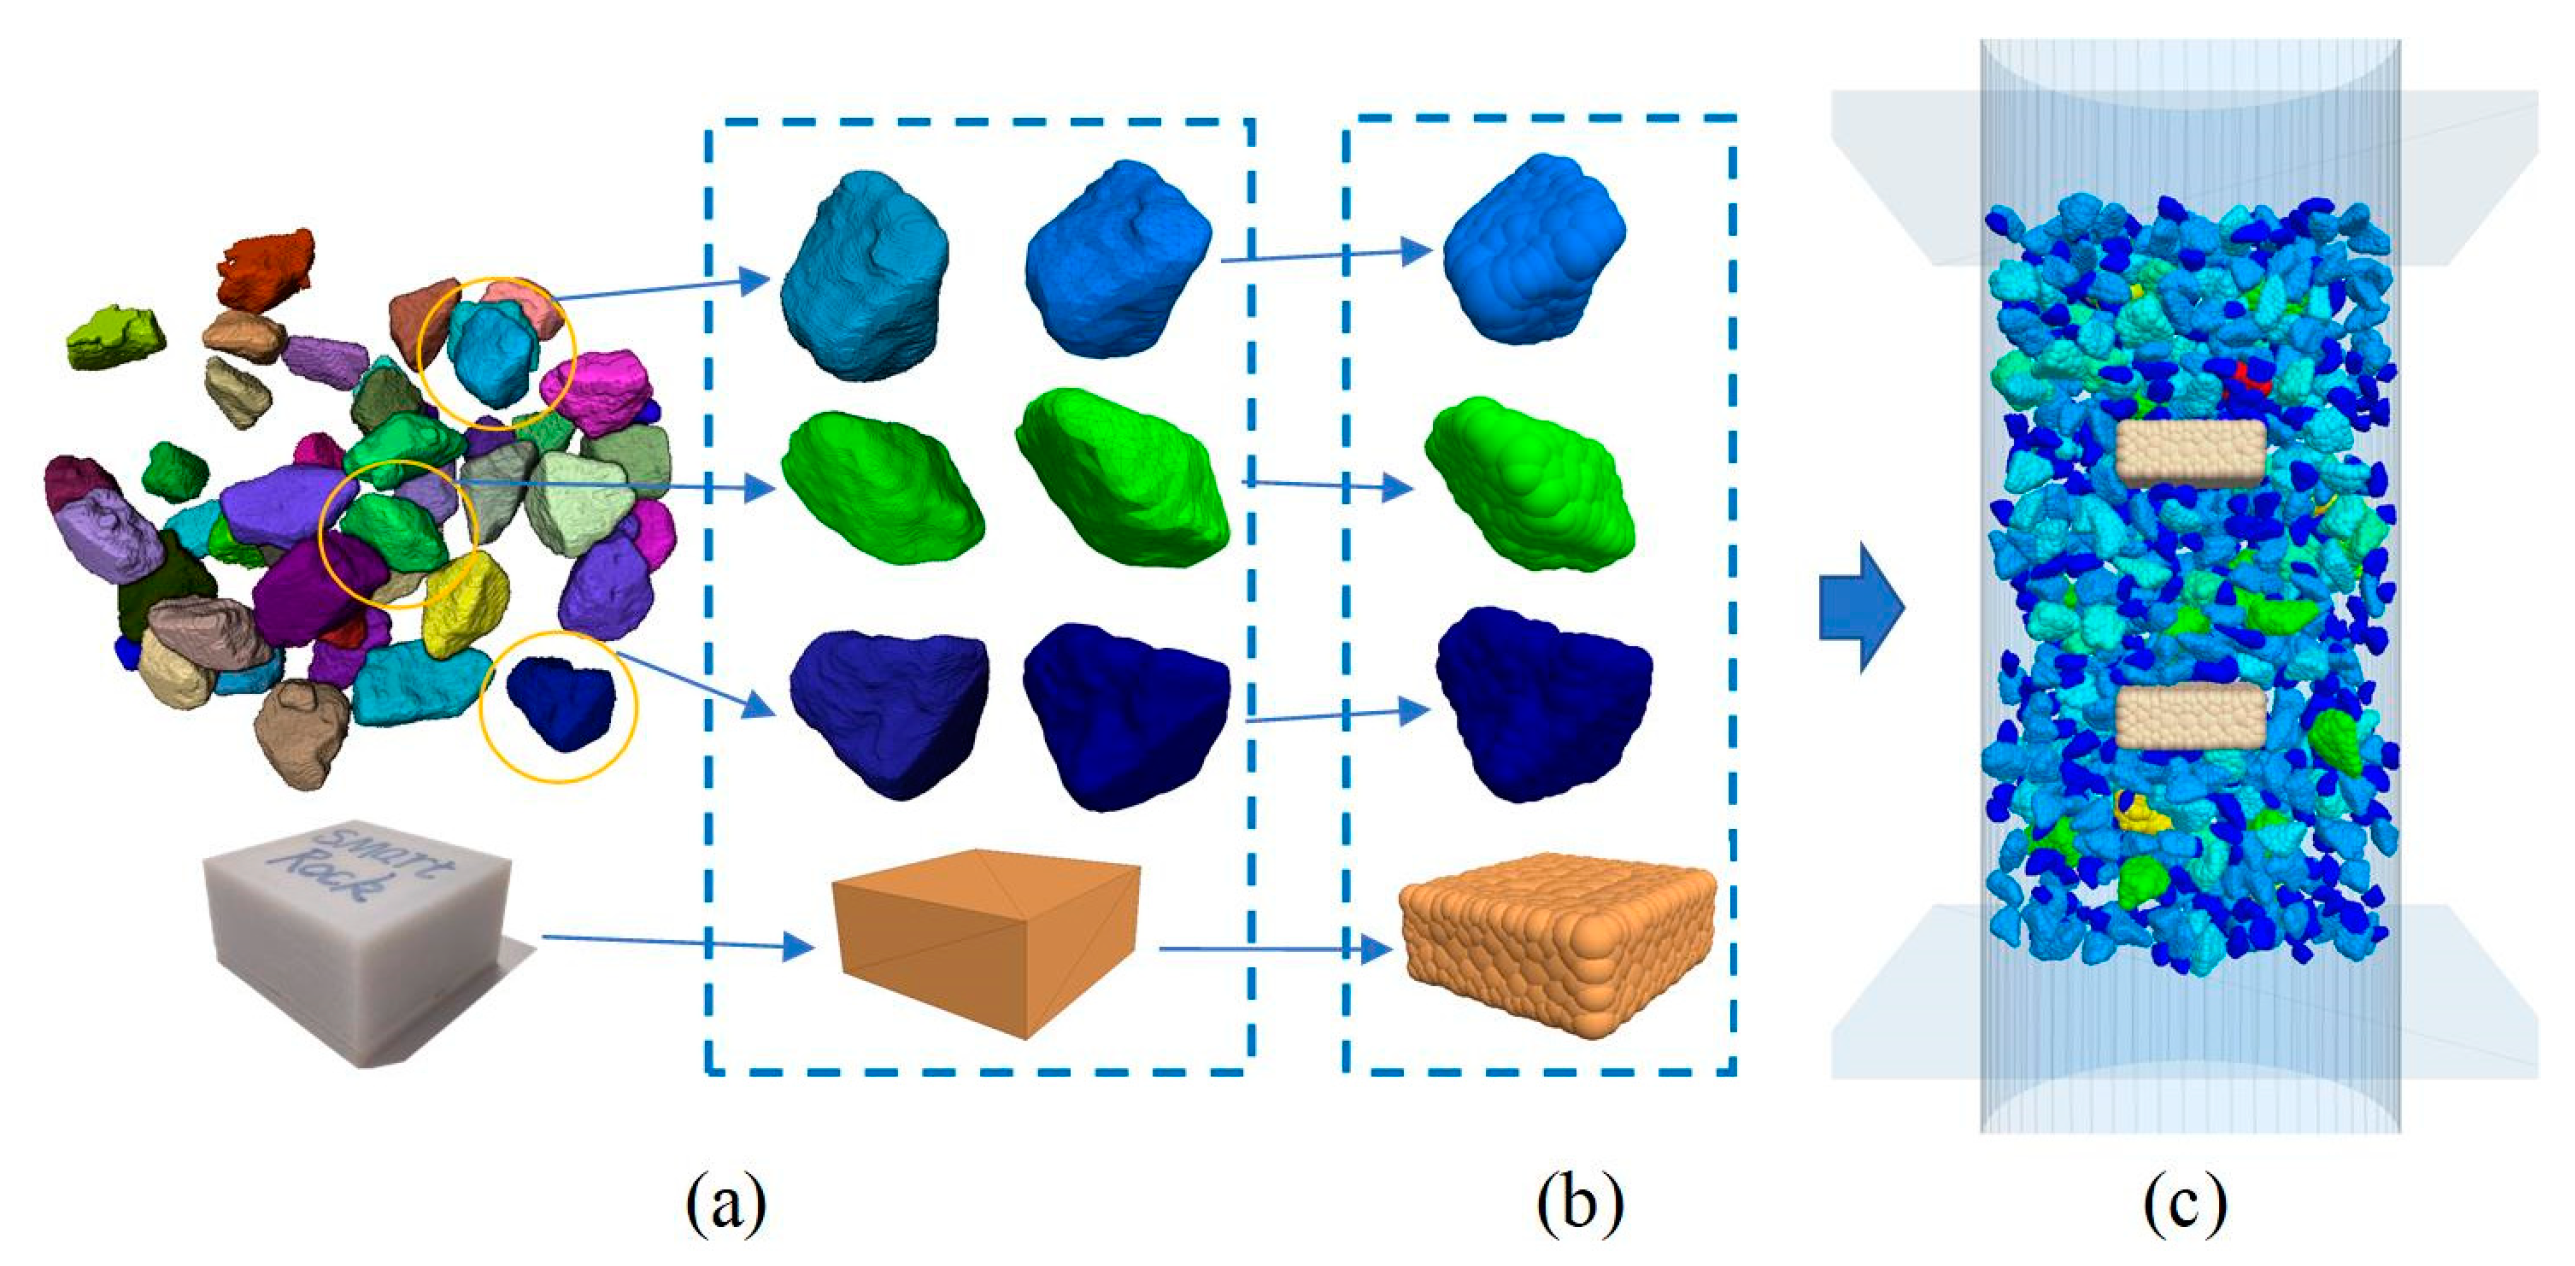
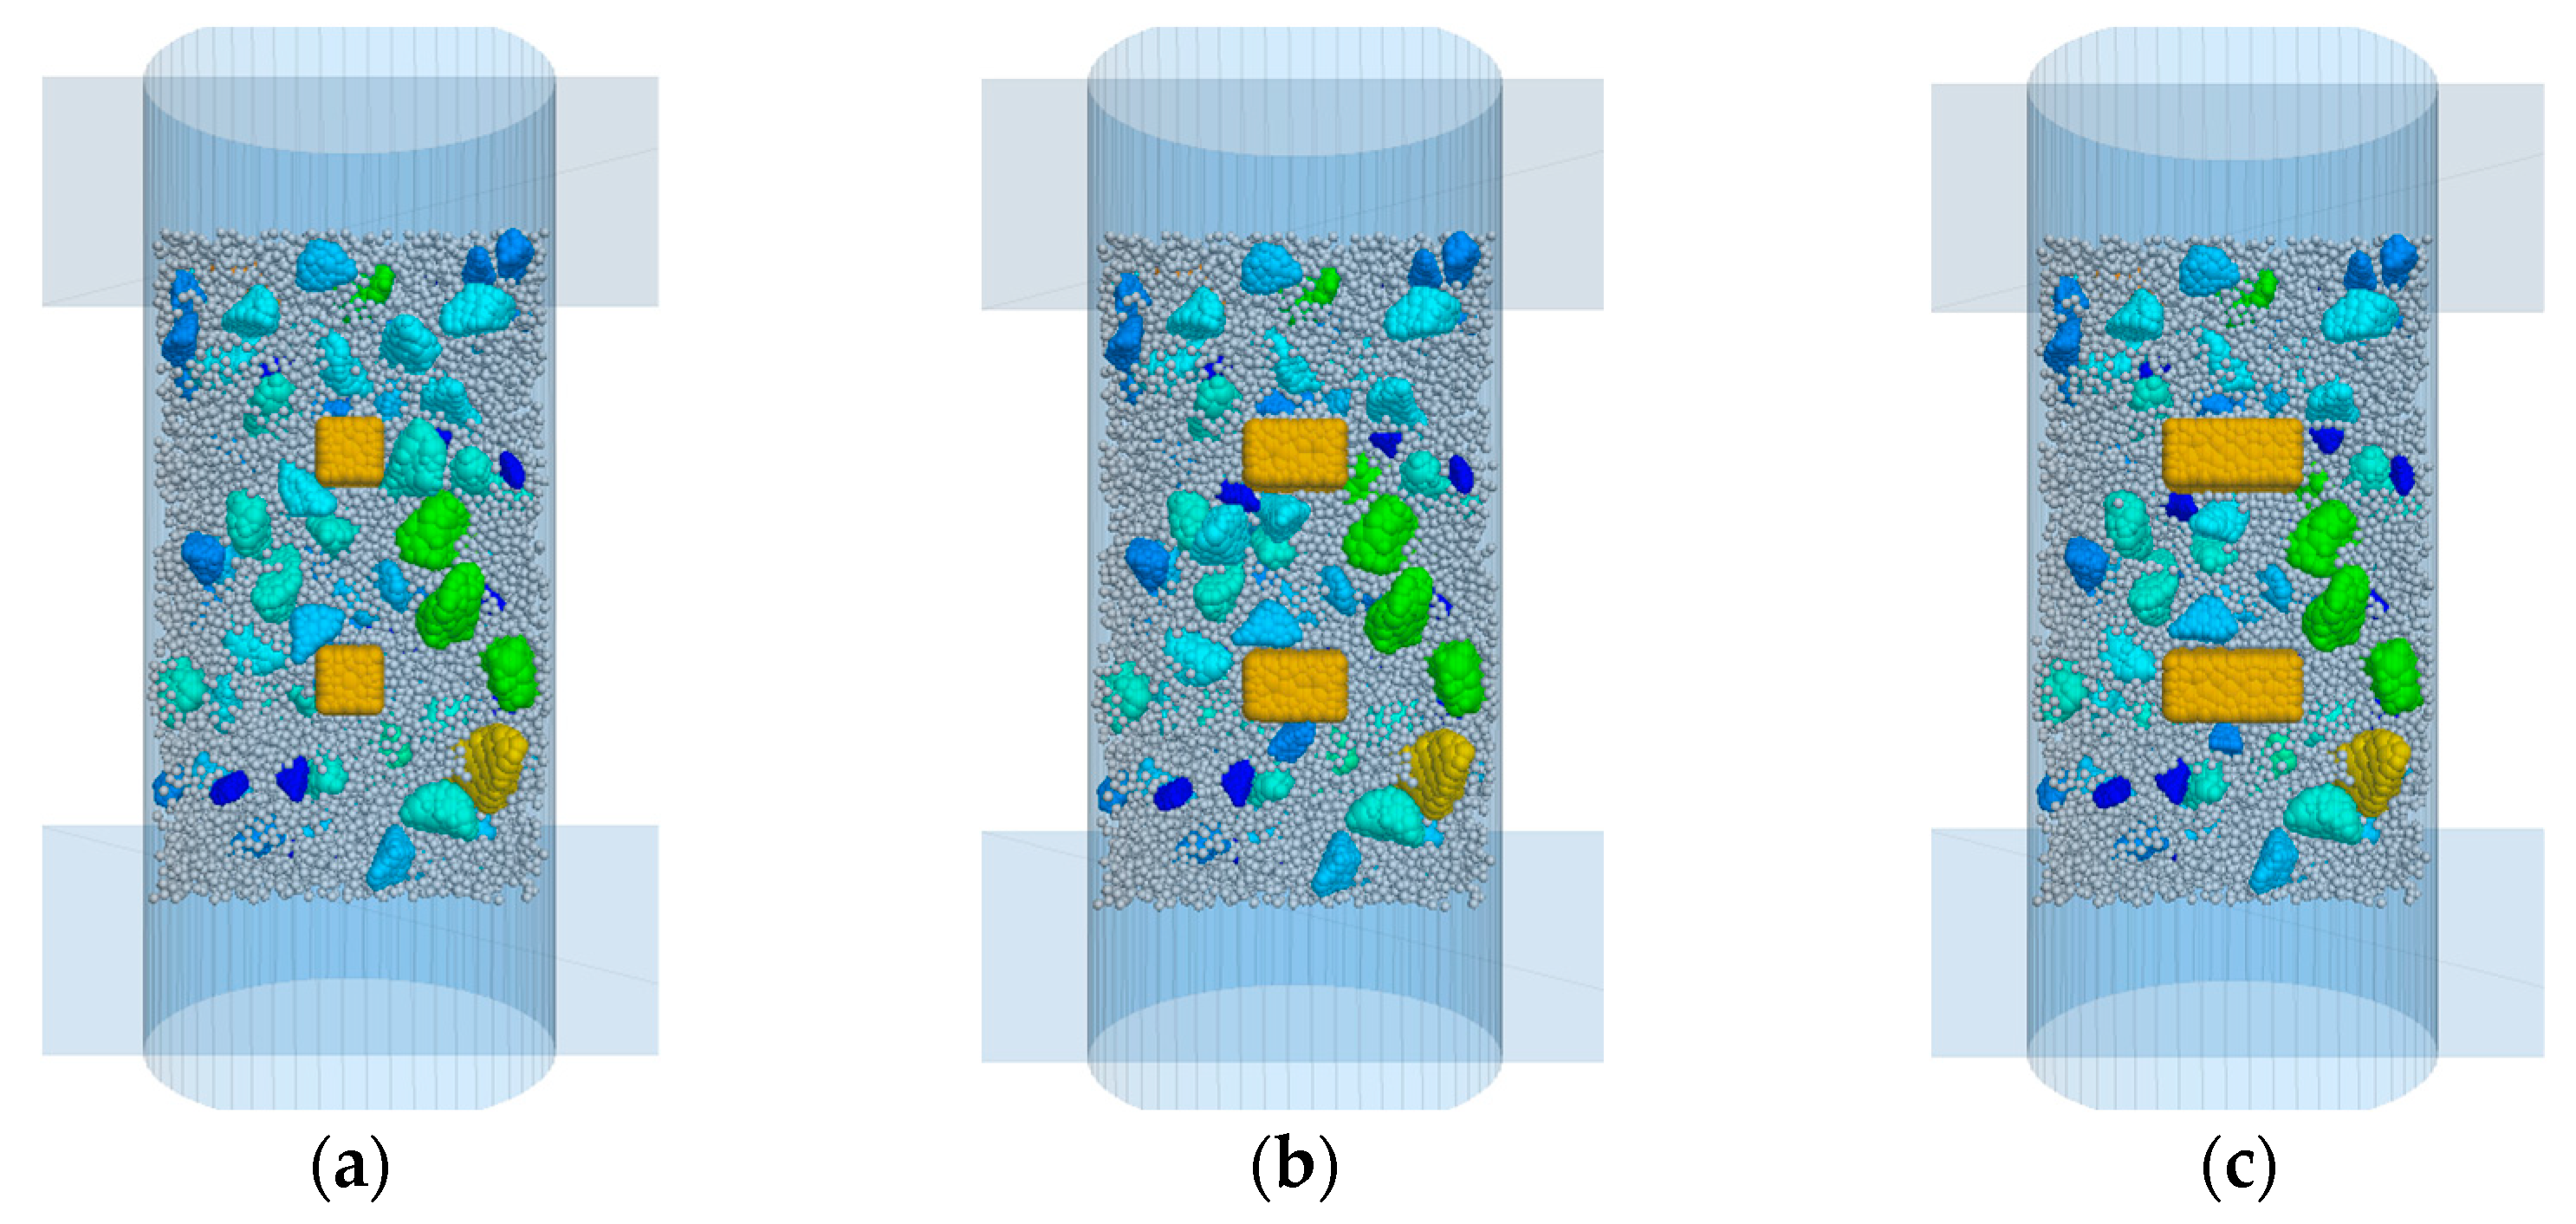
2.2.1. Establishment and Placement of Coarse and Smart Aggregates

As shown in Figure 3a, CT slices of asphalt mixture specimens were first obtained using X-CT scanning technology. These slices were processed using Image J software(1.52p) to reconstruct and extract the aggregate structure within the mixture specimens. The bonded sections of the aggregate structure were then cut, and based on their corresponding volume percentages, 3D models and surface meshes of coarse aggregate particles were generated. The initial surface meshes of the coarse aggregates were highly complex. In this study, 20 particles were randomly selected from each size group, simplifying the surface mesh of each aggregate to approximately 1000–2000 elements, and saved them in STL format. The models and surface meshes of the smart aggregates were created using 3ds Max (2020) software. Subsequently, as shown in Figure 3b, these STL files were imported into the PFC 5.0 software, where “Clump” templates were created for each coarse aggregate, establishing a small sample library for each particle size group. Finally, as shown in Figure 3c, the volume and volume percentage of coarse aggregates were first calculated based on the mass gradation and density of each sieve size aggregate. Subsequently, after deducting the volume of smart aggregates, the “Generate” command was used in the PFC to generate the coarse aggregate “Clump” with the same volume as each sieve size, which was randomly placed into the mold. Finally, the “Clump” of the smart aggregates were placed. At this stage, some of the generated particles exhibited overlap, necessitating a balancing process to separate them. To ensure the position of the smart aggregates remained unchanged, their velocity and angular velocity were locked, and the system was then balanced.

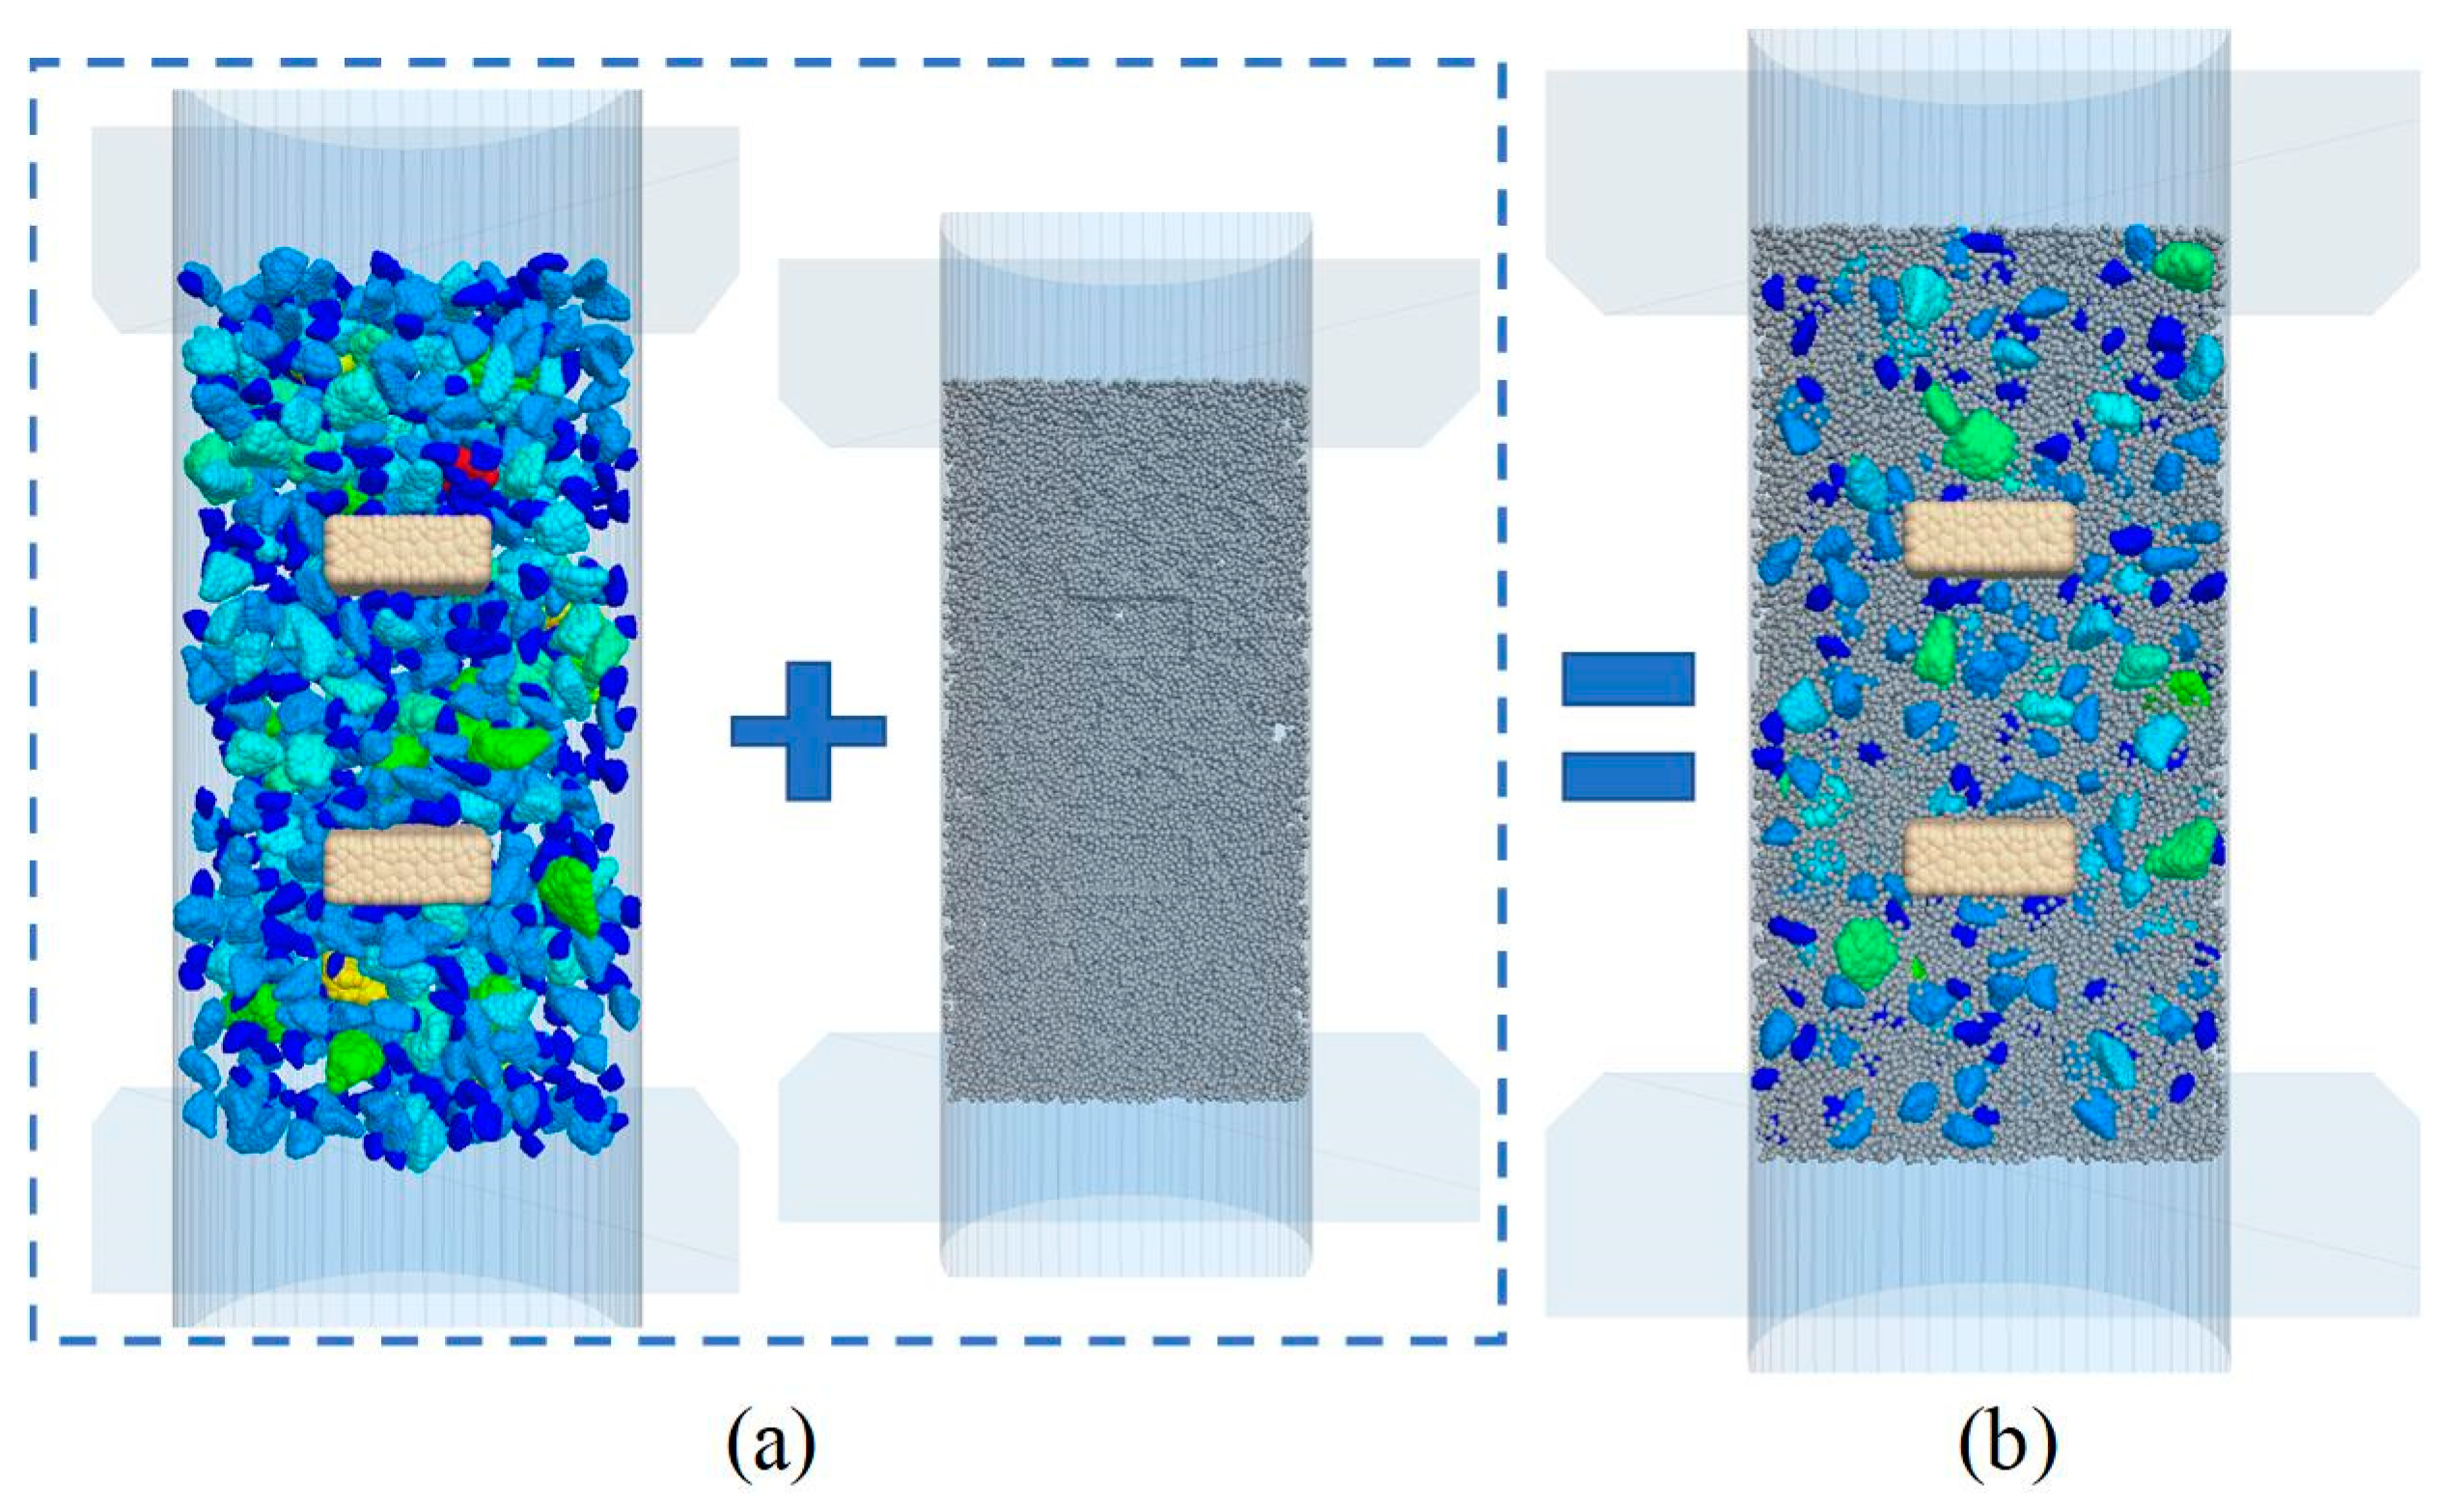
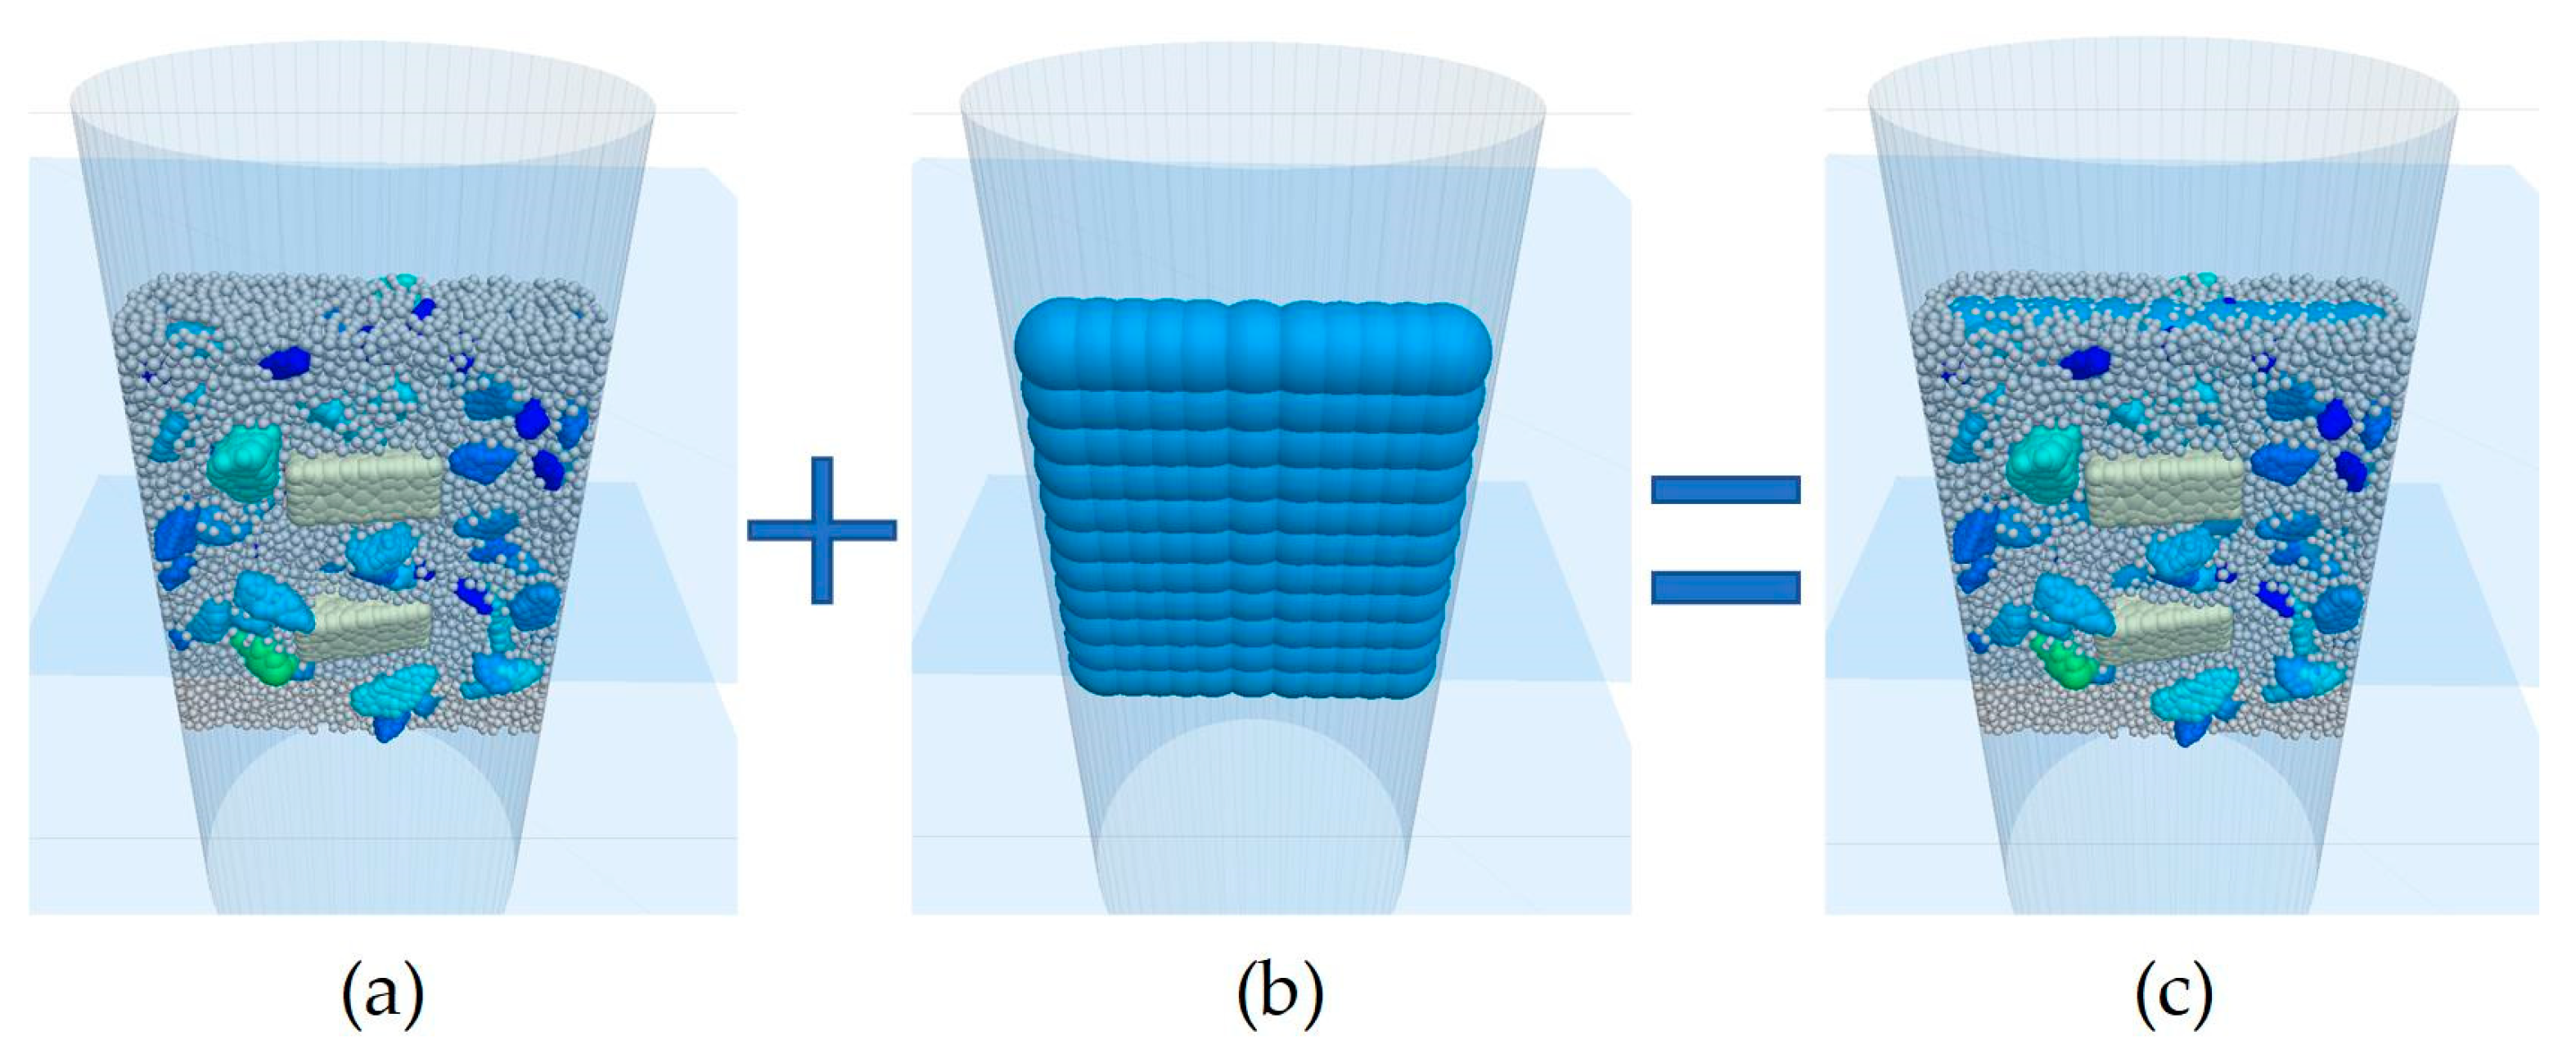
2.2.2. Placement of Asphalt Mortar

In order to improve the simulation efficiency, referring to previous studies [44,45,46], the mixture of fine aggregate with a particle size of 2.36 mm or less and asphalt binder is considered as an incompressible asphalt mortar, and is replaced by balls with a particle size of 2 mm. According to the theory of close-packing of equal-size balls, the maximum volume proportion of the space occupied by the balls in the case of the tightest packing is about π/(3√2) × 100% ≈ 74%. However, this limit corresponds to close-packed face-centered cubic (FCC) and hexagonal close-packed (HCP) crystallites. In comparison, the random close packing (RCP) of spheres is more suitable for predicting the compaction of asphalt mixtures in the discrete element model. However, due to the lack of a unique definition of randomness or disorder, predicting the random packing density of spheres remains challenging [47]. Some researchers have proposed analytical and closed-form solutions [48,49,50]. In general, both experimental testing and computer simulations suggest that the random close-packed limit is about 63–65% [51,52], which is approximately 10% lower than the maximum packing value. Subject to this limit, the minimum void proportion of the DEM model is always larger than that of the real specimen. Nevertheless, the force interaction and transfer between these ball particles are continuous. To achieve the unity of efficiency and accuracy in the DEM simulation, this study refers to the research conclusions of Liu [53], as follows:
(1)
Replacing the mortar with equal volumes of equal-diameter ball particles increases the overall volume of the mortar.
(2)
Using a diameter reduction factor (DRF) minimizes the overall volume-increasing effect of replacing the asphalt mortar with ball particles.
(3)
Considering the multiple volumetric indicators and contact characteristics of the mix, including particle overlap ratio, number of ball–wall contacts, and average wall stress, the DRF is recommended to be in the range of 0.8 to 0.86 in terms of both computational efficiency and accuracy.
Based on the above conclusions, in this study, a value of 0.8 was chosen for the DRF and used balls with a particle size of 1.6 mm (2.0 mm × 0.8). As shown in Figure 4a, the volume percentage corresponding to the asphalt mortar was obtained through calculation, and combined with the DRF, and the mortar particles were randomly placed within the mold of the specimen. Subsequently, as shown in Figure 4b, after adding mortar particles to a model where coarse aggregate particles and smart aggregates have been placed, there will be a large amount of overlap between the particles and equilibration will need to continue. After equilibrium is reached, the velocity and angular velocity of the smart aggregate are unlocked, and then subsequent simulation tests are carried out.

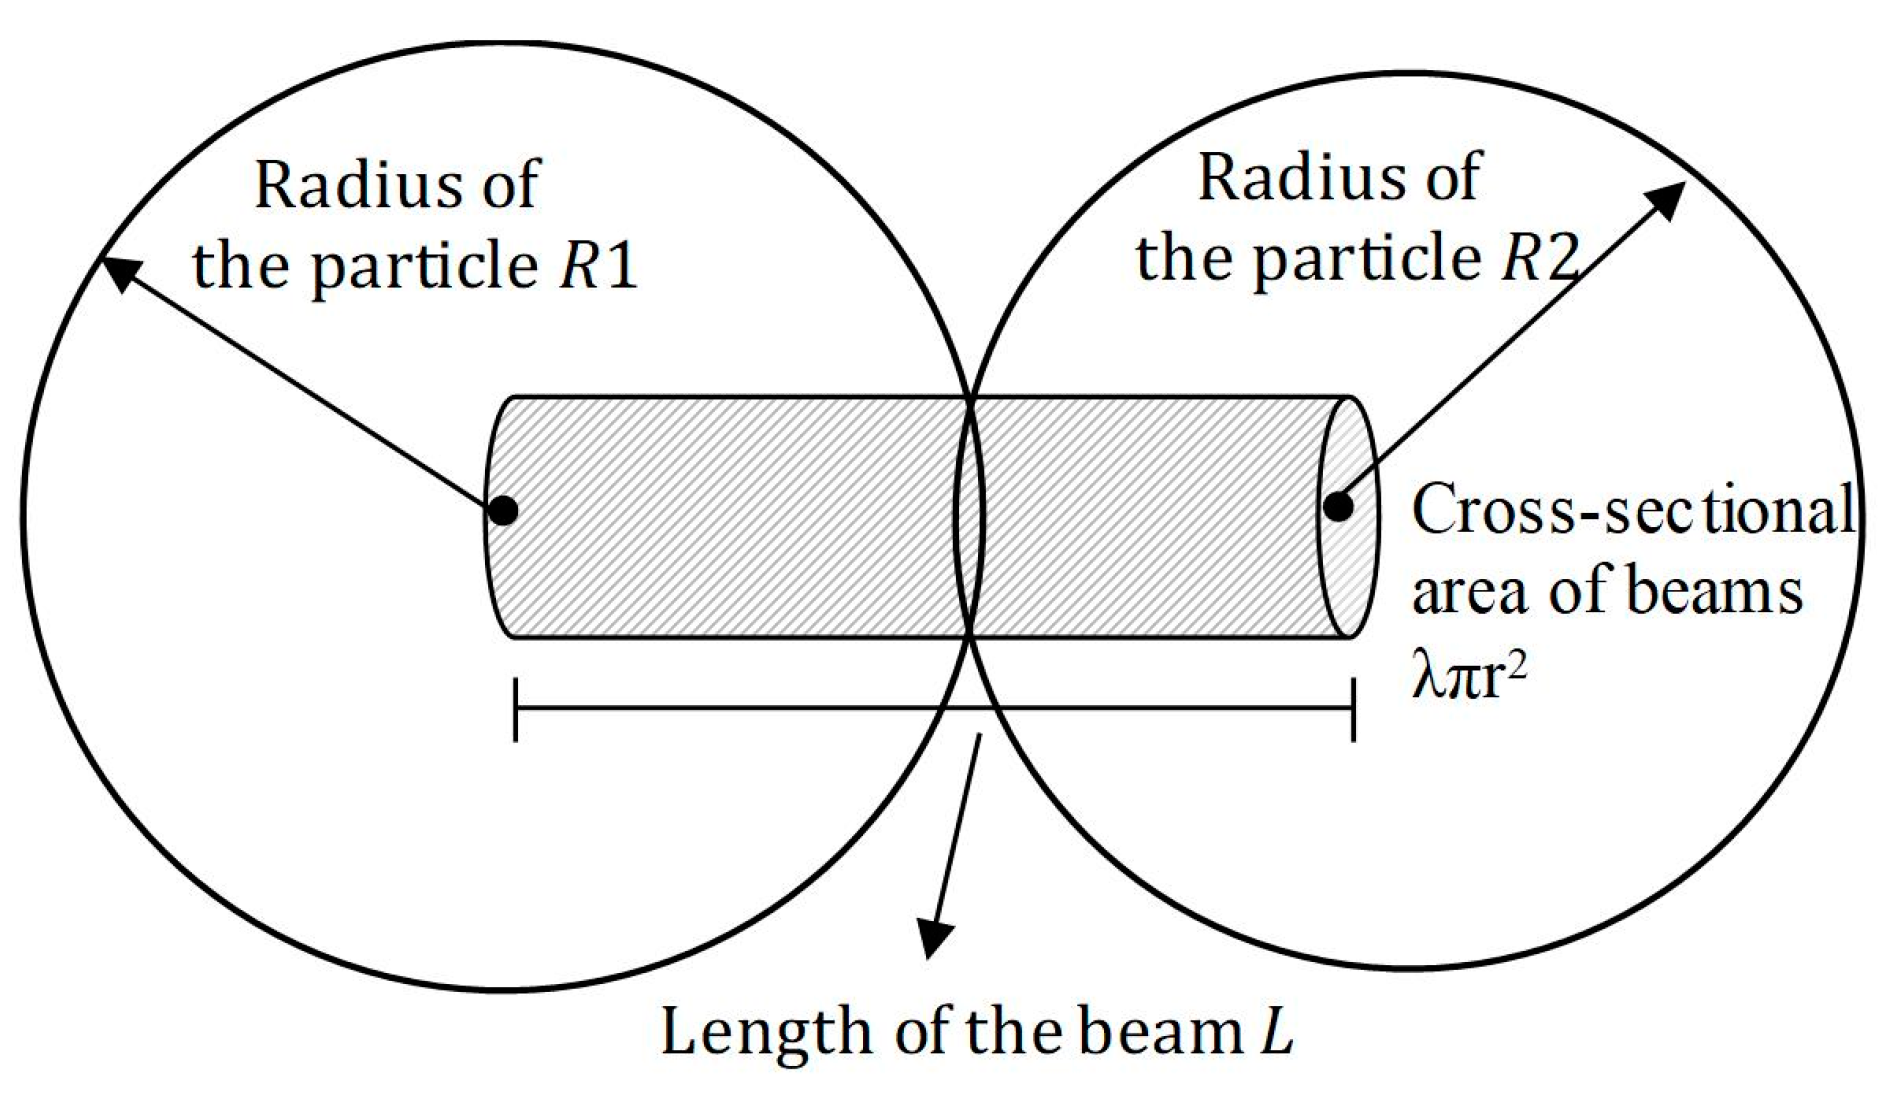
2.2.3. Conversion of Macro-Micro Parameters in Discrete Element Models

(1) Conversion of macro–micro parameters for aggregate particle contacts
In general, the micro-parameters of aggregates are difficult to obtain directly through testing. It is necessary first to acquire the macro-parameters of the material, and then use a macro–micro parameter conversion model to convert these macro-parameters into micro-parameters. When establishing the macro–micro parameter conversion model, the contact model between rigid particles is typically simplified to an elastic beam model, with endpoints at the centroids of the two particles [54]. L represents the length of the beam, and r is the equivalent contact particle diameter. The cross-sectional area A of the elastic beam and the normal stiffness Kn of the particles are calculated according to Equations (1) and (2), respectively. In these equations, E denotes the elastic modulus of the aggregates.
A = π r 2
K n = E A L = E π r 2 2 r E π r 2 r = E π r 2 , Particle particle E π r , Particle wall
The tangential modulus G and tangential stiffness Ks of the particles are calculated according to Equations (3) and (4), respectively. In these equations, v represents the Poisson ratio.
E = 2 G 1 + ν
K s = E π r 4 1 + ν ,   Particle particle E π r 2 1 + ν ,   Particle wall
(2) Conversion of macro–micro parameters for asphalt mortar particle contacts
In the conversion of macro–micro parameters in the Burgers model, this study draws on the research findings of Liu et al [55] and introduces further improvements. The contact between two mortar particles is simplified to a viscoelastic cylindrical beam, as shown in Figure 5. The simplified viscoelastic beam has a length L and r represents the equivalent contact particle diameter.
Since the contact deformation between particles generally occurs within a very small range, much smaller than the particle radius, most studies have assumed that L is approximately equal to 2r. In this study, considering that the contact area between particles is a fixed circular area, it was observed in actual tests that due to the inability of particles to achieve tight packing, the number of contacts between particles and the upper wall, as well as the actual calculated contact area, is less than the cross-sectional area of the upper wall. Therefore, a correction factor λ is introduced before the cross-sectional area A, with the calculation of λ and A given by Equations (5) and (6). The variable Ncon represents the actual number of spheres in contact with the upper wall, and Amold represents the cross-sectional area of the mold.
λ = N c o n π r 2 A m o l d
A = λ π r 2
When the viscoelastic beam is subjected to an axial force, denoted as Fn, the elastic and viscosity parameters of the Maxwell component in the Burgers model of the viscoelastic beam are Knm and Cnm, corresponding to deformations L1 and L2, respectively. For the Kelvin component, the elastic and viscosity parameters are Cnk and Cnk, with the corresponding deformation being L3. The axial force can be expressed in terms of the Burgers model parameters of the beam, as shown in Equation (7).
F n = K n m L 1 = C n m L 2 = K n k L 3 + C n k L 3
Assume that the stress in the viscoelastic beam is σ. The elastic and viscosity parameters of the Maxwell model in the micro-level Burgers model of the beam are Enm and ηnm, corresponding to strains ε1 and ε2, respectively. For the Kelvin component, the elastic and viscosity parameters are Enk and ηnk, with the corresponding strain being ε3. The stress can be expressed in terms of the micro-level Burgers model parameters, as shown in Equation (8). The relationship between deformation and strain in the viscoelastic beam is given by Equation (9).
σ = E n m ε 1 = η n m ε 2 = E n k ε 3 + η n k ε 3
L 1 = ε 1 L · L 2 = ε 2 L · L 3 = ε 3 L
There exists a relationship between the axial force in the Burgers model of the viscoelastic beam and the stress in the micro-level Burgers model of the beam, as shown in Equation (10). Therefore, by substituting Equations (7)–(9) into Equation (10), the relationship between the parameters of the beam Burgers model and the parameters of the micro-level Burgers model can be obtained, as shown in Equations (11)–(13).
F n = σ A
K n m ε 1 L = A E n m ε 1
C n m ε 2 ˙ L = A η n m ε 2 ˙
K n k ε 3 + C n k ε 3 ˙ L = A E n k ε 3 + η n k ε 3 ˙
Therefore, the conversion relationships between the Burgers parameters of the beam and the micro-level Burgers parameters in the normal direction are shown in Equations (14)–(17).
K n m = λ E n m π r 2
C n m = λ η n m π r 2
K n k = λ E n k π r 2
C n k = λ η n k π r 2
Currently, most studies have considered the mortar matrix as an isotropic material. Therefore, by combining the relationship between the elastic modulus E and the shear modulus G, the conversion relationships between the tangential parameters of the beam in the Burgers model and the tangential micro-level parameters can be approximately obtained, as shown in Equations (18)–(21). Here, v represents the Poisson ratio, which is set to 0.25 in this study, based on previous research [56].
K s m = λ E n m π r 4 1 + ν
C s m = λ η n m π r 4 1 + ν
K s k = λ E n k π r 4 1 + ν
C s k = λ η n k π r 4 1 + ν

2.2.4. Compaction of Discrete Element Specimens of Asphalt Mixtures

In this study, DEM models were established of asphalt mixtures incorporating smart aggregates of three different sizes, as follows: 10 mm × 10 mm × 10 mm, 15 mm × 15 mm × 10 mm, and 20 mm × 20 mm × 10 mm, as shown in Figure 6. The smart aggregates were made of glass-fiber-reinforced nylon with an elastic modulus of 3.5 GPa and a density of 1250 g/cm3. The limestone aggregates had an elastic modulus of 55 GPa and a density of 2700 g/cm3. To ensure computational efficiency and accuracy of results, the mold used for the gyratory compaction test was appropriately scaled down. The initial filler mold had a diameter of 90 mm and a height of 100 mm, with the final target compaction height set at 80 mm. The mold dimensions were chosen to be at least three times the size of the smart aggregates to avoid edge effects.
In this study, a dynamic modulus test was first conducted on the asphalt mortar in the laboratory, using the binomial method to determine the shift factors and master curve parameters of the asphalt mortar specimens. Following fitting and calculations, the macroscopic viscoelastic parameters of the asphalt mortar at 140 °C and 0.5 Hz were obtained, as shown in Table 3. Subsequently, in this study, the macro-micro parameter conversion methods and formulas were applied from Section 2.2, in combination with the elastic moduli of the smart and rock aggregates, to derive the micro-contact parameters between the DEM model components during the compaction process.
In this study, the gyratory compaction process was simulated following the AASHTO T312 [37], after the asphalt mixture DEM model reached equilibrium. Initially, the “Wall” elements at the top and bottom of the model are driven downward and upward, respectively, using servo control with a pressure setting of 600 kPa. If the compressive stress on the walls is less than the servo pressure, the walls continue to press inward and move, with the maximum speed limited to 0.01 m/s to prevent instability due to excessive servo speed. Once the walls first reach the servo pressure, the bidirectional servo control on the top and bottom walls is halted, and the cylindrical “Wall” is tilted by 1.16°. The servo function of the top wall is then deactivated, while the servo and stress settings on the bottom wall remain active to continue the compaction process. Simultaneously, the cylindrical “Wall” rotates at a speed of 30 r/min until the target compaction height is achieved.

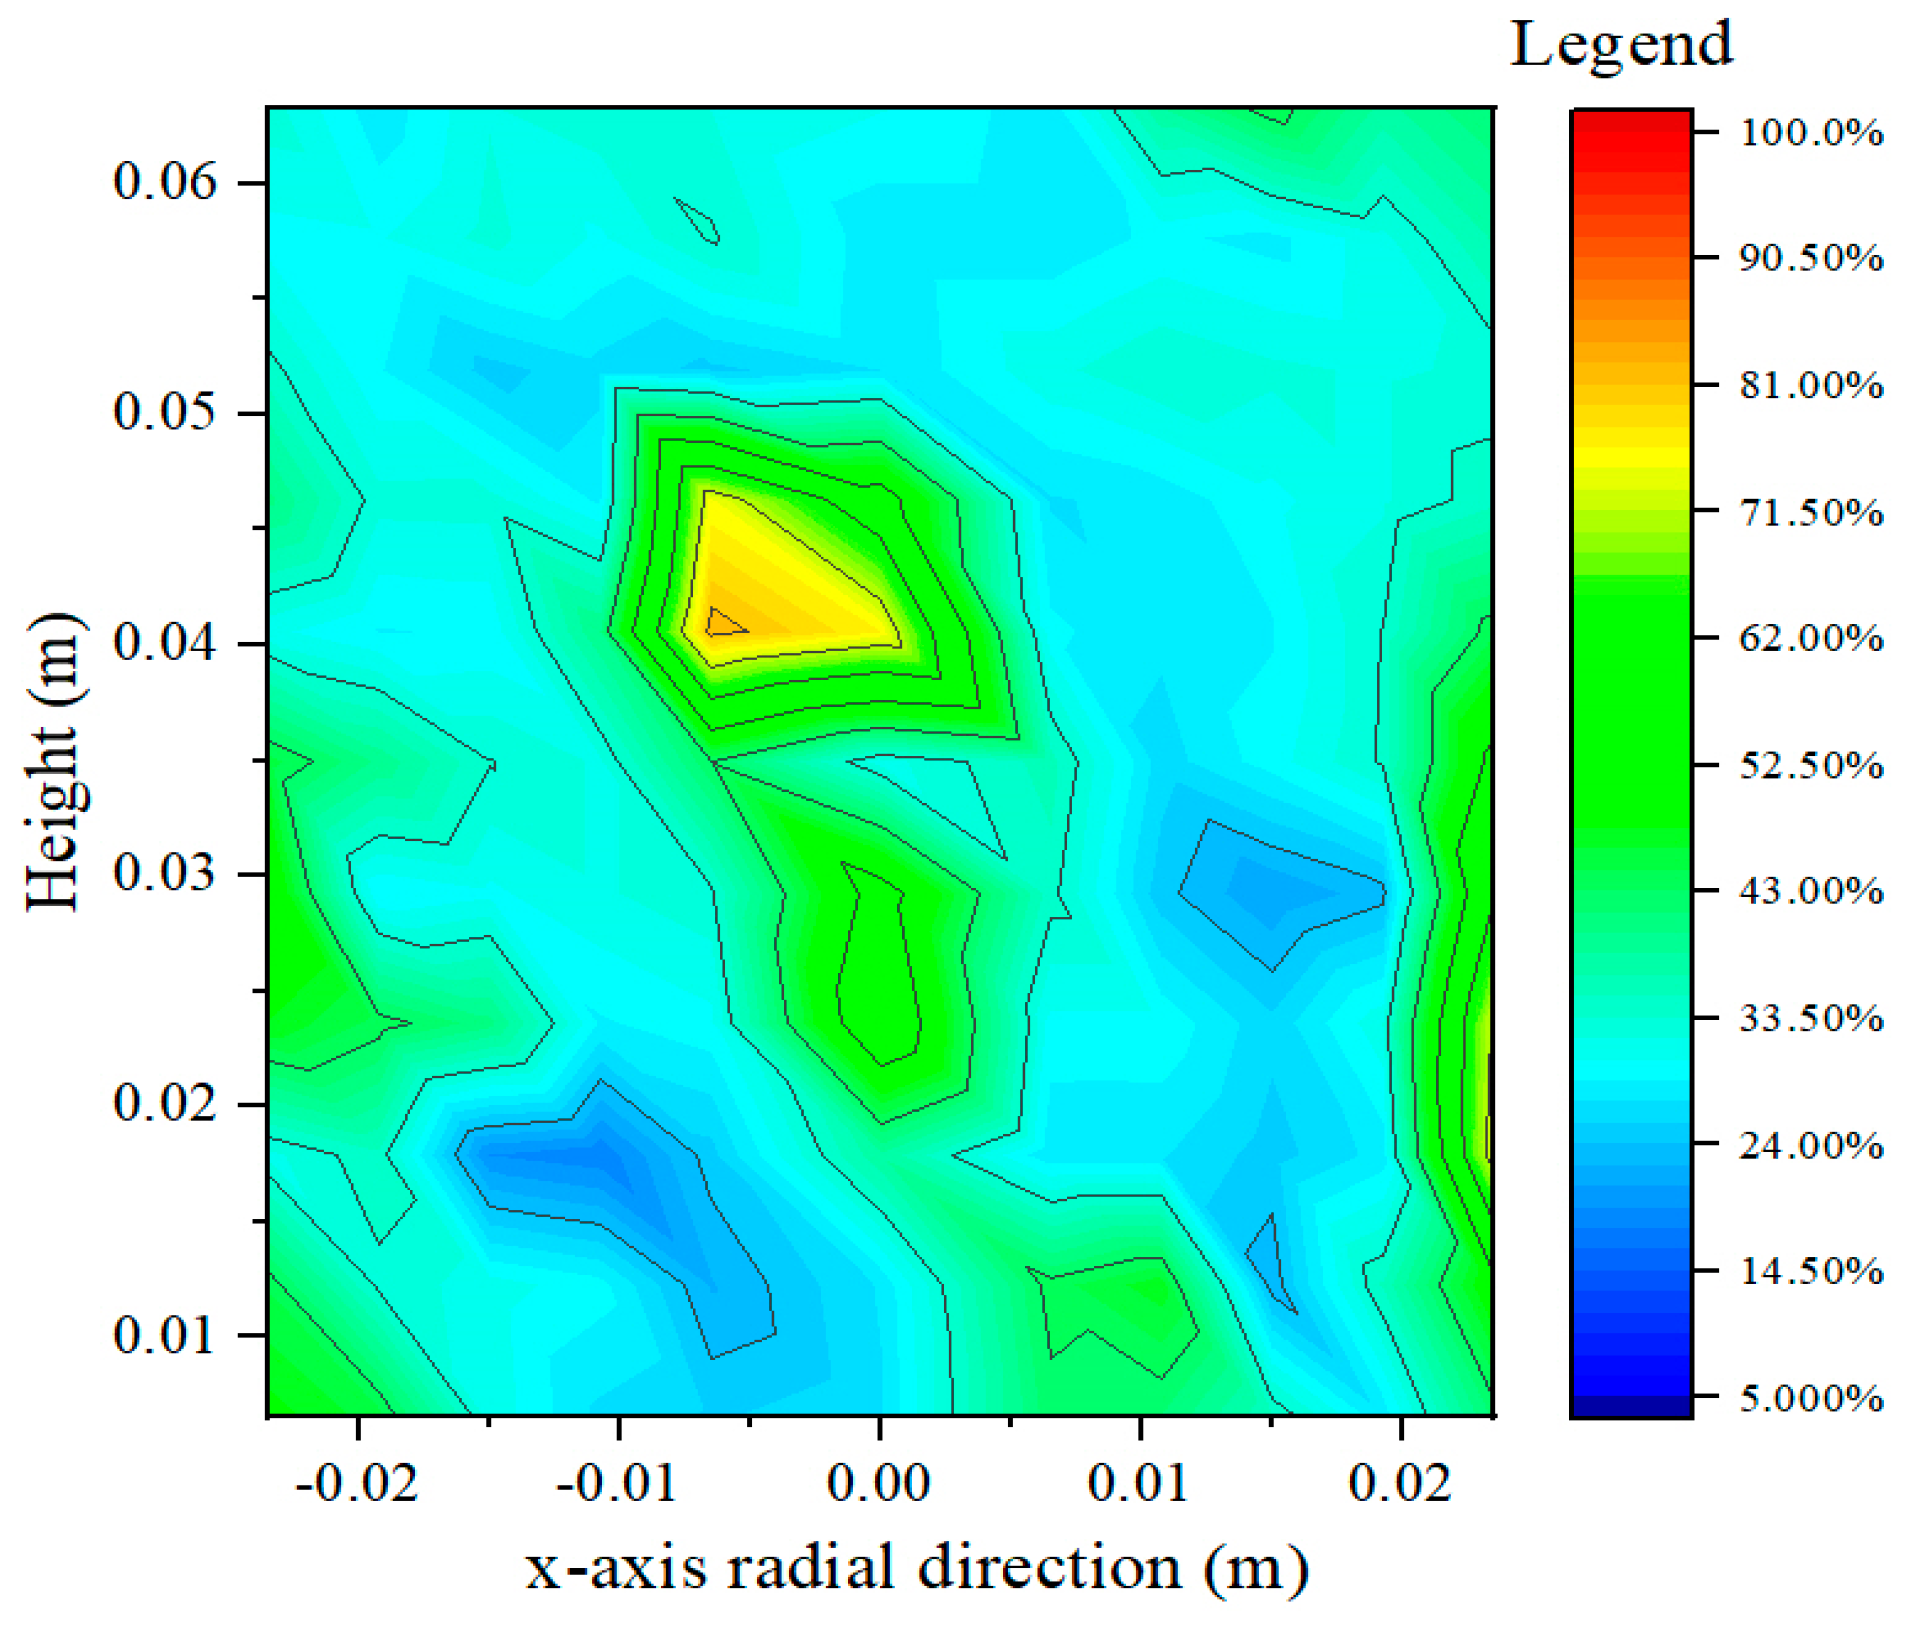
2.3. Void Distribution Contour Map of the Asphalt Mixtures

2.3.1. Void Distribution Contour Map in the Longitudinal Section

In this study, void distribution contour maps were utilized in both longitudinal and transverse sections of asphalt mixtures containing intelligent aggregates to analyze the impact of intelligent aggregates on the surrounding void distribution.
The method for obtaining the void distribution contour map of the longitudinal section in asphalt mixtures is as follows: Figure 7 a illustrates the longitudinal section of the asphalt mixture DEM model. It is evident that the changes in the void structure caused by smart aggregates are difficult to observe solely from the longitudinal section. As shown in Figure 7 b, a coordinate system was established along the radial x-axis of the asphalt mixture and the z-axis representing the height. Subsequently, the measurement spheres with a radius of 9 mm were arranged at intervals of 7.2 mm, forming an array that fills the longitudinal section of the asphalt mixture specimen. Afterward, as depicted in Figure 7 c, the PFC 5.0 software was used to calculate the elements within each measurement sphere, including the volume occupied by the balls and clumps, which enabled us to determine the void ratio within each measurement sphere. Finally, the x-axis, z-axis coordinates, and void ratios of each measurement sphere were output as a “.dat” file. This “.dat” file was then read into the Origin 2018 software to construct a contour map, where the specimen height is represented by the z-axis, the radial coordinates by the x-axis, and the void ratios are visualized according to the color legend.
Figure 8 shows the void distribution contour map of the longitudinal section of an asphalt mixture DEM model without smart aggregates, obtained using the aforementioned method. The average void ratio in the longitudinal section contour map of this specimen is 39.96%, with a maximum value of 79.35%, a minimum value of 15.72%, and a standard deviation of 15.72.

2.3.2. Void Distribution Contour Map in the Transverse Section

Using a method similar to the previous section, the void distribution contour map of the transverse section was established. As depicted in Supplementary Figure S1, the x and y coordinates and void ratio values for each “Measure” sphere were calculated and output, and a contour map was established with x-axis radial and y-axis radial coordinates as the grid, with void ratio values varying according to the legend.
Supplementary Figure S2 shows the void distribution contour map of the transverse section of an asphalt mixture DEM model without embedded smart aggregates, obtained using the aforementioned method. At this point, the mean void ratio of the section is 44.32%, with a maximum value of 80.135%, a minimum value of 15.56%, and a standard deviation of 15.16.

3. Results and Discussion

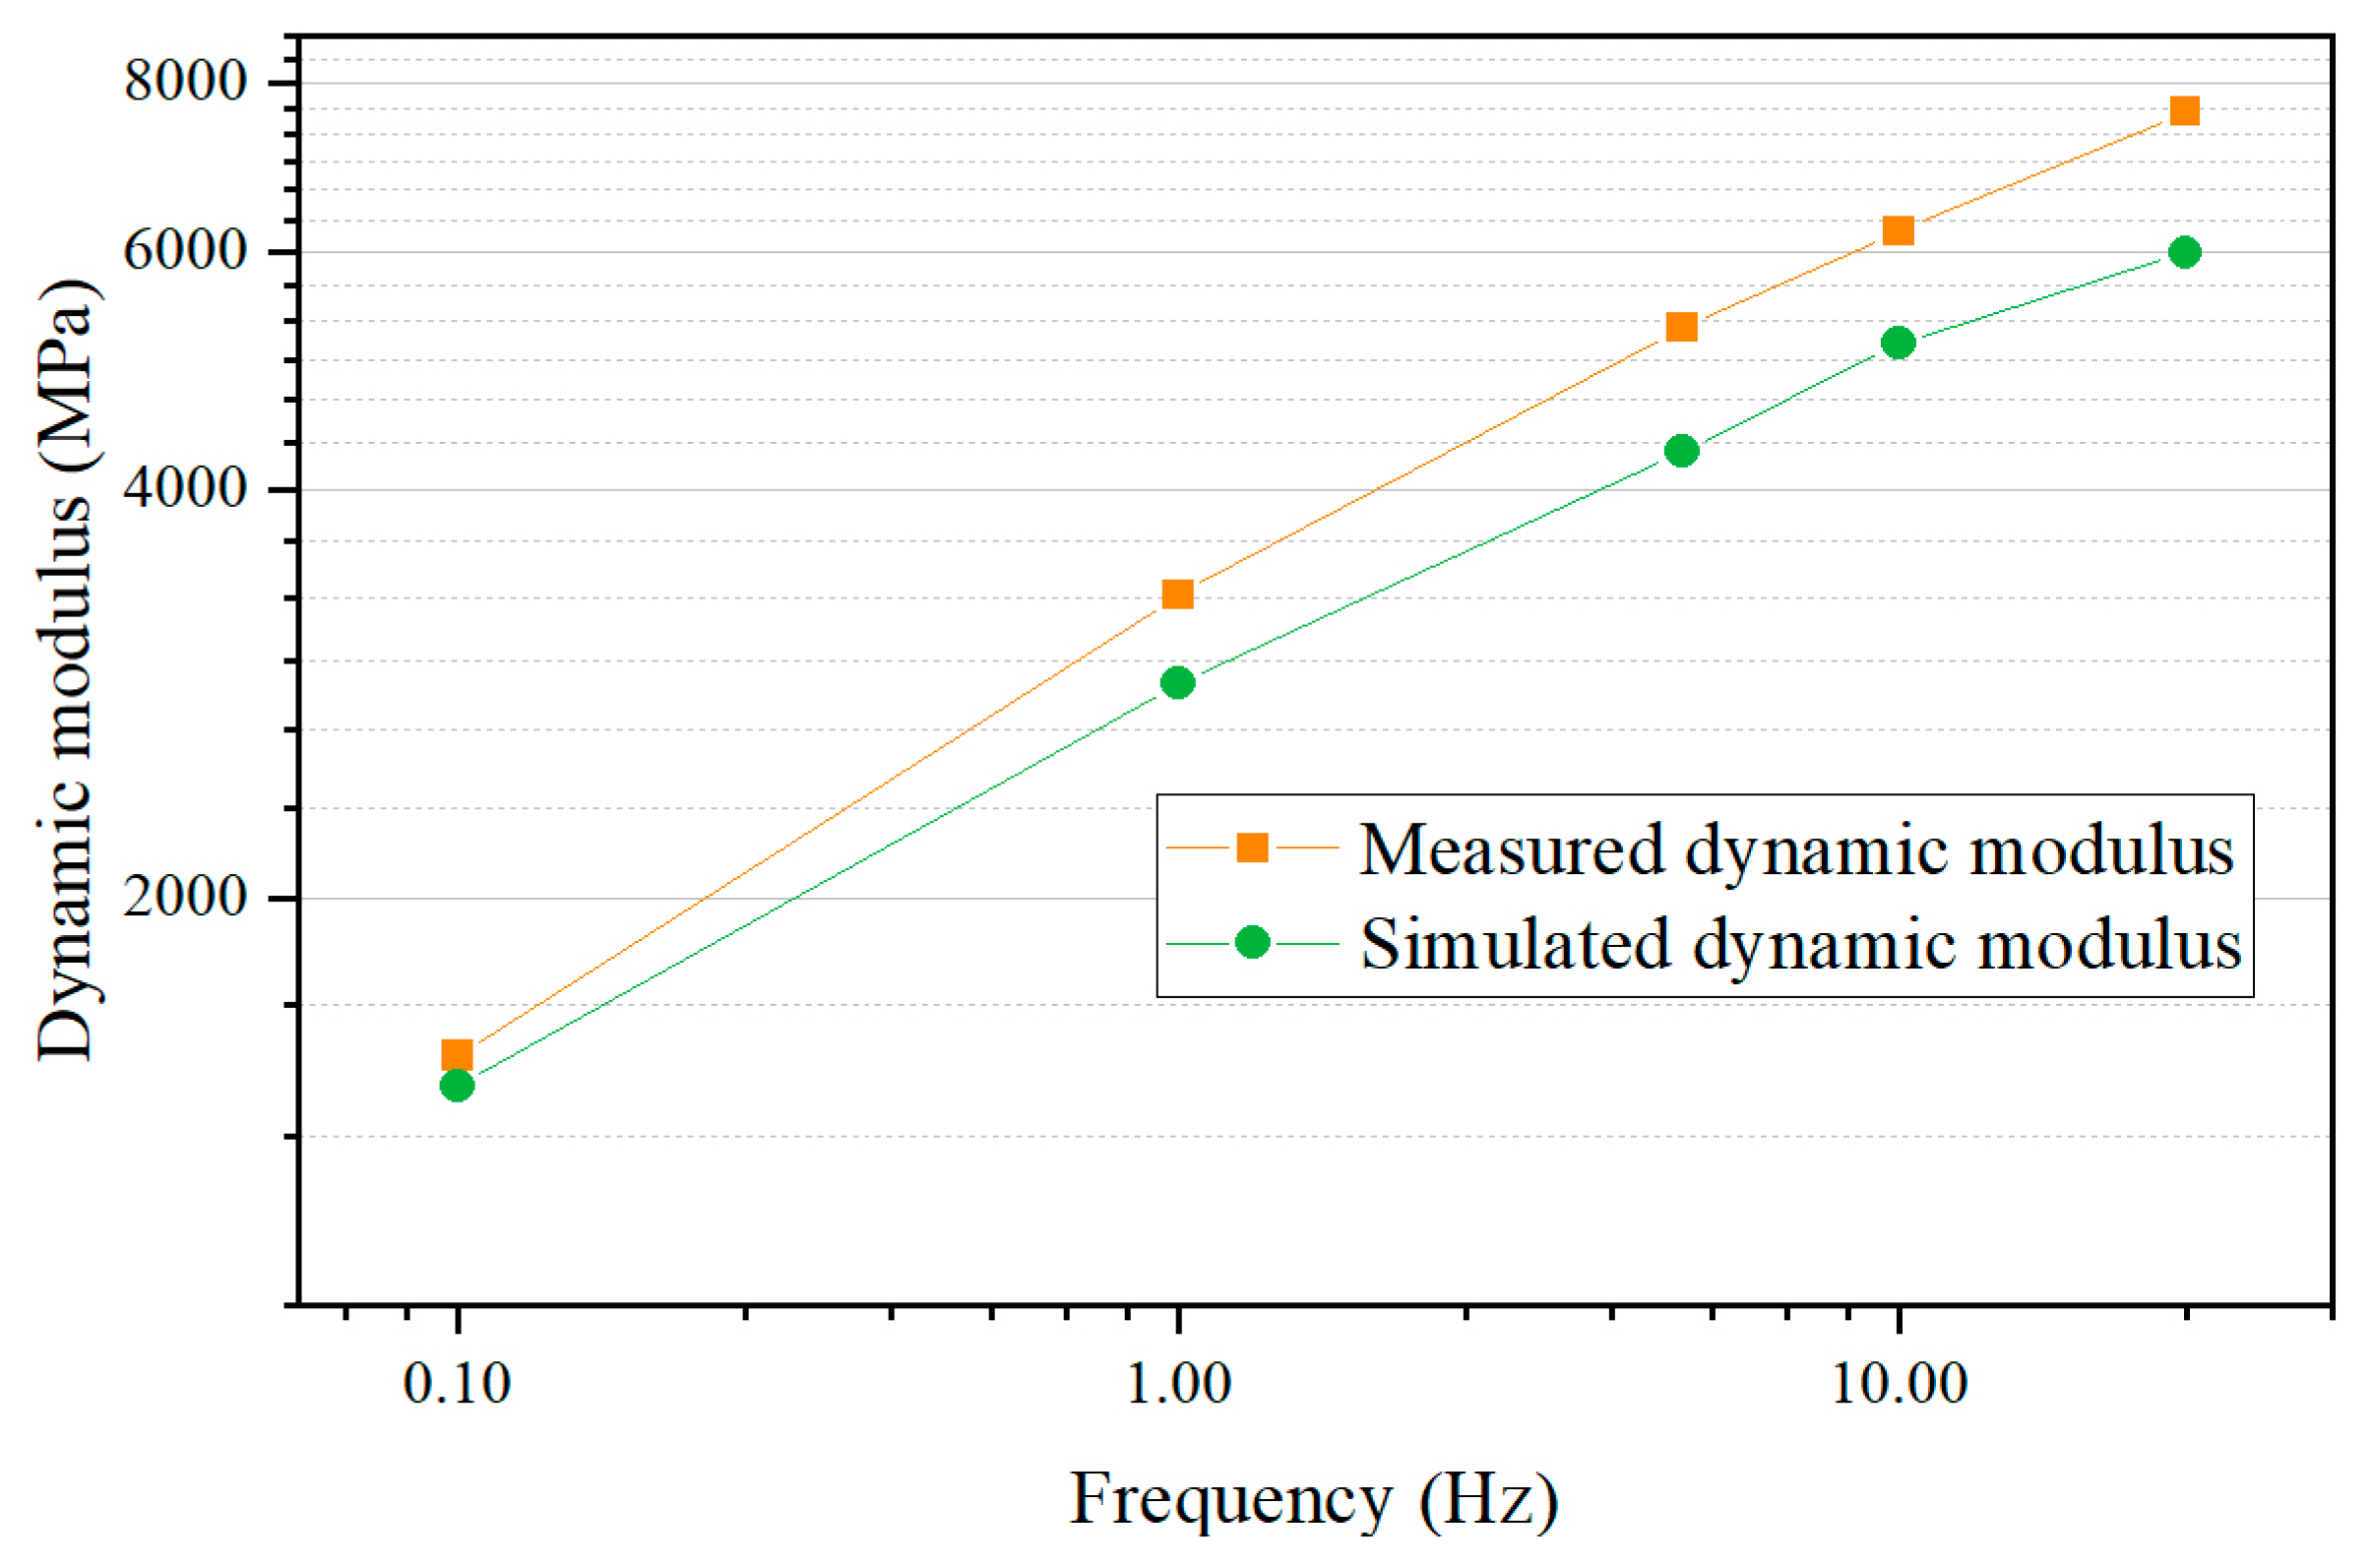
3.1. Verification of Discrete Element Model for Asphalt Mixture

In this study, the shift factors and master curve parameters were utilized as obtained from the dynamic modulus tests on asphalt mortar specimens conducted in Section 2.2.4. The viscoelastic parameters of the asphalt mortar at 25 °C and 25 Hz are presented in Table 4. Subsequently, using the macro–micro parameter conversion methods and formulas outlined in Section 2.2, this study calculated the micro-contact parameters between components of the asphalt mixture DEM model during the application of dynamic loading. The micro-contact parameters between components of the asphalt mixture DEM model under different frequency conditions were obtained using a similar approach, as described previously.
The simulated dynamic modulus values of the asphalt mixture specimen model at 25 °C, along with the experimentally measured dynamic modulus values, are presented in Figure 9. The simulated dynamic modulus at frequencies of 0.1, 1.0, 5.0, 10.0, and 25.0 Hz corresponds to 94.93, 90.23, 88.07, 89.63, and 85.74% of the measured values, respectively. In the discrete element model, the simulated dynamic modulus is 5.07% to 14.26% lower than the experimental values. This discrepancy may be attributed to the following reasons: (1) The surfaces of the “Ball” and “Clump” elements used in the model are smooth, which does not effectively account for the roughness of aggregate surfaces and the interlocking effect between particles; (2) In the densely packed “Ball” particles, there are unfilled voids. During the loading process, the number of particles actually in contact with the upper wall and the total contact area differ from the cylindrical cross-sectional area of the specimen. Despite these factors, the results validate that the discrete element model exhibits good accuracy and provides useful trends for testing the dynamic modulus of asphalt mixtures.

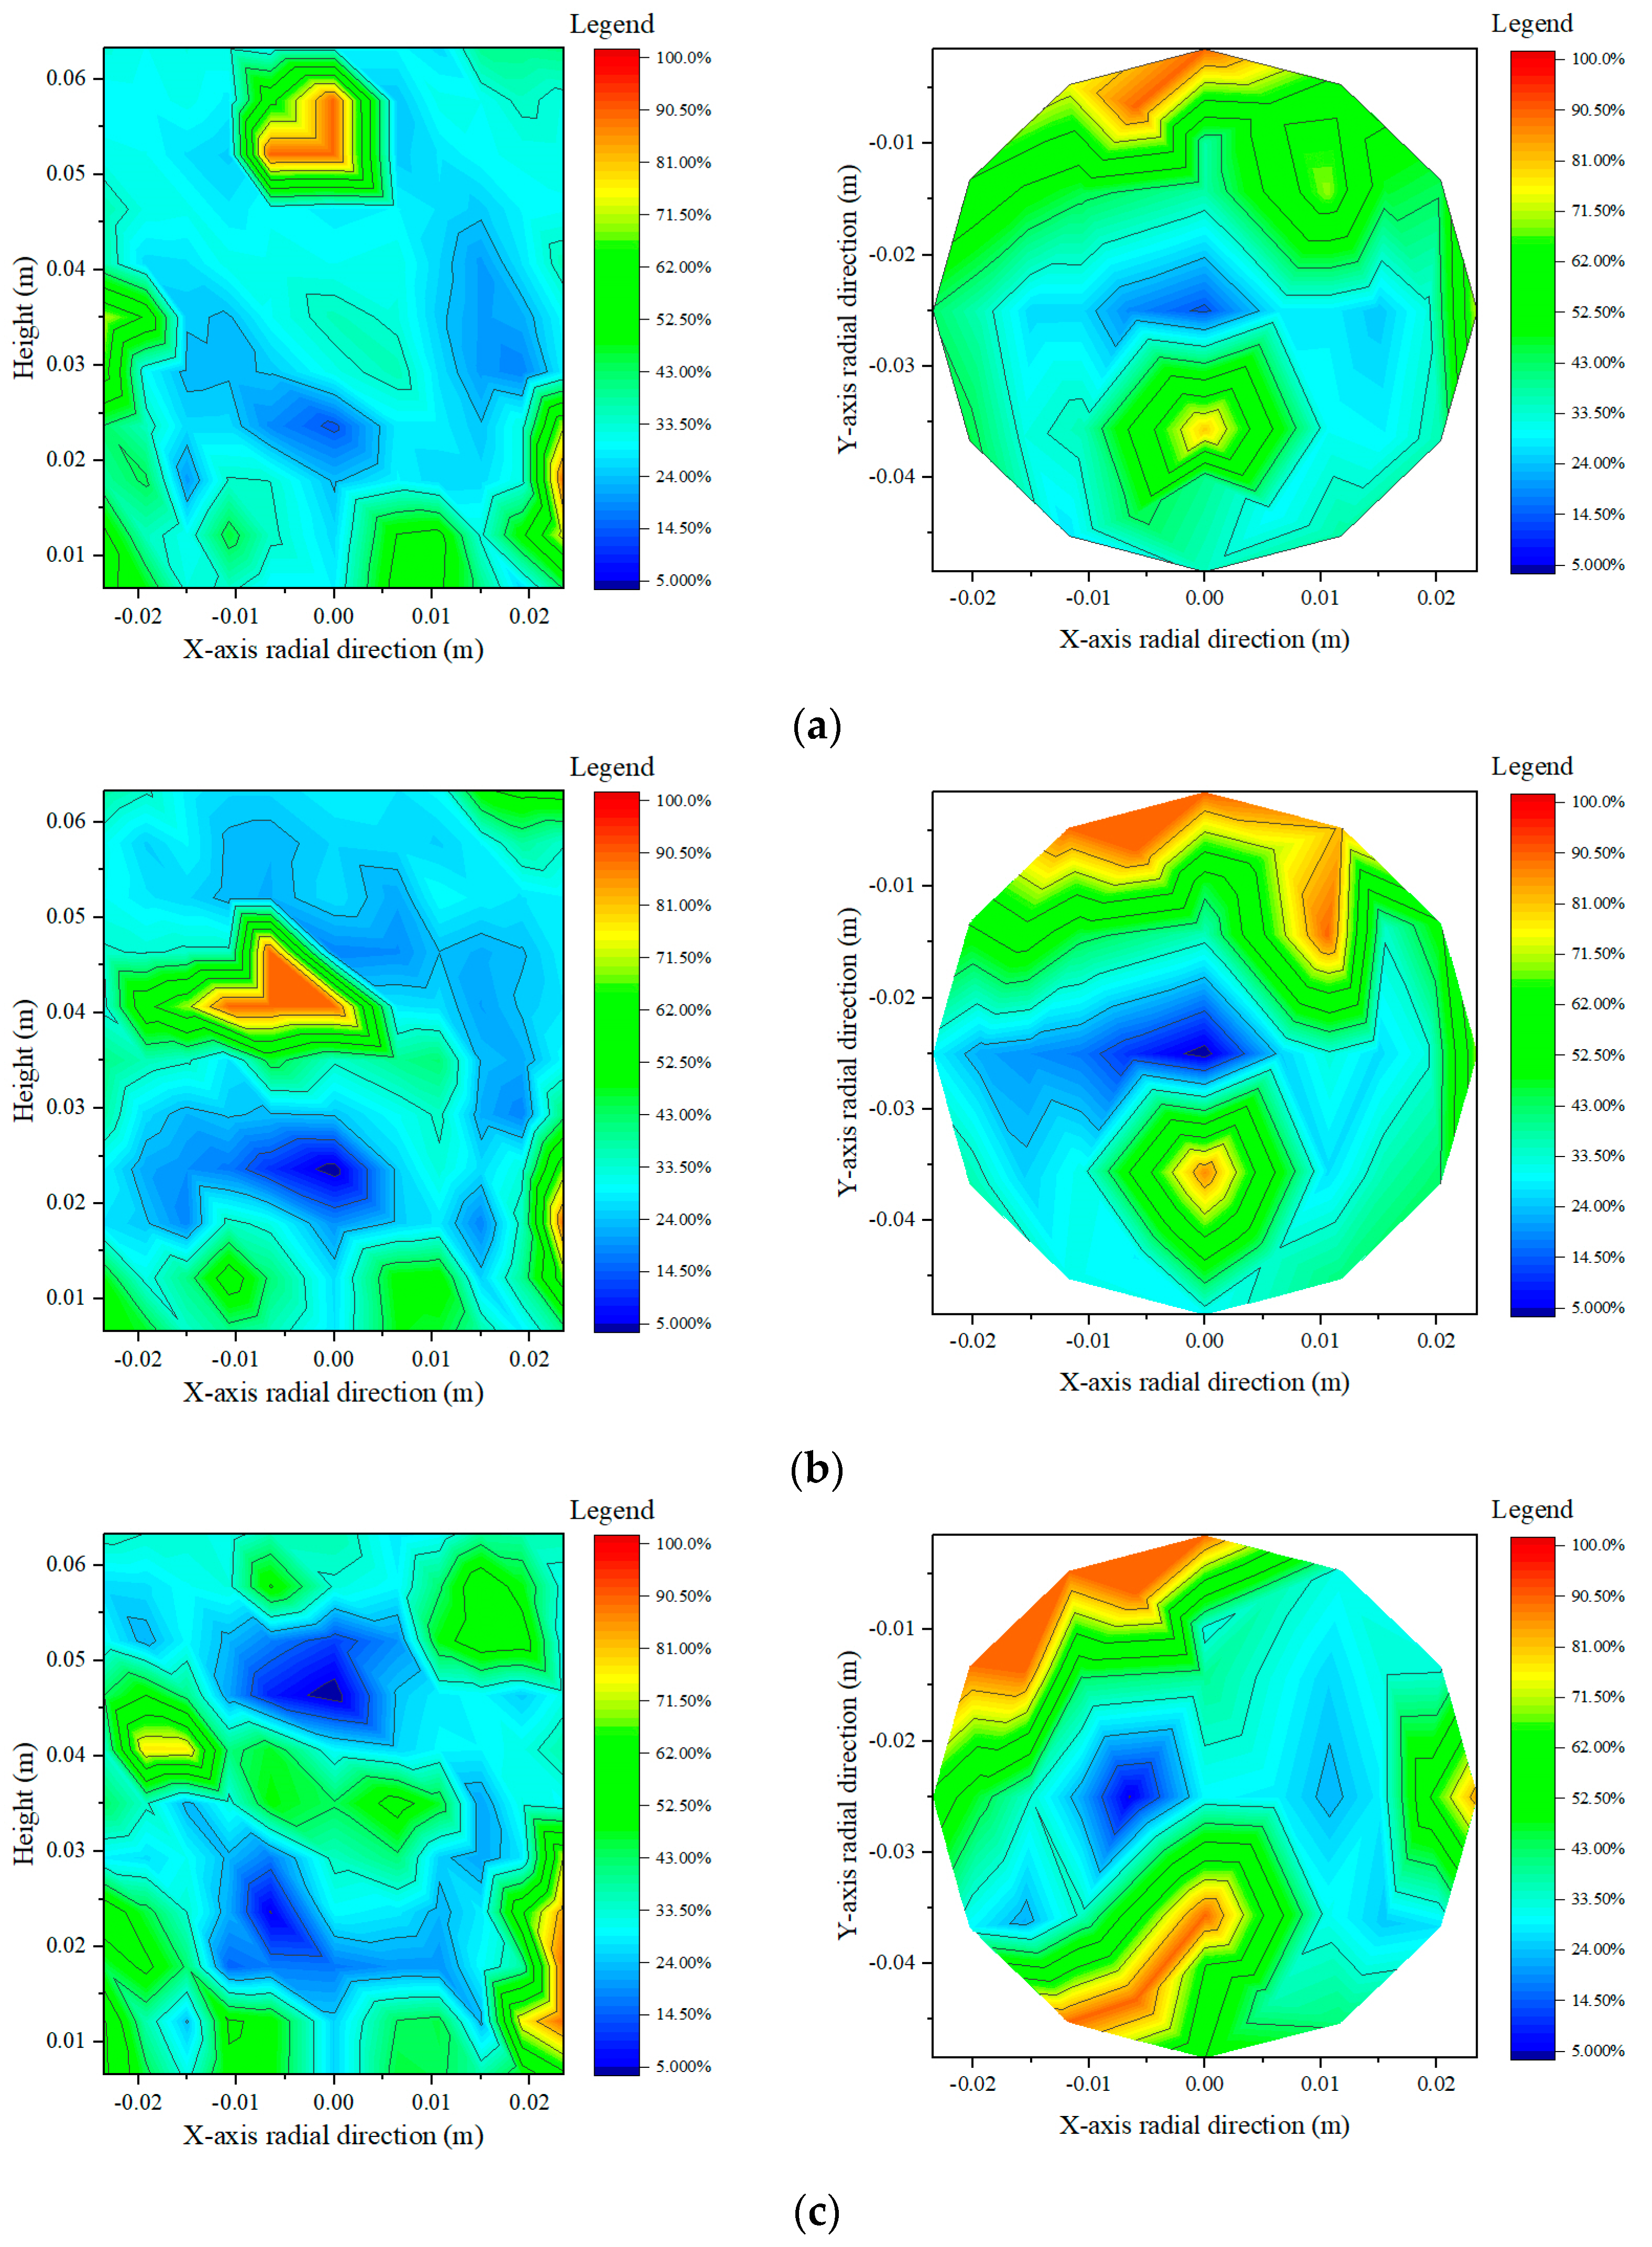
3.2. Effect of Smart Aggregate Size on the Mesostructure of Asphalt Mixtures

The method described in Section 2.3 was applied to plot the void distribution contour maps for the longitudinal and transverse sections of asphalt mixture specimens embedded with smart aggregates of varying sizes. The results are presented in Figure 10, which show that:
(1)
With the increase in smart aggregate size, the mean void ratio in the longitudinal sections of asphalt mixture specimens embedded with three different sizes of smart aggregates are 37.86%, 30.59%, and 28.86%, respectively. Compared to the specimen without embedded smart aggregates, the variations are −5.25%, −23.45%, and −27.78%, respectively. The minimum values are 13.39%, 2.81%, and 2.16%, while the maximum values are 81.35%, 88.54%, and 89.63%, with standard deviations of 16.68, 19.78, and 22.86, respectively. These results indicate that as the size of the smart aggregates increases, the mean void ratio in the contour map decreases. It is inferred that the presence of smart aggregates within the selected section reduces the overall void ratio. However, the difference between the minimum and maximum void ratios increases, suggesting that the non-uniformity of the void distribution also increases.
(2)
With the increase in smart aggregate size, the mean void ratios in the transverse sections of asphalt mixture specimens embedded with three different sizes of smart aggregates are 38.90%, 29.01%, and 24.23%, respectively. Compared to the specimen without embedded smart aggregates, these values decreased by 12.24%, 34.57%, and 45.33%, respectively. The minimum values are 13.41%, 4.78%, and 2.83%, while the maximum values are 81.35%, 88.54%, and 89.63%, with standard deviations of 19.76, 20.46, and 27.11, respectively. The distribution results of the void ratio contour maps in the transverse sections show a trend similar to that observed in the longitudinal sections, with an even greater impact on the non-uniformity in the transverse sections.

3.3. Effect of Smart Aggregate Size on the Mechanical Properties of Asphalt Mixtures

3.3.1. Effect of Smart Aggregate Size on the Dynamic Modulus of Asphalt Mixtures

After validating the accuracy of the discrete element model for asphalt mixtures, in this study, the impact of smart aggregates and their sizes on the dynamic modulus of asphalt mixtures was further analyzed. Smart aggregates of different sizes were embedded into the asphalt mixtures, and dynamic modulus testing was conducted. The results are shown in Figure 11, where the sizes of aggregate 1, aggregate 2, and aggregate 3 are increased. Figure 11 indicates that at 25 °C and 25 Hz, the dynamic modulus of asphalt mixture specimens without embedded smart aggregates is approximately 5994 MPa. When smart aggregates of 10 mm × 10 mm × 10 mm are embedded, the dynamic modulus is about 5665 MPa, representing a reduction of approximately 5.53%. For specimens with embedded smart aggregates of 15 mm × 15 mm × 10 mm and 20 mm × 20 mm × 10 mm, the dynamic moduli are approximately 5348 MPa and 5174 MPa, respectively, corresponding to reductions of approximately 10.75% and 13.72%. The dynamic modulus of the asphalt mixture without smart aggregates is 1452 MPa at 0.1 Hz. When smart aggregates of increasing size are embedded, the dynamic modulus of the asphalt mixture decreases to 1426, 1325, and 1310 MPa at 0.1 Hz, representing reductions of 1.71, 8.76, and 9.81%, respectively. From the above observations, the following conclusions can be drawn: (1) the addition of smart aggregates reduces the dynamic modulus of asphalt mixtures, and this reduction effect increases with the size of the smart aggregates; (2) as the loading frequency increases, the effect of smart aggregates on the reduction in the dynamic modulus of asphalt mixtures becomes more pronounced.

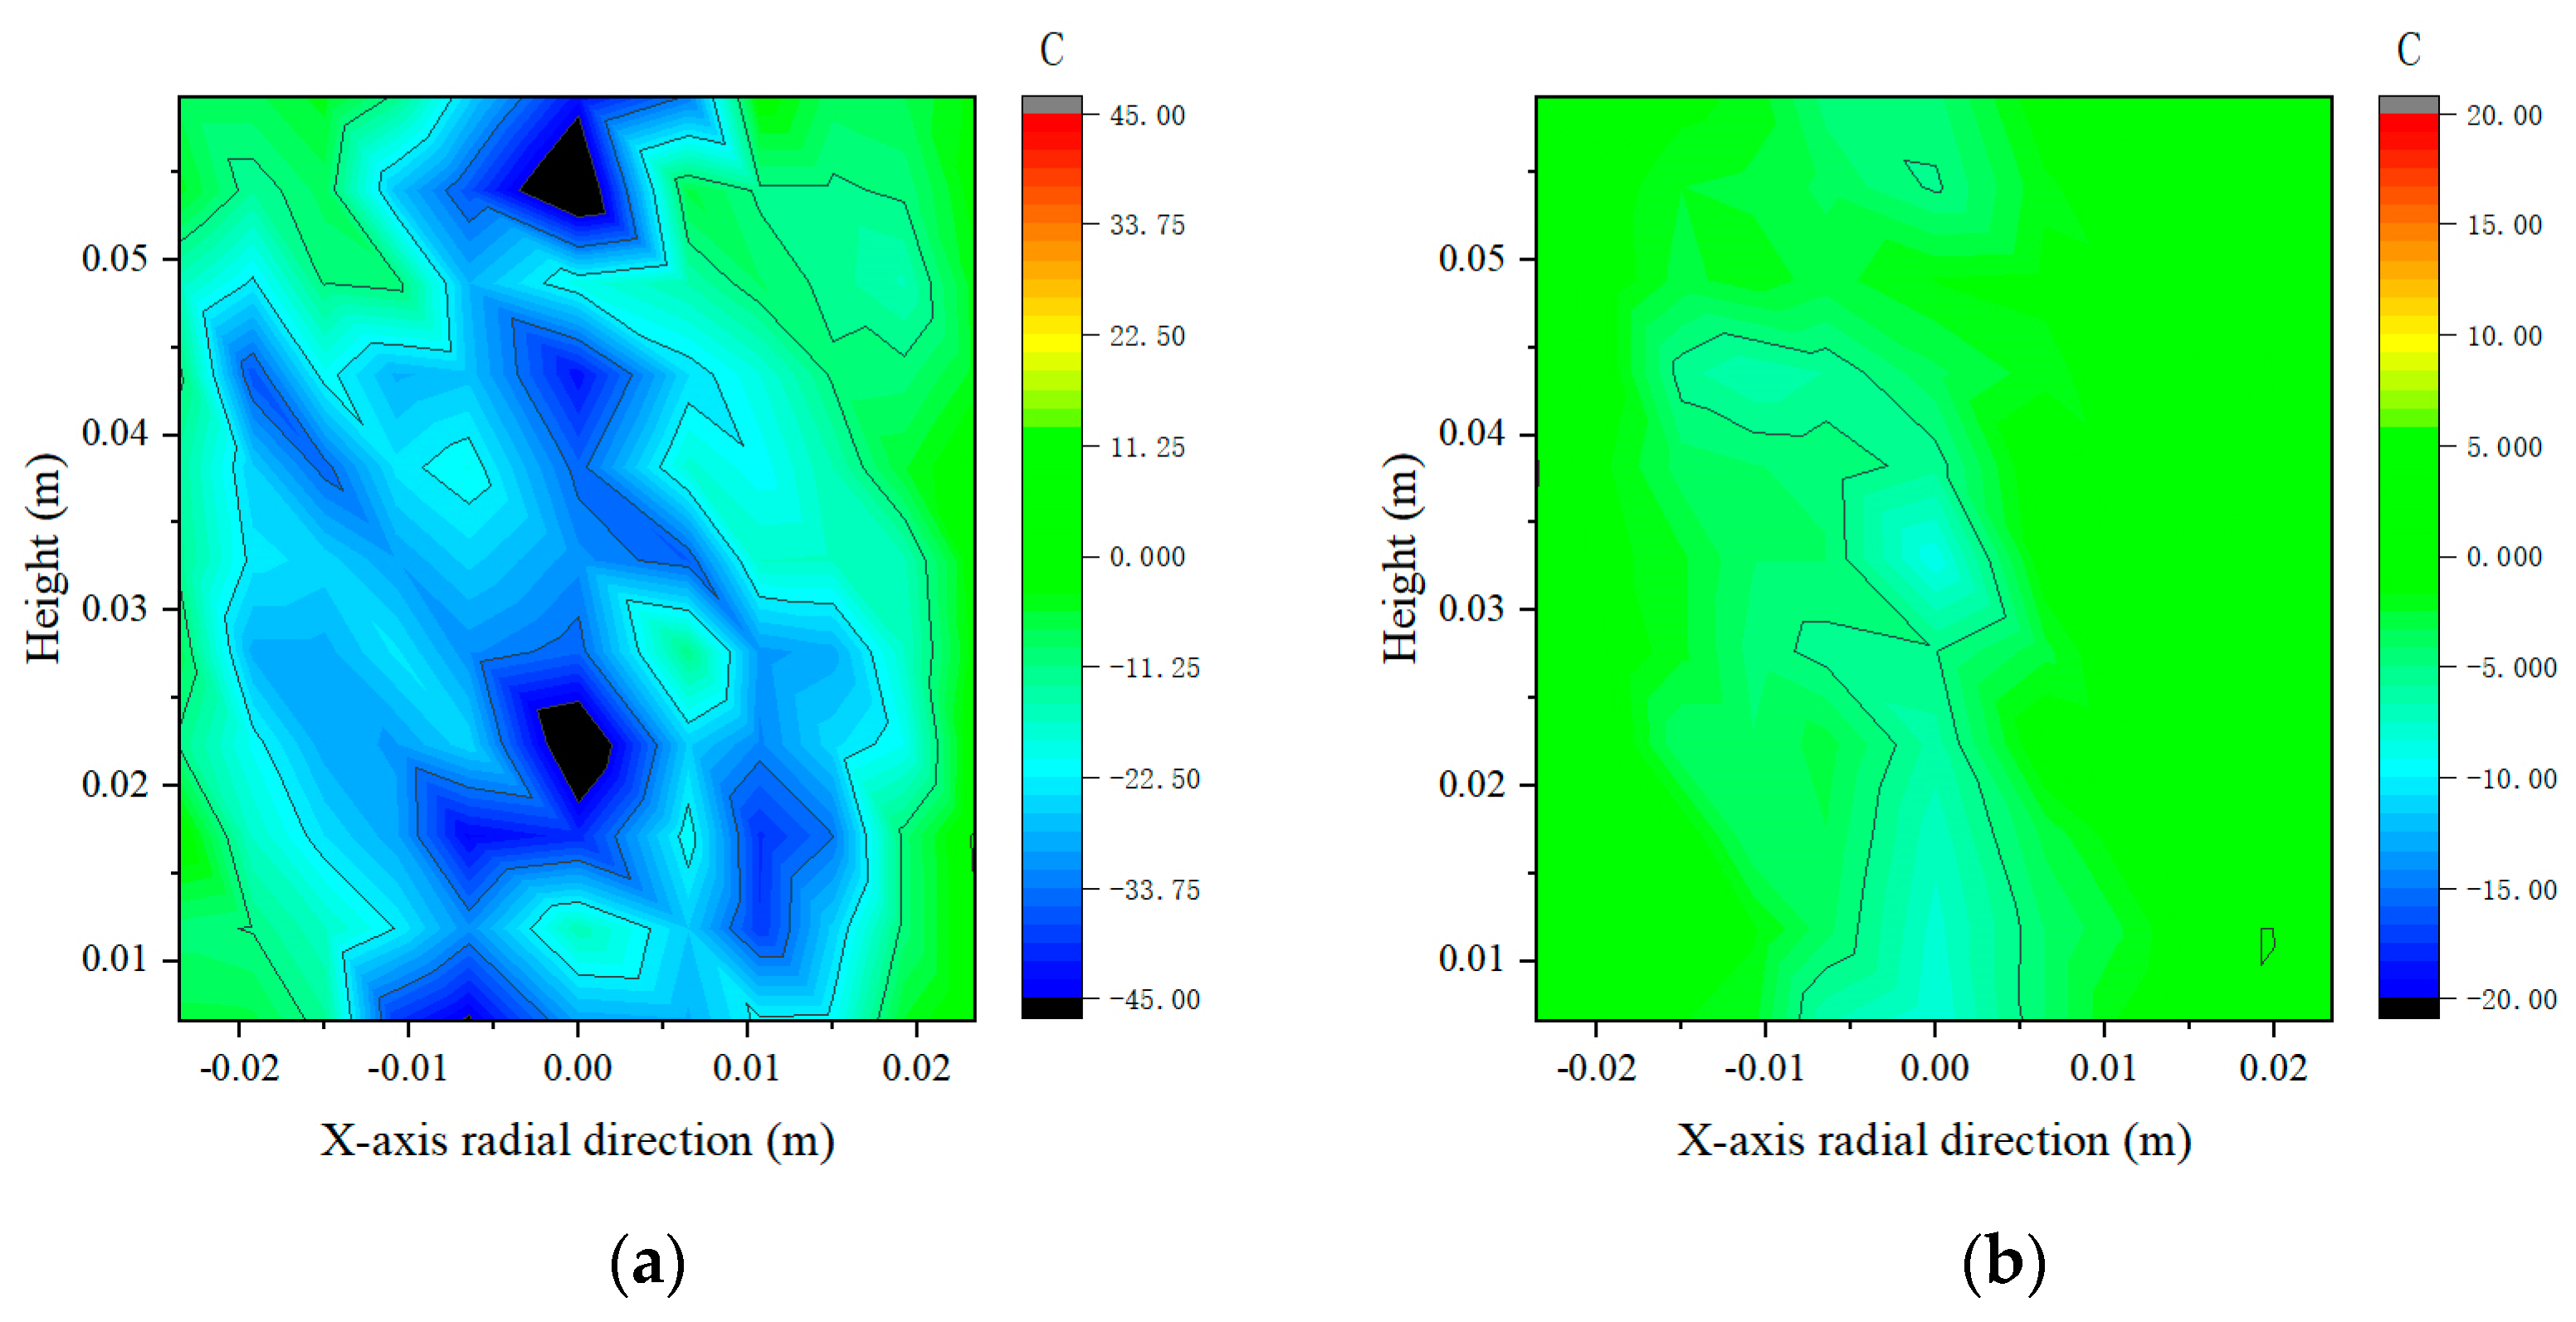
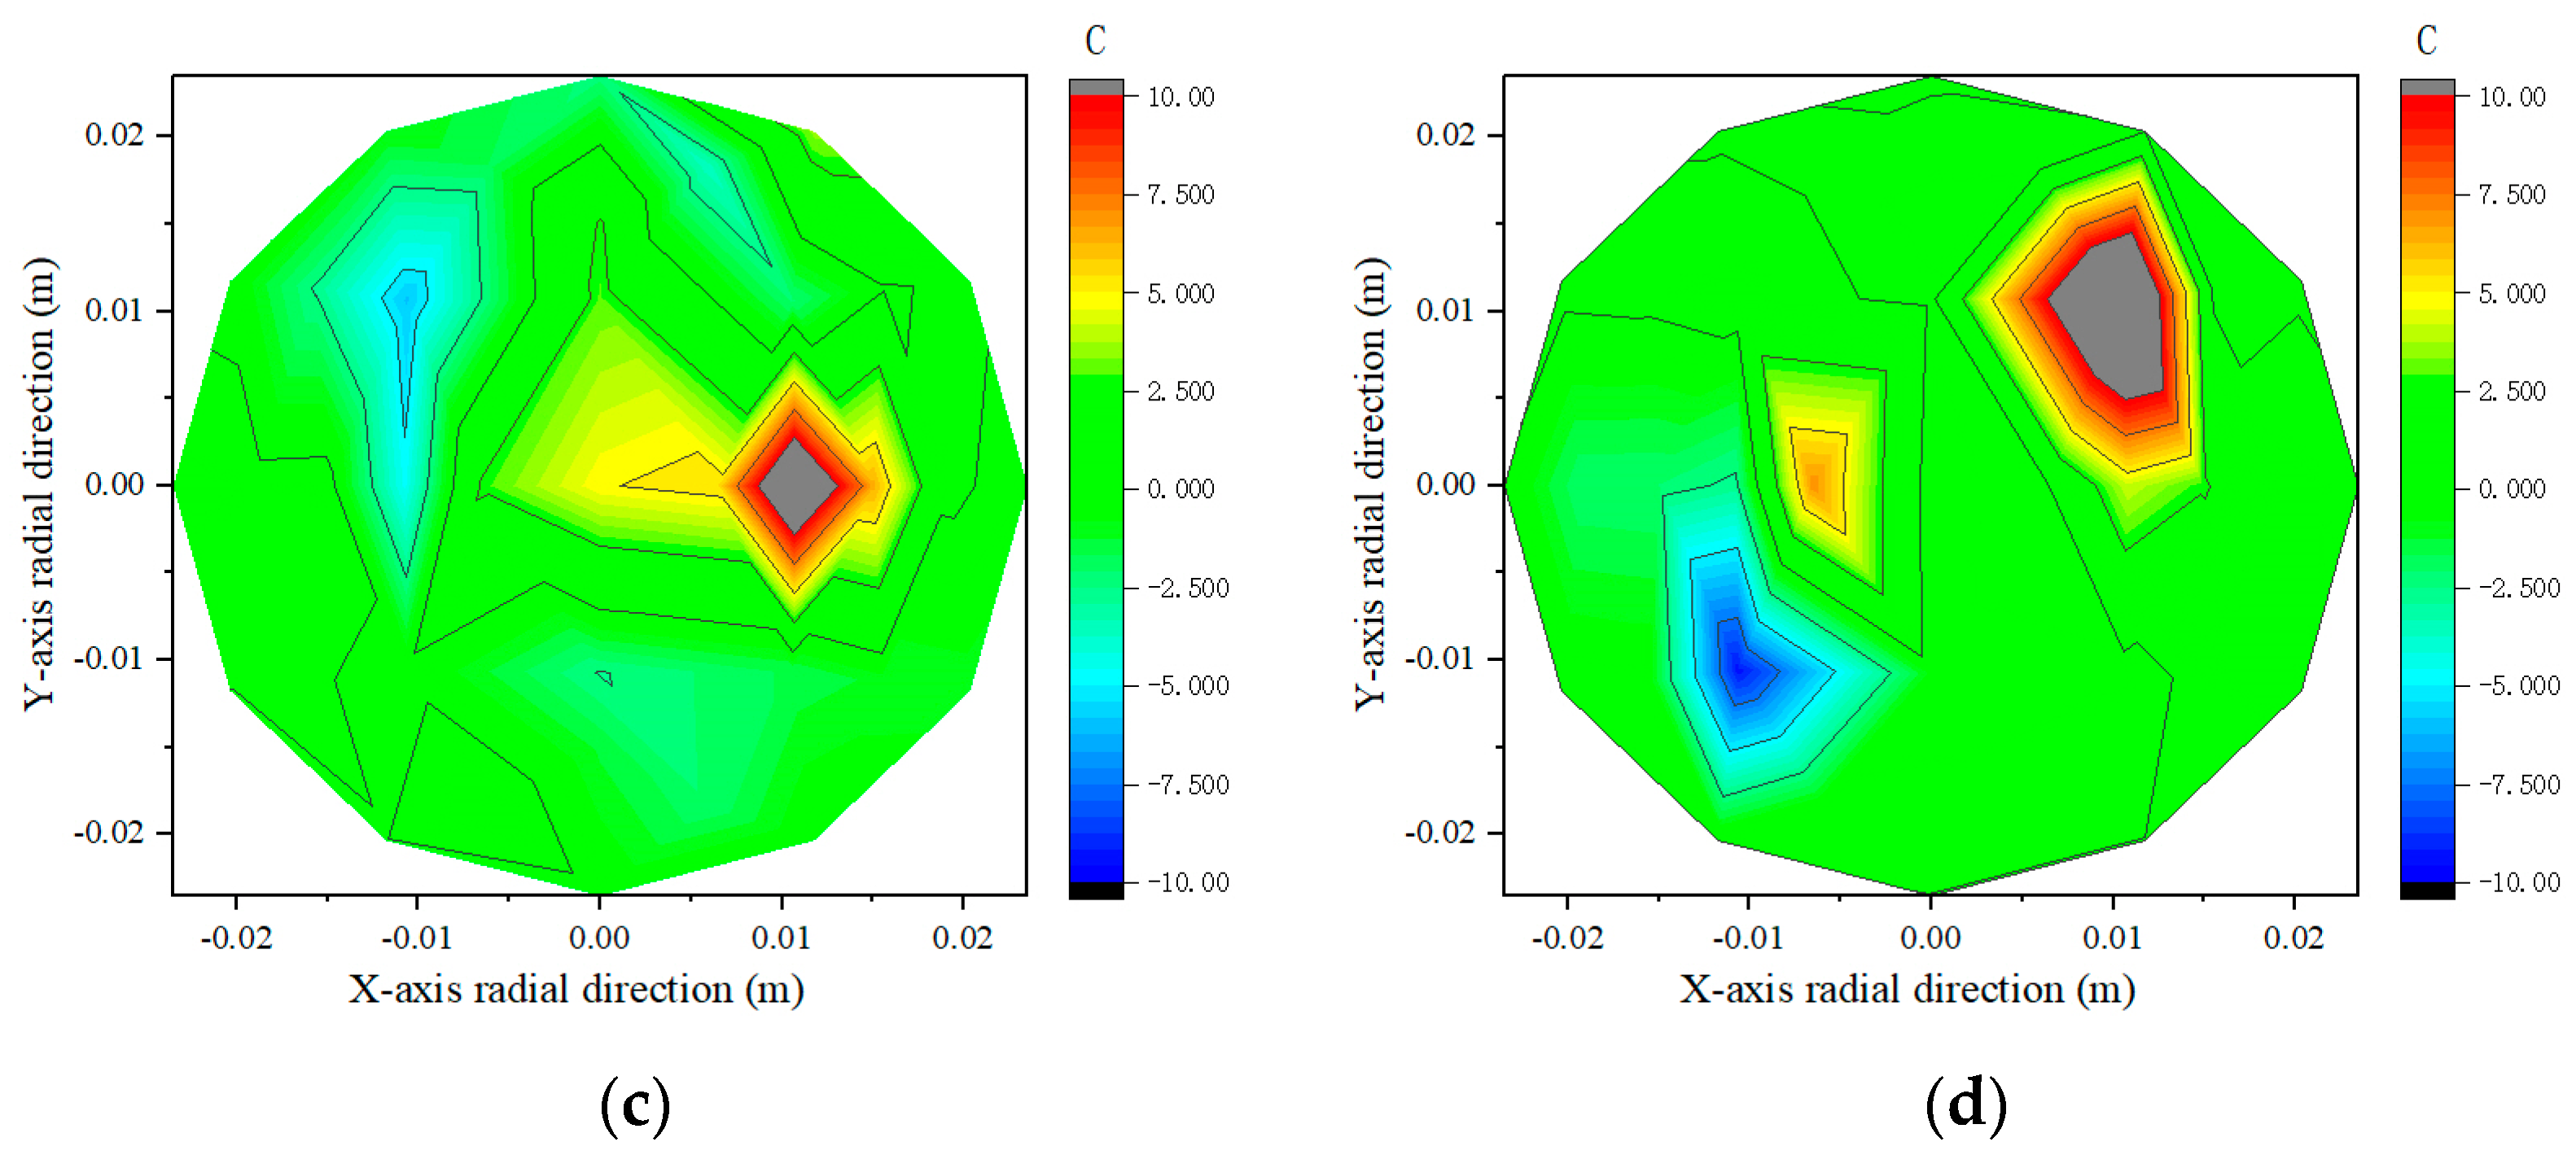
3.3.2. Internal Strain Rate of Asphalt Mixtures

In laboratory testing, it was observed that to ensure the survival of smart aggregates, they are generally added to the asphalt mixture after the high-temperature mixing process (which can reach up to 170–190 °C), rather than participating in it. This practice results in a lack of asphalt coating on the surface of the smart aggregates, leading to differences in adhesion with the surrounding mixture. Particularly, when the size of the smart aggregates is relatively large, the asphalt mixture with embedded smart aggregates sometimes develops minor cracks during the cooling process. To investigate the reasons for the reduction in dynamic modulus caused by smart aggregates, in this study, a method was employed similar to that in Section 2.3 to establish the internal strain rate distribution contour maps for asphalt mixture specimens both with and without embedded smart aggregates of three different sizes. These maps were obtained for specimens under balanced and offset half-sine load conditions to further investigate the impact of smart aggregates on the internal strain of the mixture under loading conditions.
In Supplementary Figure S3, the z-axis longitudinal strain contour maps are shown of the asphalt mixtures without and with smart aggregates of three different sizes, under no applied load conditions after equilibrium. The average z-axis strain rates are −0.00922/s, −0.03214/s, −0.12171/s, and −0.21637/s, with standard deviations of 0.16276, 0.31957, 0.41505, and 0.55778, respectively. These results indicate that the specimens are in a relatively balanced state. The addition of smart aggregates and the slight increase in their size raise the z-axis longitudinal strain rates and affect the uniformity of strain distribution.
In this study, the z-axis longitudinal strain contour maps of asphalt mixture specimens were analyzed under offset half-sine load conditions, as shown in Figure 12. At peak load, the average z-axis strain rates for the asphalt mixtures without embedded smart aggregates and with smart aggregates of three different sizes are −32.40899/s, −8.48570/s, −7.49238/s, and −4.87969/s. The standard deviations of the z-axis strain are 13.76655, 7.44373, 3.64981, and 2.64500. These results indicate that the presence of smart aggregates in asphalt mixture specimens results in lower z-axis strain rates, with the smart aggregates partially preventing the downward deformation of the specimens. However, as the size of the smart aggregates increases, their interference with the uniformity of the asphalt mixture strain also becomes more pronounced.
The z-axis longitudinal strain contour maps indicate that smart aggregates influence the internal stress and strain transfer process from top to bottom within the specimens, acting as a form of resistance during dynamic axial loading. This effect increases with the size of the smart aggregates. However, after embedding smart aggregates, the dynamic modulus of the asphalt mixture specimens actually decreases, suggesting an overall increase in specimen strain. Therefore, in this study, the strain conditions of the specimen transverse sections were further analyzed at peak load state. The transverse strain rate contour maps are shown in Figure 13. The strain rate values on the transverse section are 0.24776/s, 0.28194/s, 1.37704/s, and 2.53669/s, with standard deviations of 0.64185, 2.12624, 3.90826, and 5.11273, respectively. This indicates that smart aggregates increase deformation in the transverse section of the specimens, and this effect becomes more pronounced with larger aggregate sizes. Considering both the z-axis longitudinal and transverse strain rate contour maps, the results suggest that under half-sine dynamic loading conditions in the axial downward direction, smart aggregates partially prevent downward deformation of the internal structure of the mixture. However, in the transverse radial direction, they induce significant deformation, leading to a reduction in the overall modulus of the specimens.

4. Conclusions

Previous studies have primarily focused on analyzing the signals output by smart aggregates. However, since the smart aggregates lack a coating of asphalt, the impact of smart aggregates on the structure and properties of asphalt mixtures remains unknown. Therefore, this research, based on laboratory tests and DEM, analyzed the effect of smart aggregate size on the void structure distribution within asphalt mixtures. This study also explored the changes in the dynamic modulus of asphalt mixtures as the size of the smart aggregates increased, along with the potential underlying mechanisms. The main conclusions are as follows:
  • As the size of the smart aggregate increases, the average void ratio in the longitudinal section of the asphalt mixture decreases by 5.25%, 23.45%, and 27.78%, as compared to that of the specimen without embedded smart aggregate. With the increase in the smart aggregate, the average void ratio in the transverse section decreased by 12.24%, 34.57%, and 45.33%. Overall, the average void ratio of asphalt mixture decreases with increasing smart aggregate size, but the inhomogeneity of void distribution increases, and the void structure in the transverse section is more affected by the smart aggregates.
  • At 25 °C, 25 Hz, the dynamic modulus of the asphalt mixtures decreased by 5.53%, 10.75%, and 13.72%, compared to the specimens without embedded smart aggregates. At 0.1 Hz, the dynamic modulus of the asphalt mixture decreased by 1.71%, 8.76%, and 9.81%, compared to the specimens without embedded smart aggregate. Overall, this reduction effect increased with the increase in the size of smart aggregates and also with the increase in the loading frequency.
  • The lack of asphalt coating on the surface of the smart aggregate influenced the internal strain of the asphalt mixture. Under the peak load of a semi-sine wave, the strain rate in the z-axis direction of the asphalt mixture decreased compared to the specimen without embedded smart aggregate, indicating that the smart aggregates partially inhibit the downward deformation of the specimen. However, the strain rate of the asphalt mixture increases in the x, y cross section. As the size of the smart aggregates increases, these effects become more pronounced. Overall, the increase in transverse strain is the primary reason for the decrease in the overall dynamic modulus of the asphalt mixture specimens.
In this study, the AC-13 dense-graded asphalt mixture is primarily addressed, and the conclusions are therefore more applicable to this specific gradation. For future research, it is recommended to explore the impact of smart aggregates on other types of asphalt mixtures, such as gap-graded and open-graded mixtures. Additionally, while this study focuses on dynamic modulus, subsequent research could extend to analyzing the influence of smart aggregates on the rutting resistance and fracture performance of asphalt mixtures.

Supplementary Materials

The following supporting information can be downloaded at https://www.mdpi.com/article/10.3390/coatings14101238/s1, Figure S1. Establishment process for the void distribution contour map in the transverse section: (a) Transverse section of the asphalt mixture DEM model; (b) A “Measure” sphere array that fills the entire transverse section; (c) Analysis of the void ratio within each measure sphere.Figure S2. Void distribution contour map of the asphalt mixture in the transverse section.Figure S3. Longitudinal rate contour map of specimens in the equilibrium state: (a) Specimens without embedded smart aggregates; (b) Specimens with embedded smart aggregates of 10 mm × 10 mm × 10 mm; (c) Specimens with embedded smart aggregates of 15 mm × 15 mm × 10 mm; (d) Specimens with embedded smart aggregates of 20 mm × 20 mm × 10 mm.

Author Contributions

Y.L.: writing—original draft, formal analysis, software, and validation; C.M.: investigation and validation; M.S.: software and data curation; J.H.: investigation and validation; X.Z.: investigation and resources; P.L.: writing—review and editing; J.X.: writing—review, resources, and supervision. All authors have read and agreed to the published version of the manuscript.

Funding

This research was funded by the Technology Project of Shaanxi Provincial Department of Transportation (24-35K), the Shaanxi Transportation Holding Group Technology Development Co., Ltd. Scientific Research Project (KY-2024-03), and the Technology Project of Shaanxi Provincial Department of Transportation (23-77R).

Institutional Review Board Statement

Not applicable.

Informed Consent Statement

Not applicable.

Data Availability Statement

Data are contained within the article and Supplementary Materials.

Conflicts of Interest

Author Xin Zhao was employed by the company Shaanxi Provincial Transport Planning Design and Research Institute Co., Ltd. The remaining authors declare that the research was conducted in the absence of any commercial or financial relationships that could be construed as a potential conflict of interest.

References

  1. Mollenhauer, K.; Wistuba, M.P. Influence of asphalt compaction procedure on 3D deformation properties. Int. J. Pavement Eng. 2016, 17, 5–12. [Google Scholar] [CrossRef]
  2. You, Z.; Dai, Q. Review of advances in micromechanical modeling of aggregate–aggregate interactions in asphalt mixtures. Can. J. Civ. Eng. 2007, 34, 239–252. [Google Scholar] [CrossRef]
  3. Birgin, H.B.; D’Alessandro, A.; Corradini, A.; Laflamme, S.; Ubertini, F. Self-sensing asphalt composite with carbon microfibers for smart weigh-in-motion. Mater. Struct. 2022, 55, 138. [Google Scholar] [CrossRef]
  4. Palese, M.; Zarembski, A.M.; Huang, H.; Palese, J. Ballast particle dynamic response as a function of subgrade support using statistical methods. Constr. Build. Mater. 2022, 325, 126772. [Google Scholar] [CrossRef]
  5. Wang, X.; Huang, H.; Tutumluer, E.; Tingle, J.S.; Shen, S. Monitoring Particle Movement under Compaction using SmartRock Sensor: A Case Study of Granular Base Layer Compaction. Transp. Geotech. 2022, 34, 100764. [Google Scholar] [CrossRef]
  6. Gu, Q.; Zhao, C.; Bian, X.; Morrissey, J.P.; Ooi, J.Y. Trackbed settlement and associated ballast degradation due to repeated train moving loads. Soil Dyn. Earthq. Eng. 2022, 153, 107109. [Google Scholar] [CrossRef]
  7. Liu, S.; Huang, H.; Qiu, T.; Kwon, J. Effect of geogrid on railroad ballast particle movement. Transp. Geotech. 2016, 9, 110–122. [Google Scholar] [CrossRef]
  8. Liu, S.; Huang, H.; Qiu, T.; Gao, L. Comparison of Laboratory Testing Using SmartRock and Discrete Element Modeling of Ballast Particle Movement. J. Mater. Civ. Eng. 2017, 29, D6016001. [Google Scholar] [CrossRef]
  9. Liu, S.; Huang, H.; Qiu, T.; Kerchof, B. Characterization of Ballast Particle Movement at Mud Spot. J. Mater. Civ. Eng. 2019, 31, 04018339. [Google Scholar] [CrossRef]
  10. Feng, B.; Basarah, Y.I.; Gu, Q.; Duan, X.; Bian, X.; Tutumluer, E.; Hashash, Y.M.A.; Huang, H. Advanced full-scale laboratory dynamic load testing of a ballasted high-speed railway track. Transp. Geotech. 2021, 29, 100559. [Google Scholar] [CrossRef]
  11. Gu, Q.; Liu, H.; Wu, Y.; Luo, Z.; Bian, X. Evolution of trackbed performance and ballast degradation due to passages of million train wheel axle loads. Transp. Geotech. 2022, 34, 100753. [Google Scholar] [CrossRef]
  12. Dai, J.; Ma, F.; Fu, Z.; Li, C.; Jia, M.; Shi, K.; Wen, Y.; Wang, W. Applicability assessment of stearic acid/palmitic acid binary eutectic phase change material in cooling pavement. Renew. Energy 2021, 175, 748–759. [Google Scholar] [CrossRef]
  13. Liu, J.; Zhang, T.; Guo, H.; Wang, Z.; Wang, X. Evaluation of self-healing properties of asphalt mixture containing steel slag under microwave heating: Mechanical, thermal transfer and voids microstructural characteristics. J. Clean. Prod. 2022, 342, 130932. [Google Scholar] [CrossRef]
  14. Wang, X.; Shen, S.; Huang, H.; Zhang, Z. Towards smart compaction: Particle movement characteristics from laboratory to the field. Constr. Build. Mater. 2019, 218, 323–332. [Google Scholar] [CrossRef]
  15. Wang, X.; Shen, S.; Huang, H. Meso-Scale Kinematic Responses of Asphalt Mixture in Both Field and Laboratory Compaction. Transp. Res. Rec. 2021, 2675, 1631–1642. [Google Scholar] [CrossRef]
  16. Dan, H.-C.; Yang, D.; Zhao, L.-H.; Wang, S.-P.; Zhang, Z. Meso-scale study on compaction characteristics of asphalt mixtures in Superpave gyratory compaction using SmartRock sensors. Constr. Build. Mater. 2020, 262, 120874. [Google Scholar] [CrossRef]
  17. Cheng, Z.; Zhang, D.; Xie, S.; Polaczyk, P.A.; Wang, T. SmartRock-Based Research on Gyratory Locking Point for Stone Mastic Asphalt Mixture. Buildings 2022, 12, 97. [Google Scholar] [CrossRef]
  18. Shan, H.-Y.; Dan, H.-C.; Wang, S.-P.; Liu, X.; Wang, H. Theoretical and Experimental Investigation on Dynamic Response of Asphalt Pavement Under Vibration Compaction. Front. Mater. 2022, 8, 816949. [Google Scholar] [CrossRef]
  19. Wang, N.; Chen, F.; Ma, T.; Luan, Y.; Zhu, J. Compaction performance of cold recycled asphalt mixture using SmartRock sensor. Autom. Constr. 2022, 140, 104377. [Google Scholar] [CrossRef]
  20. Jiang, W.; Wang, T.; Yuan, D.; Sha, A.; Zhang, S.; Zhang, Y.; Xiao, J.; Xing, C. Available solar resources and photovoltaic system planning strategy for highway. Renew. Sustain. Energy Rev. 2024, 203, 114765. [Google Scholar] [CrossRef]
  21. Zhang, C.; Shen, S.; Huang, H.; Wang, L. Estimation of the Vehicle Speed Using Cross-Correlation Algorithms and MEMS Wireless Sensors. Sensors 2021, 21, 1721. [Google Scholar] [CrossRef] [PubMed]
  22. Shi, B.; Shen, S.; Liu, L.; Wang, X. Estimation of Vehicle Speed from Pavement Stress Responses Using Wireless Sensors. J. Transp. Eng. Part B. Pavements 2021, 147, 04021028. [Google Scholar] [CrossRef]
  23. Zhang, K.; Luo, Y.; Xie, W.; Wu, J. Evaluation of road performance and adhesive characteristic of asphalt binder in salt erosion environment. Mater. Today Commun. 2020, 25, 101593. [Google Scholar] [CrossRef]
  24. Zhang, W.; Zhang, Z.; Zhao, Q. Laboratory Performance Evaluation of a Waterborne Epoxy-Modified Asphalt Mixture with Styrene-Butadiene Rubber for Cold Patching Applications. J. Mater. Civ. Eng. 2022, 34, 04022111. [Google Scholar] [CrossRef]
  25. Shan, J.; Jiang, W.; Huang, Y.; Yuan, D.; Liu, Y. Unmanned Aerial Vehicle (UAV)-Based Pavement Image Stitching without Occlusion, Crack Semantic Segmentation, and Quantification. IEEE Trans. Intell. Transp. Syst. 2024, 1–16. [Google Scholar] [CrossRef]
  26. Dan, H.-C.; Yang, D.; Liu, X.; Peng, A.-P.; Zhang, Z. Experimental investigation on dynamic response of asphalt pavement using SmartRock sensor under vibrating compaction loading. Constr. Build. Mater. 2020, 247, 118592. [Google Scholar] [CrossRef]
  27. Li, Y. Research on the Influencing Mechanism of Compaction of Asphalt Mixture and Changes in Internal Meso Structure and Mechanical Response. Ph.D. Thesis, Chang’an University, Xi’an, China, 2024. [Google Scholar]
  28. ASTM D5/D5M; Test Method for Penetration of Bituminous Materials. ASTM International: West Conshohocken, PA, USA, 2019.
  29. ASTM D36/D36M; Test Method for Softening Point of Bitumen (Ring-and-Ball Apparatus). ASTM International: West Conshohocken, PA, USA, 2014.
  30. ASTM D113; Test Method for Ductility of Bituminous Materials. ASTM International: West Conshohocken, PA, USA, 2017.
  31. ASTM D2171; Test Method for Viscosity of Asphalts by Vacuum Capillary Viscometer. ASTM International: West Conshohocken, PA, USA, 2018.
  32. ASTM D92; Test Method for Flash and Fire Points by Cleveland Open Cup Tester. ASTM International: West Conshohocken, PA, USA, 2005.
  33. ASTM D2042; Test Method for Solubility of Asphalt Materials in Trichloroethylene or Toluene. ASTM International: West Conshohocken, PA, USA, 2022.
  34. ASTM D70; Test Method for Density of Semi-Solid Bituminous Materials (Pycnometer Method). ASTM International: West Conshohocken, PA, USA, 2009.
  35. ASTM D2172; Test Methods for Quantitative Extraction of Asphalt Binder from Asphalt Mixtures. ASTM International: West Conshohocken, PA, USA, 2017.
  36. JTG F40-2004; Technical Specification for Construction of Highway Asphalt Pavements. Research Institute of Highway Ministry of Transport: Beijing, China, 2004.
  37. AASHTO T312; Method of Test for Preparing and Determining the Density of Asphalt Mixture Specimens by Means of the Superpave Gyratory Compactor. American Association of State Highway Transportation Officials: Washington, DC, USA, 2022.
  38. AASHTO PP 99; Practice for Preparation of Small Cylindrical Performance Test Specimens Using the Superpave Gyratory Compactor (SGC) or Field Cores. American Association of State Highway Transportation Officials: Washington, DC, USA, 2019.
  39. AASHTO TP 132; Method of Test for Determining the Dynamic Modulus for Asphalt Mixtures Using Small Specimens in the Asphalt Mixture Performance Tester (AMPT). American Association of State Highway Transportation Officials: Washington, DC, USA, 2019.
  40. Guo, Q.; Xu, H.; Wang, J.; Hang, J.; Wang, K.; Hu, P.; Li, H. Gradation Optimization Based on Micro-Analysis of Rutting Behavior of Asphalt Mixture. Coatings 2023, 13, 1965. [Google Scholar] [CrossRef]
  41. Yao, Y.; Li, J.; Liang, C.; Hu, X. Effect of Coarse Recycled Aggregate on Failure Strength for Asphalt Mixture Using Experimental and DEM Method. Coatings 2021, 11, 1234. [Google Scholar] [CrossRef]
  42. Li, X.; Gao, J.; Du, H.; Jia, J.; Zhao, X.; Ling, T. Relationship between the Void and Sound Absorption Characteristics of Epoxy Porous Asphalt Mixture Based on CT. Coatings 2022, 12, 328. [Google Scholar] [CrossRef]
  43. Cundall, P.A.; Strack, O.D.L. A discrete numerical model for granular assemblies. Géotechnique 1979, 29, 47–65. [Google Scholar] [CrossRef]
  44. Zhou, X.; Chen, S.; Ge, D.; Jin, D.; You, Z. Investigation of asphalt mixture internal structure consistency in accelerated discrete element models. Constr. Build. Mater. 2020, 244, 118272. [Google Scholar] [CrossRef]
  45. Chen, J.; Huang, B.; Chen, F.; Shu, X. Application of discrete element method to Superpave gyratory compaction. Road Mater. Pavement Des. 2012, 13, 480–500. [Google Scholar] [CrossRef]
  46. Yi, X.; Chen, H.; Wang, H.; Tang, Z.; Yang, J.; Wang, H. Cross-Functional Test to Explore the Determination Method of Meso-Parameters in the Discrete Element Model of Asphalt Mixtures. Materials 2021, 14, 5786. [Google Scholar] [CrossRef] [PubMed]
  47. Torquato, S.; Truskett, T.M.; Debenedetti, P.G. Is Random Close Packing of Spheres Well Defined? Phys. Rev. Lett. 2000, 84, 2064–2067. [Google Scholar] [CrossRef]
  48. Zaccone, A. Explicit Analytical Solution for Random Close Packing in d = 2 and d = 3. Phys. Rev. Lett. 2022, 128, 028002. [Google Scholar] [CrossRef] [PubMed]
  49. Finney, J.L. Random packings and the structure of simple liquids. I. The geometry of random close packing. Proc. R. Soc. London, Ser. A Math. Phys. Sci. 1970, 319, 479–493. [Google Scholar] [CrossRef]
  50. Kamien, R.D.; Liu, A.J. Why is Random Close Packing Reproducible? Phys. Rev. Lett. 2007, 99, 155501. [Google Scholar] [CrossRef]
  51. Karayiannis, N.C.; Laso, M. Dense and Nearly Jammed Random Packings of Freely Jointed Chains of Tangent Hard Spheres. Phys. Rev. Lett. 2008, 100, 050602. [Google Scholar] [CrossRef]
  52. Wilken, S.; Guerra, R.E.; Levine, D.; Chaikin, P.M. Random Close Packing as a Dynamical Phase Transition. Phys. Rev. Lett. 2021, 127, 038002. [Google Scholar] [CrossRef]
  53. Liu, Y.; Su, P.; Li, M.; Yao, H.; Liu, J.; Xu, M.; Zhou, X.; You, Z. How to Achieve Efficiency and Accuracy in Discrete Element Simulation of Asphalt Mixture: A DRF-Based Equivalent Model for Asphalt Sand Mortar. Adv. Civ. Eng. 2020, 2020, 8855409. [Google Scholar] [CrossRef]
  54. Roozbahany, E.G.; Partl, M.N. Investigation of asphalt joint compaction using discrete element simulation. Road Mater. Pavement Des. 2019, 20, 1722–1734. [Google Scholar] [CrossRef]
  55. Liu, Y.; Dai, Q.; You, Z. Viscoelastic Model for Discrete Element Simulation of Asphalt Mixtures. J. Eng. Mech. 2009, 135, 324–333. [Google Scholar] [CrossRef]
  56. Cai, W.; McDowell, G.R.; Airey, G.D. Discrete element visco-elastic modelling of a realistic graded asphalt mixture. Soils Found. 2014, 54, 12–22. [Google Scholar] [CrossRef]
Figure 1. Gradation of the AC-13 asphalt mixture.
Coatings 14 01238 g001
Figure 2. Preparation of small-size AC-13 specimens: (a) Coring of larger specimens; (b) specimens with a radius of 38 mm and a height of 100 mm were obtained.
Coatings 14 01238 g002
Figure 3. Creation and placement of coarse aggregates and smart aggregates. (a) Creation of 3D models and surface meshes for aggregates and intelligent aggregates; (b) establishment of Clump in PFC software; (c) placement of aggregates and smart aggregates.
Coatings 14 01238 g003
Figure 4. Placement of asphalt mortar. (a) Placement of mortar particles; (b) equilibrium of the discrete element model of the asphalt mixture specimen.
Coatings 14 01238 g004
Figure 5. Simplified viscoelastic contact model for mortar particles.
Coatings 14 01238 g005
Figure 6. DEM models of asphalt mixtures with smart aggregates of different sizes: (a) Specimens with smart aggregates of 10 mm × 10 mm × 10 mm; (b) specimens with smart aggregates of 15 mm × 15 mm × 10 mm; (c) specimens with smart aggregates of 20 mm × 20 mm × 10 mm.
Coatings 14 01238 g006
Figure 7. Establishment process for the void distribution contour map in the longitudinal section: (a) Longitudinal section of the asphalt mixture DEM model; (b) a “Measure” sphere array that fills the entire longitudinal section; (c) analysis of the void ratio within each measure sphere.
Coatings 14 01238 g007
Figure 8. Void distribution contour map of the asphalt mixture in the longitudinal section.
Coatings 14 01238 g008
Figure 9. Measured and simulated dynamic modulus of asphalt mixture specimens
Coatings 14 01238 g009
Figure 10. Void distribution contour maps of asphalt mixtures embedded with smart aggregates of different sizes: (a) Void distribution contour map for smart aggregates of 10 mm × 10 mm × 10 mm; (b) void distribution contour map for smart aggregates of 15 mm × 15 mm × 10 mm; (c) void distribution contour map for smart aggregates of 20 mm × 20 mm × 10 mm.
Coatings 14 01238 g010
Figure 11. Dynamic modulus at 25 °C for asphalt mixture specimens with and without embedded smart aggregates.
Coatings 14 01238 g011
Figure 12. Longitudinal strain rate contour map of specimens at peak load state: (a) Specimens without embedded smart aggregates; (b) specimens with embedded smart aggregates of 10 mm × 10 mm × 10 mm; (c) specimens with embedded smart aggregates of 15 mm × 15 mm × 10 mm; (d) specimens with embedded smart aggregates of 20 mm × 20 mm × 10 mm
Coatings 14 01238 g012aCoatings 14 01238 g012b
Figure 13. Transverse strain rate contour map of specimens at peak load state: (a) Specimens without embedded smart aggregates; (b) specimens with embedded smart aggregates of 10 mm × 10 mm × 10 mm; (c) specimens with embedded smart aggregates of 15 mm × 15 mm × 10 mm; (d) specimens with embedded smart aggregates of 20 mm × 20 mm × 10 mm
Coatings 14 01238 g013aCoatings 14 01238 g013b
Table 1. Conventional properties of the asphalt binder [27].
Test parametersResultsTesting methods
Penetration (25 °C, 100 g, 5 s, 0.1 mm)68.1ASTM D5/D5M [28]
Softening point (°C)49.8ASTM D36/36M [29]
Ductility (5 cm/min, 15 °C, cm)>100ASTM D113 [30]
Ductility (5 cm/min, 10 °C, cm)53ASTM D113 [30]
60 °C dynamic viscosity (Pa·s)195ASTM D2171 [31]
Flashpoint (°C)295ASTM D92 [32]
Solubility (trichloroethylene, %)99.5ASTM D2042 [33]
Density (g/cm3)1.031ASTM D70 [34]
Table 2. Basic properties of the asphalt mixture [27].
Test ItemsBulk Density (g/cm3)Air Voids (%)Water Absorption (%)Marshall Stability (kN)Flow Value (mm)
Results2.4654.60.8110.954.45
Table 3. Viscoelastic parameters of asphalt mortar (140 °C, 0.5 Hz).
Viscoelastic ParametersE1 (GPa)η1 (MPa·s)E2 (MPa)η2 (MPa·s)
Results21.830 ± 0.320.544 ± 0.085.555 ± 0.120.182 ± 0.04
Table 4. Viscoelastic parameters of asphalt mortar (25 °C, 0.5 Hz).
Viscoelastic ParametersE1 (GPa)η1 (MPa·s)E2 (MPa)η2 (MPa·s)
Results125.196 ± 0.37108.568 ± 0.0580.752 ± 0.220.856 ± 0.06
Disclaimer/Publisher’s Note: The statements, opinions and data contained in all publications are solely those of the individual author(s) and contributor(s) and not of MDPI and/or the editor(s). MDPI and/or the editor(s) disclaim responsibility for any injury to people or property resulting from any ideas, methods, instructions or products referred to in the content.

