Article

In Situ Measurement of the Machining State in Small-Diameter Drilling by Acoustic Emission Sensing

1
Department of Mechanical Engineering, Saitama Institute of Technology, 1690 Fusaiji, Fukaya, Saitama 369-0293, Japan
2
Institute of Physical and Chemical Research (RIKEN), 2-1 Hirosawa, Wako, Saitama 351-0198, Japan
Coatings 2024, 14(2), 193; https://doi.org/10.3390/coatings14020193
Submission received: 21 December 2023 / Revised: 25 January 2024 / Accepted: 31 January 2024 / Published: 1 February 2024
(This article belongs to the Special Issue New Advances in In Situ Measurements of Friction and Wear Phenomena)

Abstract

:
In drilling small holes with diameters of 1 mm or less, minute clogging and twining of chips or the adhesion of the workpiece material can become factors in causing breakages of the drill bit; moreover, it can be difficult to identify the machining state. Acoustic emission (AE) sensing is a nondestructive inspection technique that measures the elastic-stress waves that are generated when a material is deformed and fractured. AE sensing permits highly sensitive measurements to be made without changing the rigidity of the experimental system, unlike force sensing of cutting resistance, etc. In the present study, attempts were made to identify the machining state and tool wear, and to predict abnormalities in small-diameter drilling by using the change in the frequency of AE signal waveforms arising from deformation and fracture. It was shown that it is possible to predict the breakage of the drill bit by detecting high-frequency AE signals at about 1 MHz, caused by the adhesion of the workpiece material. In addition, a correlation map of the AE frequency spectrum for identifying the machining state in a drilling operation is suggested.

1. Introduction

On the basis of the Industry 4.0 (Industrie 4.0) initiative, launched by the German government in 2011 [1], the Japanese government is currently promoting the science and technology policy Society 5.0 (a fifth society following the hunting, agricultural, industrial, and information societies) [2]. In addition, digital transformation (DX) is being promoted as a means of improving business processes; transforming products, services, and business models; and changing the organization, culture, and climate of corporations to establish a competitive advantage [3,4]. To realise Society 5.0 and promote DX, many types of information (big data) will need to be acquired from physical (reality) space through the use of sensors or the internet of things (IoT: the idea of automatic recognition, automatic control, remote measurement and operation, etc., by means of internet communications, etc., with various objects being equipped with communication functions) [5]. Also, artificial intelligence (AI) is essential for analysing big data and feeding back high-added value information to real space [6]. In this context, sensing technology plays an important role in acquiring information from real space and in establishing a basis for evaluation and decision-making.
In the fields of manufacturing and processing, there is an urgent need to realise intelligent machine tools and smart factories; this requires highly sensitive and accurate sensing technology. In addition, as machine systems and elemental parts become miniaturized, the demand for monitoring of machining status in ultraprecision machining and micromachine tools is increasing year by year. The miniaturization of machine tools and products results in extremely small workpieces and machining dimensions, making it difficult to identify and evaluate the machining state by using conventional methods, such as measurements of cutting forces or vibrations.
The establishment of a technology for understanding and identifying the state of a machining operation is considered to be key to the development of ultraprecision and microfabrication technologies and, thereby, providing a breakthrough towards the IoT and DX in machine tools. Consequently, acoustic emission (AE) sensing, a technique that is highly sensitive to deformation and fracture phenomena, and which can acquire data containing a great deal of information on these phenomena, can be used for in situ measurements of machining conditions. AE sensing is a technology that uses AE transducers to measure the elastic-stress waves generated by the release of previously stored strain energy during material deformation and fracture in the form of AE signals [7] that can be analysed and characterized for evaluation and diagnosis.
Numerous studies have been conducted in which AE sensing was used to monitor conditions during various machining operations, such as turning [8,9,10,11], milling [12,13,14,15], reaming [16], honing [17,18], grinding [19,20,21,22,23], or polishing [24,25,26]. Several AE sensing studies have also been reported for drilling [27,28,29]; for example, Gómez and Ferrari described correlations between various AE parameters and thrust force and tool wear [30,31], whereas Patra reported the usefulness of an artificial-neural-network model based on wavelet-packet features for evaluating flank wear [32]. Furthermore, for the evaluation of flank wear of small-diameter drill bits, deep-feature-distribution modelling (a method for image-level anomaly detection and anomaly segmentation in time-series signal analysis) has been proposed by Nakano et al. [33]. In addition to these reports, studies on AE sensing by using AI, machine learning, or deep learning are also being actively conducted [34,35,36,37]. Consequently, AE sensing studies are becoming increasingly complex.
The continuous AE waves generated by the interaction between a tool and a workpiece during machining contain a variety of AE sources and can be highly complex [8]. To avoid the need to use advanced analysis methods, it is important to link machining phenomena to various features of the corresponding AE signals. Previous studies [38,39] have demonstrated the possibility of identifying tribological phenomena (friction and wear phenomena) from the features of AE signal. Therefore, this study examined the use of AE sensing for in situ measurements of the machining state in small-diameter drilling. In drilling holes with diameters of 1 mm or less, minute clogging and twining of chips or the adhesion of the workpiece material can become factors in initiating the breakage of the drill bit. The identification of the buried and invisible machining state is likely to be a difficult problem. Here, we report our findings from attempts to measure the machining state in small-diameter drilling in situ, to permit the identification of the progress of tool wear and to predict tool breakage by monitoring changes in the frequency of AE signal waveforms caused by deformation and fracture modes. For the first time, it was shown that the state of the adhesion of the workpiece material and micro-chipping of the cutting edge during the machining of small-diameter drill bits are both linked to the AE signal frequency, and a correlation map was constructed to guide in situ measurements using AE sensing.

2. Materials and Methods

Figure 1 shows the appearance of the experimental setup with a small automatic drilling machine that was used in this study. Most of the studies were conducted by using uncoated high-speed steel drill bits with a diameter of 1.0 mm, although some experiments were also performed by using similar drill bits with a titanium nitride (TiN) coating. The workpiece was a block of aluminium alloy (A6063) measuring 10 × 10 × 25 mm. The experiments were performed by drilling holes to a depth of 9 mm at 2.5 mm intervals in this workpiece. The step cutting time was set to 0.5 s, and the step return time was set to 0.7 s. Three rows with nine holes per row were drilled in each workpiece. All the experiments were performed by wet cutting with a mineral-oil-based lubricant applied to the surface of the workpiece. The experimental conditions are listed in Table 1.
A wideband-type AE sensor (AE-900M-WB: NF Corp., Yokohama, Japan) was used to monitor changes in the AE signal, amplitude, and frequency spectrum with changes in the machining state. As shown in Figure 1, the AE sensor was installed at the centre of the underside of the workpiece by using a jig. Because of the depth of the drilling process, the AE sensor could be placed on the underside of the workpiece to provide uniform measurements of the AE waves generated and propagated when each hole was drilled. The workpiece was mechanically fixed to the jig along with the AE sensor, which was then clamped with a vice. The output signal from the AE sensor was amplified by a preamplifier (AE-912: NF Corp., Yokohama, Japan) and then subjected to high-pass filtration at 50 kHz by using a discriminator (AE9922: NF Corp.) to suppress the influence of background noise signals. The resulting signal was then amplified again by a main amplifier in the discriminator. In this study, the AE mean value (corresponding to the change in AE signal amplitude) and the AE signal waveforms were recorded by using a data logger and a high-speed waveform digitizer, respectively. The AE signal waveforms were subjected to a fast Fourier transform to identify changes in the frequency spectrum of the AE signal waveforms.

3. Results and Discussion

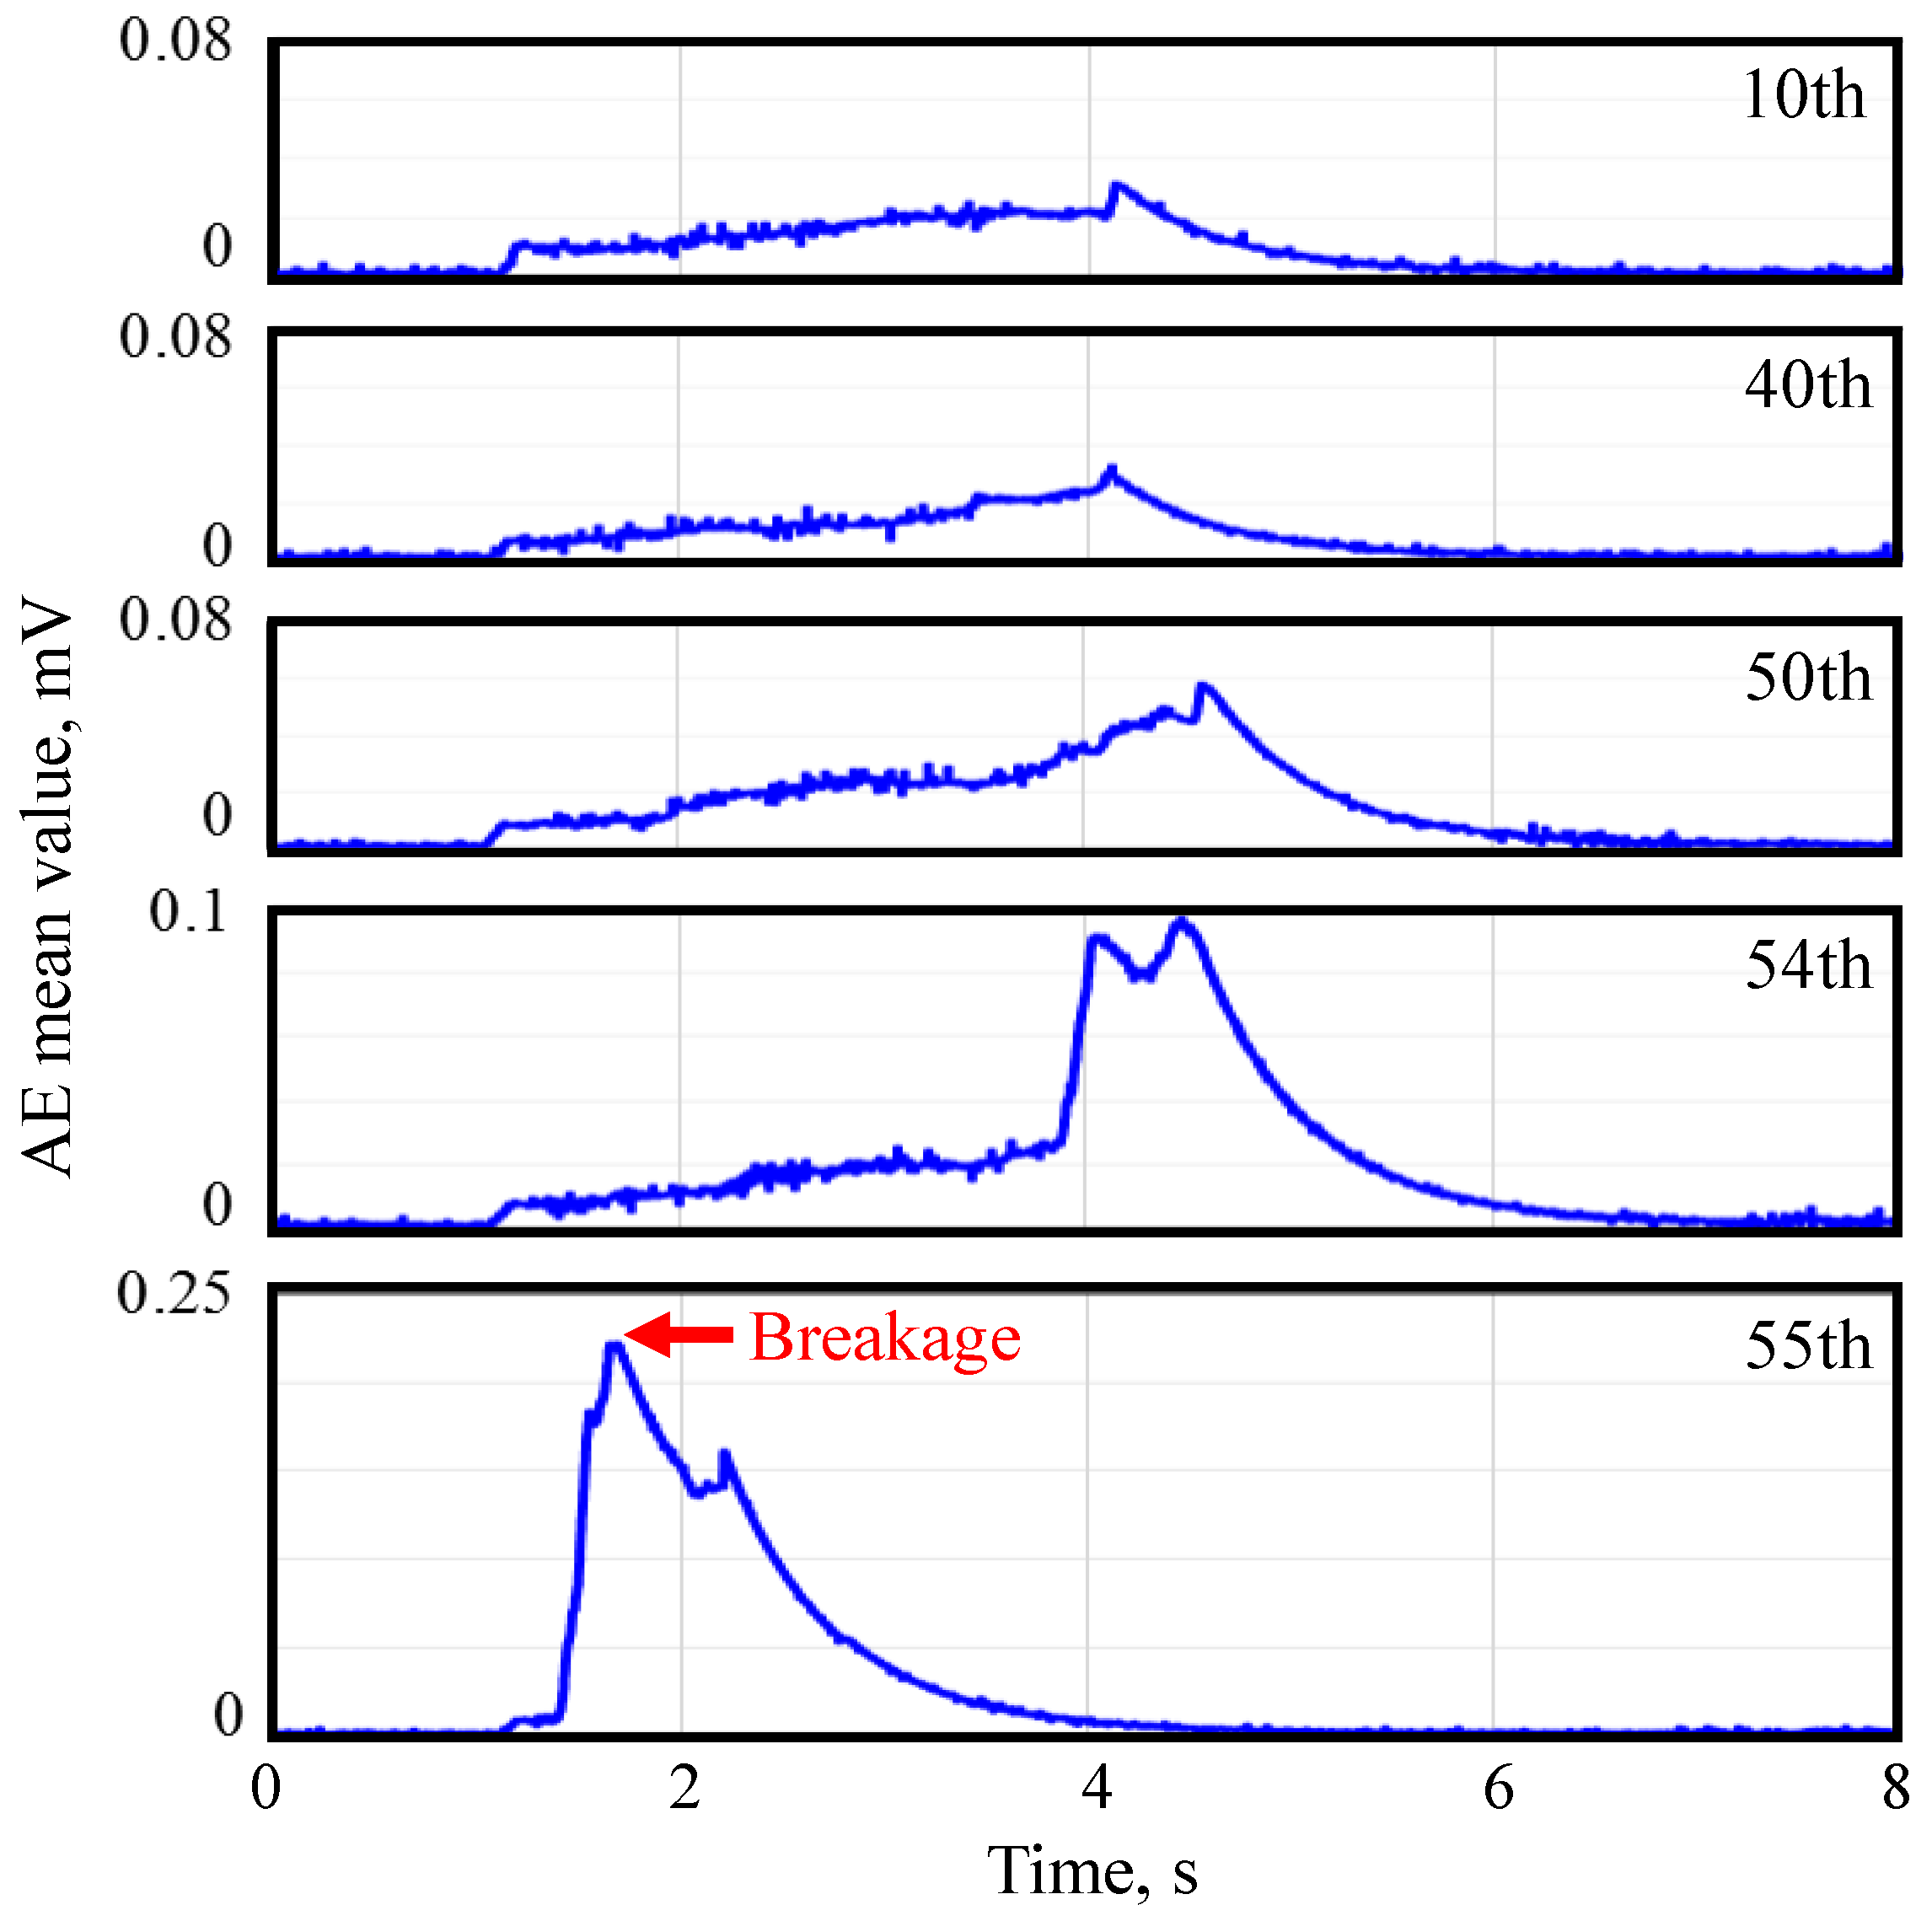
3.1. AE Signal Changes and Machining State in Uncoated Drill Bits

Figure 2 shows typical changes in the AE mean value with the number of holes drilled in a machining experiment using an uncoated drill bit. Although the spindle rotation and feed motion started between 0 and 1 s after the start of AE signal measurement, their noise signals had no influence. From 1 s onwards, the AE mean value increased slightly due to the generation of AE waves by contact and friction resulting from the biting of the drill bit. In Figure 2, the AE waves showed similar changes up to the 40th drilling, after which the AE mean value increased until, finally, the drill bit broke during the 55th drilling. Therefore, the mean AE value remained at a similar level after the start of drilling up to a certain point, and then tended to increase in the latter half of the experiment. At the 54th drilling, just before the drill bit broke, the AE mean value increased significantly at about 4 s into the drilling. Normally, the AE mean value increases slowly as drilling progresses. This is considered to be an effect of the increase in the contact area between the tool and the workpiece and the decrease in the distance between the cutting point and the AE sensor. In the case where the drill bit broke, the AE mean value increased steeply immediately after the start of drilling. A slight change due to contact of a drill bit was observed just before the sharp rise, which indicated that the breakage occurred in the early stages of the biting of the drill bit.
Figure 3 shows the result of a frequency analysis of the AE signal waveforms detected at the corresponding number of drilling cycles. In addition to the increase in the AE signal intensity, the intensity of the frequency peak at about 1 MHz (red arrows) increased as the number of drilling cycles increased. In particular, it should be noted that this high-frequency component was detected from the 40th hole drilled onwards, whereas no difference in the AE mean value was observed in this region. As AE signal waveforms with a high-frequency component are often detected before the breakage of the drill bit, it is considered that it might be possible to predict the breakage of the drill bit by using this high-frequency component. The fluctuation in the AE signal amplitude and the increase in the level in the period from 2 s to 4 s in Figure 2 can be attributed to an instability in the machining state due to adhesion between the cutting edge of the bit and the surfaces of the workpiece [39,40].
Figure 4 shows the results of microscopic observations of the cutting edge of an unused drill bit and the broken drill bit after the 55th drilling. A comparison of these micrographs shows that micro-chipping occurred on the bit’s cutting edge, and a wide area of the adhesion of the work material was observed on the bit’s rake face. We believe that the chipping of the cutting edge reduced sharpness and caused the adhesion of the workpiece material; this adhesion then caused abnormalities during machining, resulting in breakage. Adhesive friction marks were also observed on the chipped surface of the bit.
Next, we will consider the frequency spectrum of the AE signal waveforms. Previous fundamental studies [38,39] have shown that a peak appears in the high-frequency region (around 1 MHz) of the frequency spectrum of the AE signal waveforms when adhesion occurs. Also, because the amplitude of the burst-type AE signal that is detected on adhesion increases with increasing adhesion [41], the influence of adhesion appears to have been stronger at the 50th drilling than at the 40th drilling (Figure 3). Furthermore, from the 50th drilling onwards, frequency peaks also occurred in the middle-frequency range (between 0.15 and 0.4 MHz). This is similar to the features of the frequency spectra of AE signals detected during crack formation in fatigue wear [42] and is also characteristic of the frequency spectrum of the AE signal waveform observed when a coating peels off from a rolling bearing [43]. Therefore, the changes in the frequency spectrum are considered to capture the generation of micro-chipping (loss of sharpness of the drill bit) and peeling phenomenon during chip ejection accompanying the adhesion of chips to the rake face of the bit (which accelerates tool wear).

3.2. AE Signal Changes and Machining State of Coated Drills

Figure 5 shows the results of a frequency analysis of the AE signal waveforms for various numbers of drilling cycles in machining experiment using a TiN-coated bit. No feature was observed in the high-frequency component above 0.5 MHz up to the fifth drilling, but a frequency peak near 1 MHz (red arrows) was detected in the sixth and seventh drillings. In addition, frequency peaks in the middle-frequency range (between 0.15 and 0.4 MHz), caused by micro-chipping, increased in intensity at the sixth drilling. In this experiment, the drill bit suddenly broke at the seventh drilling; this was attributed to adhesion that had developed during the sixth and seventh drillings, as mentioned in Section 3.1. The features of the frequency spectrum of the AE signal waveforms showed a similar trend regardless of the presence or absence of a coating on the small-diameter drill bit.
Figure 6 shows the results of microscopic observations of the cutting edges of the unused drill bit and the broken bit after the seventh drilling. From this comparison, adhesion of the workpiece material to the rake face of the bit can be clearly seen. Compared with the micrograph in Figure 4, local thick adhesion can be seen, and this adhesion is likely to have been the cause of the coated drill bit breaking at an earlier stage than the uncoated bit.

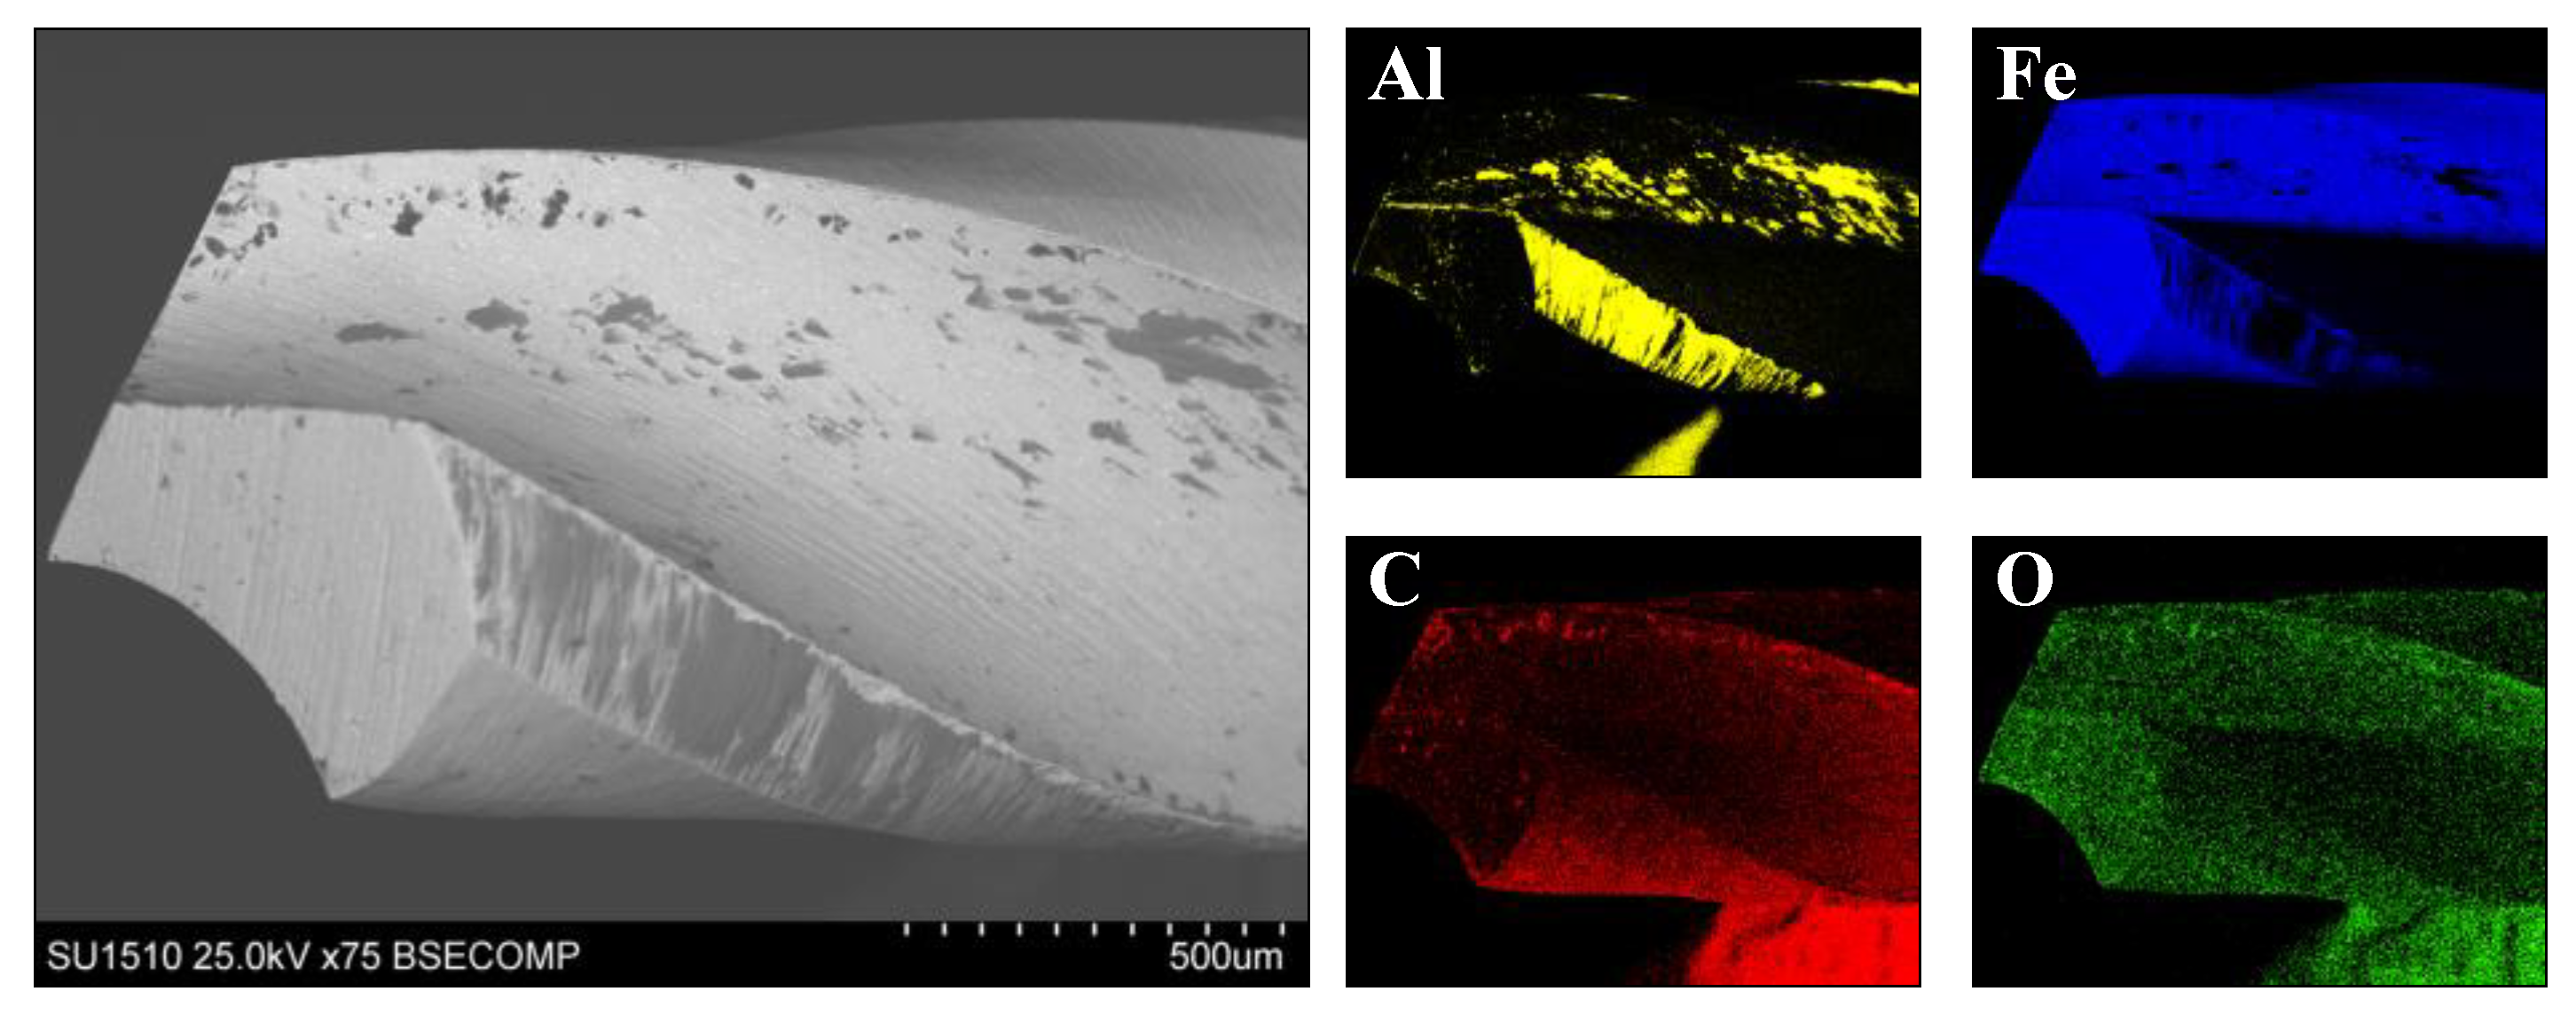
3.3. Detailed Surface Analysis of Drill Bits by Scanning Electron Microscopy–Energy Dispersive X-ray Spectroscopy

To examine the state of damage of the drill bit and the adhesion state of the work material in detail, a scanning electron microscopy–energy dispersive X-ray spectroscopy (SEM-EDS) analysis was performed. Figure 7 shows the SEM images and the corresponding EDS elemental mapping images for the uncoated drill bit, and Figure 8 shows the corresponding images for the TiN-coated drill bit: these are the drill bits that broke at the 55th and the 7th drilling, respectively, corresponding to Figure 4 and Figure 6. Figure 9 shows a comparison of the EDS spectra for (a) the uncoated drill bit and (b) the TiN-coated drill bit after breakage, corresponding to Figure 7 and Figure 8.
In the case of the uncoated drill bit, as shown in Figure 9a, a component of aluminium in the workpiece material was detected in addition to the component originally present in the high-speed steel. The EDS elemental mapping image of the aluminium component in Figure 8 shows thick nonuniform adhesion of the work material on the cutting edge and rake face of the drill bit. In the case of the TiN-coated drill bit, Figure 9b shows that, in addition to titanium and nitrogen, which were the main components of the TiN coating, and the components of the base material (high-speed steel), an aluminium component was detected, but in a smaller amount than that in Figure 9a. Also, From the EDS elemental mapping image of the aluminium component in Figure 8, it can be seen that aluminium adhered to the rake face of the drill bit in a light and uniform manner. Therefore, as described above, it was confirmed that the difference in the frictional properties of the drill bit with and without a coating affected the degree of adhesion of the workpiece material [44,45]. The difference in the degree of adhesion is evidenced in the intensity of the high-frequency component of the AE signal at about 1 MHz, caused by adhesion, as seen by comparing Figure 3 and Figure 5.
Furthermore, in the SEM images in Figure 7 and Figure 8, micro-chipping can be clearly observed on the cutting edge. In the micro-chipped areas in the TiN-coated drill bit, the EDS elemental mapping images in Figure 8 show that the titanium and nitrogen components of the coating have disappeared, and iron, the main component of the base material, can be seen. Also, the micro-chipped area in the uncoated drill bit is more contiguous than that in the TiN-coated drill bit. The difference in the degree of micro-chipping is evidenced in the intensity of the middle-frequency component between 0.15 and 0.4 MHz of the AE signal, caused by crack formation, as seen by a comparison of Figure 3 and Figure 5.
As described above, a detailed surface analysis of the drill bits by SEM-EDS provided evidence of the relationship between the state of damage of the drill bits and AE frequency. This suggests that it should be possible to measure the state of damage of drill bits, i.e., the machining state, in situ by measurements of the AE frequency.

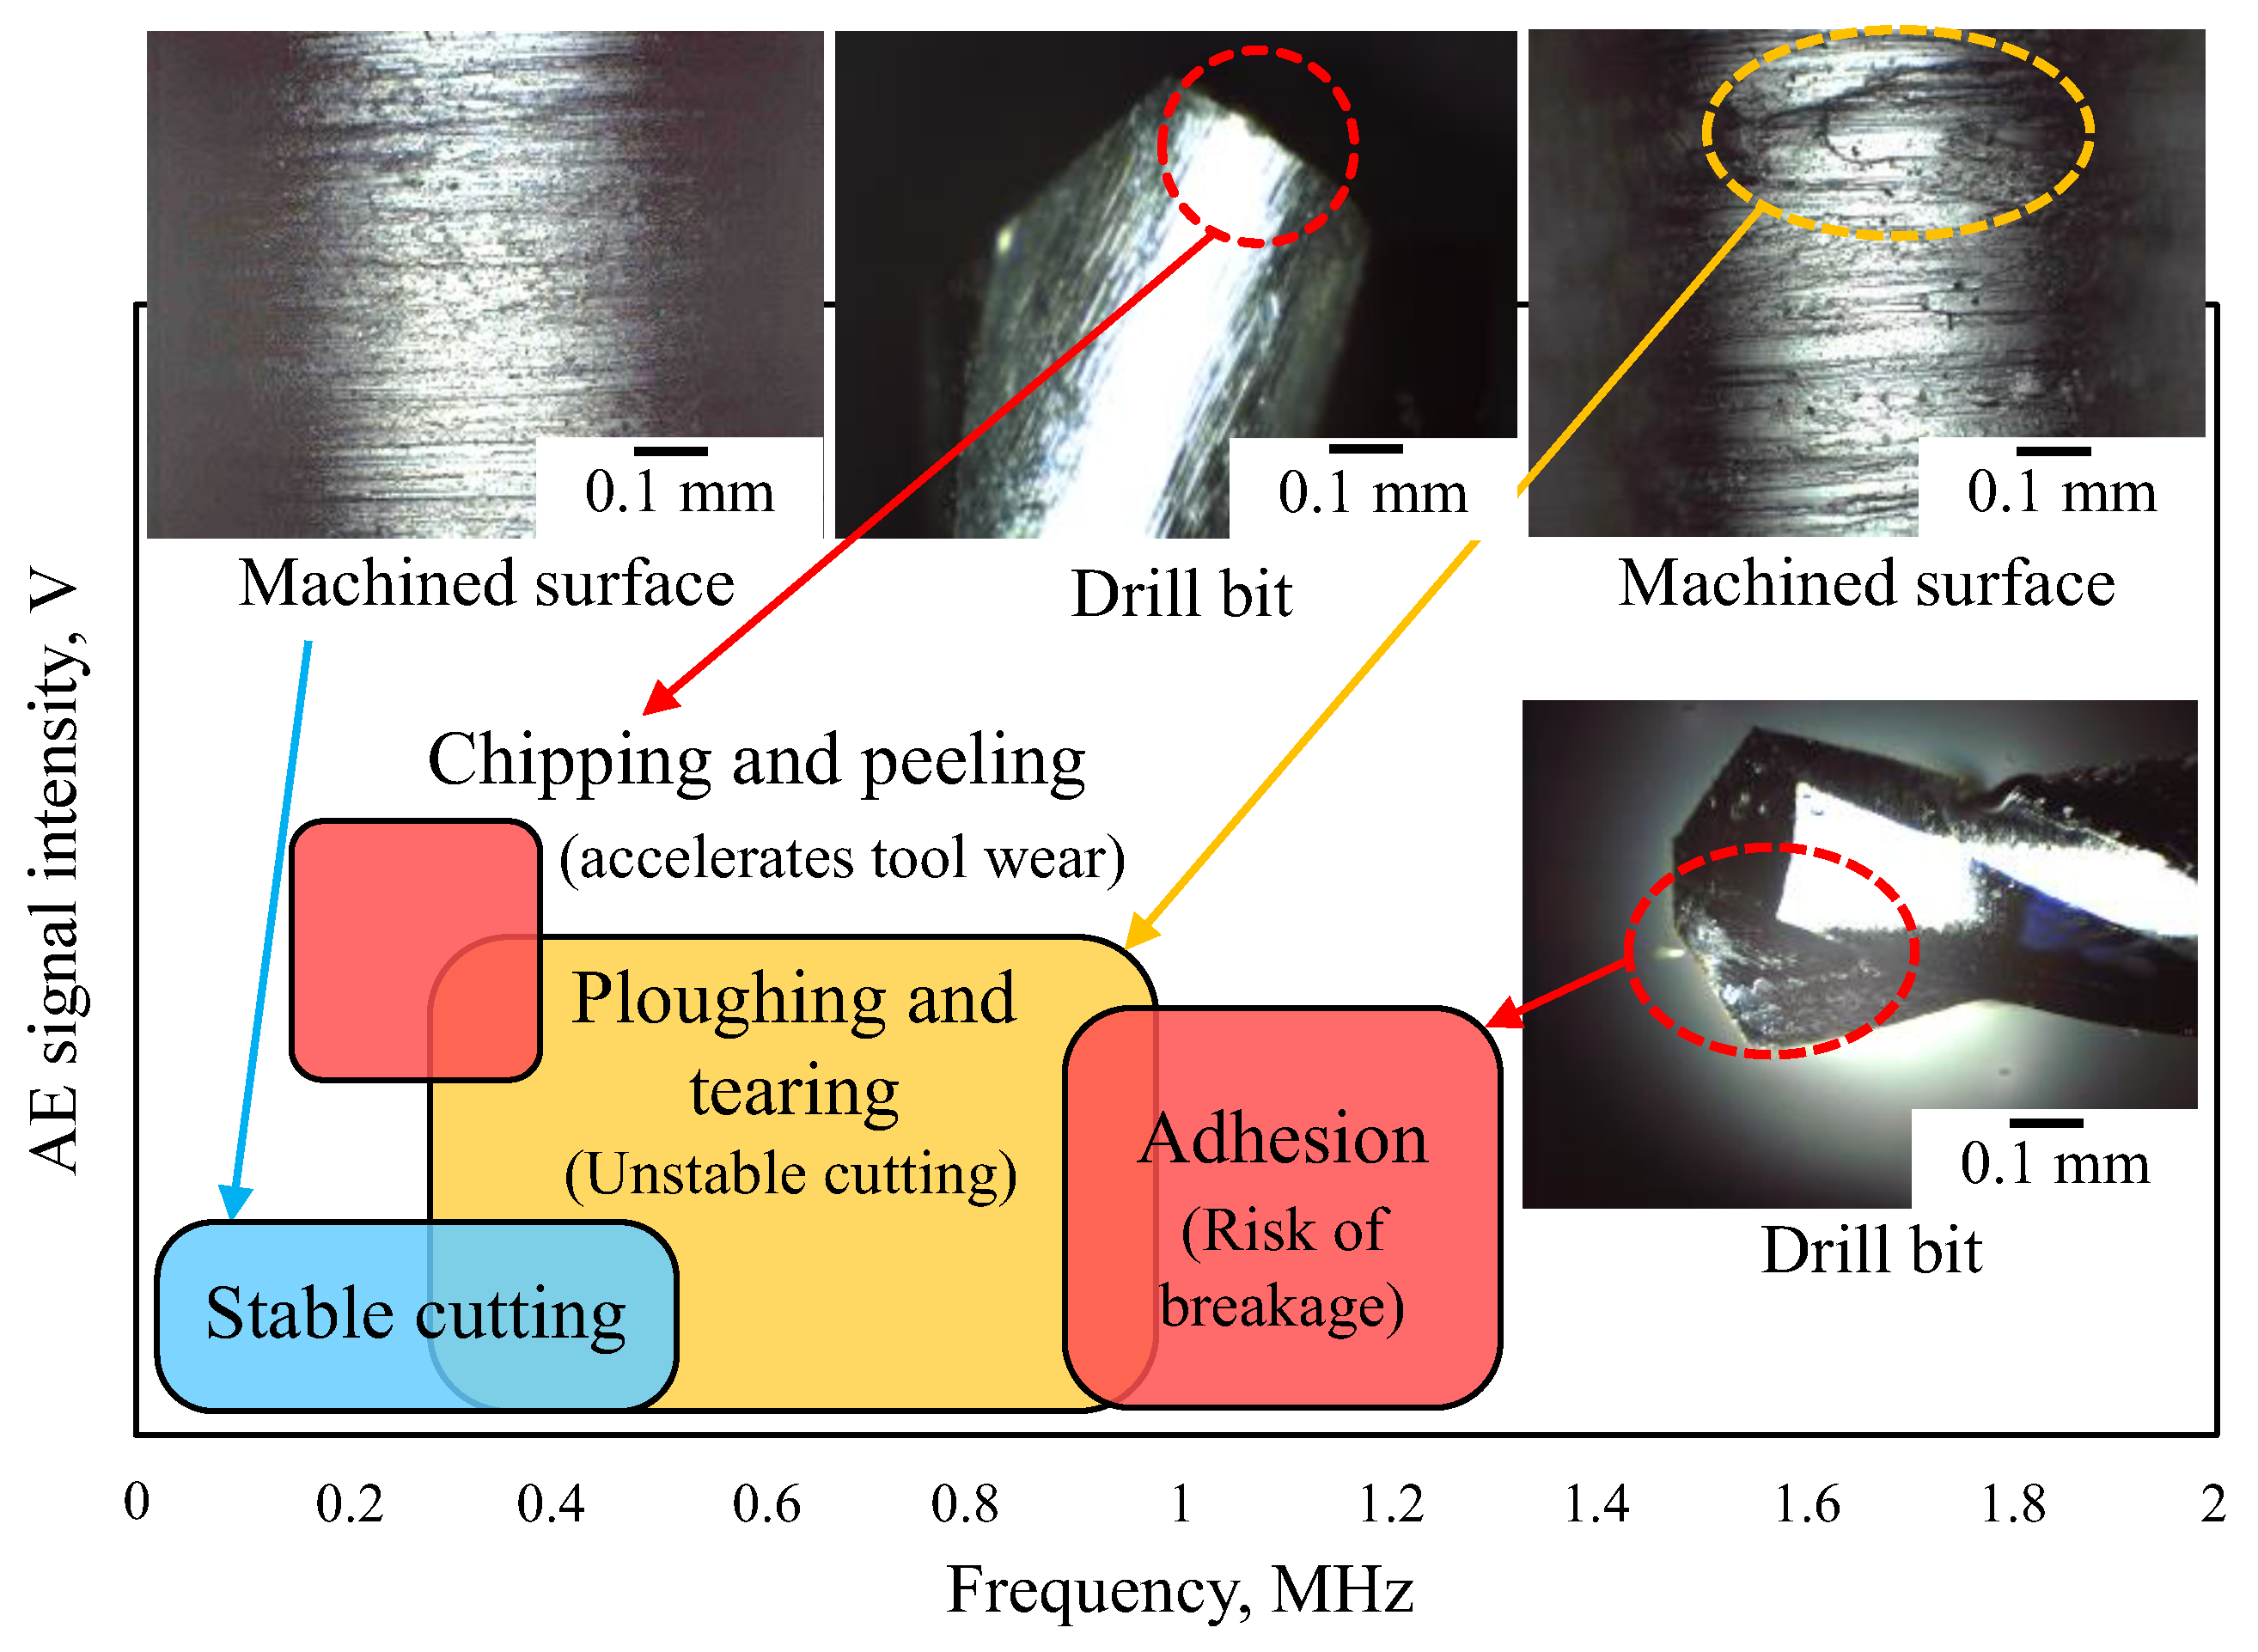
3.4. Correlation Map Based on AE Frequency for In Situ Measurements of the Machining State in Small-Diameter Drilling

Based on the results of this experiment, the following features of the AE signal frequency spectrum are considered to be useful in identifying an abnormal machining state of small-diameter drill bits.
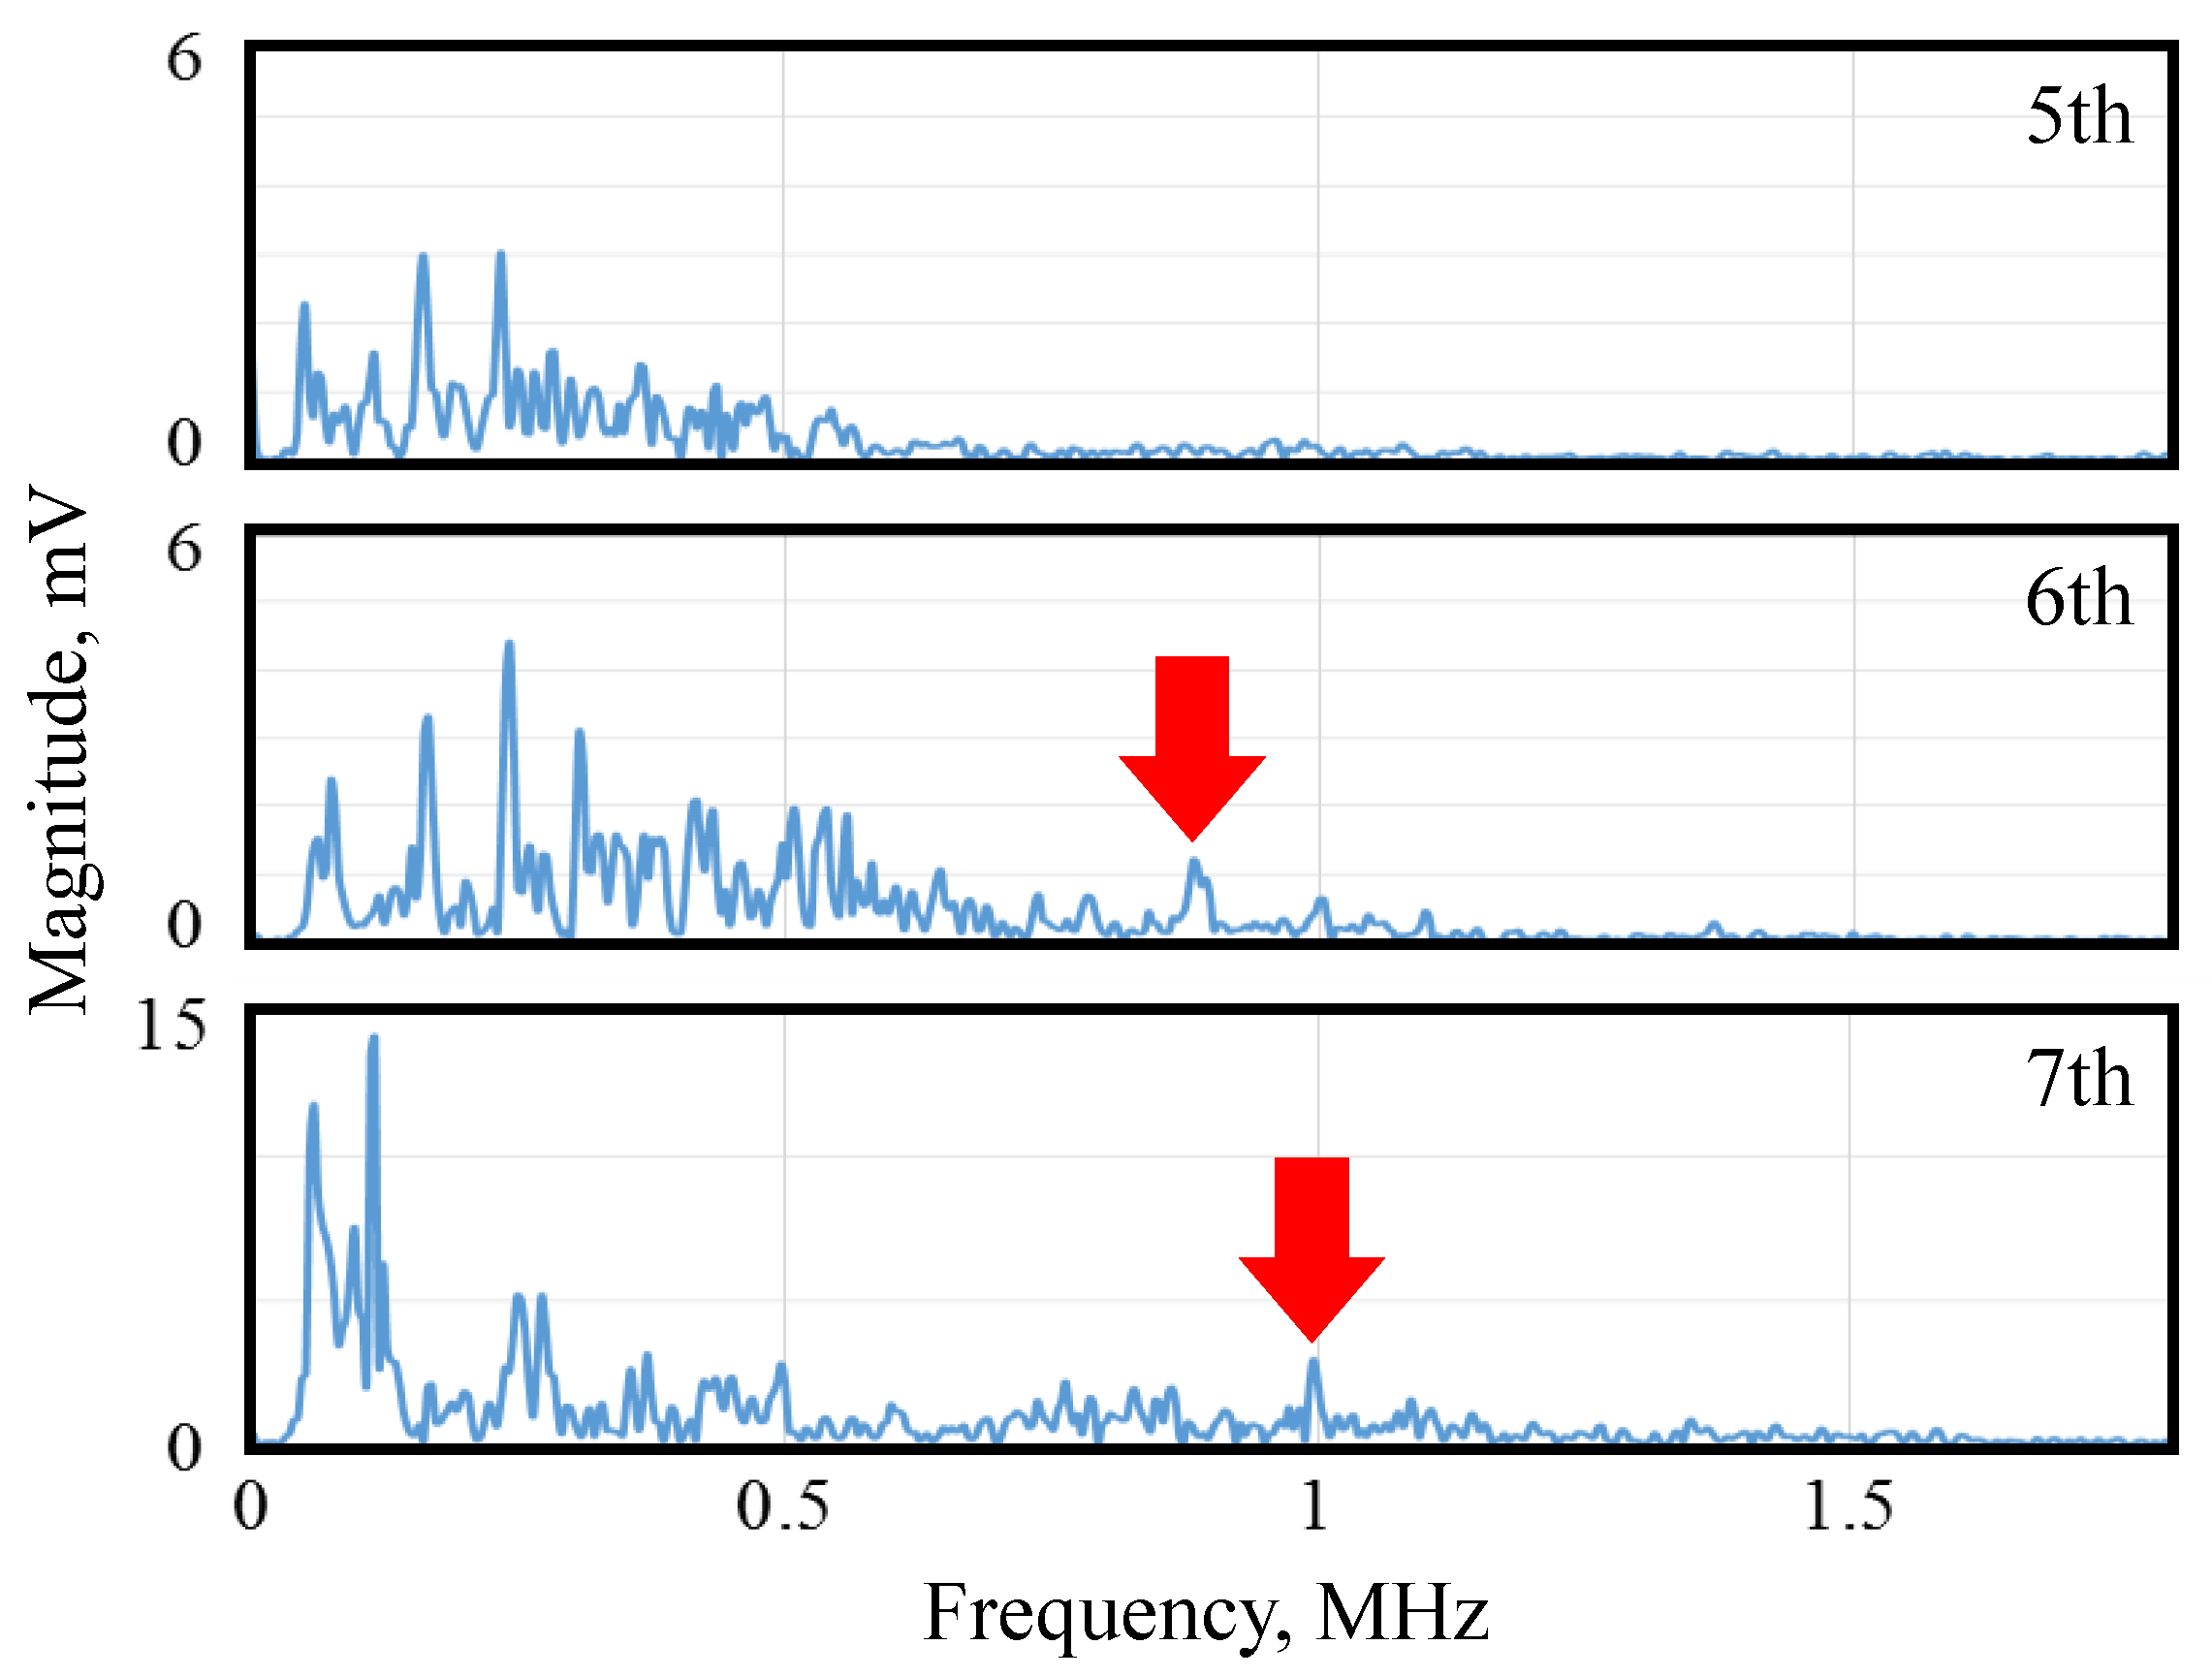
  • Below 0.5 MHz: caused by cutting phenomena (increases due to the occurrence of the ploughing and tearing of the machined surfaces).
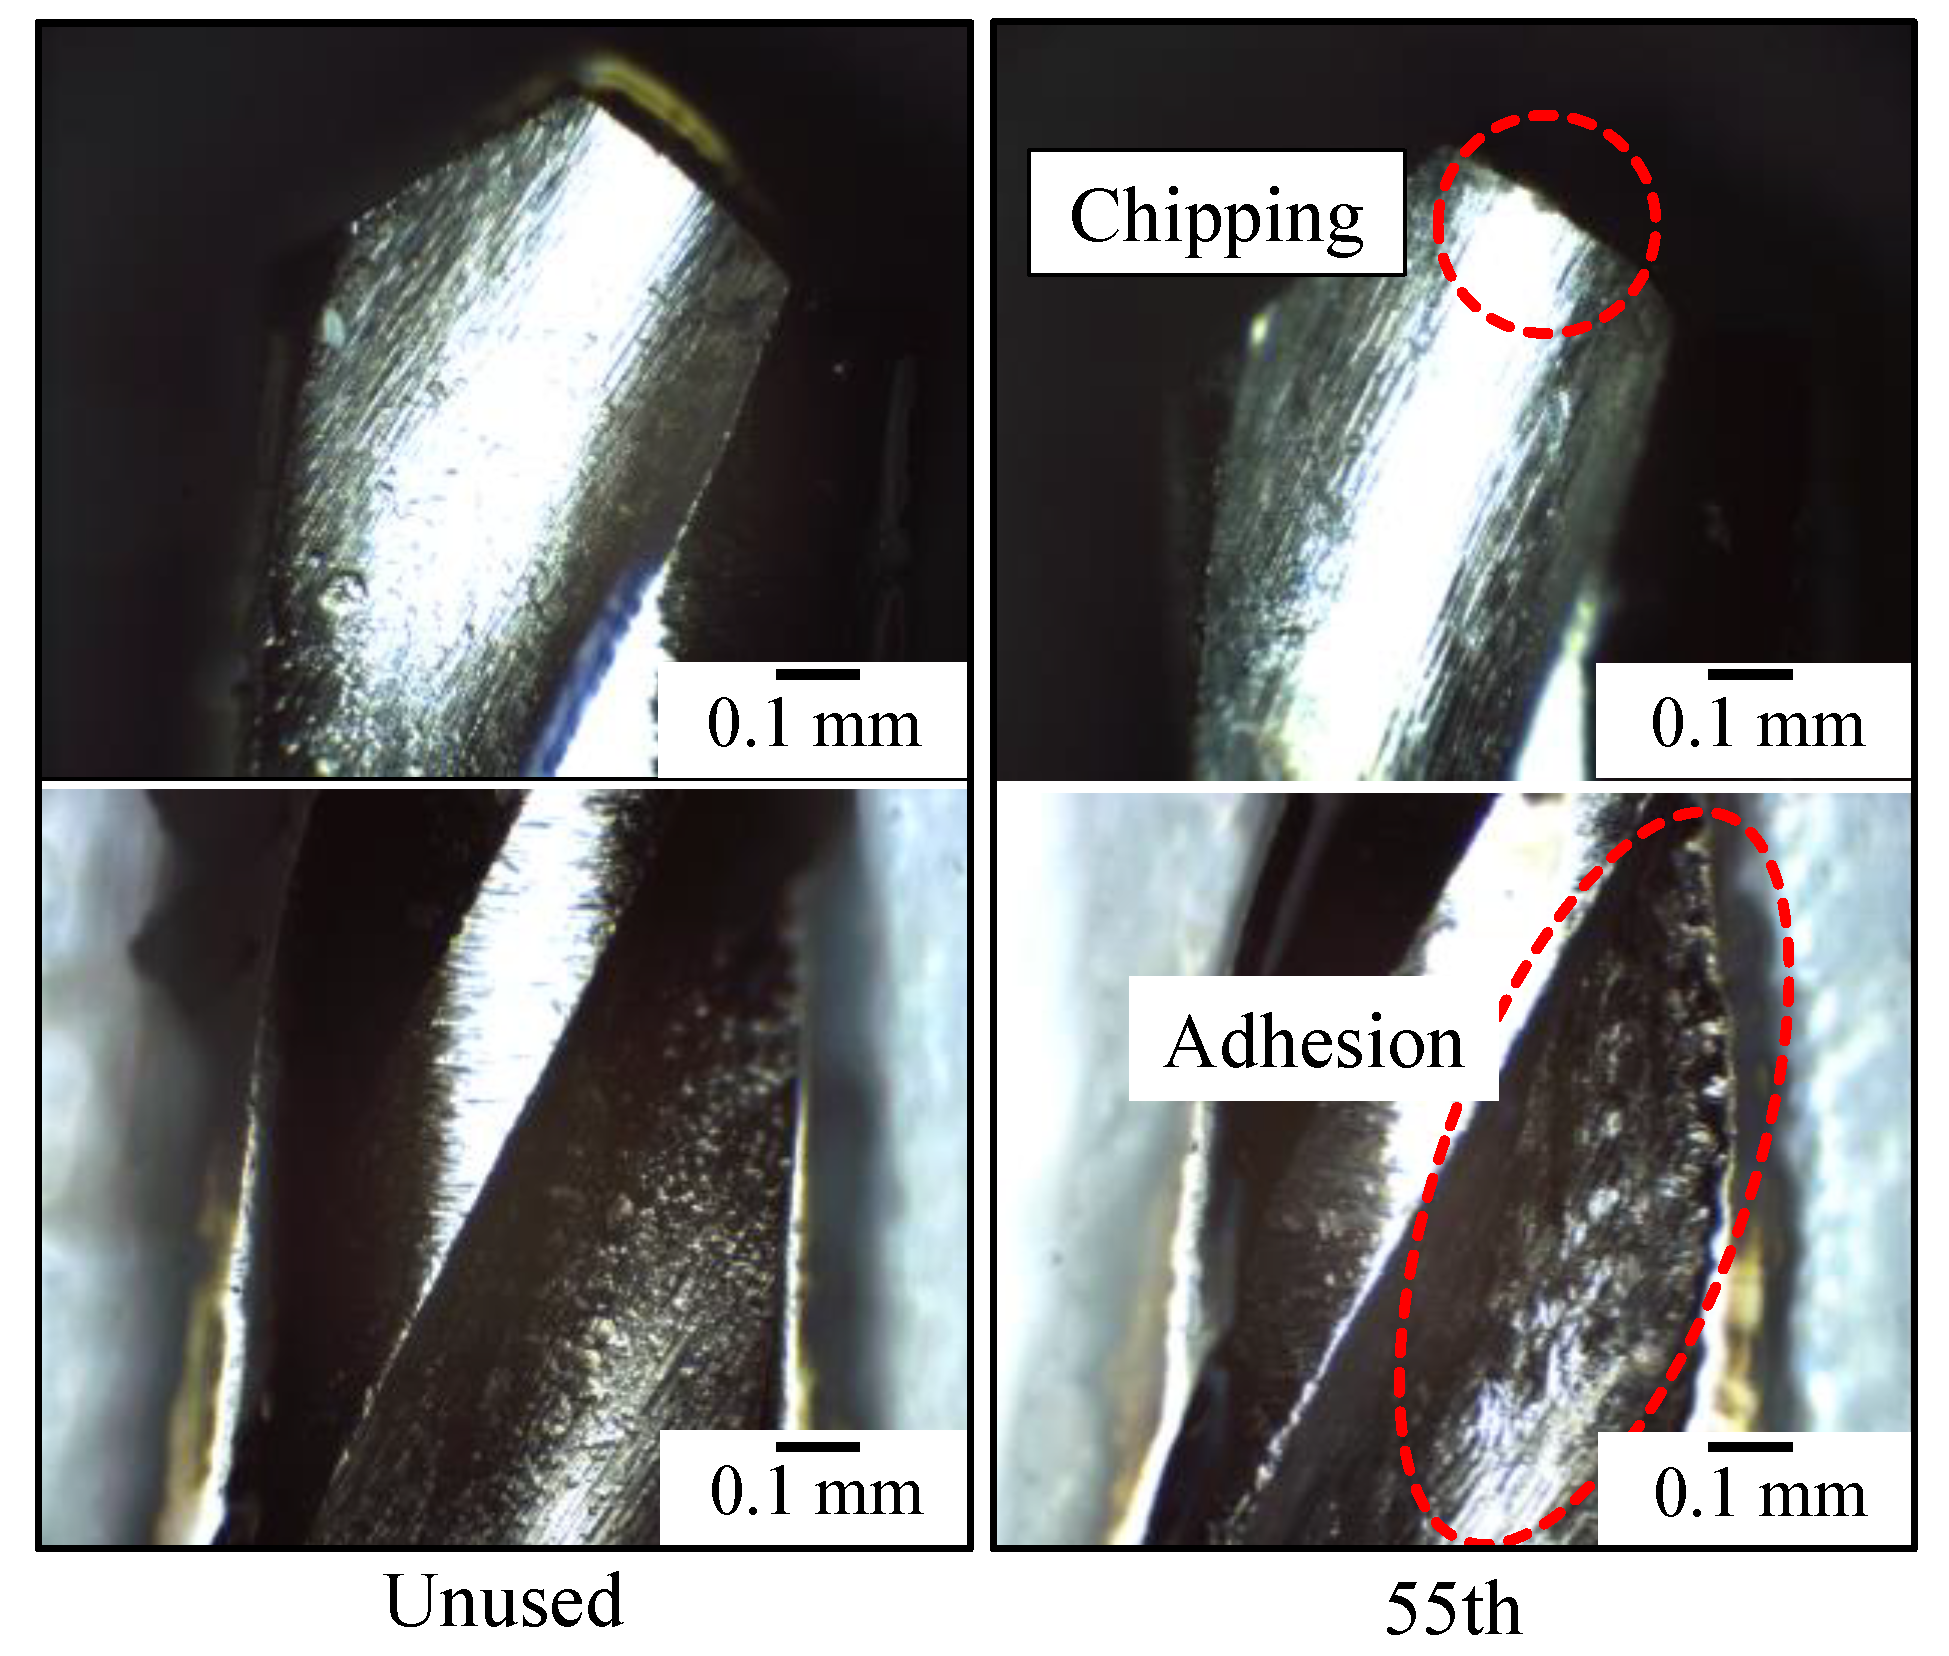
  • Between 0.15 and 0.4 MHz: caused by the generation of micro-chipping (decline in the sharpness of the drill bit) and a peeling phenomenon during chip ejection accompanying the adhesion of chips to the bit’s rake face (accelerating tool wear).
  • Around 1 MHz: caused by the adhesion of workpiece material to the drill bit (can be used to predict the breakage of drill bits).
Because of the vast volume of AE data that is generated, feature extraction of the detected signals is necessary for realizing highly accurate AE sensing and for developing an IoT system with AE sensors. Therefore, a correlation map between the AE frequency components and the wear modes has been devised by organizing the results of a frequency analysis of the AE signal waveforms [38], and a version of this correlation map is currently being upgraded [42]. Finally, based on the upgraded correlation map and the results of observations of the machined surface of the workpiece and the cutting edge of the drill bit, a correlation map that organizes the characteristics of the AE signal frequency spectrum in small-diameter drilling was derived, as shown in Figure 10. The vertical axis shows an outline of the magnitude relationship, because it depends on the detection sensitivity of the AE sensor and the AE measuring conditions, etc. This correlation map can be used to determine the machining state in situ in small-diameter drilling, such as the occurrence of adhesion, which is the starting point of drill bit breakage, as well as the ploughing or tearing of the machined surface.
Methods for suppressing the adhesion of work material and avoiding tool breakage include supplying (high-pressure jetting or cooling [46,47]) lubricant and applying ultrasonic vibration [47,48] or driven rotation [49]. Although these methods can certainly suppress the progress of adhesion, the loss of the sharpness of the cutting edge will eventually cause adhesion, resulting in tool breakage. In the case of small-diameter drills, breakage during machining must be avoided at all costs, because if breakage occurs during machining, the broken part could remain inside the workpiece. Therefore, the detection of AE signals with a high frequency of about 1 MHz, caused by adhesion, is important, as demonstrated by this study. Although the experiments in this study were conducted for a limited range of machining conditions, materials, and tools, we believe that the findings should apply to a range of different conditions, materials, and tools. As shown in Section 3.3, different combinations of materials (with or without a coating) result in different degrees of adhesion. Because there is a correlation between the amount of adhesion and the amplitude of the AE signal [41], the state of adhesion can be determined by AE sensing, even if different combinations of materials are used. Note, however, that as the diameter of the drill bit increases, the intensity of AE signals related to cutting phenomena (i.e., chip generation and ejection) also increases, possibly resulting in masking of the AE signals related to adhesion, which have a relatively high attenuation.
The frequency spectrum of the AE signal waveform shown in the AE sensing experiment during drilling recorded by Klocke et al. [27] is similar to that shown in Figure 3, although their materials and cutting conditions were different. Considering their results in relation to the correlation map in Figure 10, it can be interpreted that medium- and high-frequency components increase as the load on the drill bit increases, which indicates that ploughing and tearing of the machined surface and adhesion are occurring. Even in ultraprecision turning using a diamond cutting tool, the correlation map shown in Figure 10 can be applied during stable cutting and nonstable cutting (when the workpiece material adheres to the cutting edge) [50].
The AE signal intensity basically represents the magnitude of deformation and fracture phenomena. It is known that the behaviour of the AE signal changes during the chip-formation process. Specifically, the amplitude and fluctuations in the AE signal increase more for shear-type chips than for flow-type chips [51,52]. Furthermore, because there is a negative correlation between the shear angle and the AE mean value [8,52], we believe that the decrease in the cutting performance of a tool can be evaluated from the increase in the frequency components below 0.5 MHz caused by cutting phenomena.
Although there are various sensing technologies, such as sound, vibration, force, motor current, or temperature, it is difficult to identify the cause of changes in measured values. Furthermore, frequency analysis of AE signal waveforms, which contain large amounts of information related to deformation and fracture phenomena, can be used to identify and discriminate the cause of the phenomena, which can be useful for problem solving and material development. This correlation map in Figure 10 will be useful for in situ measurements of various phenomena and for the construction of analysis and evaluation algorithms. Further verification will be carried out in the future through experiments using different tools and workpiece materials, and under different cutting and lubrication conditions.

4. Conclusions

In this study, the relationship between AE signals and the machining state in small-diameter drilling was examined with the aim of applying AE sensing to in situ measurements of the machining state during drilling and the prediction of the breakage of drill bits. The results obtained were as follows.
  • The amplitude of the AE signal tended to increase as the small-diameter drill bit approached breakage.
  • AE signals with a high-frequency component of around 1 MHz were detected when the adhesion of a workpiece material (which causes breakage) occurred at the cutting edge of the small-diameter drill bit.
  • Features of the frequency spectrum of AE signal waveforms (AE frequency components) showed a similar trend regardless of the presence or absence of a coating on the small-diameter drill bit.
  • By measuring changes in the AE signal amplitude and the AE frequency components, the state of the sharpness of small-diameter drill bits can be evaluated with a high degree of accuracy.

Funding

This research was partly supported by the 42nd Special Experimental Research Grant from the Machine Tool Engineering Foundation (Project No. RU-15, October 2021–March 2024).

Institutional Review Board Statement

Not applicable.

Informed Consent Statement

Not applicable.

Data Availability Statement

The data that support the findings of this study are available from the corresponding author upon reasonable request.

Acknowledgments

The author thanks Hirofumi Yamazaki, Makoto Kawatani, Naoya Manita, Ryota Matsuoka, who were students at Saitama Institute of Technology when the experiments were performed, for their assistance. The author also thanks Yu Mukai of Nippon Steel Technology Co., Ltd. for his help in performing the SEM-EDS analyses in this study.

Conflicts of Interest

The authors declare no conflicts of interest.

Correction Statement

This article has been republished with a minor change. The change does not affect the scientific content of the article and further details are available within the backmatter of the website version of this article.

References

  1. Kagermann, H.; Lukas, W.D.; Wahlster, W. Industrie 4.0: Mit dem Internet der Dinge auf dem Weg zur 4. Industriellen Revolution. (Press Release) VDI Nachrichten, Nr.13. 2011. Available online: https://www.dfki.de/fileadmin/user_upload/DFKI/Medien/News_Media/Presse/Presse-Highlights/vdinach2011a13-ind4.0-Internet-Dinge.pdf (accessed on 18 December 2023).
  2. Cabinet Office, Government of Japan. The 5th Science and Technology Basic Plan (Translation); Cabinet Office, Government of Japan: Tokyo, Japan, 2016; pp. 9–15. Available online: https://www8.cao.go.jp/cstp/kihonkeikaku/5basicplan_en.pdf (accessed on 18 December 2023).
  3. Stolterman, E.; Croon Fors, A. Information Technology and the Good Life. In Information Systems Research: Relevant Theory and Informed Practice; Kaplan, B., Truex, D.P., III, Wastell, D., Wood-Harper, A.T., DeGross, J.I., Eds.; Kluwer Academic: Boston, MA, USA, 2004; pp. 687–692. [Google Scholar]
  4. Kraus, S.; Jones, P.; Kailer, N.; Weinmann, A.; Chaparro-Banegas, N.; Roig-Tierno, N. Digital transformation: An overview of the current state of the art of research. SAGE Open 2021, 11, 1–15. [Google Scholar] [CrossRef]
  5. Ashton, K. That ‘Internet of Things’ Thing. RFID J. 2009. Available online: https://www.itrco.jp/libraries/RFIDjournal-That%20Internet%20of%20Things%20Thing.pdf (accessed on 18 December 2023).
  6. Cabinet Office, Government of Japan. Society 5.0. Available online: https://www8.cao.go.jp/cstp/english/society5_0/index.html (accessed on 26 December 2023).
  7. ASTM E1316; Revision 23B, September 1, 2023: Standard Terminology for Nondestructive Examinations. ASTM International: West Conshohocken, PA, USA, 2023.
  8. Hase, A.; Wada, M.; Koga, T.; Mishina, H. The relationship between acoustic emission signals and cutting phenomena in turning process. Int. J. Adv. Manuf. Technol. 2014, 70, 947–955. [Google Scholar] [CrossRef]
  9. Dudzik, K.; Labuda, W. The possibility of applying acoustic emission and dynamometric methods for monitoring the turning process. Materials 2020, 13, 2926. [Google Scholar] [CrossRef]
  10. Ferrando Chacón, J.L.; Fernández de Barrena, T.; García, A.; Sáez de Buruaga, M.; Badiola, X.; Vicente, J. A Novel Machine Learning-Based Methodology for Tool Wear Prediction Using Acoustic Emission Signals. Sensors 2021, 21, 5984. [Google Scholar] [CrossRef]
  11. Tang, K.-E.; Weng, C.-Y.; Cheng, Y.-C.; Liu, C.-W. Typical signal anomaly monitoring and support vector regression-based surface roughness prediction with acoustic emission signals in single-point diamond turning. J. Manuf. Proc. 2024, 112, 126–135. [Google Scholar] [CrossRef]
  12. Marinescu, I.; Axinte, D. A time–frequency acoustic emission-based monitoring technique to identify workpiece surface malfunctions in milling with multiple teeth cutting simultaneously. Int. J. Mach. Tools Manuf. 2009, 49, 53–65. [Google Scholar] [CrossRef]
  13. Sio-Sever, A.; Leal-Muñoz, E.; Lopez-Navarro, J.M.; Alzugaray-Franz, R.; Vizan-Idoipe, A.; de Arcas-Castro, G. Non-Invasive estimation of machining parameters during end-milling operations based on acoustic emission. Sensors 2020, 20, 5326. [Google Scholar] [CrossRef]
  14. Uhlmann, E.; Holznagel, T. Acoustic emission-based process monitoring in the milling of carbon fibre-reinforced plastics. CIRP J. Manuf. Sci. Technol. 2022, 37, 464–476. [Google Scholar] [CrossRef]
  15. Li, M.; Huang, D.; Han, H.; Yang, X. Chatter Detection and Identification in High-Efficient Robotic Milling CFRP Composites Using Acoustic Emission Technique. Int. J. Precis. Eng. Manuf.-Green Technol. 2023, 10, 1155–1167. [Google Scholar] [CrossRef]
  16. Mathews, P.G.; Shunmugam, M.S. Condition monitoring in reaming through acoustic emission signals. J. Mater. Process. Technol. 1999, 86, 81–86. [Google Scholar] [CrossRef]
  17. Kanthababu, M.; Shunmugam, M.S.; Singaperumal, M. Tool condition monitoring in honing process using acoustic emission signals. Int. J. Autom. Control 2008, 2, 99–112. [Google Scholar] [CrossRef]
  18. Buj-Corral, I.; Álvarez-Flórez, J.; Domínguez-Fernández, A. Effect of Grain Size and Density of Abrasive on Surface Roughness, Material Removal Rate and Acoustic Emission Signal in Rough Honing Processes. Metals 2019, 9, 860. [Google Scholar] [CrossRef]
  19. Liu, C.-S.; Ou, Y.-J. Grinding wheel loading evaluation by using acoustic emission signals and digital image processing. Sensors 2020, 20, 4092. [Google Scholar] [CrossRef] [PubMed]
  20. Bi, G.; Liu, S.; Su, S.; Wang, Z. Diamond Grinding Wheel Condition Monitoring Based on Acoustic Emission Signals. Sensors 2021, 21, 1054. [Google Scholar] [CrossRef] [PubMed]
  21. Tanaka, H.; Sugiyama, T.; Kouno, T. Grinding burn monitoring by high-frequency domain analysis of acoustic emission signal. Int. J. Abras. Technol. 2021, 10, 269. [Google Scholar] [CrossRef]
  22. Imai, K.; Hase, A. Identification of tribological phenomena in glass grinding by acoustic emission sensing. Tribol. Online 2022, 17, 86–96. [Google Scholar] [CrossRef]
  23. Wang, S.; Wang, S.; Wang, S.; Zhao, Q. Study on subsurface damage behavior in ductile ultra-precision grinding of sapphire based on acoustic emission signal processing. J. Manuf. Process. 2024, 109, 326–344. [Google Scholar] [CrossRef]
  24. De Agustina, B.; Marín, M.M.; Teti, R.; Rubio, E.M. Surface Roughness Evaluation Based on Acoustic Emission Signals in Robot Assisted Polishing. Sensors 2014, 14, 21514–21522. [Google Scholar] [CrossRef]
  25. Liu, C.-W.; Chen, H.-C.; Lin, S.-C. Acoustic Emission Monitoring System for Hard Polishing of Sapphire Wafer. Sens. Mater. 2019, 31, 2681–2689. [Google Scholar] [CrossRef]
  26. Kim, H.-J.; Lee, H.-H.; Lee, S.-H. Analysis of Surface Roughness during Surface Polishing of ITO Thin Film Using Acoustic Emission Sensor Monitoring. Coatings 2023, 13, 2086. [Google Scholar] [CrossRef]
  27. Klocke, F.; Döbbeler, B.; Pullen, T.; Bergs, T. Acoustic emission signal source separation for a flank wear estimation of drilling tools. Procedia CIRP 2019, 79, 57–62. [Google Scholar] [CrossRef]
  28. Thirukkumaran, K.; Mukhopadhyay, C.K. Acoustic emission signals analysis to differentiate the damage mechanism in the drilling of Al-5%B4C metal matrix composite. Ultrasonics 2022, 124, 106762. [Google Scholar] [CrossRef]
  29. Zhang, X.; Li, M.; Huang, D. Surface quality and burr characterization during drilling CFRP/Al stacks with acoustic emission monitoring. J. Manuf. Process. 2023, 98, 138–148. [Google Scholar] [CrossRef]
  30. Gómez, M.P.; Hey, A.M.; Ruzzante, J.E.; D’Attellis, C.E. Tool wear evaluation in drilling by acoustic emission. Phys. Procedia 2010, 3, 819–825. [Google Scholar] [CrossRef]
  31. Ferrari, G.; Gómez, M.P. Correlation between acoustic emission, thrust and tool wear in drilling. Procedia Mater. Sci. 2015, 8, 693–701. [Google Scholar] [CrossRef]
  32. Patra, K. Acoustic emission based tool condition monitoring system in drilling. In Proceedings of the World Congress Engineering, London, UK, 6–8 July 2011; Newswood Academic Publishing: Hong Kong, China, 2011; Volume 3, pp. 2126–2130. [Google Scholar]
  33. Nakano, T.; Koresawa, H.; Narahara, H. Tool condition monitoring method by anomaly segmentation of time-frequency images using acoustic emission in small hole drilling. J. Adv. Mech. Des. Syst. Manuf. 2023, 17, 3-00133. [Google Scholar] [CrossRef]
  34. Mirifar, S.; Kadivar, M.; Azarhoushang, B. First steps through intelligent grinding using machine learning via integrated acoustic emission sensors. J. Manuf. Mater. Process. 2020, 4, 35. [Google Scholar] [CrossRef]
  35. Twardowski, P.; Tabaszewski, M.; Wiciak-Pikuła, M.; Felusiak-Czyryca, A. Identification of tool wear using acoustic emission signal and machine learning methods. Precis. Eng. 2021, 72, 738–744. [Google Scholar] [CrossRef]
  36. Asiltürk, İ.; Kuntoğlu, M.; Binali, R.; Akkuş, H.; Salur, E. A comprehensive analysis of surface roughness, vibration, and acoustic emissions based on machine learning during hard turning of AISI 4140 steel. Metals 2023, 13, 437. [Google Scholar] [CrossRef]
  37. Ahmed, M.; Kamal, K.; Ratlamwala, T.A.H.; Hussain, G.; Alqahtani, M.; Alkahtani, M.; Alatefi, M.; Alzabidi, A. Tool health monitoring of a milling process using acoustic emissions and a ResNet deep learning model. Sensors 2023, 23, 3084. [Google Scholar] [CrossRef]
  38. Hase, A.; Mishina, H.; Wada, M. Correlation between features of acoustic emission signals and mechanical wear mechanisms. Wear 2012, 292–293, 144–150. [Google Scholar] [CrossRef]
  39. Hase, A.; Wada, M.; Mishina, H. Scanning electron microscope observation study for identification of wear mechanism using acoustic emission technique. Tribol. Int. 2014, 72, 51–57. [Google Scholar] [CrossRef]
  40. Hutton, D.V.; Yu, Q. On the Effects of a Built-Up Edge on Acoustic Emission in Metal Cutting. ASME J. Eng. Ind. 1990, 112, 184–189. [Google Scholar] [CrossRef]
  41. Hase, A.; Mishina, H.; Wada, M. Microscopic study on the relationship between AE signal and wear amount. Wear 2013, 308, 142–147. [Google Scholar] [CrossRef]
  42. Hase, A. Early detection and identification of fatigue damage in thrust ball bearings by an acoustic emission technique. Lubricants 2020, 8, 37. [Google Scholar] [CrossRef]
  43. Zhang, Z.; Li, G.; Wang, H.; Xu, B.; Piao, Z.; Zhu, L. Investigation of rolling contact fatigue damage process of the coating by acoustics emission and vibration signals. Tribol. Int. 2012, 47, 25. [Google Scholar] [CrossRef]
  44. Riahi, A.R.; Alpas, A.T. Adhesion of AA5182 aluminum sheet to DLC and TiN coatings at 25 °C and 420 °C. Surf. Coat. Technol. 2007, 202, 1055–1061. [Google Scholar] [CrossRef]
  45. Subhedar, D.G.; Chauhan, K.V.; Patel, D.A. An experimental investigation of TiN coating on cutting force and surface finish in milling of aluminium. Mater. Today Proc. 2022, 59, 161–165. [Google Scholar] [CrossRef]
  46. D’Addona, D.M.; Raykar, S.J. Thermal Modeling of Tool Temperature Distribution during High Pressure Coolant Assisted Turning of Inconel 718. Materials 2019, 12, 408. [Google Scholar] [CrossRef]
  47. Xiangyu, Z.; Wang, D.; Peng, Z. Effects of high-pressure coolant on cooling mechanism in high-speed ultrasonic vibration cutting interfaces. Appl. Therm. Eng. 2023, 233, 121125. [Google Scholar] [CrossRef]
  48. Sun, Y.-J.; Gong, H.; Gui, S.-Y.; Yuan, S.-M.; Wang, Y. Towards understanding the cutting temperature in ultrasonic vibration-assisted drilling based on the dynamic contact characteristics between the cutting edge and workpiece. Ultrasonics 2023, 135, 107131. [Google Scholar] [CrossRef] [PubMed]
  49. Sasahara, H.; Goto, M.; Takahashi, W.; Yamamoto, H.; Muraki, T. Chip Adhesion and Tool Wear in Driven Rotary Cutting of Stainless Steel. In Proceedings of the ASME 2017 12th International Manufacturing Science and Engineering Conference collocated with the JSME/ASME 2017 6th International Conference on Materials and Processing, Volume 3: Manufacturing Equipment and Systems 2017, Los Angeles, CA, USA, 4–8 June 2017; p. V003T04A022. [Google Scholar] [CrossRef]
  50. Hase, A. Study on monitoring and control of machining process by acoustic emission technique. In Proceedings of the 9th International Conference on Leading Edge Manufacturing in the 21st Century (LEM21) 2017, Hiroshima, Japan, 13–17 November 2017; Japan Society of Mechanical Engineers: Tokyo, Japan, 2017; p. 156. [Google Scholar]
  51. Barry, J.; Byrne, G. Chip Formation, Acoustic Emission and Surface White Layers in Hard Machining. CIRP Ann. 2002, 51, 65–70. [Google Scholar] [CrossRef]
  52. Hase, A. A study on AE signals during micro cutting by in situ observation of metal cutting. In Proceedings of the Progress in Acoustic Emission XVIII: Proceeding 23rd International Acoustic Emission Symp, Kyoto, Japan, 5–8 December 2016; Japanese Society for Non-Destructive Inspection: Tokyo, Japan, 2016; pp. 55–60. [Google Scholar]
Figure 1. Experimental setup and the AE measurement system mounted on a small automatic drilling machine.
Coatings 14 00193 g001
Figure 2. Typical changes in the AE mean value detected during drilling until breakage of the uncoated drill bit.
Coatings 14 00193 g002
Figure 3. Typical changes in the frequency spectrum of the AE signal waveform detected during drilling until the breakage of the uncoated drill bit.
Coatings 14 00193 g003
Figure 4. Micrographs of the cutting edge of the uncoated drill bit before use (left) and after the 55th drilling (right).
Coatings 14 00193 g004
Figure 5. Typical changes in the frequency spectrum of the AE signal waveform detected during drilling until the breakage of the TiN-coated drill bit.
Coatings 14 00193 g005
Figure 6. Micrographs of the cutting edge of the TiN-coated drill bit before use (left) and after the 7th drilling (right).
Coatings 14 00193 g006
Figure 7. SEM image (left) and EDS elemental mapping images (right) for the uncoated drill bit after the 55th drilling.
Coatings 14 00193 g007
Figure 8. SEM image (left) and EDS elemental mapping images (right) for the TiN-coated drill bit after the 7th drilling.
Coatings 14 00193 g008
Figure 9. EDS spectra for (a) the uncoated drill bit and (b) the TiN-coated drill bit after breakage.
Coatings 14 00193 g009
Figure 10. Correlation map of AE frequency components for identifying the machining state in small-diameter drilling.
Coatings 14 00193 g010
Table 1. Summary of the experimental conditions.
AE sensor (frequency band)Wideband-type (0.5–4.0 MHz)
AE amplification factor50 dB
AE band-pass filterHigh-pass filter: 50 kHz
Low-pass filter: through
Tool materialHigh-speed steel (SD), uncoated/TiN coated
Workpiece materialAluminium alloy (A6063)
Rotation speed6500 rpm
Cutting speed18.8 m/min
Feed rate162 mm/min
Feed0.025 mm/rev
AtmosphereWet cutting (mineral-oil-based lubricant) at room temperature in the open air
Disclaimer/Publisher’s Note: The statements, opinions and data contained in all publications are solely those of the individual author(s) and contributor(s) and not of MDPI and/or the editor(s). MDPI and/or the editor(s) disclaim responsibility for any injury to people or property resulting from any ideas, methods, instructions or products referred to in the content.

