Article

A Phase-Field Regularized Cohesion Model for Hydrogen-Assisted Cracking

School of Applied Science, Taiyuan University of Science and Technology, Taiyuan 030024, China
*
Author to whom correspondence should be addressed.
Coatings 2024, 14(2), 202; https://doi.org/10.3390/coatings14020202
Submission received: 4 January 2024 / Revised: 1 February 2024 / Accepted: 2 February 2024 / Published: 4 February 2024

Abstract

:
Hydrogen-assisted cracking (HAC) usually causes premature mechanical failure of the material and results in structural damage in hydrogen environments. A phase-field regularized cohesion model (PF-CZM) was proposed to address hydrogen-assisted cracking. It incorporated the hydrogen-enhanced decohesion mechanism to decrease the critical energy release rate to address damage initiation and progression in a chemo-mechanical coupled environment. This model is based on coupled mechanical and hydrogen diffusion responses, driven by chemical potential gradients, and the introduction of hydrogen-related fracture energy degradation laws. The coupling problem is solved by an implicit time integral, in which hydrogen concentration, displacement and phase-field order parameters are the main variables. Three commonly used loading regimes (tension, shear, and three-point bending) were provided for comparing crack growth. Specifically, (i) hydrogen-dependent fracture energy degradation, (ii) mechanical–chemical coupling, and (iii) the diffusion coefficient D is influenced by both the phase field and the chemical field. By considering these factors, the PF-CZM model provided a variational framework by coupling mechanical loading with concentration diffusion for studying the complex interplay between a chemo-mechanical coupled environment and material damage, thereby enhancing our understanding of hydrogen-assisted cracking phenomena.

1. Introduction

Hydrogen-assisted cracking (HAC), also known as hydrogen embrittlement, is a prevalent form of material degradation observed in metallic materials. It refers to the phenomenon where materials degrade due to atomic hydrogen. That is to say, hydrogen in a metallic material significantly diminishes its load-carrying capacity, which renders it incapable of withstanding the same load as a hydrogen-free material. This phenomenon has a substantial impact on the mechanical properties and service life of the metallic material [1,2].
Susceptibility to hydrogen-assisted cracking is typically attributed to either internal embrittlement or external embrittlement. Internal embrittlement occurs when hydrogen is introduced into the metal during operations such as coating, forming, plating, and surface treatment. These processes can make hydrogen gas infiltrate into the metal’s interior, which results in embrittlement and material cracking. External embrittlement occurs due to environmental exposure, corrosion processes, and cathodic protection. Hydrogen or other chemicals in the environment can react with metal surfaces, which leads to the penetration of hydrogen into the material as well as consequent embrittlement and cracking. Both internal and external embrittlement may make metallic materials more sensitive to hydrogen-assisted cracking, causing damage at relatively low loads. Therefore, the computational modeling of hydrogen-assisted cracking can quantify its adverse effects on structural integrity and safety. Results provide a scientific basis for the prevention and mitigation of HAC and are of great significance for optimizing the structural design and material selection.
The prerequisite for HAC is the localization of hydrogen atoms, which can occur at grain boundaries, dislocations, interfaces between different phases, voids, or cracks. Hydrogen transport can be modeled as a diffusion process, which leads to HAC displacement-hydrogen concentration coupling [3]. The classical dislocation pinning mechanism was proposed by Watson et al. [4]. Dislocation movement is the basis of plastic deformation of materials, and the dislocation pinning effect will change the dislocation movement mode, which will affect the plastic deformation and fracture behavior of materials. Currently, the main failure mechanisms for hydrogen embrittlement can be attributed to two types [5,6]. Hydrogen-enhanced localized plasticity (HELP) and hydrogen-enhanced decohesion (HEDE) are used to reduce the yield stress and critical release energy of the material, which affect the fracture behavior of the material. The HEDE mechanism is modeled with the cohesive zone model (CZM) of Barenblatt [7] and hydrogen-dependent fracture energy [8,9,10,11]. Zero-thickness interface elements [12,13] can be used to model the behavior of cracks in finite element simulations for crack or contact problems. The crack path can be captured by the extended finite element method (XFEM) [14,15], the weakest connection method [16,17], and the embedded strong discontinuity method [18,19]. Although these methods can capture flexible crack paths, modeling complex fractures with multiple cross-cracks is still challenging.
Recently, the phase-field damage/fracture model [20,21,22] (PFM) has provided a promising tool for calculating fracture mechanics with the development of the phase-field method. Furthermore, compared to the previous model, ad hoc failure criteria are not required to determine when/where cracks nucleate, expand, branch, and merge [3]. A field variable replaces the diffusion damage band in the phase-field fracture model. The bandwidth is controlled by a length scale parameter that gradually varies between zero and one. When the field variable is zero, the material is intact; when it equals to one, macro cracks form [1]. Phase-field model (PFM) has been widely used for brittle fracture [23,24,25], ductile fracture [26], dynamic fracture [27,28], cohesive fracture [29,30,31], multi-physics fracture [32,33], and hyperelastic fracture [34,35,36].
PFM can also be used for hydrogen-dependent fracture energy to simulate HAC [37,38,39,40], with many results reported. However, previous computational models apply the PFM standard of Bourdin et al. [22]. The model does not consider cohesive fracture and fails to deal with different degradation responses, where hydrogen reduces fracture energy and/or cohesive strength. In addition, considering the simultaneous presence of chemical concentration and mechanical damage can lead to changes in the material’s microstructure (such as lattice defects), which can result in the diffusion coefficient being influenced by the coupling effect of chemical concentration and stress. Such researches are rarely mentioned. Based on the above-mentioned issues, a phase-field regularized cohesion model is proposed to describe crack propagation and its diffusion coupling, and is extended to incorporate the hydrogen-enhanced decohesion mechanism to reduce the yield stress of the materials. By applying various complex loading conditions, such as tension, shear, and three-point bending, the ability of this model to predict crack propagation is validated. Furthermore, the influence of chemical concentration erosion and mechanical loading on crack propagation behavior is investigated. In this study, the model accurately predicts the crack propagation process and the distribution of chemical concentration. This work is of significant importance for predicting the behavior of structures under the conditions of chemical erosion and mechanical loading.
The work aimed to extend the phase-field regularized cohesion model for HAC. The effects of chemical concentration and mechanical damage on crack propagation behavior under various loading modes (tensile, shear, and three-point bending) are studied and the coupling effect of chemical and mechanical influences on the diffusion coefficient D is also taken into consideration.
The remaining arrangement of the work is as follows: Section 2 details the unified phase-field theory of damage and fractures in purely mechanical terms, which is extended it to hydrogen-assisted cracking with mechanochemical coupling. Section 3 lists three typical cases (tensile, shear, and three-point bending), each of which is divided into three simulations: (i) hydrogen-dependent fracture energy degradation, without considering mechanical–chemical coupling, (ii) mechanical–chemical coupling, and (iii) the diffusion coefficient D is influenced by both the phase field and the chemical field, based on mechanical–chemical coupling. The predicted outcomes for each case type encompass crack propagation, concentration diffusion, and stress evolution processes. These findings provide a comprehensive assessment of the impacts in different scenarios.

2. Materials and Methods

This section describes field variables, kinematics, control equations, diffusion equations, fundamental laws of thermodynamics, Helmholtz free energy generalization, dissipation inequalities, constitutive relation, and chemical-mechanical couplings.

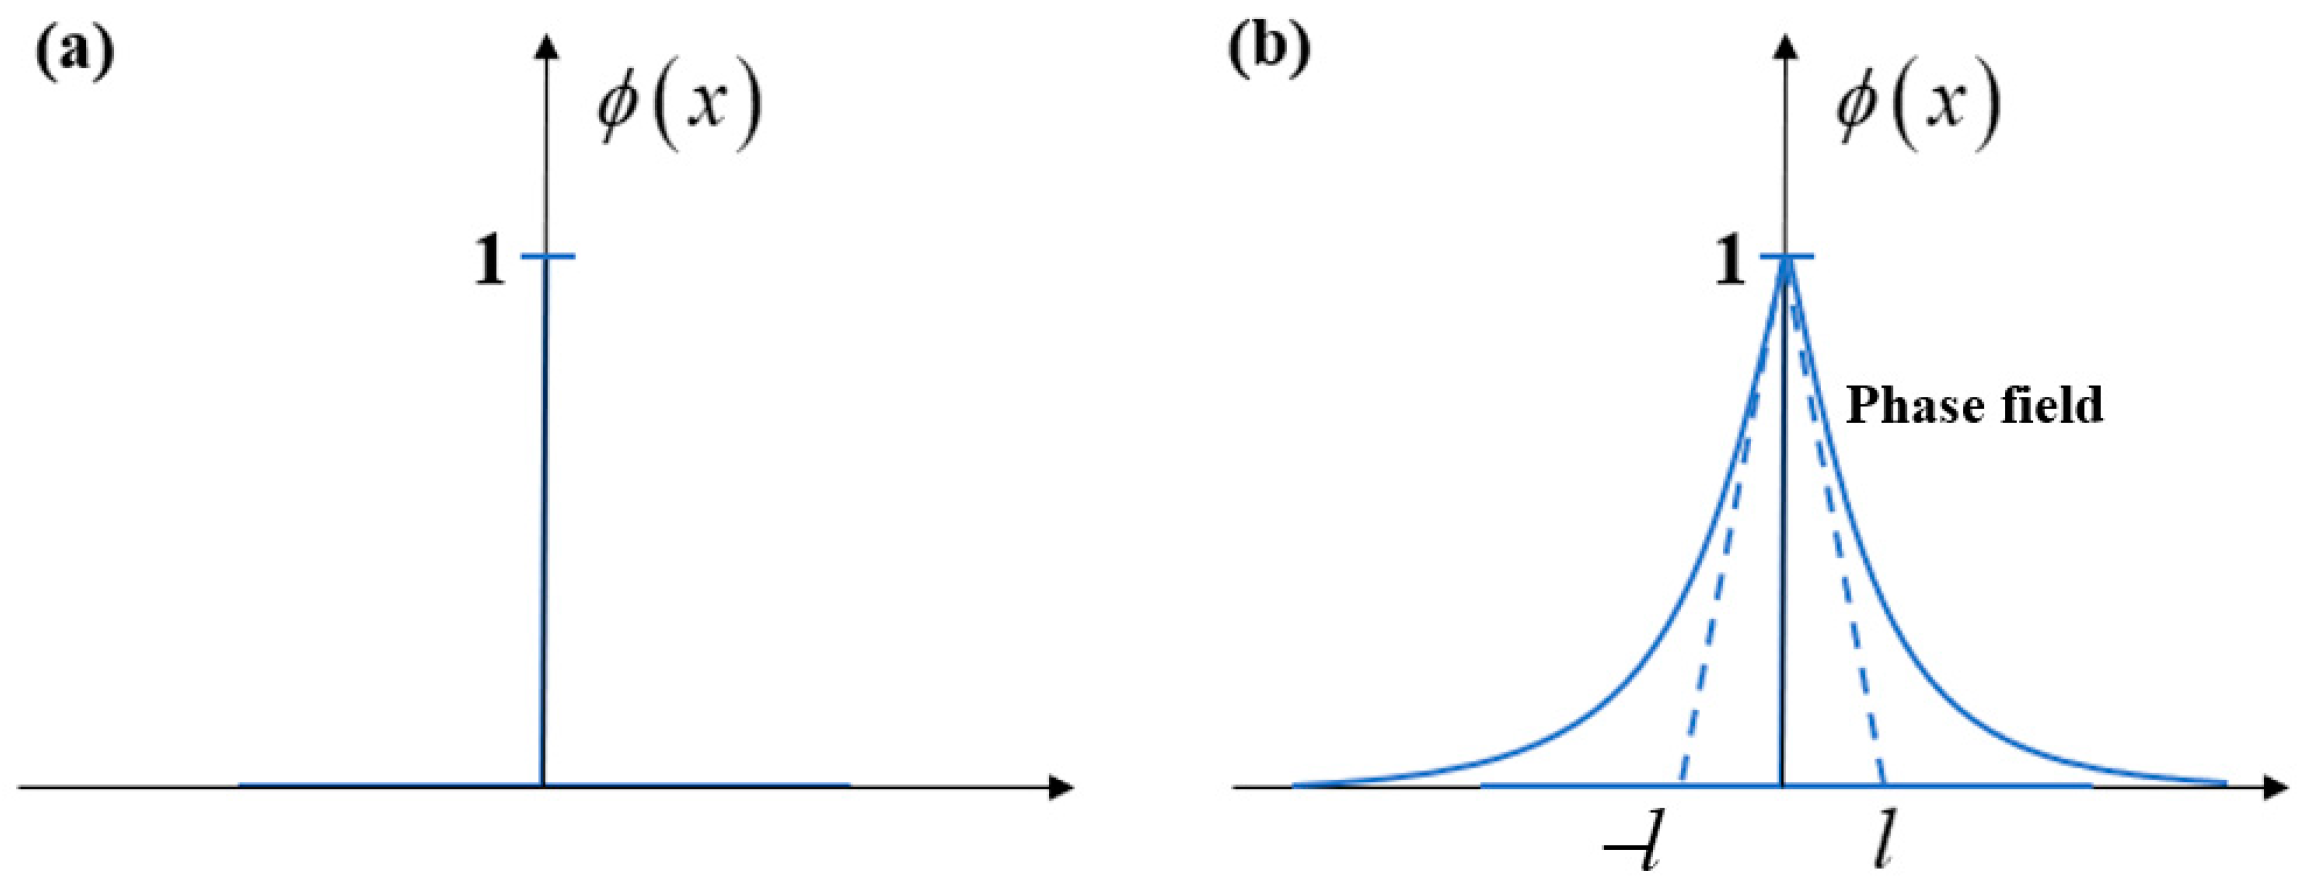
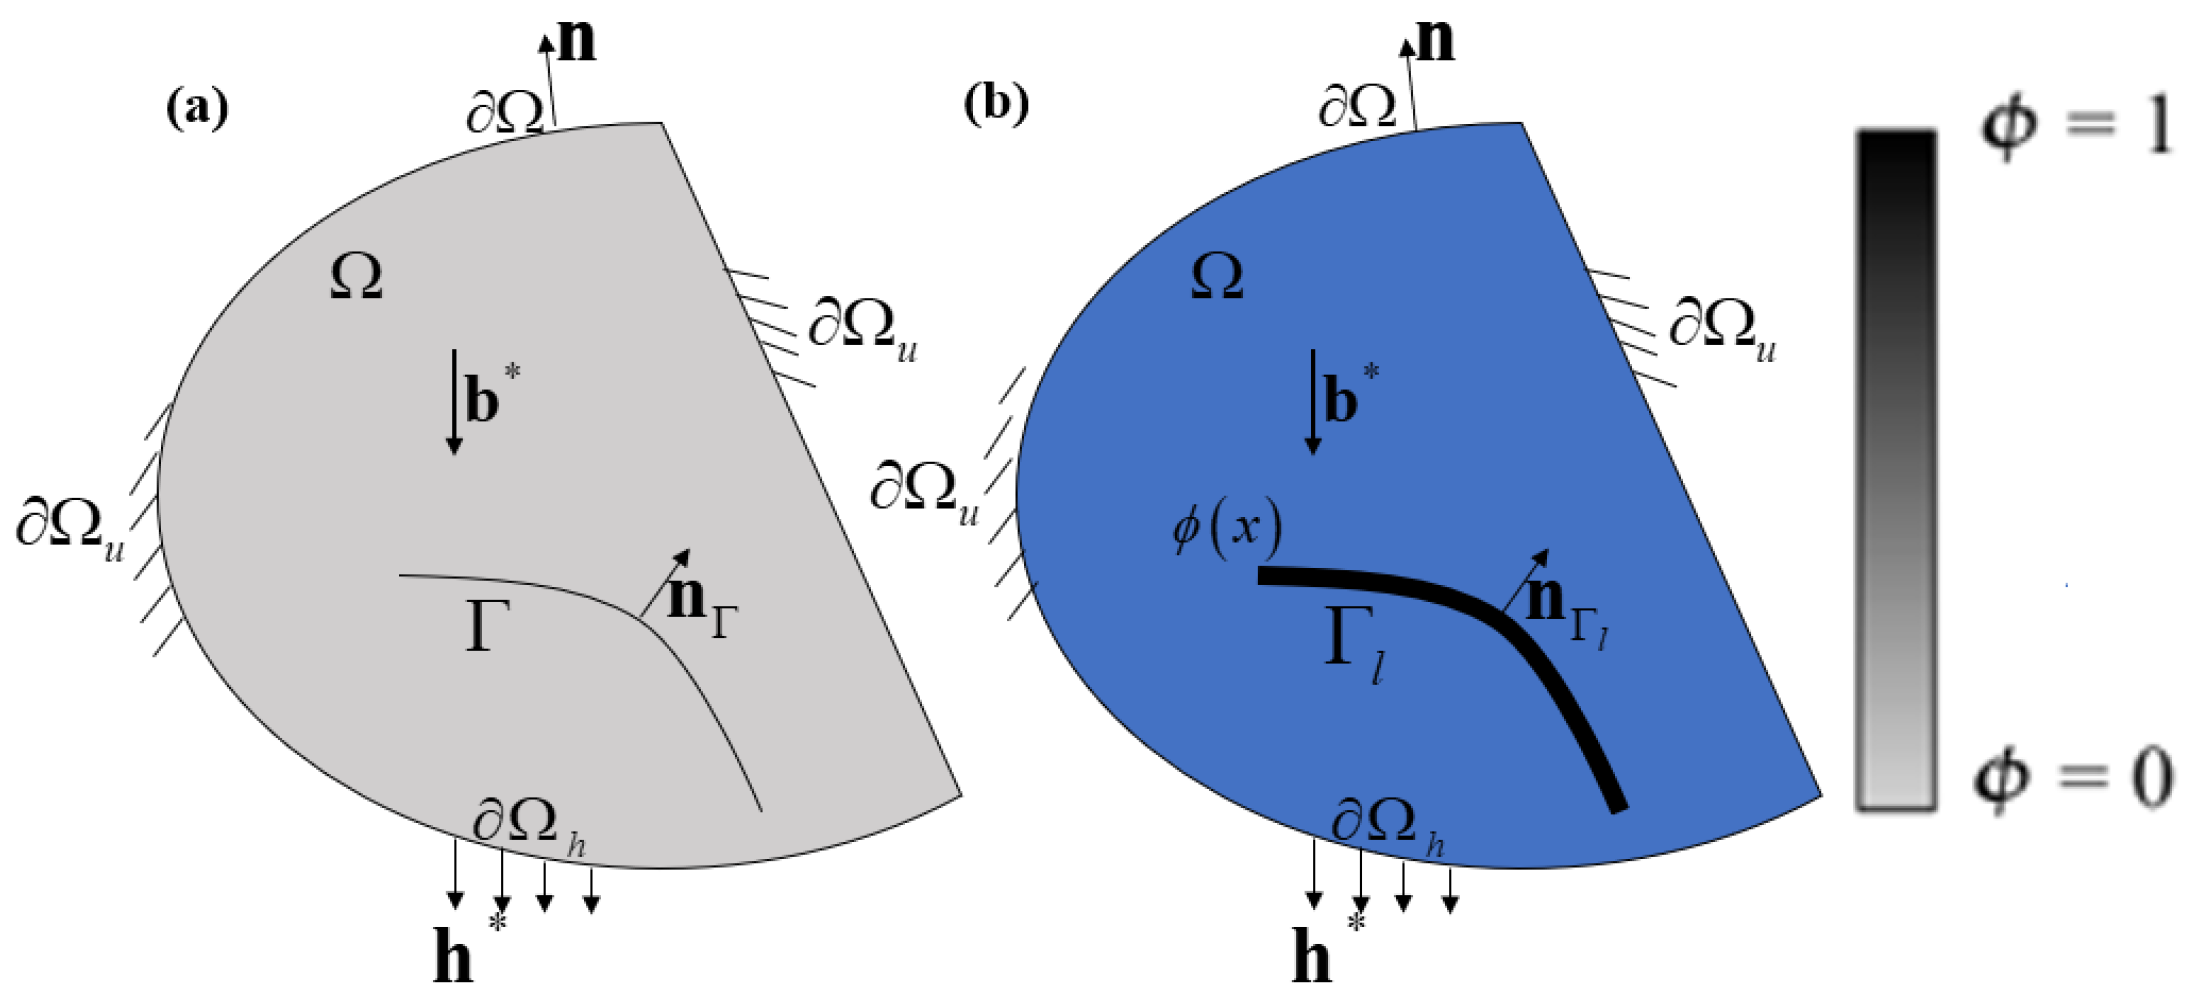
2.1. Phase-Field Model of Fractures

A sharp crack in an expanding structure (Figure 1a) can be described by field variable ϕ x 0 , 1 in a 1D space, with
ϕ x 1   if   x = 0 0   if   x 0
It is named the fracture phase field, where ϕ x = 0 and ϕ x = 1 represent the intact and completely broken states of the material, respectively. For the fracture phase-field method, Miehe et al. [41] proposed an exponential function with a diffusion property, which can be used for the phase field.
ϕ x = e x l
Figure 1b shows the regularization or diffusion crack topology. The crack length scale parameter l is used to control the width of the damaged region of the diffusion crack.
Considering discrete internal discontinuity Γ in the solid (Figure 2a), the diffusion crack surface Γ l (Figure 2b) can be defined by
Γ l φ = 1 2 l 0 Ω φ 2 + l 2 φ 2 d Ω = Ω γ l 0 φ , φ d Ω
where Γ l φ is the diffusion crack surface of the entire cracked solid, which is represented by the crack length scale parameter l and the phase-field parameter ϕ . γ l 0 φ , φ is the crack surface density function per unit volume in one dimension. It can be denoted as follows in higher dimensions.
γ l 0 φ , φ = 1 2 l 0 φ 2 + l 0 2 φ 2
where is the Laplacian operator.
According to the solid Ω d d = 1 , 2 , 3 with crack Γ (Figure 2a), the total potential energy of the object is given by
Ψ u , ϕ = ψ u , ϕ + ψ c ϕ
where ψ u , ϕ and ψ c ϕ denote elastic strain energy and fracture surface energy, respectively. The elastic strain energy of a solid is expressed as follows.
ψ u , ϕ = Ω ψ ε u , ϕ d V
The elastic strain energy function per unit volume of the above equation is defined by
ψ ε , ϕ = g ϕ ψ 0 ε
where g ϕ , ψ 0 ε , and ε are degenerate functions, elastic strain energy density functions of intact materials, and strain tensors, respectively. Considering the linear elastic theory of isotropic solids, the elastic strain energy density function is defined by
ψ 0 ε = 1 2 ε T : C 0 : ε
where C 0 is the linear elastic stiffness matrix. In the theory of small deformation, strain tensor ε can be expressed in terms of the displacement gradient.
ε = 1 2 u + u T
where u and u are the displacement vector and the displacement gradient, respectively. Material damage occurs in a linearly elastic solid due to the crack expansion, and material damage results in energy degradation. A monotonically decreasing function is defined as follows to describe the energy degradation phenomenon.
g 0 = 1 , g 1 = 0 , g ˙ 1 = 0
The first two terms denote the state of undamaged materials and total material damage, respectively. Therefore, the energy degradation function can be defined by
g ϕ = 1 ϕ 2 + k
where k is chosen to be as small as possible to keep the system of equations well conditioned; k = 1 × 10⁻⁷ is adopted throughout this work. Elastic strain energy is expressed by Equations (7)–(11).
ψ ε , ϕ = 1 ϕ 2 + k ψ 0 ε
Fracture surface energy is defined by
ψ c ϕ = Γ l G c d Γ
where G c is the material’s fracture energy. According to the crack surface density function γ l 0 φ , φ derived from Equation (4), fracture surface energy is defined by
ψ c ϕ = Ω G c γ l 0 φ , φ d V
= Ω G c 1 2 l 0 φ 2 + l 0 2 φ 2 d V
The total potential energy of the solid’s deformation and fracture problem is defined by
Ψ u , ϕ = Ω 1 ϕ 2 + k ψ 0 ε + G c 1 2 l 0 φ 2 + l 0 2 φ 2 d V
The fracture strength of the material decreases with hydrogen concentration. Consequently, the critical energy release rate depends on hydrogen coverage θ.
ψ c ϕ = Γ l G c θ d Γ = Ω G c θ 1 2 l 0 φ 2 + l 0 2 φ 2 d V
where θ depends on the hydrogen concentration and is described in the next section. Thus, the generalization of the total potential energy of the solid is defined by
Ψ u , ϕ = Ω 1 ϕ 2 + k ψ 0 ε + G c θ 1 2 l 0 φ 2 + l 0 2 φ 2 d V
According to the energy conservation law, internal and external energy balances are required during the quasi-static loading process.
W e x t = W i n t
According to Figure 3, external work W e x t is defined by
W e x t = Ω b u d V + Ω t h u d A
where b and h are the body force per unit volume and the surface force per unit area, respectively. Based on variational processing
W e x t = Ω b u d V + Ω t h u d A
W i n t = ψ ϕ , u = ψ ε : δ ε + ψ ϕ δ ϕ
Equation (16) is substituted into Equation (22) to obtain the function of the internal potential energy.
Ω σ : δ ε 2 ( 1 ϕ ) δ ϕ ψ o ( ε ) + G c 1 l ϕ δ ϕ + l ϕ δ ϕ d V
The weak and strong form of the governing equation is obtained by substituting Equations (21) and (23) into Equation (20).
Ω σ : δ ε 2 ( 1 ϕ ) δ ϕ ψ o ( ε ) + G c 1 l ϕ δ ϕ + l ϕ δ ϕ d V Ω b δ u d V + Ω h δ u d A = 0
where ε , u , and ϕ are the virtual strain tensor, virtual displacement, and virtual order parameters, respectively. The expression containing the above parameters can be obtained by the Gaussian transformation of Equation (24).
Ω { [ Div [ σ ] + b ] δ u 2 ( 1 ϕ ) ψ 0 ( ε ) G c 1 l ϕ Div [ l ϕ ] δ ϕ } d V + Ω σ n h δ u d A + Ω G c l ϕ n δ ϕ d A = 0
where n is the outer-normal direction vector perpendicular to surface boundary Ω , and the above equation satisfies each value for u and ϕ . We can obtain the boundary conditions and the governing equations for the phase field. The boundary conditions are defined by
σ + b = 0 in   Ω u x , t = u D x , t x Ω u σ n = h on   Ω h
The governing equation is defined by
G c 1 l ϕ l Δ ϕ 2 1 ϕ ψ 0 ε = 0 in   Ω ϕ · n = 0 on   Γ
where Δ ϕ is the Laplace operator for the phase-field order parameter. Historical strain field H is introduced to ensure the irreversibility of cracks, which prevents crack healing by compression or unloading of the material.
H = max ψ 0 ε , H t
where H t indicates strain energy at moment t. Equation (28) is substituted into Equation (27) to obtain the damage evolution of the phase field.
G c 1 l ϕ l Δ ϕ 2 1 ϕ H = 0

2.2. Hydrogen-Dependent Surface Energy Degradation

Degraded critical energy release rate G c θ is associated with hydrogen coverage rate θ and undamaged critical energy release rate G c 0 . Finally, the Langmuir–McLean isotherm is used to compute the surface coverage from bulk hydrogen concentration C.
θ = C C + exp Δ g b 0 R T
C is given in units of impurity mole fraction; R is the universal gas constant; T is the temperature; Δ g b 0 is the Gibbs free energy difference between the decohering interface and the surrounding material. According to [42], 30 kJ/mol is assigned to Δ g b 0 .
G c θ G c 0 = 1 χ θ
where G c 0 is the critical energy release rate in the absence of hydrogen; χ is the damage coefficient. According to the research of Jiang et al. [43], the damage coefficient is 0.89.
The previous section uses the Langmuir–McLean isotherm to describe the hydrogen coverage in the lattice. According to the energy conservation law, hydrogen transport requires that the change rate of hydrogen concentration C be correlated with the flux of hydrogen through the external surface.
Ω d C d t d V + Ω J n d A = 0
The divergence theorem is applied to Equation (32) to obtain the strong form of the equilibrium equation.
d C d t + J = 0
where J is the flux of hydrogen, which follows a linear Onsager relationship.
J = D C R T μ
D and μ are the diffusion coefficient and chemical potential, respectively. Equation (33) is treated by variation.
Ω δ C d C d t + J d V = 0
The divergence theorem is applied to Equation (35) to obtain its weak form.
Ω δ C d C d t + J d V = Ω δ C d C d t J δ C d V + Ω δ C q d A

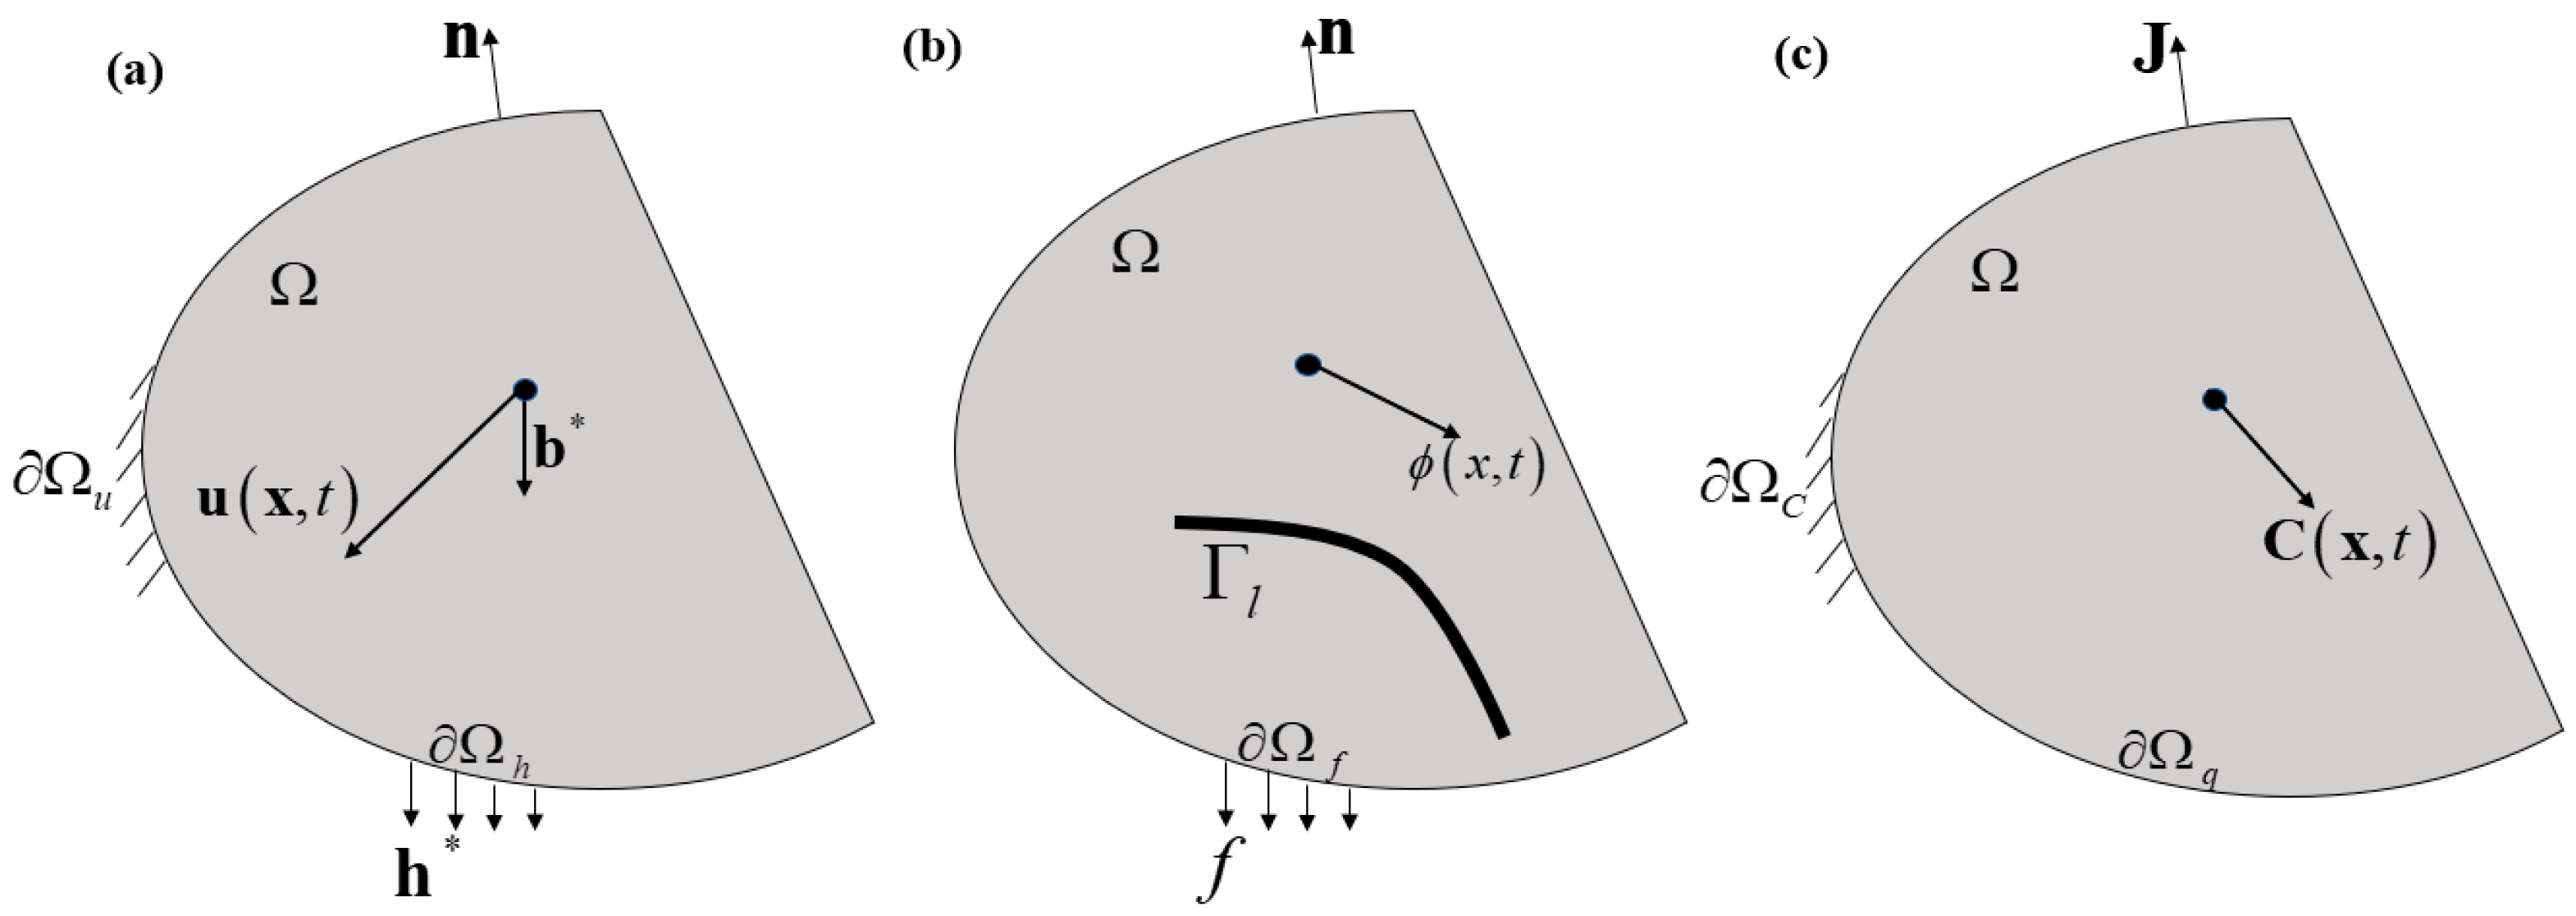
2.3. Stress-Assisted Hydrogen Diffusion Coupled with Phase-Field Fractures

Figure 4 shows the three-field boundary value. The outer surface of the object is divided into parts Ω u and Ω h for displacement field u. Displacement and tractive force are determined by the Dirichlet-type boundary condition and the Newman-type boundary condition, respectively. The fracture’s phase field ϕ is driven by solid displacement field u. For hydrogen concentration C, the outer surface consists of parts Ω q and Ω c , where the flux of hydrogen ( J ) is known (the Neumann boundary condition) with given hydrogen concentration C (the Dirichlet boundary condition).
The principle of virtual work, in the presence of body forces, reads
W = Ω σ : δ ε + ω δ ϕ + ζ δ ϕ C ˙ δ μ + J δ μ ˙ d V = Ω h δ u + q δ μ + f δ ϕ d A + Ω b δ u d V
where μ and σ are the chemical potential that drives the flux of hydrogen and symmetric Cauchy tensor, respectively. ω and ζ are work-conjugate microstress quantities to the phase field ϕ and phase-field gradient ϕ , respectively. The relationship between strain tensor and the displacement tensor in Equation (9) is further explained,
ε = u
The divergence theorem is applied to Equation (37) to obtain
δ W i = Ω σ n δ u + ζ n δ ϕ + J n δ μ d A Ω σ + b δ u + ζ ω δ μ + J + C ˙ δ μ d V
Any variation must be equal to zero in Equation (39), which can obtain two sets of three equilibrium equations.
σ + b = 0       on   Ω ζ ω = 0       on   Ω d C d t + J = 0       on   Ω
h = σ n       on   Ω h f = ζ n       on   Ω f q = J n       on   Ω q

2.4. Energy Imbalance and Constitutive Theory

The first and second laws of thermodynamics are applied to the energy imbalance. They are dynamic processes of interpretating specific internal energy U and entropy S in a continuous body. Only mechanical and thermal energy is considered in a closed system where heat exchange occurs. The change rate of internal energy per unit time is equal to the sum of heat exchanged between the system and the surroundings and the work done on the surroundings. The change rate of internal energy in this medium has the following integral form.
d d t Ω U d V = W . ext c n d A + Ω ρ z d V
The last two terms with the equal sign are heat conduction and radiation in the thermodynamic continuum c, z, and ρ are the heat flux per unit area and unit time, the radiant heat per unit mass and unit time, and the mass density, respectively.
According to the second law of thermodynamics, the change rate of total entropy S with time is equal to or greater than the sum of the entropy flux through the continuum surface and internally generated entropy. Mathematically, this entropy principle can be expressed as an integral equation, the Clausius–Duhem inequality (dissipation function).
d d t Ω S d V c n T d A + Ω ρ z T d V
Clausius–Duhem inequality (dissipation function) is a mathematical expression that represents the second law of thermodynamics. This equation states that the total entropy change in any process cannot be negative, meaning that the entropy increase for all real processes is greater than or equal to zero.
Where d d t Ω S d V represents the total entropy change rate between the system and the heat source, c n T d A + Ω ρ z T d V represents the heat transferred from the heat source to the system, and T represents the temperature.
The law of thermodynamics is applied to matter transport. The increased free energy time of a partial volume is less than or equal to dissipated energy plus energy flowing through the boundary of diffused matter.
d d t Ω ψ d V Ω W ˙ e x t d S + Ω μ J n d S
Equation (37) is substituted into Equation (44) with the divergence theorem applied to obtain
Ω ψ ˙ σ : ε ˙ + ω ϕ ˙ + ξ ϕ ˙ + μ C ˙ J μ d V 0
Constitutive relationships are obtained based on Equation (45).
σ ψ ε : ε ˙ + ω ψ ϕ ϕ ˙ + ξ φ ϕ ϕ ˙ μ Ψ C C ˙ J μ 0
Any variation should be true for Equation (46).
σ = ψ ε ω = ψ ϕ ξ = φ ϕ μ = ψ C

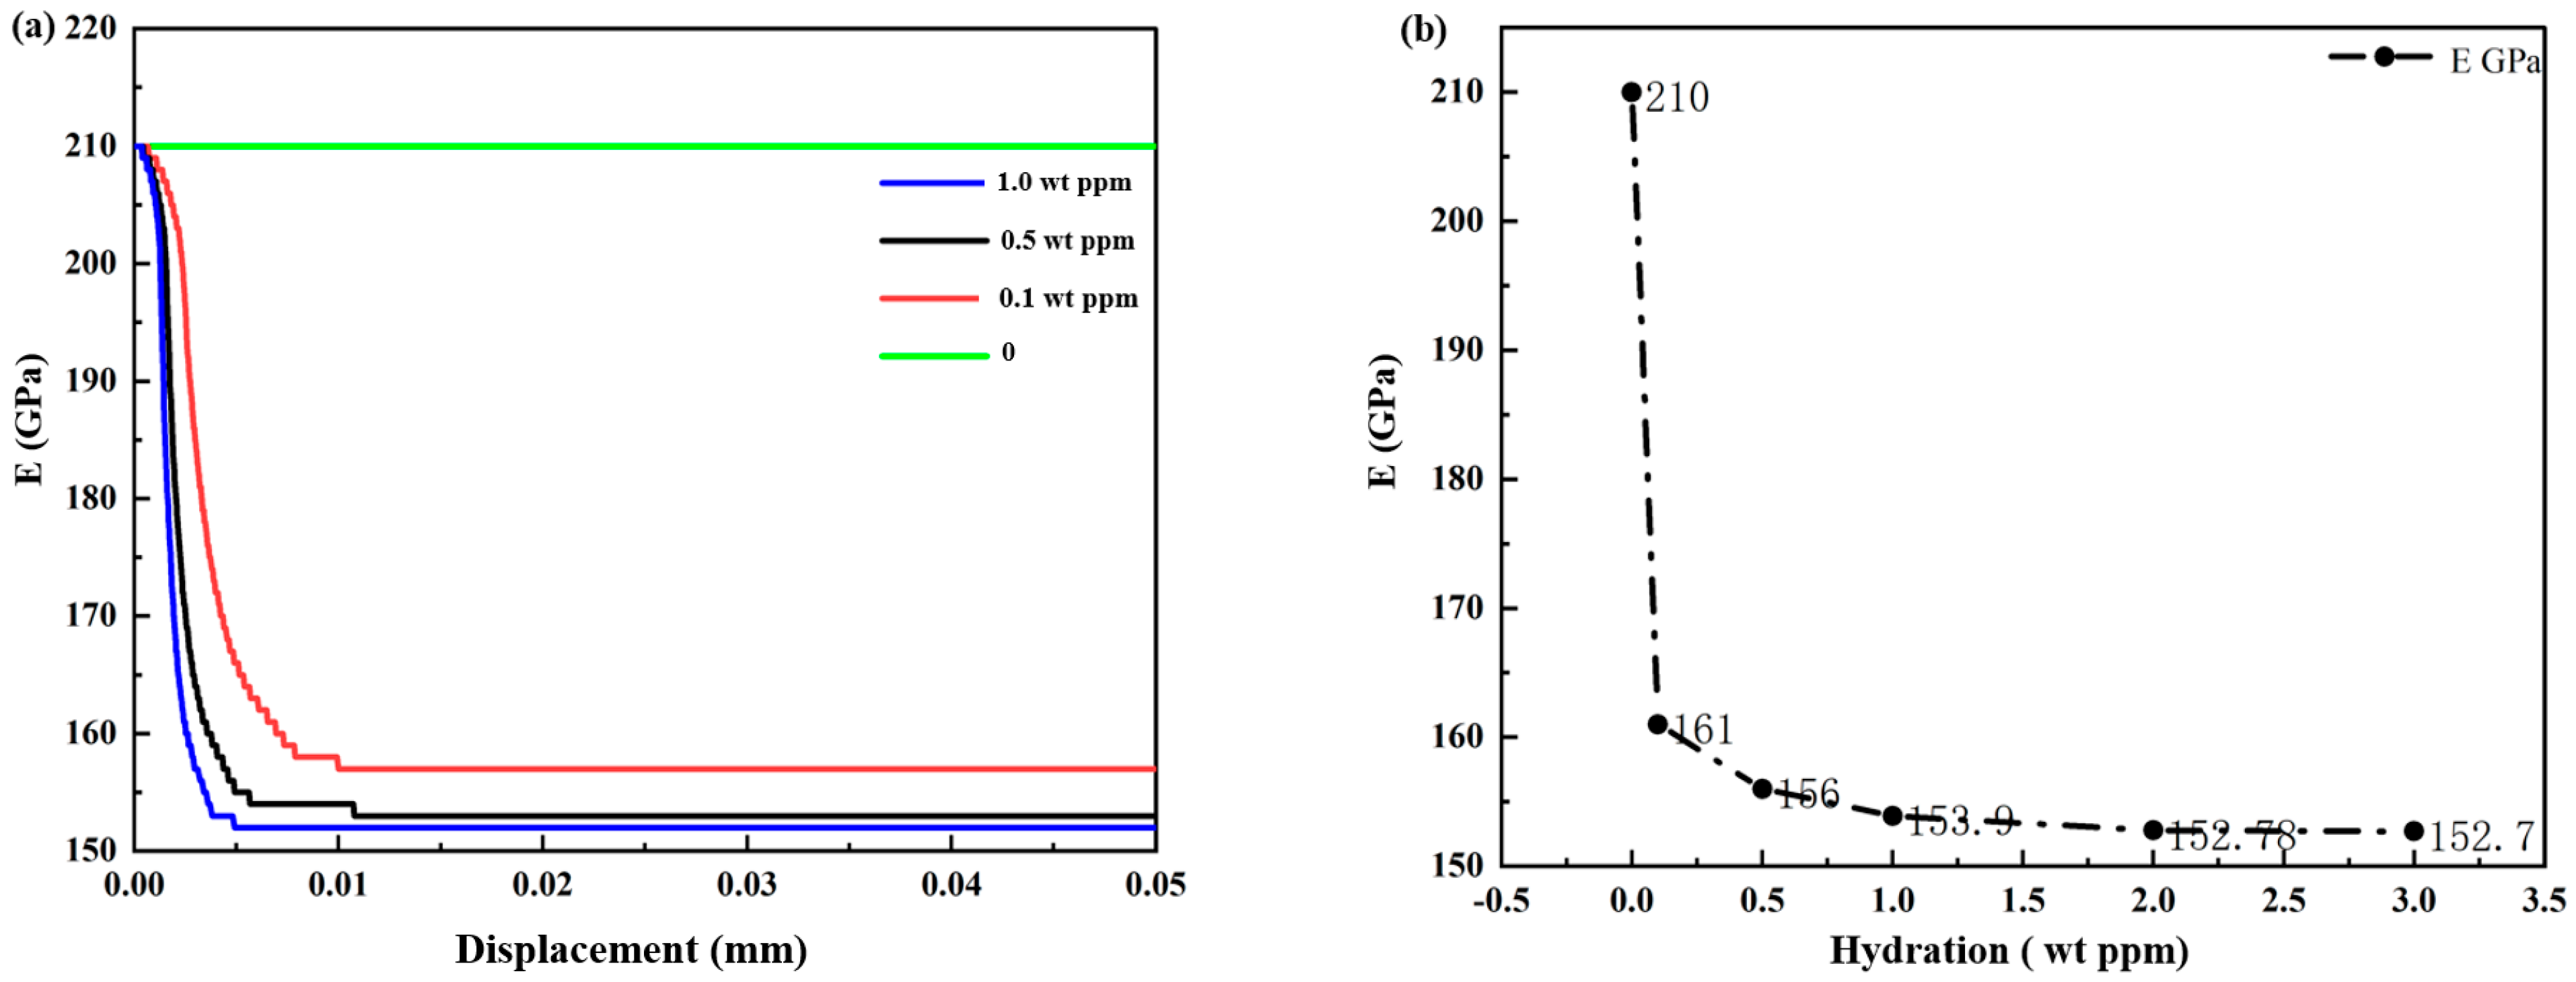
2.5. Degradation of Hydrogen-Dependent Material Properties

The total free energy density of the system is defined as a function of strain ε , concentration C , damage parameters ϕ , and damage gradient ϕ . The free energy of fractures, taking into account hydrogen-assisted cracking, is defined by
Ψ ε , ϕ , ϕ , C = g ϕ ψ 0 ε K V H C C 0 t r ε + G c θ 1 2 l φ 2 + l 2 ϕ 2 + u 0 C + R T N θ L ln θ L + 1 θ L ln 1 θ L
where ψ b ε , ϕ , C , ψ s ϕ , ϕ , θ , and ψ c C are elastic-stress energy stored in the material, fracture energy, and chemical energy, respectively. Here, K is the bulk modulus; V H is the partial molar volume of hydrogen in the solid solution; C 0 is referenced-lattice hydrogen concentration; u 0 is the referenced chemical potential; θ L is the occupancy of lattice sites; N is the number of lattice sites.
Based on the free energy function and the constitutive relation, Cauchy stress tensor is defined by
σ = Ψ ε = g ϕ C 0 : ε K V H C C 0 I
Scalar microstress ω conjugate to the phase field ϕ and vectorial microstress ζ conjugate to phase-field gradient ϕ ,
ω = Ψ ϕ = 2 1 ϕ ψ 0 ε + G c θ 1 l ϕ
ζ = Ψ ϕ = G c θ l ϕ
Chemical potential μ is defined by
μ = Ψ C = u 0 + R T ln θ L 1 θ L V H σ H + G c θ θ ˙ 1 2 l φ 2 + l 2 ϕ 2
Consequently, flux J can be obtained by Equations (34) and (52).
J = D C R T μ = D C θ L 1 θ L θ L + D C R T V H σ H
The influence of the phase field on hydrogen diffusion is neglected. Furthermore, the occupancy of lattice sites ( θ L < < 1 ) is much less than 1. Flux J can be further simplified as
J = D C + D C R T V H σ H
Material properties decrease with increased hydrogen concentration. For instance, based on the HEDE mechanism, the following cases can be considered, as in Wu et al. [44],
f t θ = φ θ f t 0 ,   G f θ = φ θ G f 0 , φ θ = 1 χ θ
f t 0 and G f 0 indicate fracture strength and fracture energy at a hydrogen concentration of zero (i.e., θ = 0). The diffusion coefficient D and the elastic modulus E are also affected
D = ( 1 χ θ ) D 0 , E = ( 1 χ θ ) E 0
where D 0 is the initial diffusion coefficient. In this paper, the material is iron-based material, and the damage coefficient χ = 0.89 . Therefore, the governing equations and diffusion equations of the coupled phase-field regularized cohesion model can be written as
φ θ G f 0 1 l ϕ l Δ ϕ 2 1 ϕ H = 0 J = φ θ D 0 C + φ θ D 0 C R T V H σ H

3. Results and Discussion

The model PF-CZM is used to verify HAC performance under tensile, shear, and three-point bending loads. Examples (assuming under plane-strain conditions) include hydrogen-dependent fracture energy degradation, without considering mechanical–chemical coupling, mechanical–chemical coupling, and the diffusion coefficient D is influenced by both the phase field and the chemical field based on mechanical–chemical coupling.

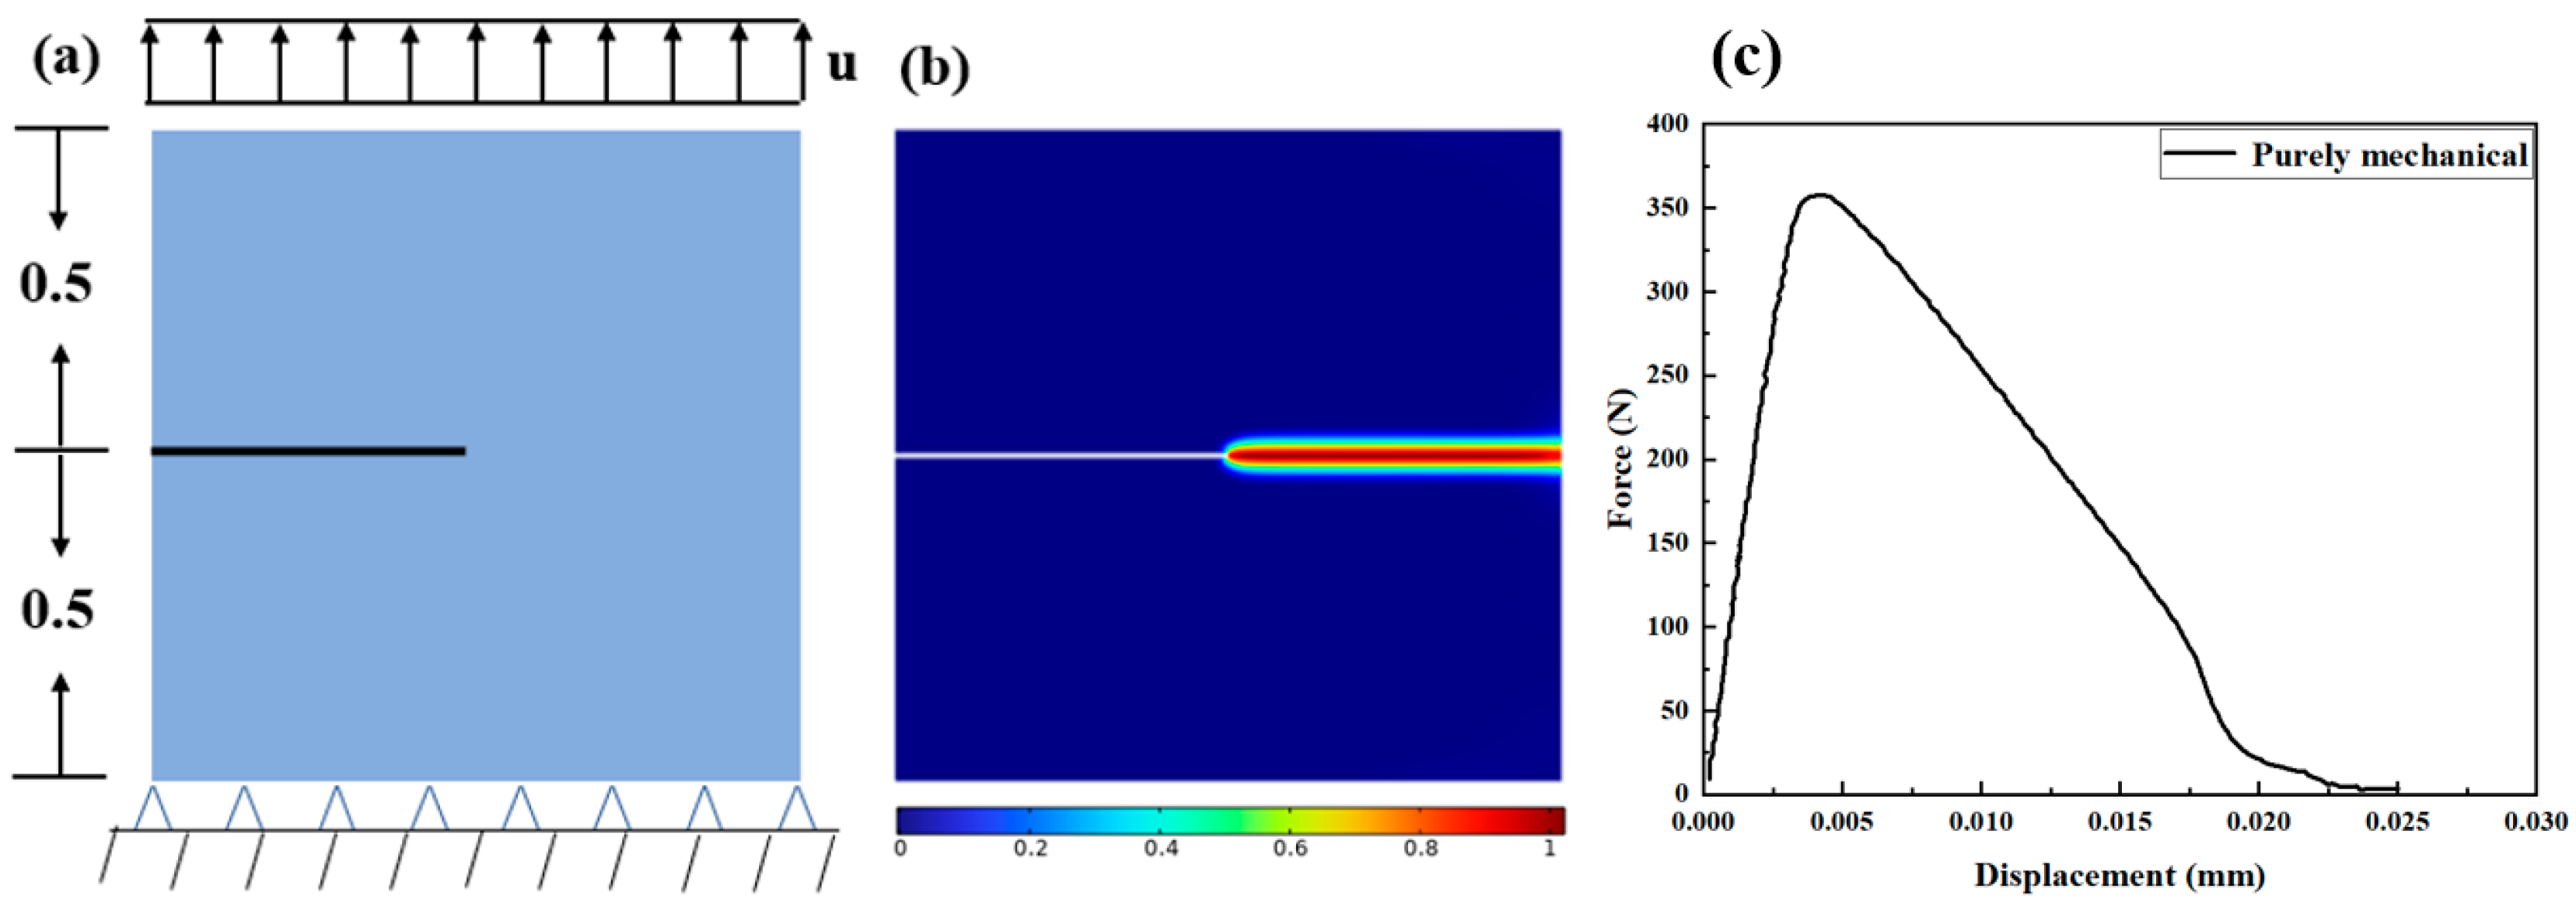
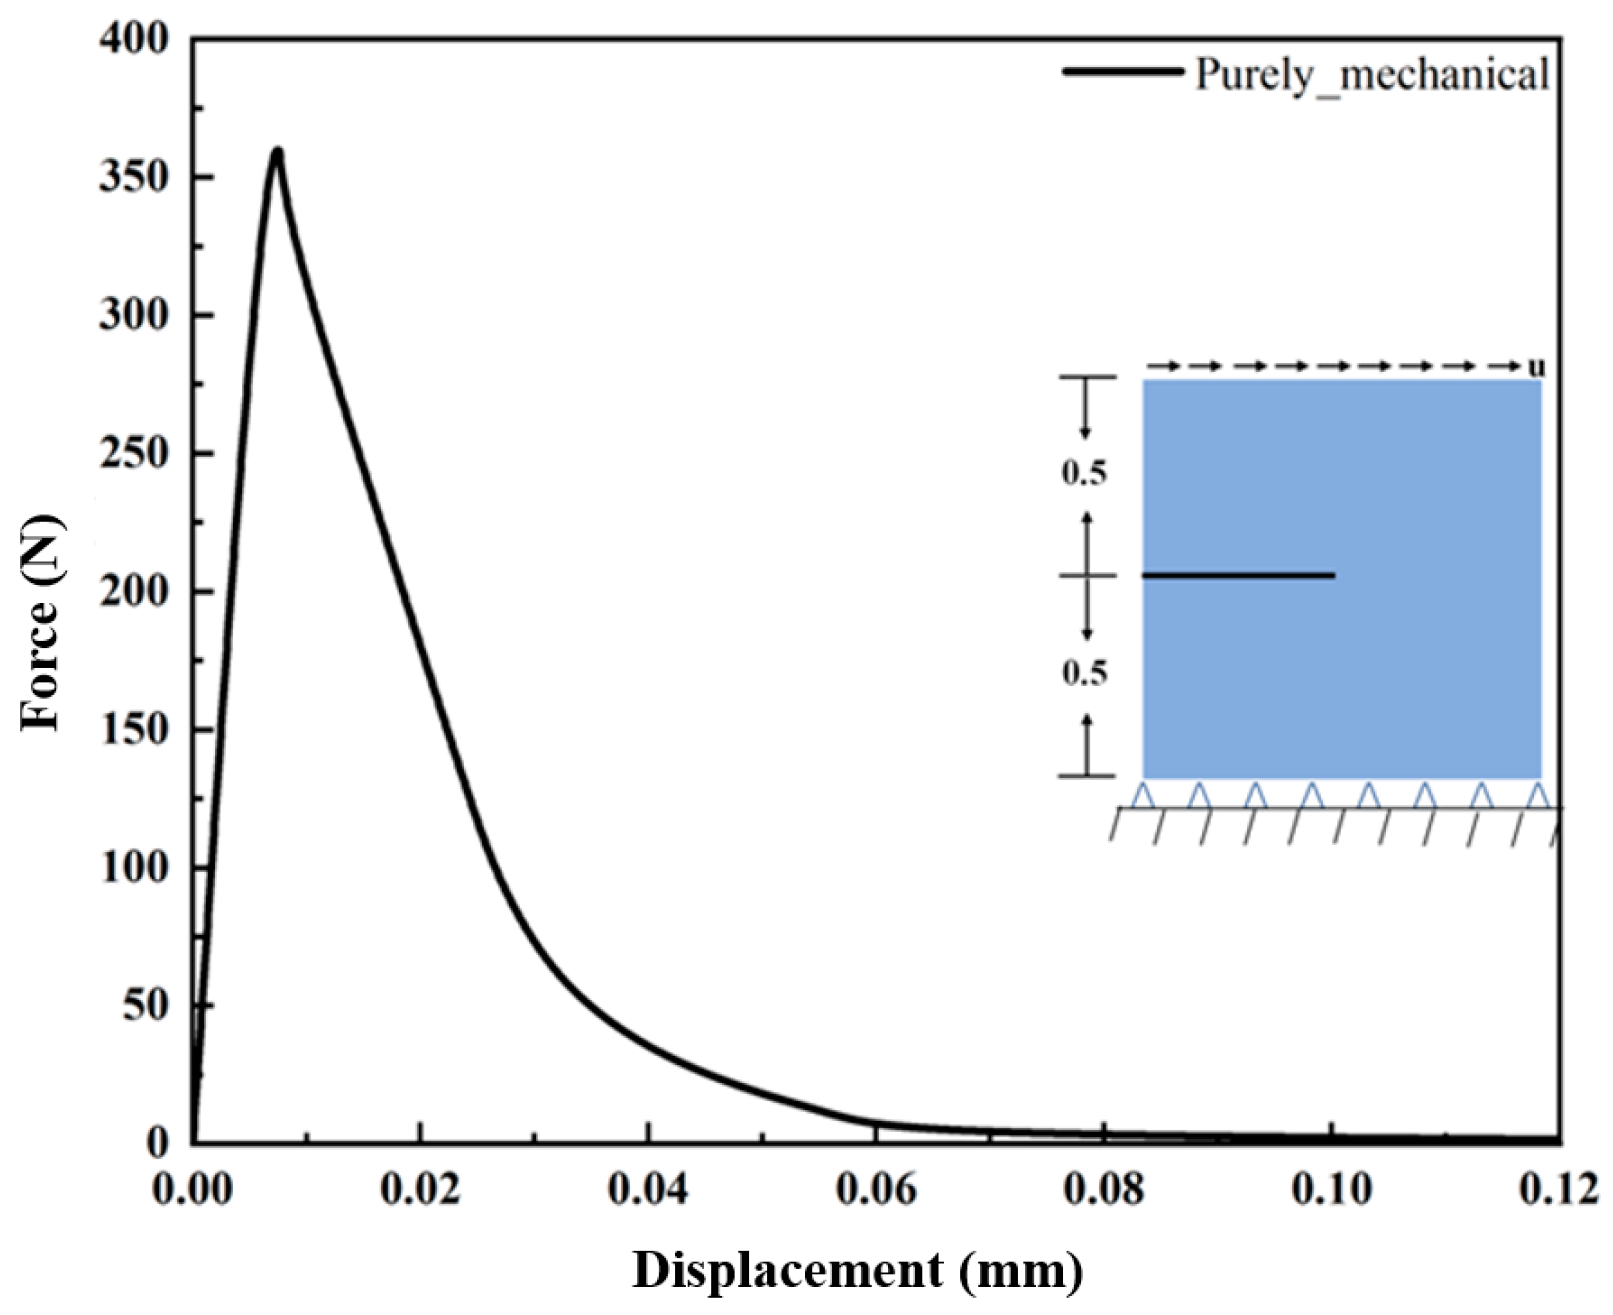
3.1. Cracked Square Plate Subjected to Tensions at Hydrogen Concentration

The case of a square plate with initial cracks subjected to tension has become a typical benchmark for phase-field fractures. The case is considered a type-I crack extension. Figure 5a shows the load conditions, specimen size (mm), and boundary conditions. The work specifies uniform vertical displacement load u at the upper boundary of the plate and limits the vertical and horizontal displacements at the lower boundary. Regarding hydrogen concentration, the entire sample exhibits a uniform distribution with C(t = 0) = C0; it displays the hydrogen concentration of C = 0.1, 0.5, and 1 wt ppm at all boundaries (including the cracked surface).
The material used in this work is an iron-based material, and the material parameters are derived from [44,45]. Young’s modulus E = 210 GPa, Poisson’s ratio υ = 0.3 , the diffusion coefficient D = 0.038   mm 2 / s , the critical energy release rate G f 0 = 2.7   N / mm , failure strength f t 0 = 740   MPa and the thickness 0.01 mm. A vertical displacement in the steps of u = 1 × 10 3   mm / s is applied to the upper boundary. Further, the crack length scale parameter l = 0.005   mm . Table 1 shows specific parameters.
Free quadrilateral mesh cells with h min = 0.0015   mm are used. Figure 5b shows the crack growth. The deeper the color represents the greater the damage degree. Figure 5c demonstrates load–displacement curves under purely mechanical loading.
This section is organized as follows: Hydrogen-dependent fracture energy degradation is addressed in Section 3.1.1. Section 3.1.2 presents mechanical–chemical coupling for HAC. The effect of the diffusion coefficient D is finally discussed in Section 3.1.3.

3.1.1. Hydrogen-Dependent Fracture Energy Degradation

The effect of purely mechanical loading have been studied for the crack extension without hydrogen concentration. However, material properties are affected for hydrogen concentration (Equation (55)), which affects the crack extension. The effect of prefabricated cracks on the crack extension of a square plate is considered at three different hydrogen concentrations, i.e., C = 0.1, 0.5, and 1.0 wt ppm, respectively, to verify the effect of the condition without mechanical–chemical coupling. Load conditions, specimen size (mm), boundary conditions, and material properties are the same as in Section 3.1.
Figure 6 shows load–displacement curves at three types of hydrogen concentration. The peak load decreases with the increased hydrogen concentration. This is because the hydrogen-enhanced decohesion affects model damage by reducing the critical energy release rate of the material. The critical energy release rate of the material decreases with the increase in hydrogen concentration, which leads to the decrease in the peak load of the material to achieve failure, and the speed of crack propagation is significantly enhanced.
Figure 7 intuitively presents the crack growth in different periods and hydrogen concentration. Mechanical properties of the specimen exhibit strong sensitivity to the chemical environment with increased hydrogen concentration, and the crack propagation rate is significantly accelerated. The crack propagation trend is the same as that of load–displacement curves. Hydrogen concentration decreases material strength and the peak load, and it significantly increases the crack propagation speed.
The crack growth, concentration distribution and stress distribution at different times are shown clearly in Figure 8 when the hydrogen concentration is 0.1 wt ppm. Under the combined effect of mechanical loading and hydrogen concentration, the crack begins to expand. The stress in the crack tip region promotes the diffusion of hydrogen concentration. With further crack propagation, more hydrogen diffuses to the crack tip region through diffusion and the influence of stress, resulting in the highest hydrogen concentration always in the crack tip region. This creates a local concentration gradient that accelerates the crack propagation rate.
Figure 9a,b show changes in the elastic moduli of different concentrations to further quantitatively investigate the effect of hydrogen concentration on material properties. The elastic modulus does not degenerate consistently under hydrogen concentration. It decreases by 23.4%, 25.4%, 26.7%, 27.2%, and 27.2% compared with the condition without hydrogen when C = 0.1, 0.5, 1.0, 2.0, and 3.0 wt ppm, respectively.

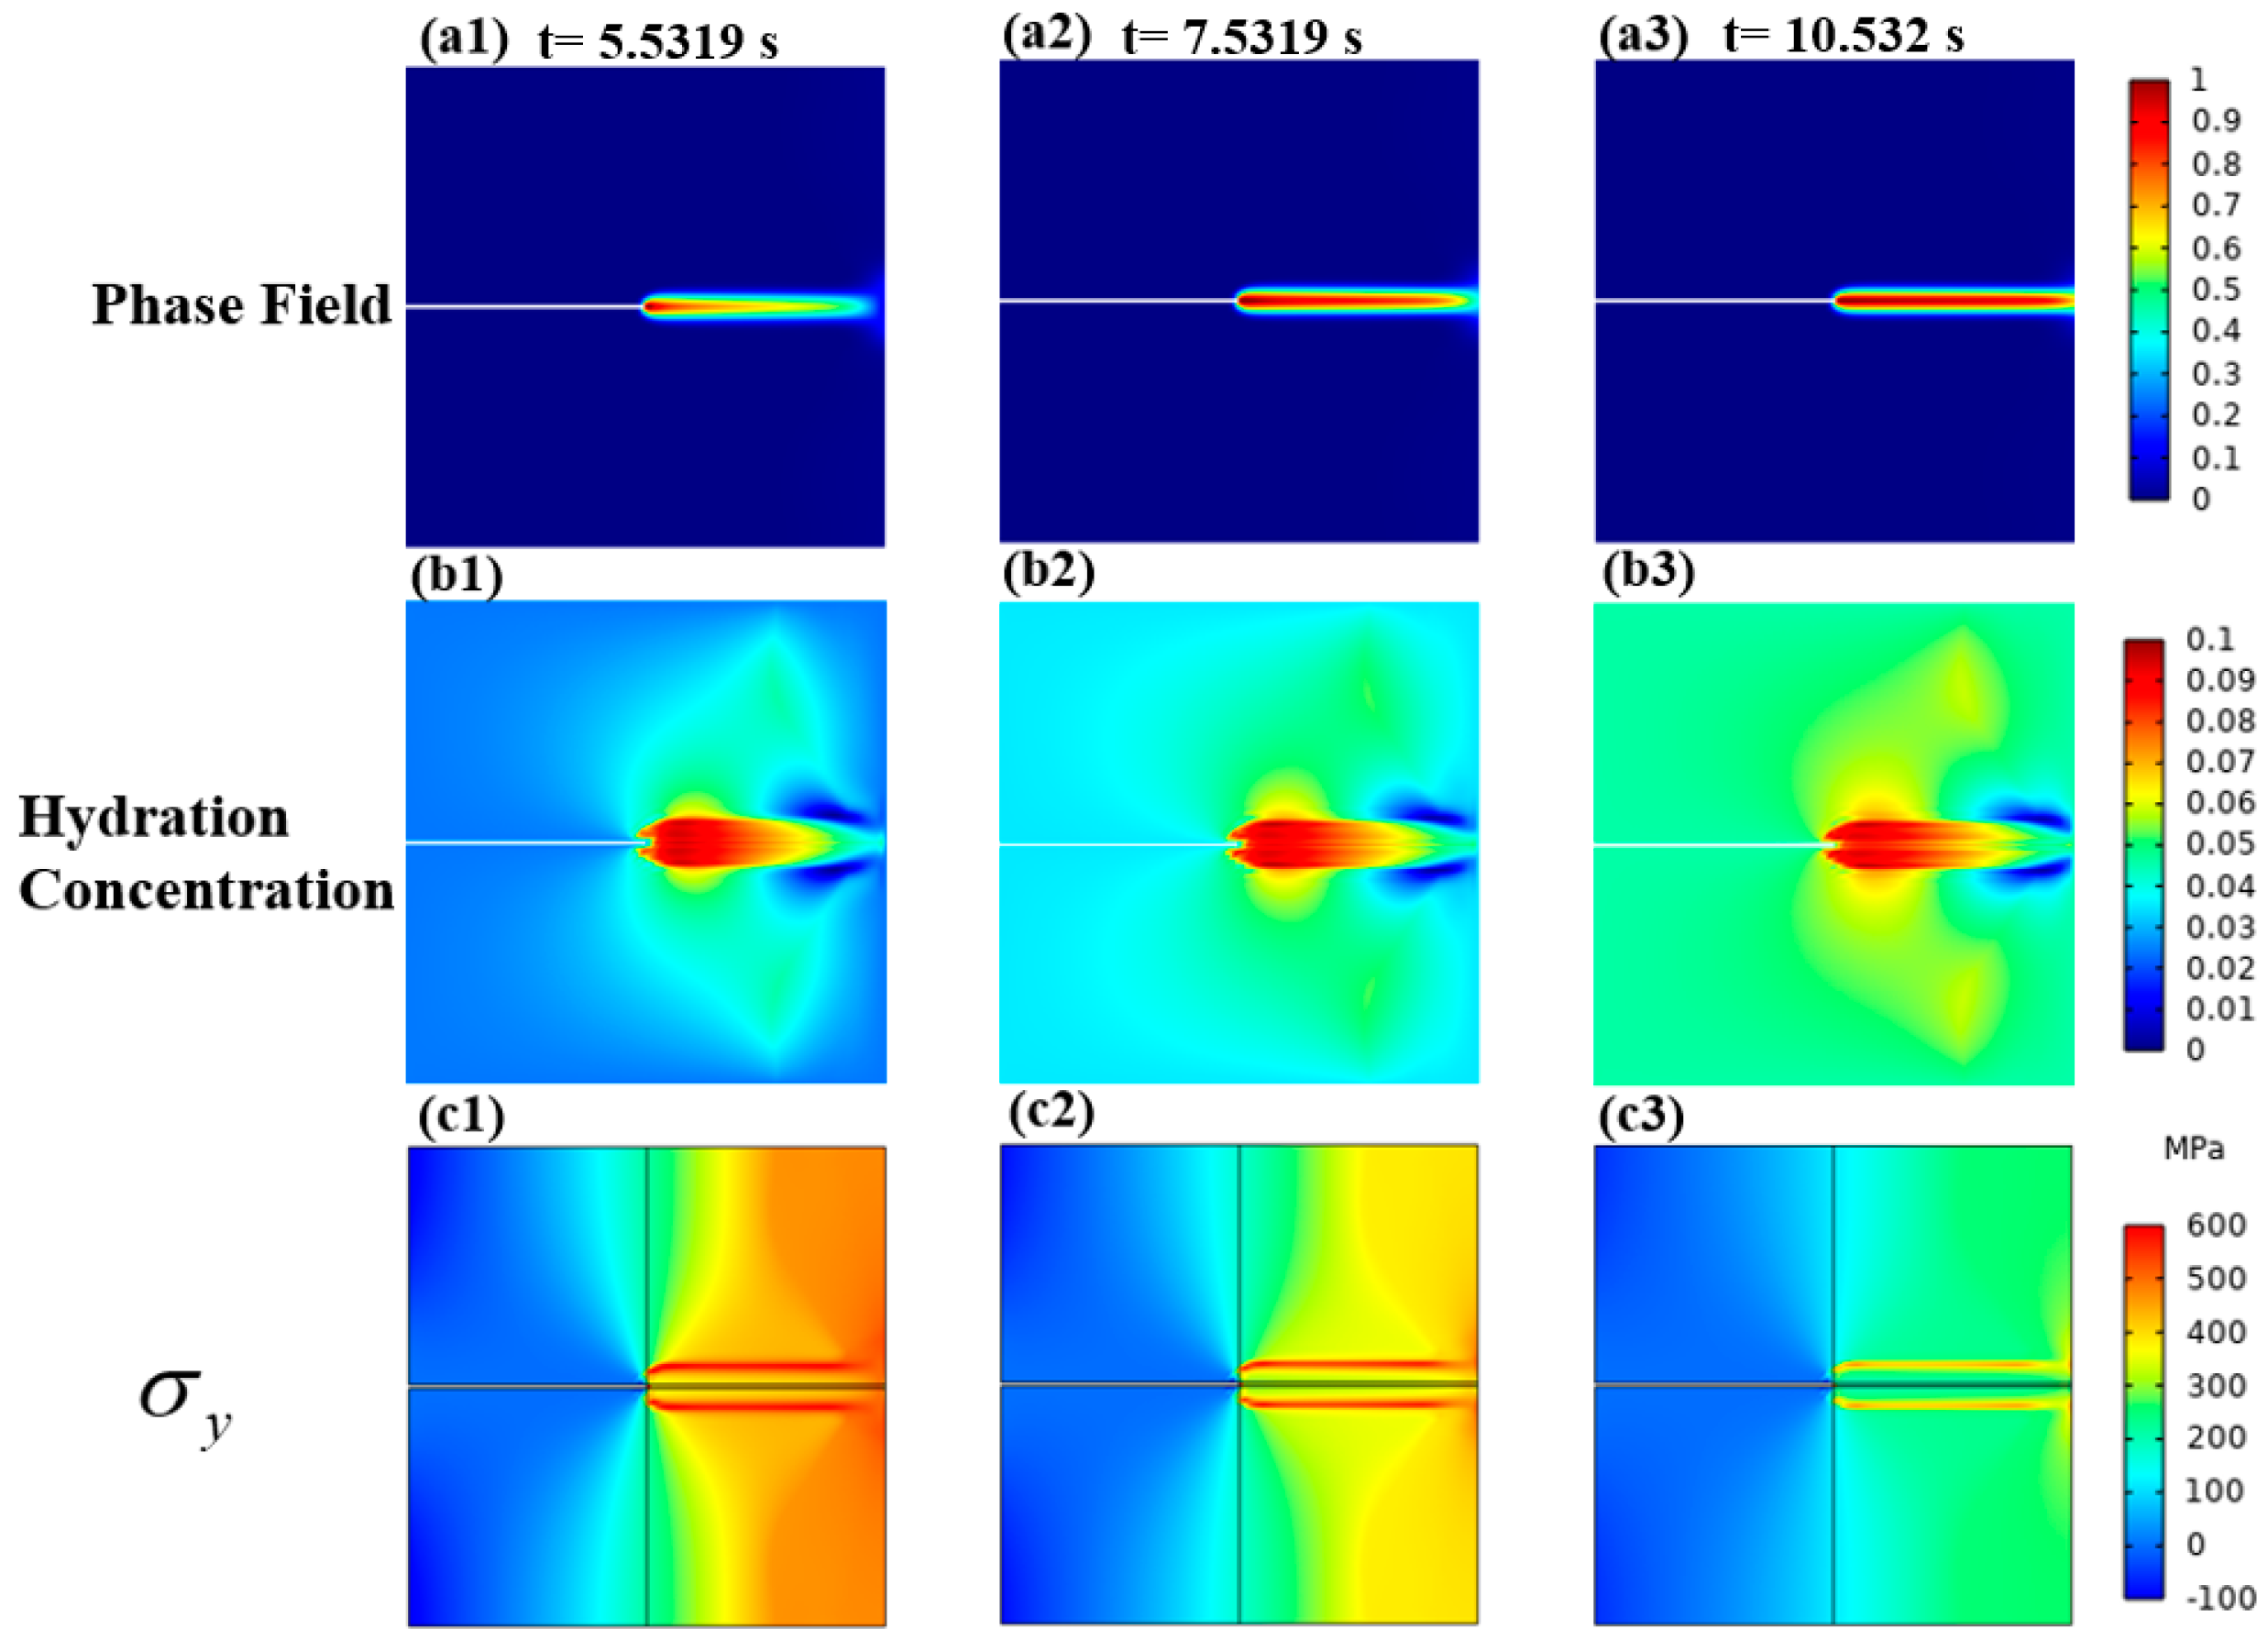
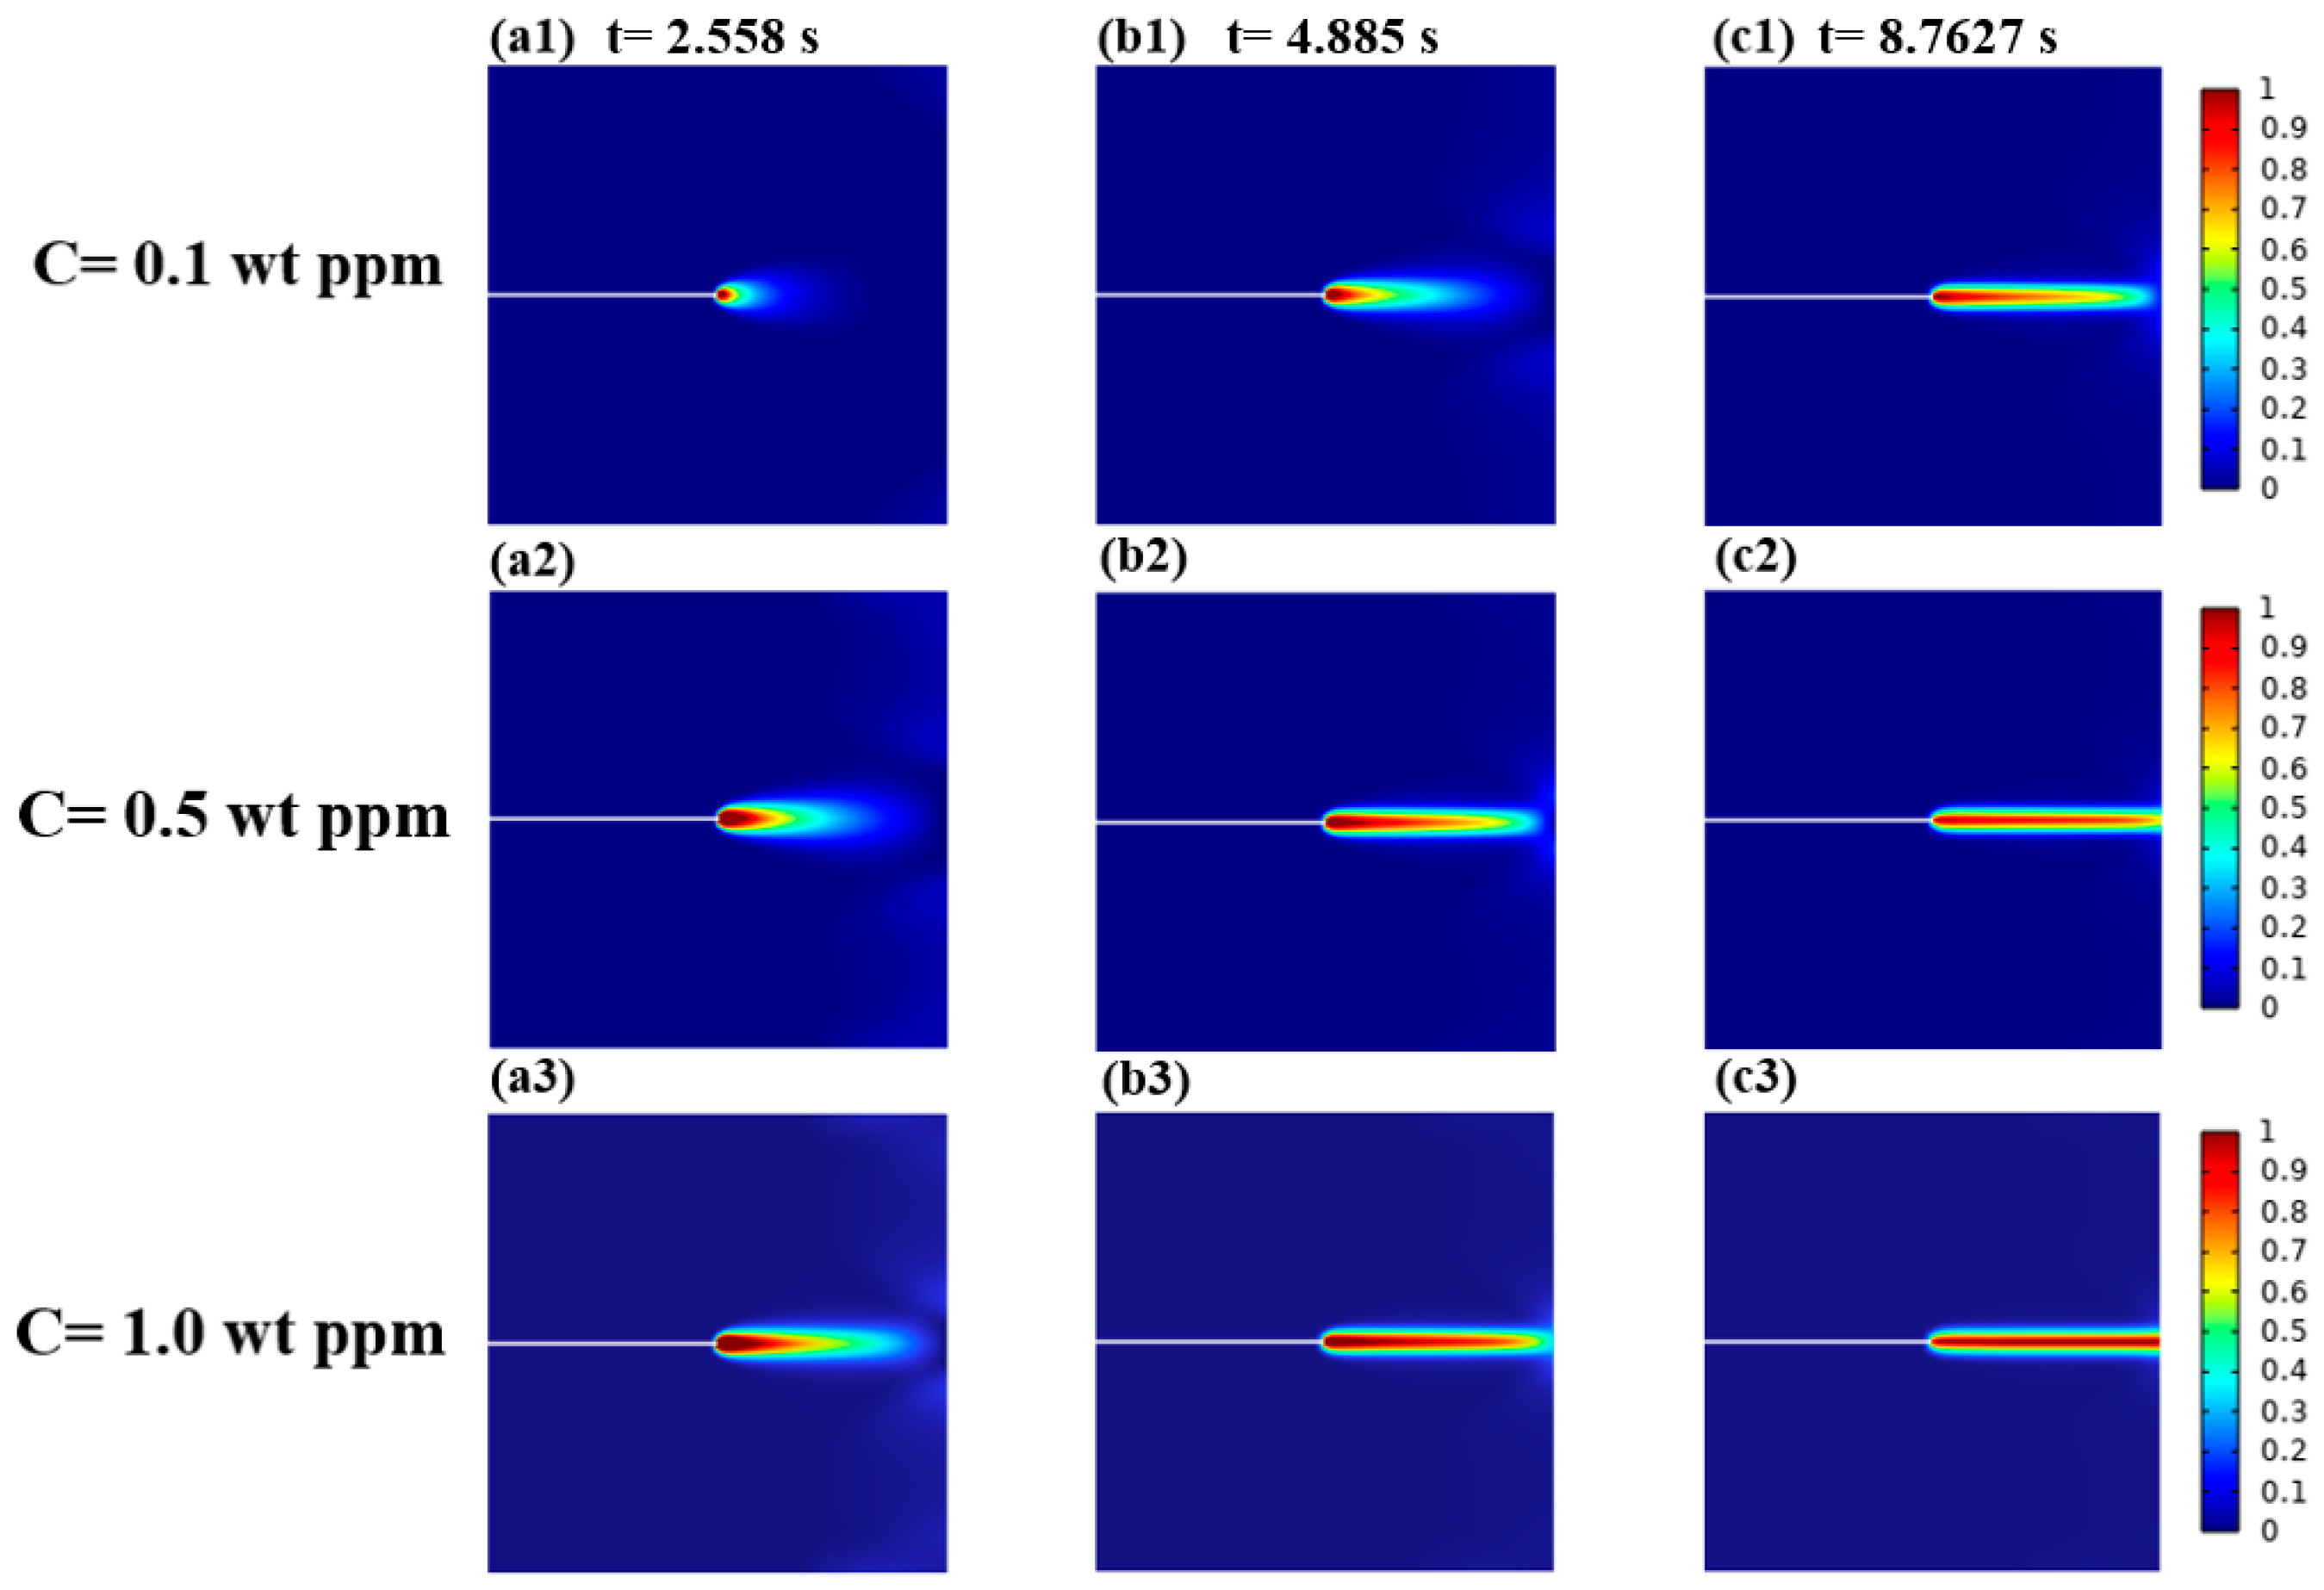
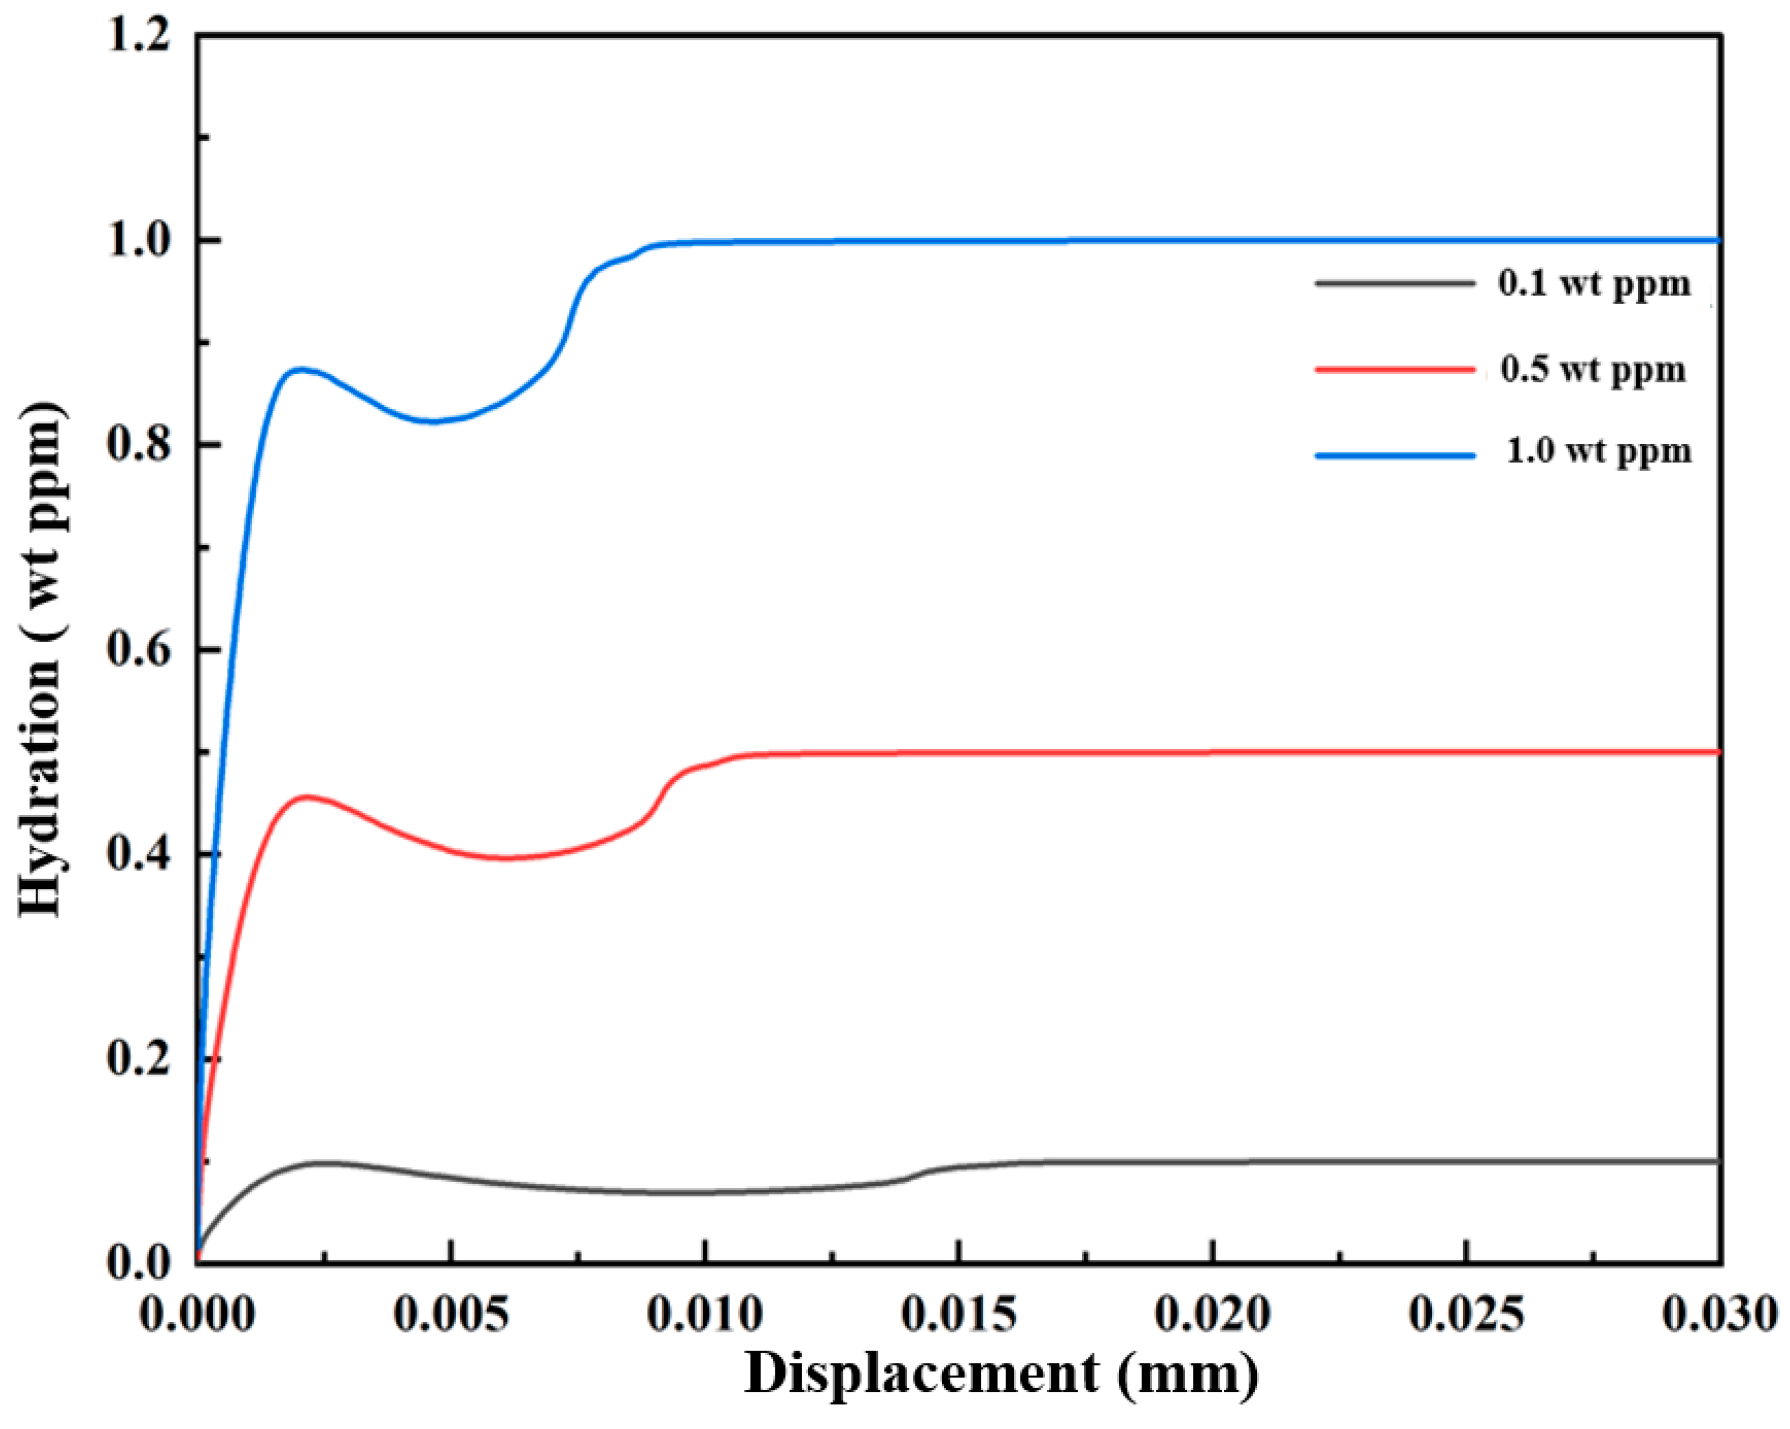
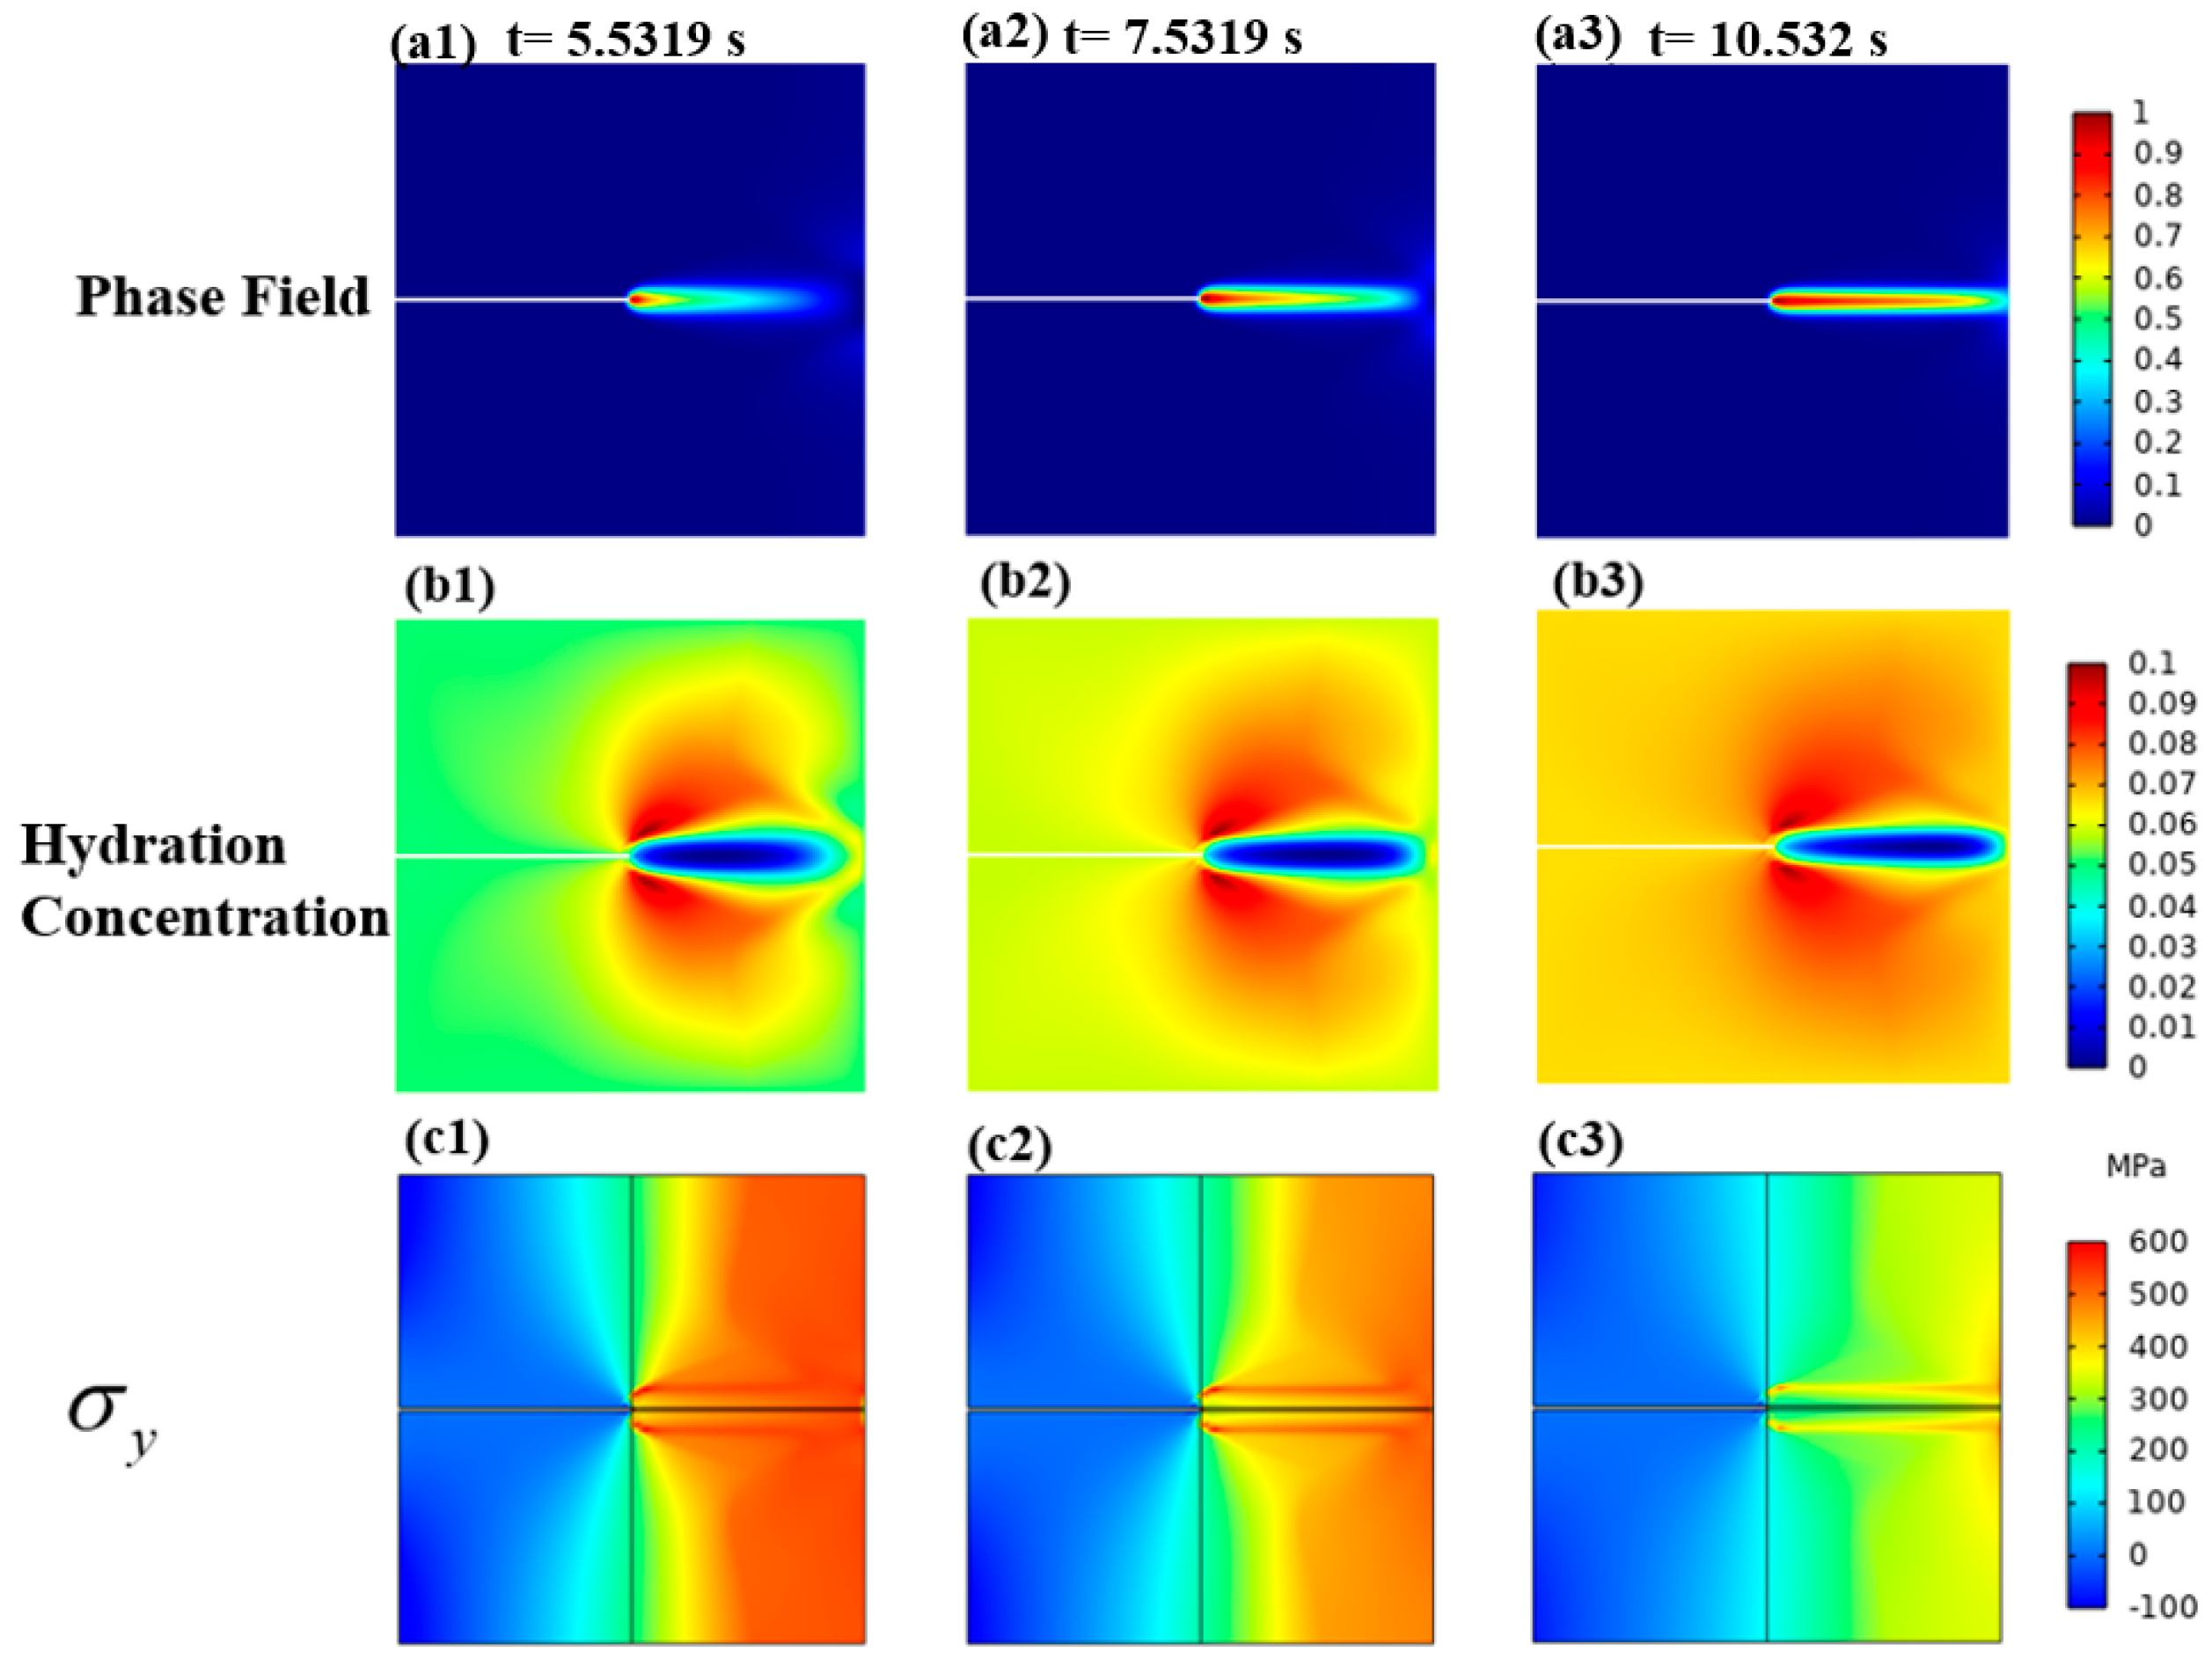
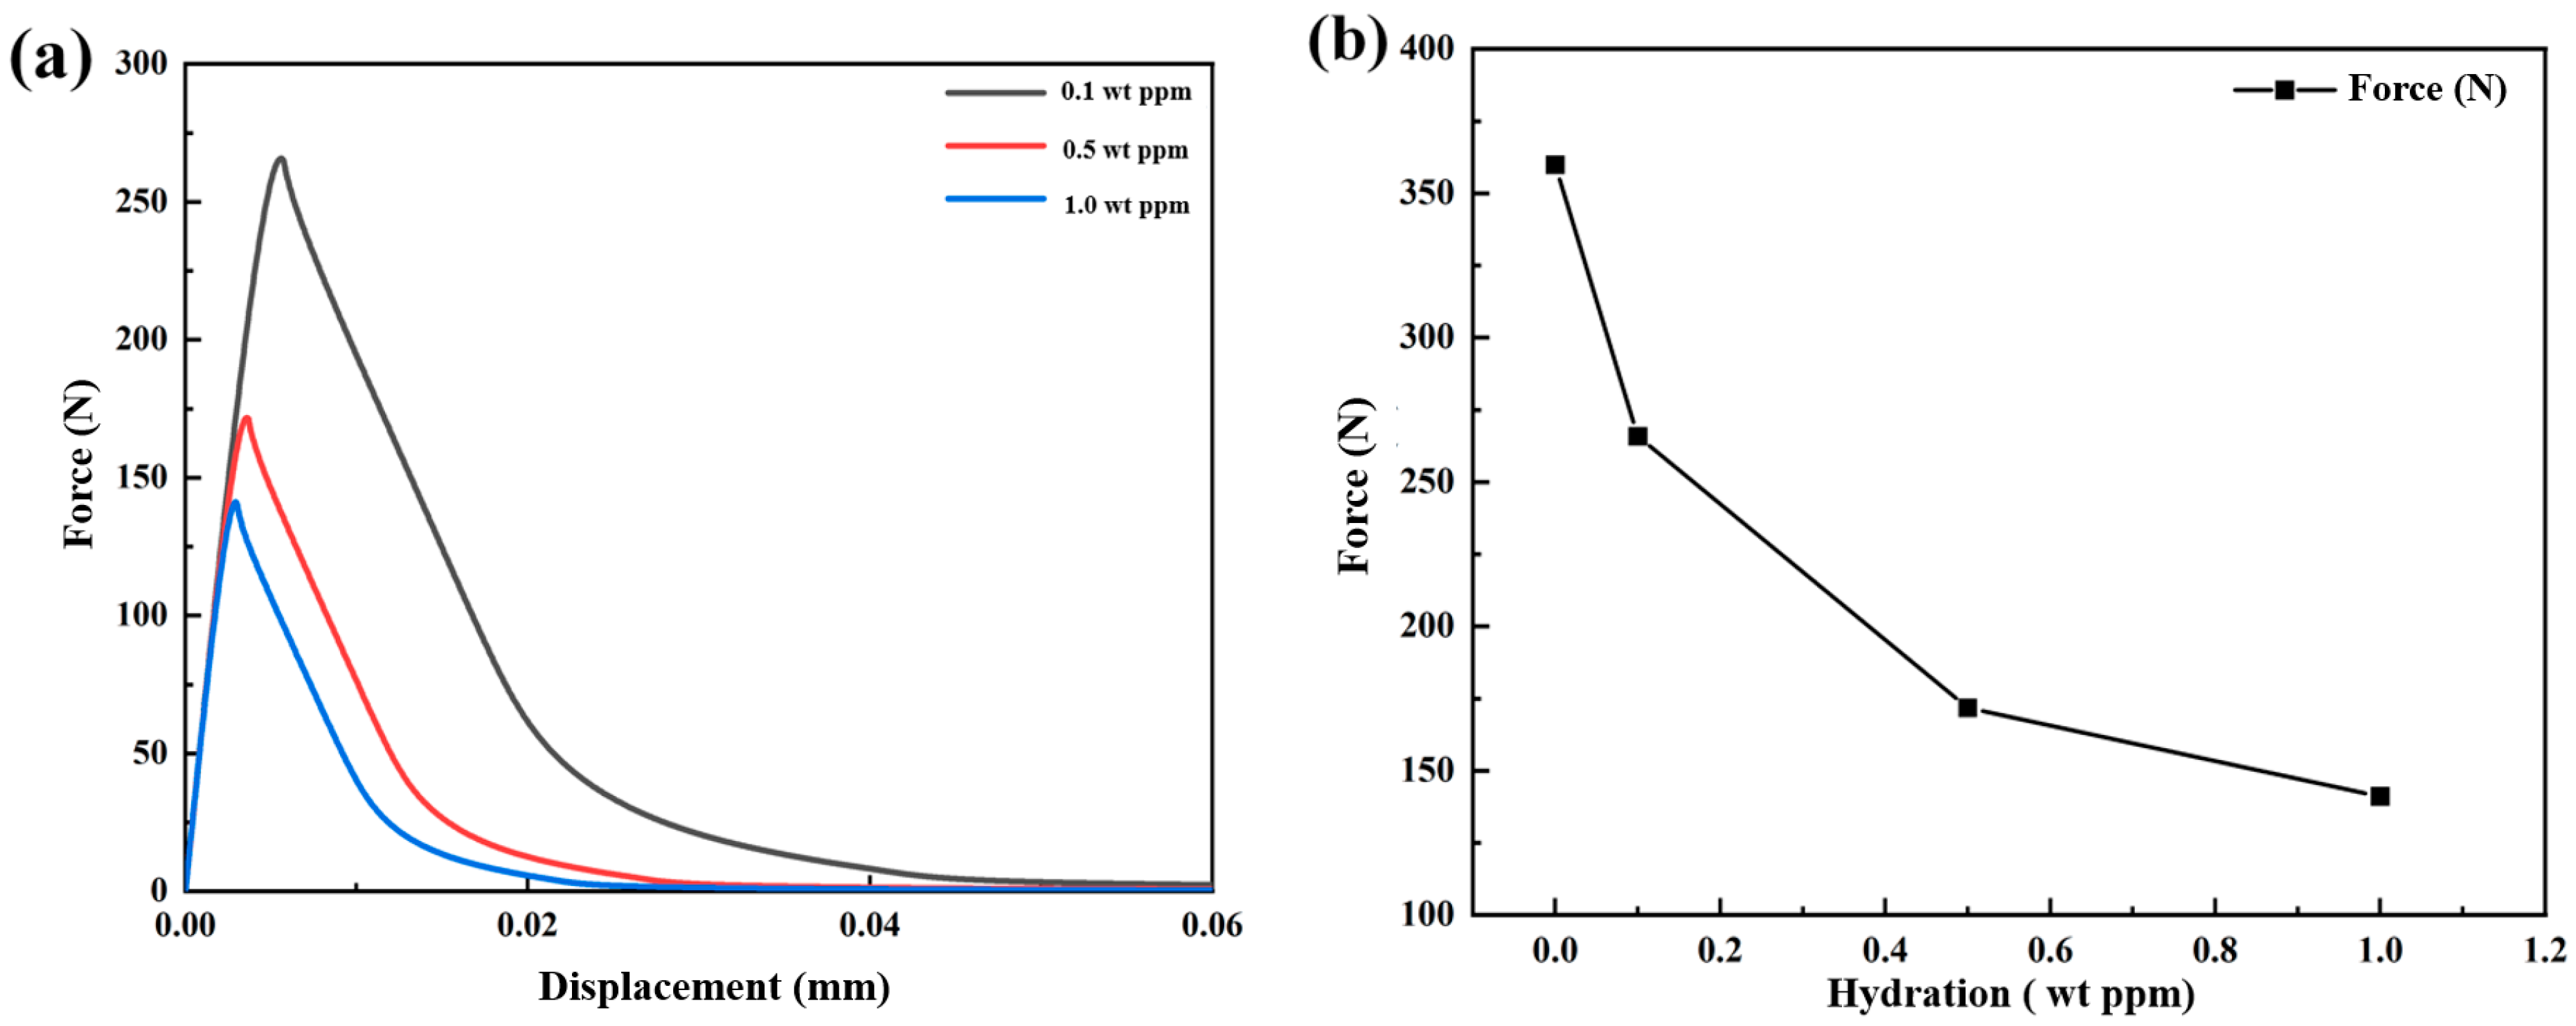
3.1.2. Mechanical–Chemical Coupling

Attention is paid to the effect of cracked square plates on the crack extension under mechanical–chemical coupling in this section. Load conditions, specimen size (mm), boundary conditions, and material properties are the same as in Section 3.1. We considered the effect of prefabricated cracks on the crack extension of a square plate at three different hydrogen concentrations, i.e., C = 0.1, 0.5, and 1.0 wt ppm, respectively.
Figure 10a shows load–displacement curves for different concentrations of mechanical–chemical coupling. The fracture strength of the specimen decreases with increased hydrogen concentration, which is the same as that of material properties affected by the degradation function. Figure 10b demonstrates load–displacement curves for the two cases. Peak loads of mechanical–chemical coupling are 266.97, 175.55, and 145.13 N when C = 0.1, 0.5, and 1.0 wt ppm. Peak loads of material properties affected by the degradation function are 263.13, 173.95, and 144.17 N, respectively.
Figure 11 illustrates the crack extension under mechanical–chemical coupling at different concentrations. The crack propagation rate under mechanical–chemical coupling is slightly slower at low concentration compared to material properties affected by the degradation function. The expansion rate of the two is almost identical at high concentrations.
Take C = 0.1 wt ppm as an example. Three moments are analyzed from the onset of damage to final failure under mechanical–chemical coupling. Phase-field evolution, concentration diffusion, and stress evolution are analyzed. Figure 12 shows the main mechanism of the model, e.g., (a1–a3) the crack phase field at different periods, (b1–b3) hydrogen concentration diffusion at different periods, and (c1–c3) stress clouds in the y direction at different periods.
The pressure accumulates at the crack tip, and the crack starts to grow into a tensile area at the tip for the external load. The crack tip expands horizontally toward the right boundary, and Figure 12(a1–a3) presents the crack expansion. Figure 12(b1–b3) illustrates varying hydrogen concentrations at corresponding periods. The crack extension promotes hydrogen concentration diffusion for mechanical–chemical coupling. The coupling effect significantly enhances the speed compared to the degradation function’s impact on the material at the same moment. Figure 12(c1–c3) and Figure 13 demonstrate stress clouds in the y direction at the same time and the course of the crack tip along the crack path under different hydrogen concentrations.

3.1.3. Effect of the Diffusion Coefficient D on the Crack Extension

The diffusion coefficient is related to porosity. However, concentration transport changes with mechanical damage, and varying microcracks affect the diffusion coefficient. The diffusion coefficient is considered to be affected by phase-field damage and varying concentrations in this section under mechanical–chemical coupling (Equation (56)). Load conditions, specimen size (mm), boundary conditions, and material properties are the same as in Section 3.1.
Under mechanical–chemical coupling, the diffusion coefficient D is influenced by mechanical loading and concentration diffusion, which changes the porosity of the material and influences the concentration diffusion. The rate of crack growth is affected by the change in porosity. In the tensile model, the effect of the diffusion coefficient D on the crack extension is shown in Figure 14 and Figure 15; although the diffusion coefficient D changes the porosity of the material to some extent, it has very little influence on the crack propagation.

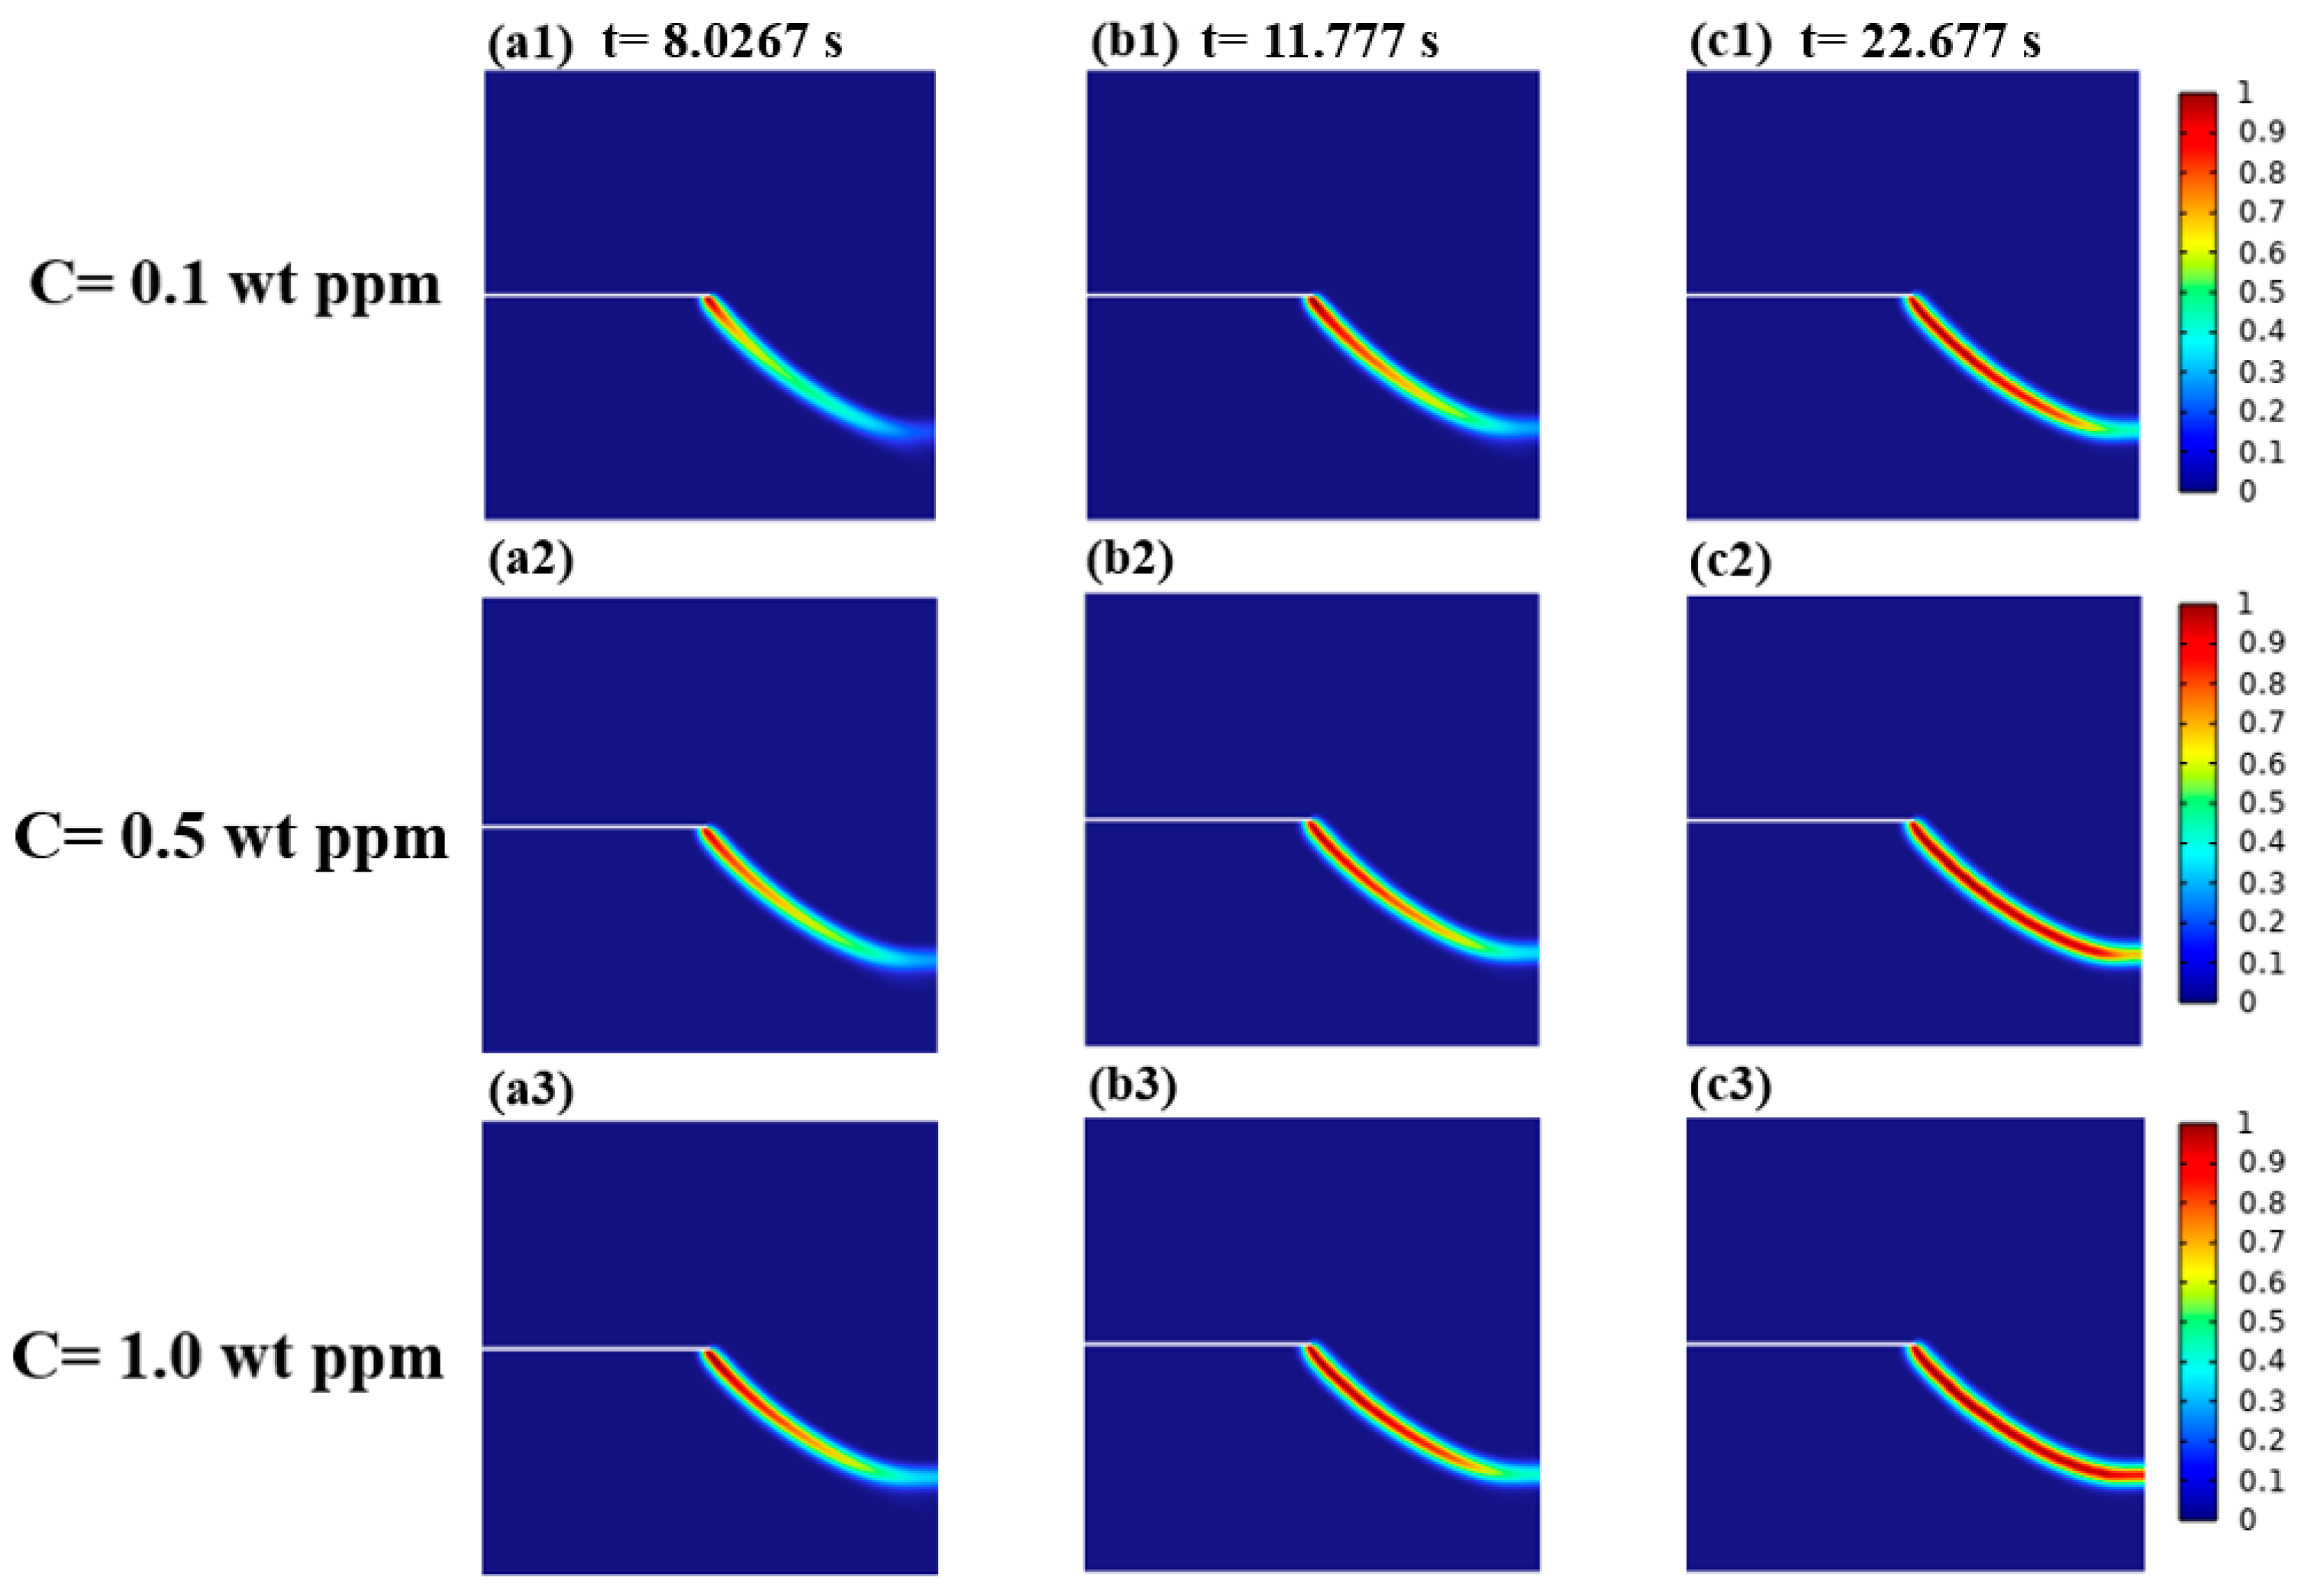
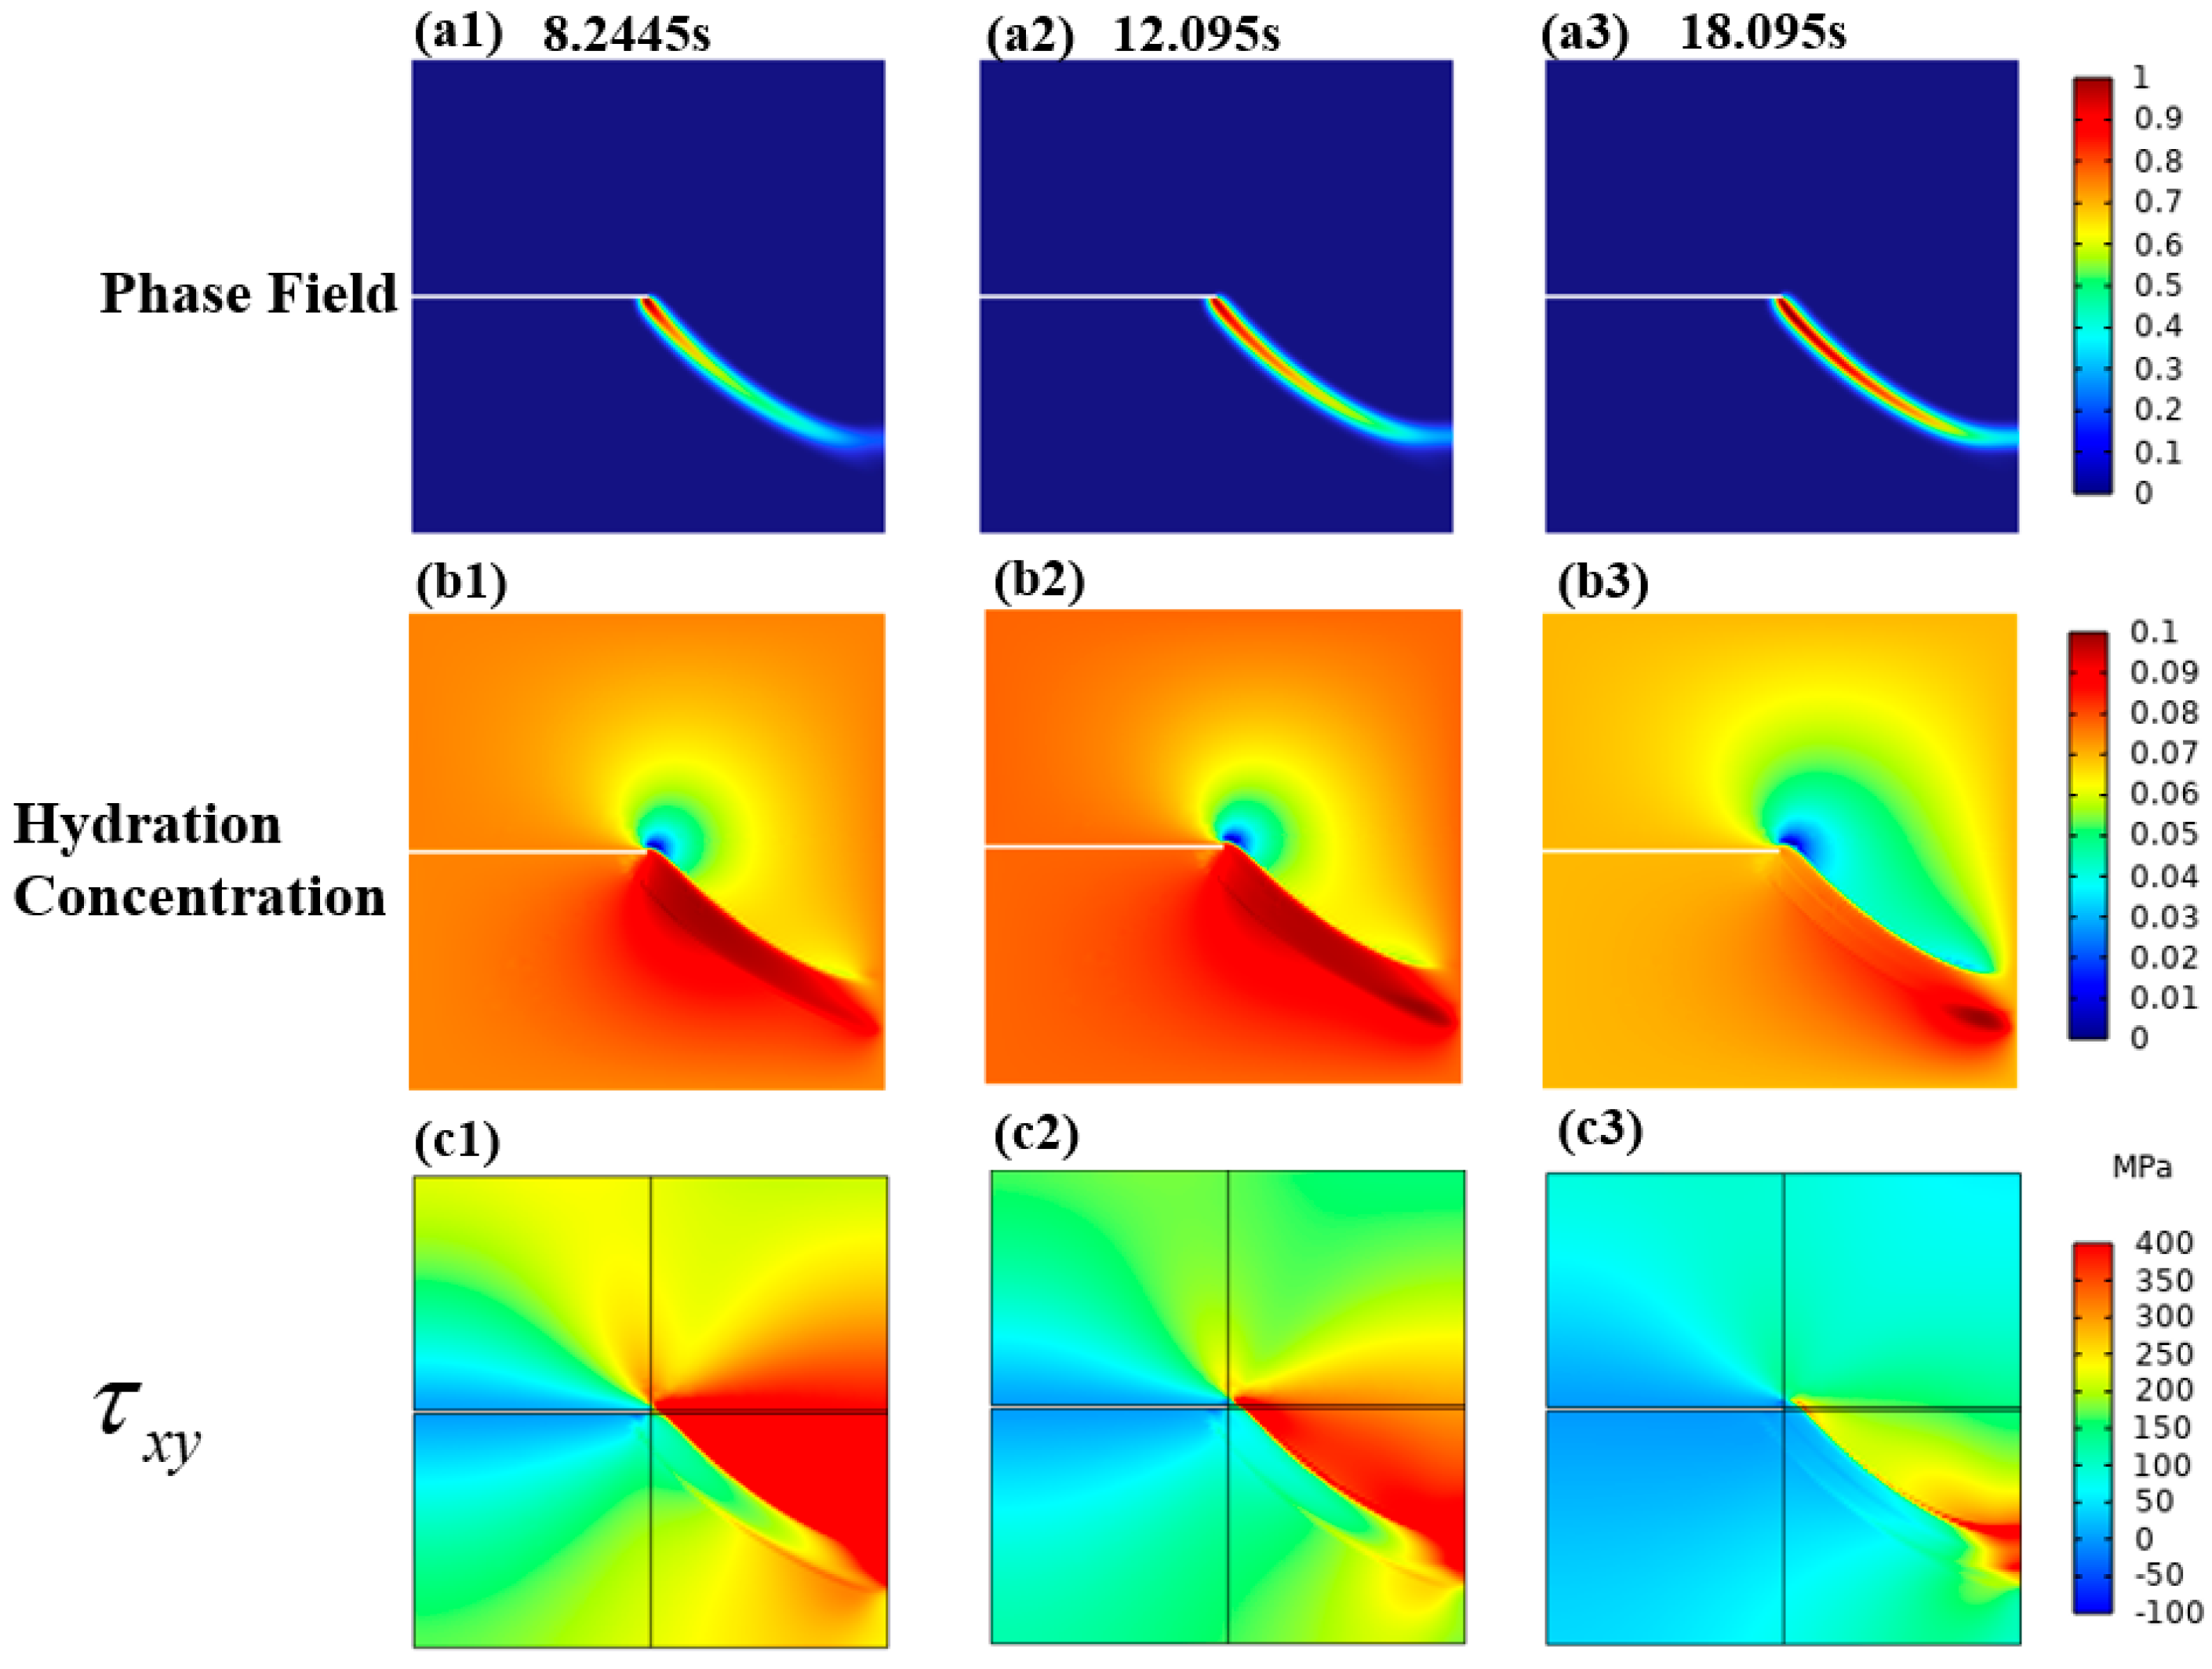
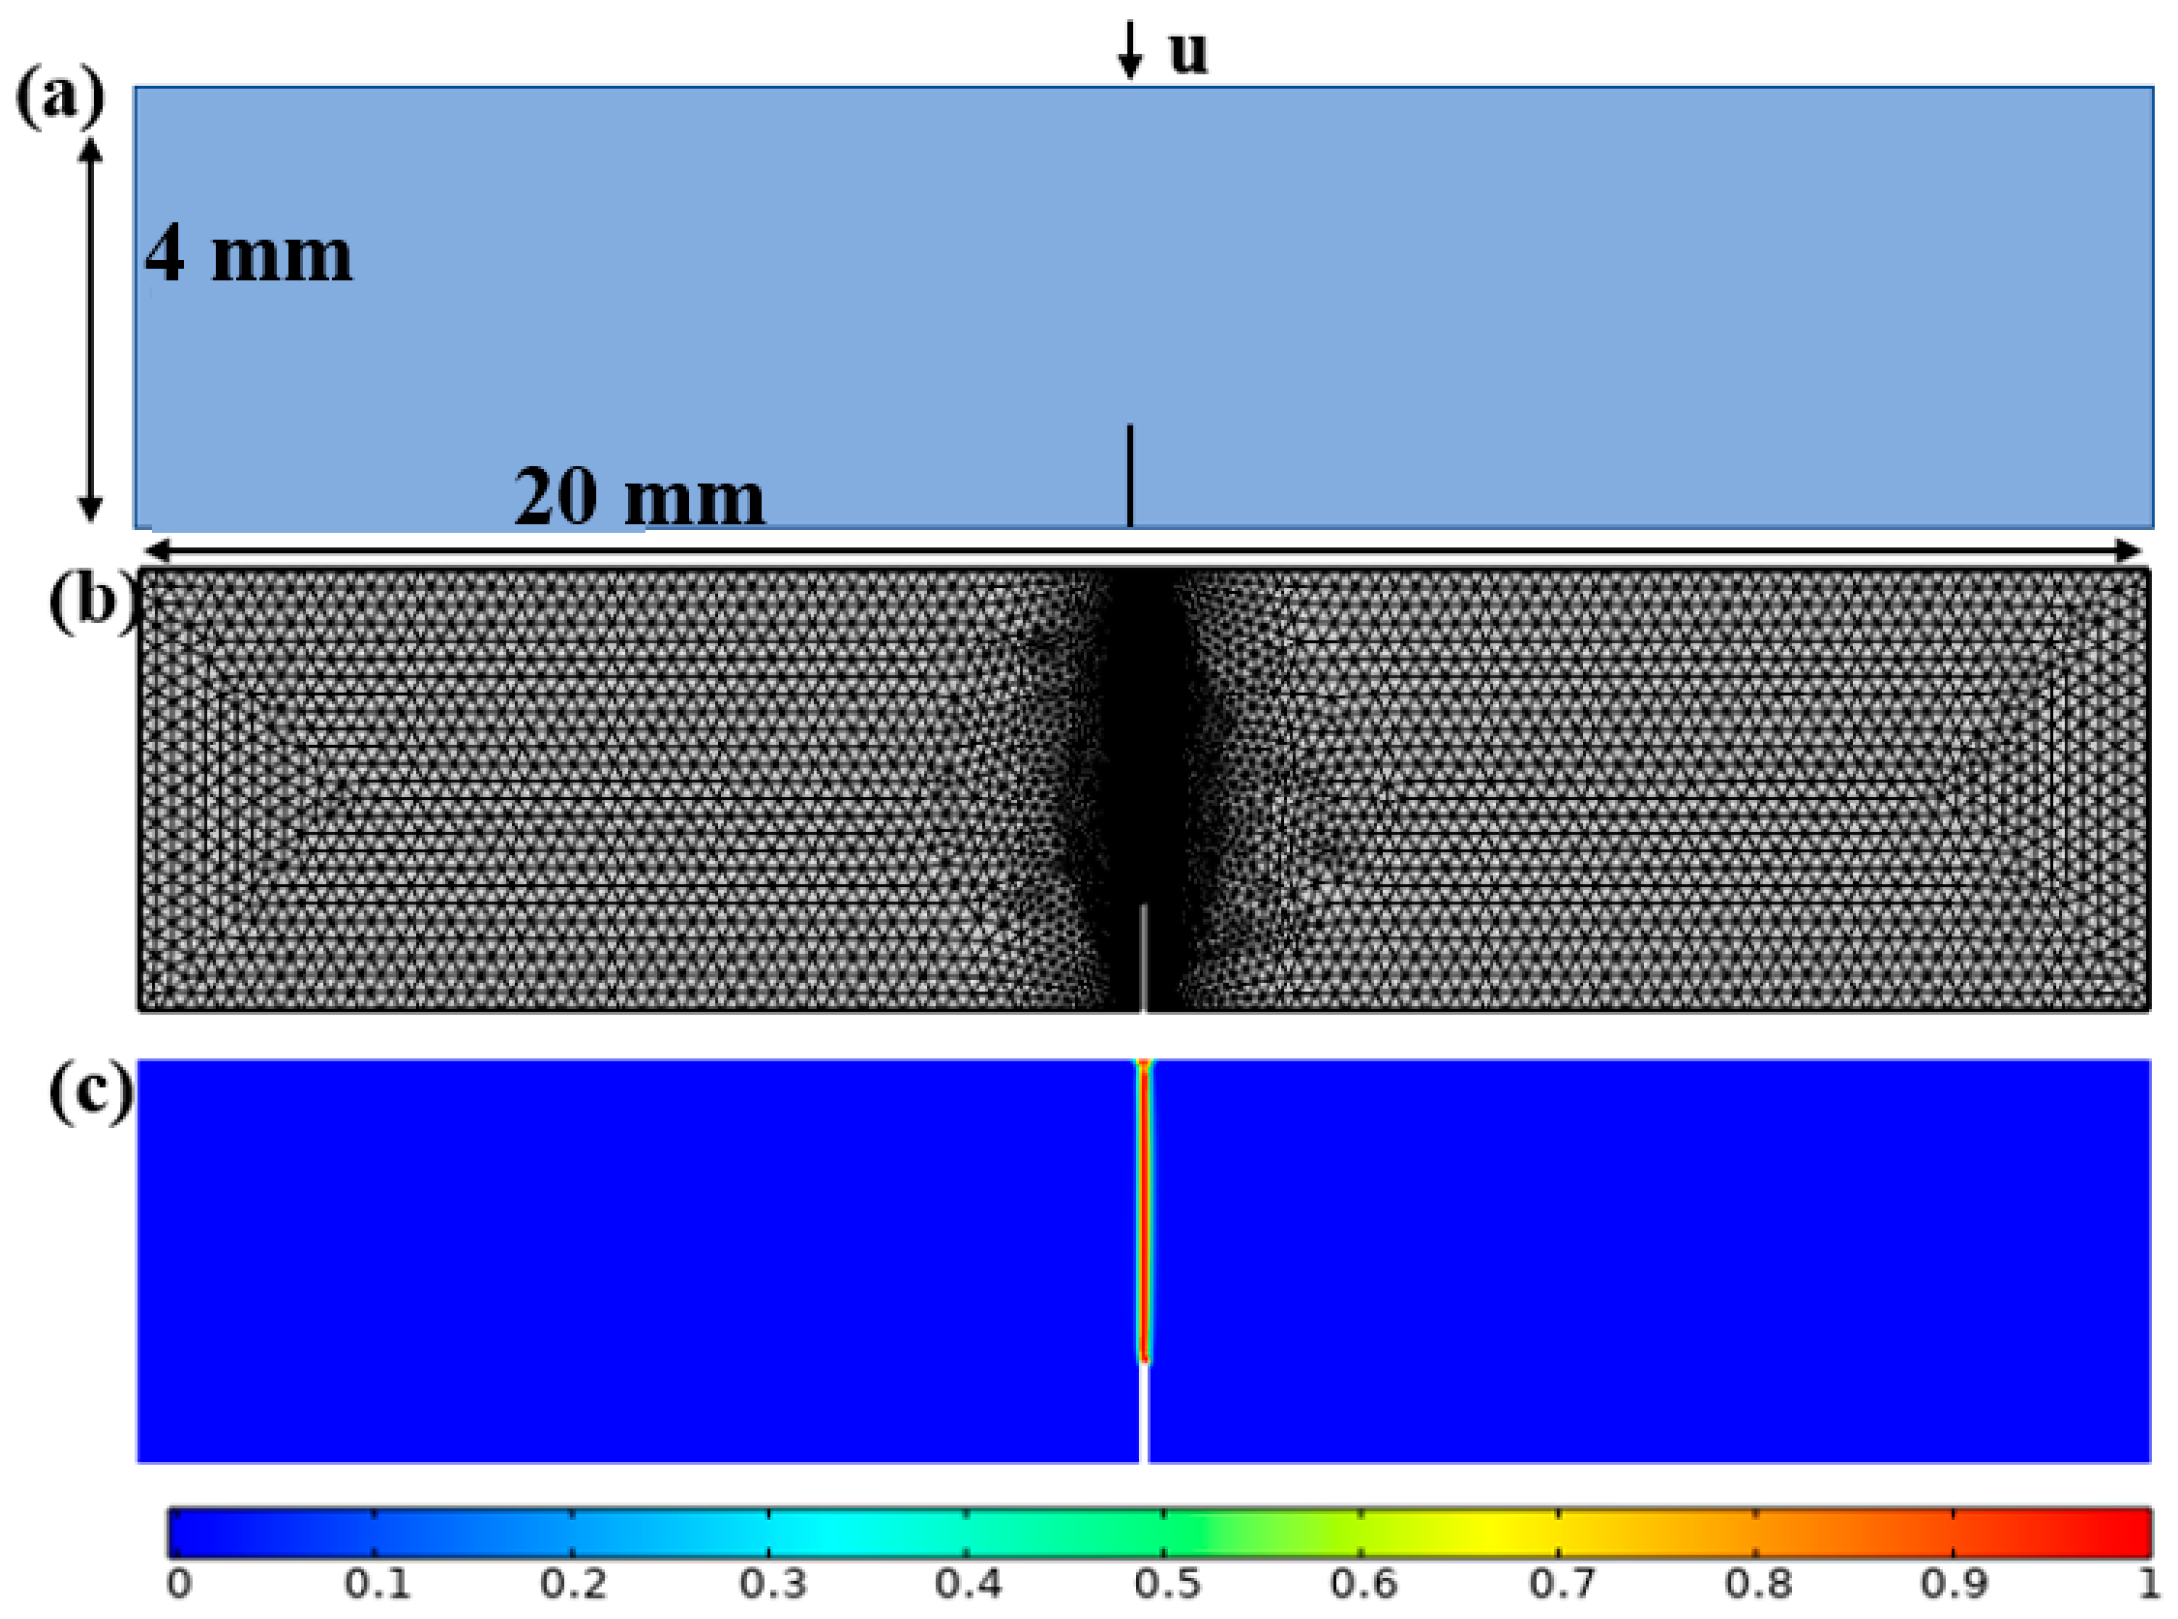
3.2. A Cracked Square Plate Subjected to Shear at Hydrogen Concentration

The shear model of a cracked square plate is studied using the same methods and procedures in Section 3.1. Figure 16a shows the geometric model, boundary conditions, and load conditions of the shear simulation. Material properties are as follows: Young’s modulus E = 210 GPa; Poisson’s ratio υ = 0.3; D = 0.038   mm 2 / s ; critical energy release rate G f 0 = 2.7   N / mm ; failure strength f t 0 = 740   MPa . A horizontal displacement to the right in steps of u = 1 × 10 3   mm / s is applied to the upper boundary. A free quadrilateral mesh cell with h min = 0.005   mm is finally adopted. The crack growth area is locally refined, and a finer cell size is adopted to obtain accurate results (Figure 16b).
Figure 16c shows the predicted phase field of the notched cracked square plate under the shear load. The deeper the color represents the greater the damage degree. Cracks form at the tip, and the crack path extends to the right edge at an oblique angle deflected in the x direction. Furthermore, the load–displacement curve in the shear test is shown in Figure 17. It can be observed that compared to the tensile test, a larger displacement is required to reach the peak load in the shear test, and the crack propagation speed is relatively slow. In addition, due to the different crack types produced by the shear test and the tensile test, the crack type in the shear test is usually type II, while the crack type in the tensile test is usually type I. This different crack type may result in a relatively slow crack growth rate in the shear test.

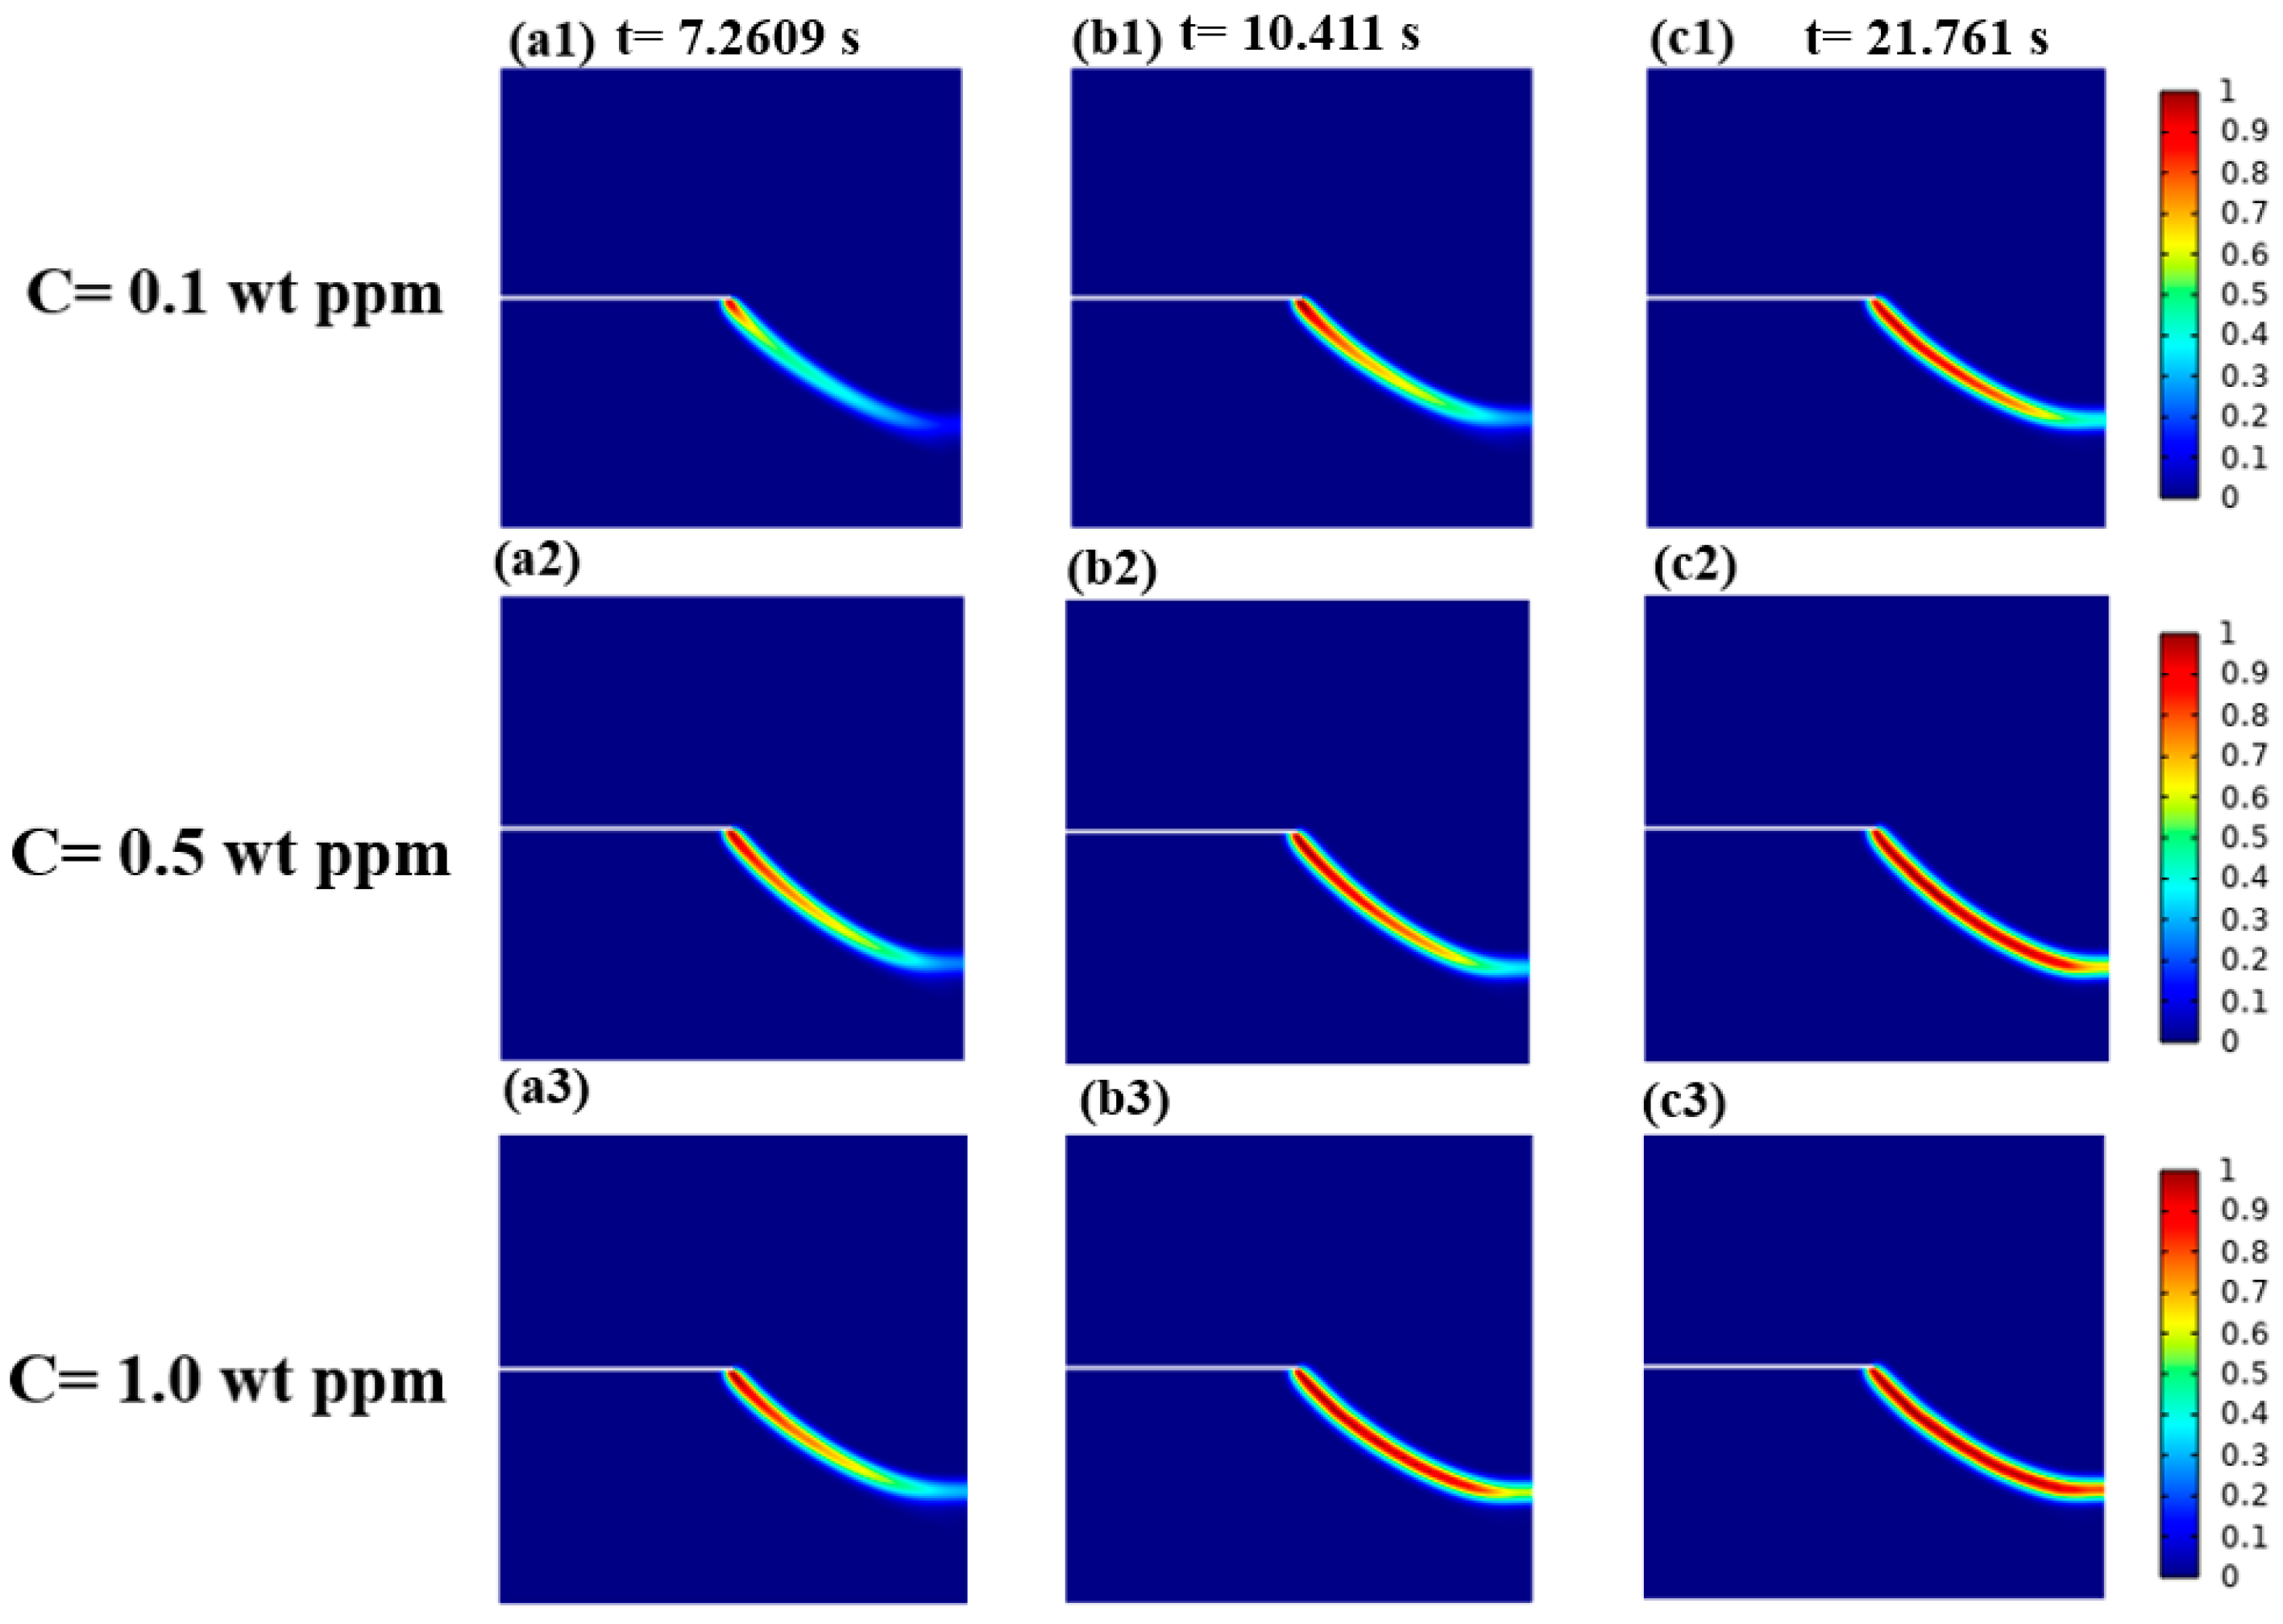
3.2.1. Hydrogen-Dependent Fracture Energy Degradation

The critical energy release rate and the fracture strength of the material are affected in the presence of hydrogen (Equation (55)). We simulate the effect of the shear load on the crack propagation of a square plate with prefabricated cracks under three different hydrogen concentrations (C = 0.1, 0.5, and 1.0 wt ppm). Figure 18a shows load conditions, specimen size (mm), and boundary conditions.
The load–displacement curves at different concentrations are shown in Figure 18a. It can be observed from Figure 18a that increasing the hydrogen concentration decreases the peak load. In a high hydrogen concentration environment, hydrogen atoms can diffuse in the material and accumulate at the crack tip, which leads to an increase in the concentration of hydrogen in the crack tip region, further causing hydrogen-induced embrittlement and significantly accelerating the rate of crack propagation. Therefore, an increase in hydrogen concentration may reduce the load-bearing capacity of the material, which will cause the material to fracture at lower stress levels.
Figure 18b shows the relationship between peak loads and concentration under different hydrogen concentration. Corresponding peak loads are 359.83, 265.76, 171.73, and 141.07 N when C = 0, 0.1, 0.5, and 1.0 wt ppm, which are 26.2, 52.3, 52.3, and 60.8% lower than those without hydrogen concentration, respectively. Material properties are significantly affected, and the crack extension is significantly accelerated in the presence of hydrogen.
Figure 19 presents the three moments of the crack expansion under different con-centration. The larger hydrogen concentration, the faster the crack expansion rate at the same moment. In the high hydrogen concentration environment, hydrogen atoms propagate with the expansion of the crack, which causes hydrogen atoms to accumulate in the crack tip region, which leads to hydrogen-induced embrittlement. As the hydrogen concentration continues to increase, it will further reduce the material’s fracture toughness, making the crack easier to propagation.
Figure 20(a1–a3) illustrates phase-field clouds when C = 0.1 wt ppm, and Figure 20(b1–b3) demonstrates clouds of hydrogen concentration diffusion. There is no more uniform symmetrical diffusion compared to the tensile stress. Figure 20(c1–c3) shows clouds of the shear stress. The upper part of the clouds is larger than the lower part, indicating that the diffusion speed of the upper part is much faster than that of the lower part.

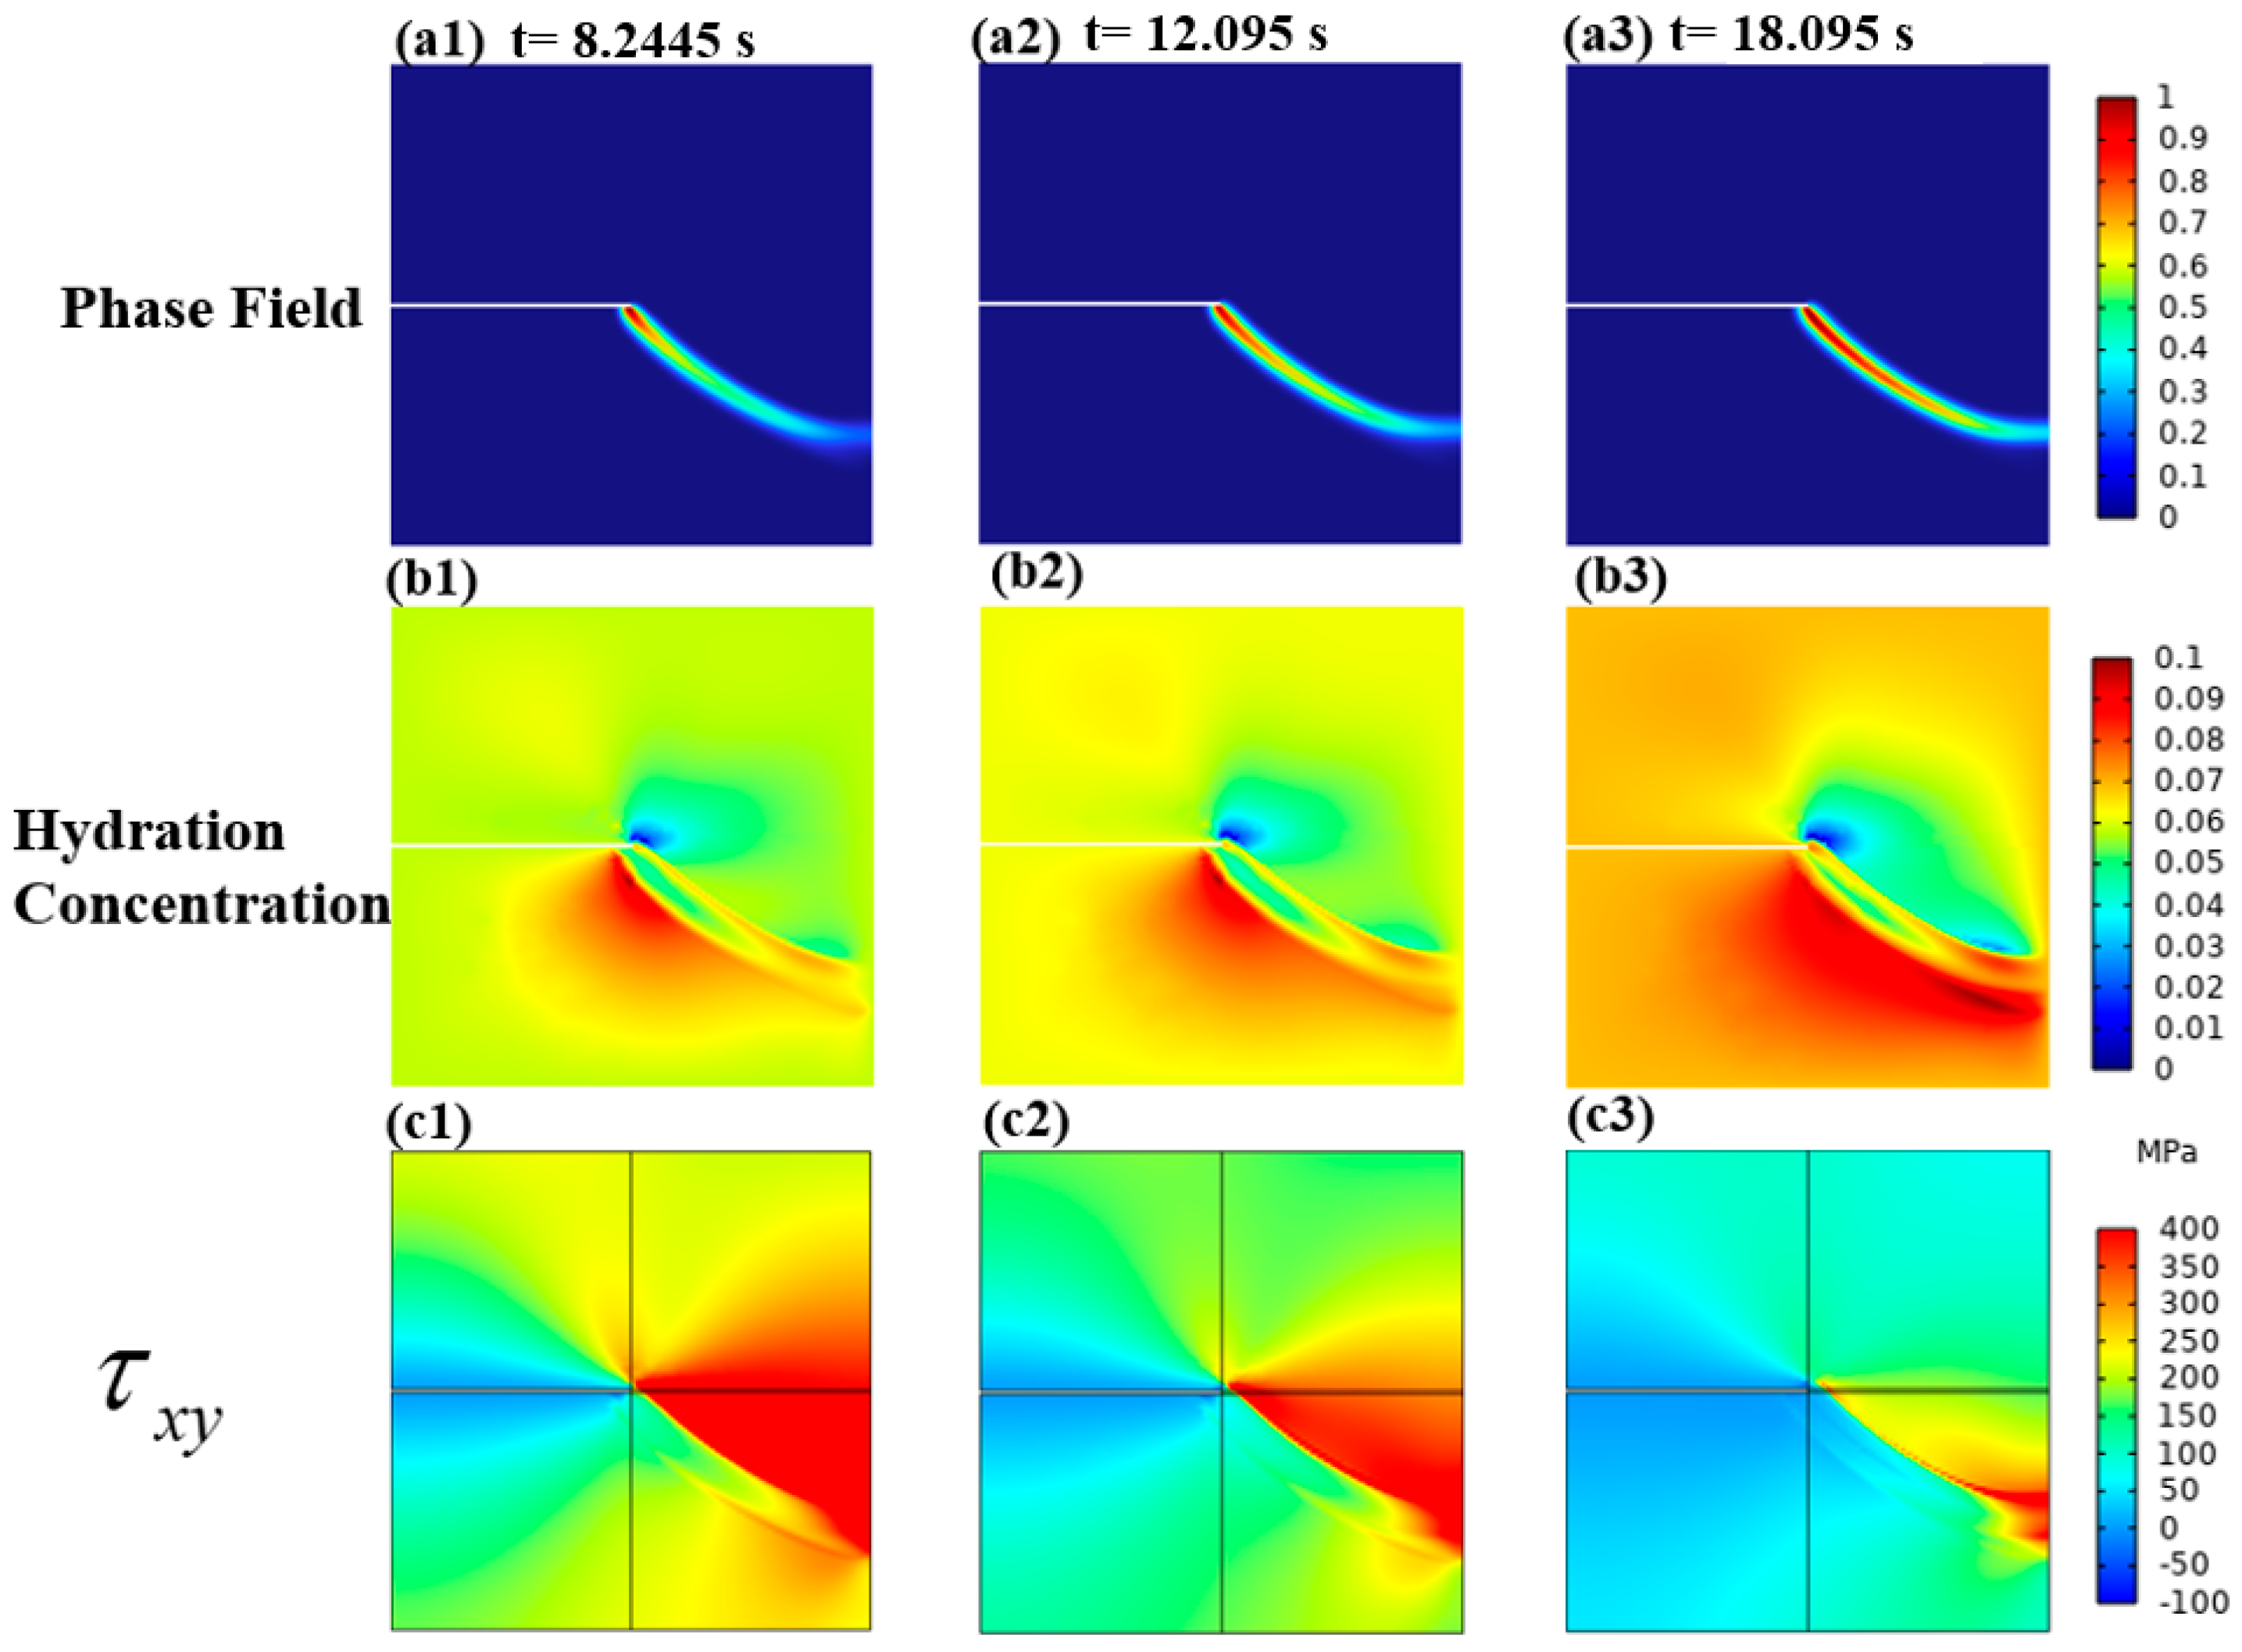
3.2.2. Mechanical–Chemical Coupling

Note the effect of shear on the crack extension in cracked square plates subjected to mechanical–chemical coupling in this section. Load conditions, specimen size (mm), boundary conditions, and material properties are the same as in Section 3.2.
Figure 21a shows load–displacement curves under mechanical–chemical coupling. The peak load exhibits a decline with increased hydrogen concentration. Interaction force between molecules decreases for the disruption of interatomic bonds by hydrogen concentration, in which reduces mechanical properties of the material. Figure 21b presents load–displacement curves for the two simulations. Peak loads under mechanical–chemical coupling are 263.48, 170.48, and 140.39 N when C = 0.1, 0.5, and 1.0 wt ppm, respectively. Peak loads of materials under the degradation function are 265.76, 171.73, and 141.07 N. There is no significant change by contrast.
The crack propagation diagram under mechanical–chemical coupling is shown in Figure 22. The crack propagation rate accelerates with increasing hydrogen concentration. In a high hydrogen concentration environment, more hydrogen will enter the lattice structure of the metal material, resulting in hydrogen-induced embrittlement, reducing the strength of the material, and thus accelerating the expansion of the crack. Figure 23 shows the phase-field distribution, concentration diffusion, and stress evolution under mechanical–chemical coupling when C = 0.1 wt ppm. In the mechanical–chemical coupling model, based on Equation (54), the positive stress will accelerate the diffusion of hydrogen concentration and affect the propagation of crack.

3.2.3. Effects of the Diffusion Coefficient D on the Crack Extension

Note mechanical–chemical coupling, the effect of the phase field and concentrations on D, and the effect of shear on the crack extension. Load conditions, specimen size (mm), boundary conditions, and material properties are the same as in Section 3.2.
Figure 24 depicts load–displacement curves with varying concentrations in three different cases. The impact of the degradation function, mechanical–chemical coupling, and D on the crack propagation is not significantly affected in the shear model by comparing these curves.

3.3. Three-Point Bending Beams under the Influence of Hydrogen Concentration

Figure 25a shows the geometrical model, boundary conditions, and load for the three-point bending simulation. Beams eventually fail by cracking from the tip and expanding vertically along the line of symmetry. Parameters of the model are as follows: E = 210 GPa; υ = 0.3 ; D =   0.038   mm 2 / s ; G f 0 = 2.7   N / mm ; f t 0 = 740   MPa . The length scale parameter of the crack is L = 0.01 mm, and the top vertical displacement is incrementally applied with u = 1 × 10 3   mm / s .
Free triangular mesh elements are used and center on the center of mass of the beam. The crack growth area is locally refined, and a finer element size is adopted (Figure 25b).
Figure 25c presents three-point bending damage prediction of the mechanical load. A narrow damage zone is observed, with a sharp crack nucleating from the tip and propagating vertically towards the beam top. Figure 26 depicts predicted load–displacement curve.

3.3.1. Hydrogen-Dependent Fracture Energy Degradation

This section studies the crack extension of a three-point bending beam in the presence of hydrogen with material properties affected by the degradation function. Load conditions, specimen size (mm), boundary conditions, and material properties are the same as in Section 3.3.
Figure 27a shows load–displacement curves of the three-point bending beam in the presence of hydrogen. When the material is exposed to an environment with hydrogen concentration, hydrogen atoms can penetrate into the lattice structure of the material, causing hydrogen-induced embrittlement in metal materials, reducing the strength and toughness of the material. The peak load decreases with the increase in hydrogen concentration, and the load-carrying capacity of the material decreases significantly. The varying elastic modulus E under different hydrogen concentration is studied (Figure 27b). It decreases gradually from 210 to 194.077, 193.36, and 193.13 GPa in the presence of hydrogen. In a high hydrogen concentration environment, hydrogen atoms can enter the lattice of the material, causing lattice distortion. It weakens the bonding between the atoms and reduces the rigidity of the material, resulting in a decrease in the elastic modulus of the material. Material strength is usually related to the elastic modulus; in a high concentration environment, the rigidity and toughness of the material decrease due to the decrease in its elastic modulus. Therefore, the tensile strength is reduced.
Figure 28 presents the phase fields of the three-point bending beam at different moments under different concentration. The rate of crack extension accelerates with increased hydrogen concentration. Material properties gradually degrade under hydrogen concentration, making the material fail sooner. C = 0.1 wt ppm is taken as an example. Figure 29 presents clouds of fracture phase-field, hydrogen concentration diffusion, and stress.
Under mechanical loading, the crack begins to propagate. In the hydrogen concentration environment, hydrogen atoms enter the lattice structure of the material, causing hydrogen embrittlement, which reduces the material’s strength and accelerates crack propagation. Additionally, hydrogen diffusion is not only driven by concentration gradients but is also influenced by stress. High stress accelerates hydrogen diffusion, leading to an increase in concentration gradients and further accelerating crack propagation. As the crack continues to propagate, more hydrogen diffuses towards the crack tip region due to the influence of stress, resulting in the highest hydrogen concentration at the crack tip region.

3.3.2. Mechanical–Chemical Coupling

A chemical analysis of mechanical-differentiation coupling is considered for a three-point bending beam to verify the effect of simultaneous chemical attack and mechanical load. Load conditions, specimen size (mm), boundary conditions, and material properties are the same as in Section 3.3.
Figure 30a shows load–displacement curves of a three-point bending beam under mechanical–chemical coupling. Figure 30b presents peak loads at 0.1, 0.5, and 1.0 wt ppm by comparing mechanical–chemical coupling with material properties subjected to the degradation function. Peak loads under the coupling are 293.09, 200.58, and 164.66 N at C = 0.1, 0.5, and 1.0 wt ppm, respectively. Peak loads of the material under the influence of the degradation function are 273.37, 186.44, and 155.41 N, which decreases by 6.8, 7.1, and 5.7%, respectively.
Figure 31 illustrates the crack propagation of the phase field under mechanical–chemical coupling. The crack nucleates at the tip and extends vertically to the upper edge, and its growth rate accelerates with increased hydrogen concentration. The simulation at C = 0.1 wt ppm is taken as an example to further study hydrogen concentration diffusion and varying stress under coupling.
Figure 32 presents the phase-field damage, hydrogen concentration, and stress. Cracks appear near the tip and are affected by stress, which causes hydrogen concentration to diffuse interior. They expand along the notch to the upper edge with load displacement. The mechanical damage promotes cracks and the transport of hydrogen ions. Hydrogen concentration spreads further inward under stress.
The diffusion rate of hydrogen concentration is faster under mechanical–chemical coupling compared with material properties affected by the degradation function. Figure 32(b1–b3) and Figure 33 show the diffusion of hydrogen concentration and that under mechanical–chemical coupling.

3.3.3. Effect of the Diffusion Coefficient D on the Crack Extension

We investigate the effect of mechanical and chemical coupling on the crack extension of D on the three-point bending beam model. Figure 25 shows the geometric shape, load conditions, and boundary conditions of the model.
The material properties are affected by the degradation function mainly based on Equation (55), where the hydrogen-enhanced decohesion reduces the fracture energy of the material and the crack extension rate accelerates as the hydrogen concentration increases. The diffusion coefficient D mainly affects the crack propagation rate by changing the porosity of the material. Under the influence of mechanical–chemical coupling, the positive hydrostatic stress is mainly considered to promote the diffusion of hydrogen concentration based on Equation (54).
The load–displacement curves for the three simulated cases in the three-point bending model are shown in Figure 34. By comparing the load–displacement curves at three different concentrations, it can be observed that the material degradation function has the largest decrease in peak load, followed by the diffusion coefficient D, and finally the mechanical–chemical coupling effect. Therefore, in the three-point bending model, the crack propagation rate influenced by the material degradation function is faster than that influenced by the diffusion coefficient D and the mechanical–chemical coupling effect.

4. Conclusions

In this paper, a phase-field regularized cohesion model (PF-CZM) was used to deal with the hydrogen-assisted cracking problem (HAC). A coupled deformation–diffusion–phase-field scheme has been developed in the framework of the finite element method. Meanwhile, the model builds upon the hydrogen-enhanced decohesion mechanism to decrease the critical energy release rate to address damage initiation and progression in a chemo-mechanical coupled environment. The effect of concentration change on crack propagation under three different loading modes is simulated. This model demonstrates the whole process of crack propagation and the diffusion of concentration well, without the need for time-consuming laboratory tests. Computations show that the phase-field regularized cohesion model for fracture is a suitable tool to achieve the elusive goal of lifetime prediction of engineering components undergoing hydrogen-assisted cracking.

Author Contributions

Conceptualization, Q.S. and S.Z.; methodology, Q.S.; software, S.Z.; resources, Q.S.; writing—original draft preparation, S.Z.; writing—review and editing, Q.S.; funding acquisition, Q.S. All authors have read and agreed to the published version of the manuscript.

Funding

This work was supported by the National Natural Science Foundation of China (Grant Nos. 12002230).

Institutional Review Board Statement

Not applicable.

Informed Consent Statement

Not applicable.

Data Availability Statement

The data presented in this study are available on request from the corresponding author.

Conflicts of Interest

The authors declare no conflict of interest.

References

  1. Yang, G.; Yang, L.; Liu, Z.; Li, H.; Zhang, J.; Lian, H. Phase Field Simulation of Hydrogen-Assisted Cracking with Length-Scale Insensitive Degradation Function. Comput. Mater. Sci. 2023, 228, 112309. [Google Scholar] [CrossRef]
  2. Mandal, T.K.; Nguyen, V.P.; Wu, J.Y. Comparative Study of Phase-Field Damage Models for Hydrogen Assisted Cracking. Theor. Appl. Fract. Mech. 2021, 111, 102840. [Google Scholar] [CrossRef]
  3. Wu, J.Y.; Mandal, T.K.; Nguyen, V.P. A Phase-Field Regularized Cohesive Zone Model for Hydrogen Assisted Cracking. Comput. Methods Appl. Mech. Eng. 2020, 358, 112614. [Google Scholar] [CrossRef]
  4. Watson, J.W.; Meshii, M.; Shen, Y.Z. Effect of Cathodic Charging on the Mechanical Properties of Aluminum. Metall. Trans. A 1988, 19, 2299–2304. [Google Scholar]
  5. Birnbaum, H.K.; Sofronis, P. Hydrogen-Enhanced Localized Plasticity—A Mechanism for Hydrogen-Related Fracture. Mater. Sci. Eng. A 1994, 176, 191–202. [Google Scholar] [CrossRef]
  6. Martínez-Pañeda, E.; Del Busto, S.; Niordson, C.F.; Betegón, C. Strain Gradient Plasticity Modeling of Hydrogen Diffusion to the Crack Tip. Int. J. Hydrogen Energy 2016, 41, 10265–10274. [Google Scholar] [CrossRef]
  7. Barenblatt, G.I. The Formation of Equilibrium Cracks during Brittle Fracture. General Ideas and Hypotheses. Axially-Symmetric Cracks. J. Appl. Math. Mech. 1959, 23, 622–636. [Google Scholar] [CrossRef]
  8. Scheider, I.; Pfuff, M.; Dietzel, W. Simulation of Hydrogen Assisted Stress Corrosion Cracking Using the Cohesive Model. Eng. Fract. Mech. 2008, 75, 4283–4291. [Google Scholar] [CrossRef]
  9. Olden, V.; Thaulow, C.; Johnsen, R.; Østby, E.; Berstad, T. Influence of Hydrogen from Cathodic Protection on the Fracture Susceptibility of 25%Cr Duplex Stainless Steel–Constant Load SENT Testing and FE-Modelling Using Hydrogen Influenced Cohesive Zone Elements. Eng. Fract. Mech. 2009, 76, 827–844. [Google Scholar] [CrossRef]
  10. Moriconi, C.; Hénaff, G.; Halm, D. Cohesive Zone Modeling of Fatigue Crack Propagation Assisted by Gaseous Hydrogen in Metals. Int. J. Fatigue 2014, 68, 56–66. [Google Scholar] [CrossRef]
  11. Alvaro, A.; Jensen, I.T.; Kheradmand, N.; Løvvik, O.M.; Olden, V. Hydrogen Embrittlement in Nickel, Visited by First Principles Modeling, Cohesive Zone Simulation and Nanomechanical Testing. Int. J. Hydrogen Energy 2015, 40, 16892–16900. [Google Scholar] [CrossRef]
  12. Xu, X.P.; Needleman, A. Numerical Simulations of Fast Crack Growth in Brittle Solids. J. Mech. Phys. Solids 1994, 42, 1397–1434. [Google Scholar] [CrossRef]
  13. Nguyen, V.P.; Nguyen, C.T.; Bordas, S.; Heidarpour, A. Modelling Interfacial Cracking with Non-Matching Cohesive Interface Elements. Comput. Mech. 2016, 58, 731–746. [Google Scholar] [CrossRef]
  14. Wells, G.N.; Sluys, L. A New Method for Modelling Cohesive Cracks Using Finite Elements. Int. J. Numer. Methods Eng. 2001, 50, 2667–2682. [Google Scholar] [CrossRef]
  15. Wu, J.Y.; Li, F.B. An Improved Stable XFEM (Is-XFEM) with a Novel Enrichment Function for the Computational Modeling of Cohesive Cracks. Comput. Methods Appl. Mech. Eng. 2015, 295, 77–107. [Google Scholar] [CrossRef]
  16. Novak, P.; Yuan, R.; Somerday, B.P.; Sofronis, P.; Ritchie, R.O. A Statistical, Physical-Based, Micro-Mechanical Model of Hydrogen-Induced Intergranular Fracture in Steel. J. Mech. Phys. Solids 2010, 58, 206–226. [Google Scholar] [CrossRef]
  17. Ayas, C.; Deshpande, V.S.; Fleck, N.A. A Fracture Criterion for the Notch Strength of High Strength Steels in the Presence of Hydrogen. J. Mech. Phys. Solids 2014, 63, 80–93. [Google Scholar] [CrossRef]
  18. Jirásek, M. Comparative Study on finite Elements with Embedded Discontinuities. Comput. Methods Appl. Mech. Eng. 2000, 188, 307–330. [Google Scholar] [CrossRef]
  19. Wu, J.Y.; Li, F.B.; Xu, S.L. Extended Embedded Finite Elements with Continuous Displacement Jumps for the Modeling of Localized Failure in Solids. Comput. Methods Appl. Mech. Eng. 2015, 285, 346–378. [Google Scholar] [CrossRef]
  20. Bourdin, B.; Francfort, G.A.; Marigo, J.J. The Variational Approach to Fracture. J. Elast. 2008, 91, 5–148. [Google Scholar] [CrossRef]
  21. Francfort, G.A.; Marigo, J.J. Revisiting Brittle Fracture as an Energy Minimization Problem. J. Mech. Phys. Solids 1998, 46, 1319–1342. [Google Scholar] [CrossRef]
  22. Bourdin, B.; Francfort, G.A.; Marigo, J.-J. Numerical Experiments in Revisited Brittle Fracture. J. Mech. Phys. Solids 2000, 48, 797–826. [Google Scholar] [CrossRef]
  23. Pham, K.H.; Ravi-Chandar, K. The Formation and Growth of Echelon Cracks in Brittle Materials. Int. J. Fract. 2017, 206, 229–244. [Google Scholar] [CrossRef]
  24. Tanné, E.; Li, T.; Bourdin, B.; Marigo, J.J.; Maurini, C. Crack Nucleation in Variational Phase-Field Models of Brittle Fracture. J. Mech. Phys. Solids 2018, 110, 80–99. [Google Scholar] [CrossRef]
  25. Wu, J.Y.; Nguyen, V.P. A Length Scale Insensitive Phase-Field Damage Model for Brittle Fracture. J. Mech. Phys. Solids 2018, 119, 20–42. [Google Scholar] [CrossRef]
  26. Borden, M.J.; Hughes, T.J.; Landis, C.M.; Anvari, A.; Lee, I.J. A Phase-Field Formulation for Fracture in Ductile Materials: Finite Deformation Balance Law Derivation, Plastic Degradation, and Stress Triaxiality Effects. Comput. Methods Appl. Mech. Eng. 2016, 312, 130–166. [Google Scholar] [CrossRef]
  27. Borden, M.J.; Verhoosel, C.V.; Scott, M.A.; Hughes, T.J.; Landis, C.M. A Phase-Field Description of Dynamic Brittle Fracture. Comput. Methods Appl. Mech. Eng. 2012, 217–220, 77–95. [Google Scholar] [CrossRef]
  28. Schlüter, A.; Willenbücher, A.; Kuhn, C.; Müller, R. Phase Field Approximation of Dynamic Brittle Fracture. Comput. Mech. 2014, 5, 1141–1161. [Google Scholar] [CrossRef]
  29. Wu, J.-Y. A Geometrically Regularized Gradient-Damage Model with Energetic Equivalence. Comput. Methods Appl. Mech. Eng. 2018, 328, 612–637. [Google Scholar] [CrossRef]
  30. Wu, J.-Y. Robust Numerical Implementation of Non-Standard Phase-Field Damage Models for Failure in Solids. Comput. Methods Appl. Mech. Eng. 2018, 340, 767–797. [Google Scholar] [CrossRef]
  31. Feng, D.C.; Wu, J.Y. Phase-Field Regularized Cohesive Zone Model (CZM) and Size Effect of Concrete. Eng. Fract. Mech. 2018, 197, 66–79. [Google Scholar] [CrossRef]
  32. Lee, S.; Wheeler, M.F.; Wick, T. Pressure and Fluid-Driven Fracture Propagation in Porous Media Using an Adaptive Finite Element Phase Field Model. Comput. Methods Appl. Mech. Eng. 2016, 305, 111–132. [Google Scholar] [CrossRef]
  33. Miehe, C.; Mauthe, S. Phase Field Modeling of Fracture in Multi-Physics Problems. Part III. Crack Driving Forces in Hydro-Poro-Elasticity and Hydraulic Fracturing of Fluid-Saturated Porous Media. Comput. Methods Appl. Mech. Eng. 2016, 304, 619–655. [Google Scholar] [CrossRef]
  34. Areias, P.; Rabczuk, T.; Msekh, M.A. Phase-Field Analysis of Finite-Strain Plates and Shells Including Element Subdivision. Comput. Methods Appl. Mech. Eng. 2016, 312, 322–350. [Google Scholar] [CrossRef]
  35. Mandal, T.K.; Nguyen, V.P.; Wu, J.Y. A Length Scale Insensitive Anisotropic Phase Field Fracture Model for Hyperelastic Composites. Int. J. Mech. Sci. 2020, 188, 105941. [Google Scholar] [CrossRef]
  36. Miehe, C.; Schänzel, L.M. Phase Field Modeling of Fracture in Rubbery Polymers. Part I. Finite Elasticity Coupled with Brittle Failure. J. Mech. Phys. Solids 2014, 65, 93–113. [Google Scholar] [CrossRef]
  37. Falkenberg, R. A Phase Field Approach to Fracture with Mass Transport Extension for the Simulation of Environmentally-Assisted Cracking. Key Eng. Mater. 2017, 754, 153–156. [Google Scholar] [CrossRef]
  38. Nguyen, T.T.; Bolivar, J.; Réthoré, J.; Baietto, M.C.; Fregonese, M. A Phase Field Method for Modeling Stress Corrosion Crack Propagation in a Nickel Base Alloy. Int. J. Solids Struct. 2017, 112, 65–82. [Google Scholar] [CrossRef]
  39. Martínez-Pañeda, E.; Alireza, G.; Christian, F.N. A Phase Field Formulation for Hydrogen Assisted Cracking. Comput. Methods Appl. Mech. Eng. 2018, 342, 742–761. [Google Scholar] [CrossRef]
  40. Falkenberg, R. Modelling of Environmentally Assisted Material Degradation in the Crack Phase-Field Framework. Proc. Inst. Mech. Eng. Part L J. Mater. Des. Appl. 2019, 233, 5–12. [Google Scholar] [CrossRef]
  41. Miehe, C.; Dal, H.; Schänzel, L.-M.; Raina, A. A Phase-Field Model for Chemo-Mechanical Induced Fracture in Lithium-Ion Battery Electrode Particles: Phase-field model of fracture in li-ion battery electrodes. Int. J. Numer. Methods Eng. 2016, 106, 683–711. [Google Scholar] [CrossRef]
  42. Serebrinsky, S. A Quantum-Mechanically Informed Continuum Model of Hydrogen Embrittlement. J. Mech. Phys. Solids 2004, 52, 2403–2430. [Google Scholar] [CrossRef]
  43. Jiang, D.E.; Carter, E.A. First Principles Assessment of Ideal Fracture Energies of Materials with Mobile Impurities: Implications for Hydrogen Embrittlement of Metals. Acta Mater. 2004, 52, 4801–4807. [Google Scholar] [CrossRef]
  44. Hirth, J.P. Effects of hydrogen on the properties of iron and steel. Metall. Trans. A 1980, 11, 861–890. [Google Scholar] [CrossRef]
  45. Miehe, C.; Hofacker, M.; Welschinger, F. A phase field model for rate-independent crack propagation: Robust algorithmic implementation based on operator splits. Comput. Methods Appl. Mech. Eng. 2010, 199, 2765–2778. [Google Scholar] [CrossRef]
Figure 1. (a) Sharp crack; (b) regularized crack topology.
Coatings 14 00202 g001
Figure 2. Schematic diagram of a cracked solid: (a) internal discontinuous crack; (b) phase-field approximation of the crack.
Coatings 14 00202 g002
Figure 3. (a) Sharp cracks (b) Diffuse cracks.
Coatings 14 00202 g003
Figure 4. Three-field boundary value diagram: (a) displacement field; (b) the phase field; (c) hydrogen transport.
Coatings 14 00202 g004
Figure 5. Cracked square plate under tension: (a) geometry and boundary conditions, (b) crack propagation, and (c) load–displacement curve.
Coatings 14 00202 g005
Figure 6. Load–displacement curves under different hydrogen concentrations; (C = 0.1 wt ppm, C = 0.5 wt ppm, and C = 1.0 wt ppm).
Coatings 14 00202 g006
Figure 7. Schematic representation of crack extension at three hydrogen concentrations: (a1a3) t = 2.417 s, (b1b3) t = 3.459 s, and (c1c3) t = 7.509 s.
Coatings 14 00202 g007
Figure 8. Crack extension, hydrogen concentration diffusion, and stress cloud at different times: (a1a3) the phase field, (b1b3) hydrogen concentration diffusion, and (c1c3) stress; C = 0.1 wt ppm (t = 5.5319 s, t = 7.5319 s, and t = 10.532 s).
Coatings 14 00202 g008
Figure 9. (a) Variation in the elastic modulus E with hydrogen concentrations; (b) minimum value of the elastic modulus E with hydrogen concentrations.
Coatings 14 00202 g009
Figure 10. (a) Load–displacement curves (mechanical–chemical coupling); (b) load–displacement curves (mechanical–chemical coupling and degradation of material properties).
Coatings 14 00202 g010
Figure 11. Crack growth (mechanical–chemical coupling): (a1a3) t = 2.558 s, (b1b3) t = 4.885 s, and (c1c3) t = 8.762 s.
Coatings 14 00202 g011
Figure 12. (a1a3) Crack extension, (b1b3) hydrogen concentration diffusion, and (c1c3) stress (mechano-chemical coupling C = 0.1 wt ppm, t = 5.5319 s, t = 7.5319 s, and t = 10.532 s).
Coatings 14 00202 g012
Figure 13. Variation in hydrogen concentration (mechano-chemical coupling).
Coatings 14 00202 g013
Figure 14. Load–displacement curves for three cases in tension.
Coatings 14 00202 g014
Figure 15. (a1a3) Crack extension, (b1b3) hydrogen concentration diffusion, and (c1c3) stress (the diffusion coefficient D, C = 0.1 wt ppm, t = 5.5319 s, t = 7.5319 s, and t = 10.532 s).
Coatings 14 00202 g015
Figure 16. Cracked square plate under shear load: (a) geometry and boundary conditions; (b) meshing; (c) crack extension.
Coatings 14 00202 g016
Figure 17. Load–displacement curve (cracked square plate under shear load).
Coatings 14 00202 g017
Figure 18. Cracked square plate under shear load: (a) load–displacement curves at different concentrations; (b) peak loads at different concentrations.
Coatings 14 00202 g018
Figure 19. Schematic representation of crack extension at three hydrogen concentrations: (a1a3) t = 8.0267 s, (b1b3) t = 11.777 s, and (c1c3) t = 22.667 s.
Coatings 14 00202 g019
Figure 20. Crack extension, hydrogen concentration diffusion, and stress cloud at different times; (a1a3) the phase field, (b1b3) hydrogen concentration diffusion, and (c1c3) stress; C = 0.1 wt ppm (t = 8.245 s, t = 12.095 s, and t = 18.095 s).
Coatings 14 00202 g020
Figure 21. (a) Load–displacement curve (mechanical–chemical coupling) (b) load–displacement curve (mechanical–chemical coupling and degradation of material properties).
Coatings 14 00202 g021
Figure 22. Crack growth (mechanical–chemical coupling): (a1a3) t = 7.2609 s, (b1b3) t = 10.411 s and (c1c3) t = 21.761 s.
Coatings 14 00202 g022
Figure 23. (a1a3) Crack extension, (b1b3) hydrogen concentration diffusion, and (c1c3) stress (Mechano-chemical coupling, t = 8.245 s, t = 12.095 s, and t = 18.095 s).
Coatings 14 00202 g023
Figure 24. Load–displacement curves for three cases in shear.
Coatings 14 00202 g024
Figure 25. (a) Geometry, boundary conditions; (b) meshing; (c) crack extension.
Coatings 14 00202 g025
Figure 26. Three-point bending beam; load–displacement curve.
Coatings 14 00202 g026
Figure 27. (a) Load–displacement curves; (b) changes in the elastic model at different hydrogen concentrations.
Coatings 14 00202 g027
Figure 28. Crack growth ((Three-point bending beams).) (a1a3) t = 56.232 s, (b1b3) t = 80.125 s and (c1c3) t = 176.32 s.
Coatings 14 00202 g028
Figure 29. (a1a3) The cracked phase field, (b1b3) concentration diffusion, and (c1c3) stress cloud (three-point bending beam C = 0.1 wt ppm).
Coatings 14 00202 g029
Figure 30. (a) Load–displacement curves (mechanical–chemical coupling); (b) load–displacement curve (mechanical–chemical coupling and degradation of material properties).
Coatings 14 00202 g030
Figure 31. Crack extension (mechanical–chemical coupling), (a1a3) t = 60.801 s, (b1b3) t = 90.285 s and (c1c3) t = 160.52 s.
Coatings 14 00202 g031
Figure 32. (a1a3) The phase field, (b1b3) hydrogen concentration diffusion, and (c1c3) stress.
Coatings 14 00202 g032
Figure 33. Diffusion of hydrogen concentration at different concentrations.
Coatings 14 00202 g033
Figure 34. Load–displacement concentration curves for three cases in three-point bending beams.
Coatings 14 00202 g034
Table 1. Material properties of cracked square plate subjected to tensile load.
Mechanical PropertiesChemical PropertiesFinite Element
E = 210   GPa D = 0.038   mm 2 / s h min = 0.0015   mm
υ = 0.3 T = 300   K
G f 0 = 2.7   N / mm V = 2000   mm 3 / mol
l = 0.005   mm R = 8.134   J / ( mol × K )
f t 0 = 740   MPa Δ g b 0 = 30000   ( J / mol )
Disclaimer/Publisher’s Note: The statements, opinions and data contained in all publications are solely those of the individual author(s) and contributor(s) and not of MDPI and/or the editor(s). MDPI and/or the editor(s) disclaim responsibility for any injury to people or property resulting from any ideas, methods, instructions or products referred to in the content.

