Article

Aluminum Guefoams Coated with Reduced Graphene Oxide: A Corrosion Protection Study

1
Departamento de Ingeniería Textil y Papelera, EPS de Alcoy, Universitat Politècnica de València, Plaza Ferrandiz y Carbonell s/n, E-03801 Alcoy, Spain
2
Departamento de Química Inorgánica, University of Alicante, Ap 99, E-03080 Alicante, Spain
3
Instituto Universitario de Materiales, University of Alicante, Ap 99, E-03080 Alicante, Spain
*
Author to whom correspondence should be addressed.
Coatings 2024, 14(2), 201; https://doi.org/10.3390/coatings14020201
Submission received: 25 October 2023 / Revised: 25 January 2024 / Accepted: 31 January 2024 / Published: 4 February 2024

Abstract

:
To enhance their corrosion protection, Guefoams were coated with RGO using both potentiostatic and potentiodynamic methods. The potentiodynamic method produced the thickest RGO coating and the lowest Cl, O, and Al content, as observed using FESEM and EDX. The Guefoams were exposed to a 3.5% NaCl solution and steam. The polarization resistance was examined, electrochemical impedance spectroscopy was performed, and polarization curves were constructed to monitor the corrosion process. After 28 days, the Al concentrations in the solutions were measured, and were found to be 145 mg/L (bare Guefoam), 70 mg/L (RGO-coated, potentiostatic), and 35 mg/L (RGO-coated, potentiodynamic). The potentiodynamic RGO coating also showed the best corrosion protection values.

1. Introduction

Guefoams (guest-containing foams) are a novel class of recently patented low-porosity foams. They consist of interconnected porous structures, referred to as the matrix phase, that host granular phases (guest phases) in their porous cavities without any physical or chemical bonding [1,2]. This unique feature exposes the entire surface of the guest phases to the fluid that fills the porous cavity, providing broad functionality to the materials. Recently, metallic Guefoams with guest phases of activated carbon and steel spheres were developed as highly efficient materials for volatile organic compound management and preconcentration [3]. The guest phases provided high adsorption and made the materials susceptible to rapid desorption by magnetic induction—features that are impossible to achieve with traditional foams. Similarly, carbon–Fe-nanoparticle-composite Guefoams with activated carbon guest phases were developed for the same purpose [4]. While the guest phases significantly increased the specific surface area and gas adsorption capacity, the iron nanoparticles embedded in the ceramic matrix conferred a high magneto-inductive capacity, enabling the ultrafast heating and rapid desorption of the adsorbed species. Metallic Guefoams have also been conceived for catalytic applications employing Ni/CeO2/Al2O3 particles as the guest phase [5].
In contrast to conventional particle beds widely utilized for chemical reaction catalysis, these materials possess a superior permeability, resulting in an enhanced energy efficiency due to the pressure drop generated by fluid flow. Additionally, they exhibit a high thermal conductivity. This reduces the thermal gradients within reactors, which become durable and straightforward to manipulate. Since the functionality of these materials is contingent upon fluid passage, it is expected that metallic structural matrices will experience corrosion over time. Consequently, assessing their corrosion resistance and suggesting potential alternatives to ameliorate it is of great interest.
Graphene materials have emerged as revolutionary materials in different fields due to their extraordinary properties, such as Young’s Modulus (1 TPa), their intrinsic strength (130 GPa), their high thermal conductivity (above 3000 W·m·K−1), their high electron mobility at room temperature (2.5 × 105 cm2·V−1·s−1), their impermeability to all gases, their ability to sustain high electric current densities, and their easy chemical functionalization [6]. Even superconductivity has been reported when twisting two graphene crystals at a 1.1° angle, the so-called “magic angle” [7]. The applications reported for graphene materials include sensors, photonics and optoelectronics, flexible electronics, spintronics, biomedical applications, composite materials, and energy generation and storage [6,8].
From an electrochemical point of view, two properties of graphene materials make them interesting. On the one hand, their high theoretical specific surface area, which has been calculated to be 2630 m2·g−1, makes graphene materials candidates as capacitors [9], sensors [10], or a platform to obtain highly dispersed catalysts [11], photocatalysts [12], electrocatalysts [13], or enzymes [14]. On the other hand, electron conductivity is necessary to produce conductive electrodes that enhance the electron transfer rate [15] in applications such as batteries, sensors, supercapacitors, and electrocatalysts. The electrical conductivity of graphene materials ranges from the superconductivity of twisted bilayer graphene at the magic angle [7] to the insulating properties of graphene oxide [16].
Graphene oxide is widely used among graphene materials due to its ease of preparation and scalability for large production [17]. As-synthesized graphene oxide is insulating due to the amount of sp3 C−O bonding that exists in its structure, which disrupts the conducting pathways of sp2 carbon [16]. Graphene oxide conductivity can be partially restored and tuned by the degree of chemical reduction. Reduction can be achieved using chemical, thermal, biological, or photomediated methods [18]. Electrochemical reduction has also been proposed as a method for producing reduced graphene oxide [19], where RGO films can be obtained in one step or two steps. One-step reduction presents the advantage of the simultaneous deposition and reduction of graphene oxide. In addition, graphene oxide is easily dispersed in water due to its negative zeta potential in a wide range of pH values [20], which makes it an ideal candidate for synthesizing coatings in aqueous solutions.
Graphene materials have been widely used for the corrosion protection of metals due to their high surface area and high aspect ratio. Different mechanisms make graphene and its derivatives ideal candidates for corrosion protection [21]:
  • The charge transfer between metal surfaces and graphene induces a potential barrier at the graphene/metal interface. This polarization impedes the electron transfer processes that are necessary for corrosion.
  • The conductivity of graphene materials provides an alternative pathway for transporting electrons generated at the anode away from cathodic sites; in this way, corrosion reactions can be reduced.
  • The structure of graphene materials provides a physical barrier to the diffusion of gases, vapors, and ions.
The use of chemical-vapor-deposited (CVD) graphene, alone or combined with other materials such as polymers [22], has been reported by other authors for the corrosion protection of different metals, such as Al [22], Cu [23,24], and Ni [23,24]. However, CVD graphene is costly, and if the transfer process has to be carried out from Cu or Ni, where it is typically grown, to other metals [22], it complicates the whole process. Another approach that has been used in other studies is the incorporation of graphene materials into polymers [25,26], where graphene is added as an additive that acts as a barrier to inhibit the diffusion of oxidizing corrosive species by creating highly tortuous pathways [25]. Graphene coatings can also be deposited alone [27] or with other materials [28] on metals with electrochemical techniques, which facilitates their synthesis. To date, no studies have been performed on the corrosion protection of Guefoams using RGO.
In this paper, we performed the electrochemical synthesis of RGO coatings to protect intricate materials such as Guefoams from corrosion. The synthesis was performed using a GO aqueous solution, which made the process cheap and easy to implement, achieving the deposition of GO and the reduction of GO to RGO in only one step.

2. Materials and Methods

2.1. Reagents

All the reagents used were of analytical grade. For the synthesis, monolayer graphene oxide (GO) powder was acquired from Nanoinnova Technologies S.L. (Illescas, Spain) and sodium sulphate (Na2SO4) was purchased from PanReac AppliChem (Castellar del Vallès, Spain).
For the characterization, sodium chloride (NaCl) was supplied by FlukaSolutions (Seelze, Germany), and deoxygenation was achieved by bubbling nitrogen (N2 premier X50S) (Carburos Metálicos, Cornellá de Llobregat, Spain) when needed. Ultrapure water was obtained from an Elix 3 Millipore-Milli-Q Advantage A10 system (Burlington, MA, USA) with a resistivity near 18.2 MΩ·cm.

2.2. Aluminum Guefoam Fabrication

The aluminum Guefoams were fabricated by following a well-known replication method. The initial stage involved preparing the particles that made up the packed preform. For this purpose, Nuchar RGC-30 activated carbon (AC) particles with an average diameter of 1.4 mm (Westvaco—Chemical Division, Wickliffe, OH, USA) were selected and coated with NaCl (Panreac AppliChem GmbH, Germany) according to the procedure described in [3]. The AC particles were placed on an oscillating flat surface heated at 80 °C such that the particles could maintain some degree of rotational motion. They were then sprayed with a 20% NaCl solution every 15 s until they achieved a quasi-spherical morphology of approximately 2.0 mm in diameter. The NaCl-coated activated carbon particles were afterward packed into graphite crucibles with a 6 mm inner diameter and a 60 mm length. The second step of the fabrication process involved infiltrating the packed preform with liquid metal, which was assisted by gas pressure. For this, a solid piece of 99.999 wt% aluminum (Alfa Aesar, Karlsruhe, Germany) was placed on the top of the preform, and the crucible was introduced into a gas pressure infiltration chamber. A vacuum of 0.2 mbar was applied to prevent air from becoming trapped during infiltration, which could lead to uncontrolled porosity. The chamber was heated to 750 °C at a heating rate of 5 °C·min−1, and the vacuum was closed after 10 min at a constant temperature. The chamber was then pressurized with 1 bar of argon to allow the liquid metal to penetrate the porous preform. After 2 min, the metal was directionally solidified by immersing the bottom of the chamber in a 25 °C water bath. The sample was then extracted, and the excess metal was machined away. The final step of the fabrication process involved removing the NaCl martyr layer. For that, the materials were immersed in an ultrasound-distilled water bath for 15 min to finally obtain the Guefoams with an interconnected porous structure.

2.3. Electrochemical Synthesis of RGO Coatings

All the electrochemical experiments were performed at room temperature with an Eco-Chemie Autolab PGSTAT302 potentiostat/galvanostat (Metrohm, Utrecht, The Netherlands). The working electrode was the Al Guefoam and the exposed area was controlled by Teflon. Electrical contact with the Guefoam was made using a crocodile gripper. The counter electrode was a Pt wire (0.5 mm diameter and 99.99% purity from Engelhard-Clal, Fremont, CA, USA). The platinum electrode was thermally treated to clean its surface before each electrochemical experiment according to the method developed by Clavilier [29]. The electrochemical potential was referred to the Ag/AgCl (3 M KCl) reference electrode.
The electrochemical synthesis of RGO coatings on Guefoams was performed in a 3 g/L GO + 0.1 M Na2SO4 solution. This solution was previously sonicated in ultrasounds to facilitate graphene oxide exfoliation. The potentiostatic synthesis was performed at −1.8 V during the necessary time to achieve an electrical charge of −2.4 C. The potentiodynamic synthesis was performed at 50 mV·s−1 using two different potential ranges: −0.63 V to −2 V for 48 sweeps and −0.2 V to −1.45 V for 96 sweeps.

2.4. FESEM Characterization

A Zeiss Ultra 55 FESEM (Oberkochen, Germany) was used to observe the morphology of the samples and obtain the element map distribution using an acceleration voltage of 10 kV. The samples were not coated with an additional conductive coating. Energy-dispersive X-ray (EDX) measurements were performed between 0 keV and 10 keV. The thickness of the RGO coatings was determined with FIB-FESEM using a Zeiss Auriga Compact focused gallium ion beam microscope.

2.5. Fourier-Transform Infrared Spectroscopy with Attenuated Total Reflection (FTIR-ATR)

FTIR-ATR with the horizontal mono-rebound attenuated total reflection was performed with a Nicolet 6700 spectrometer (Thermo Fischer Scientific, Waltham, MA, USA) equipped with a deuterated triglycine sulfate detector. An accessory with pressure control was used to equalize the pressure in the different samples. A prism of ZnSe was used, the spectra were collected with a resolution of 4 cm−1, and 64 scans were averaged for each sample. The GO and RGO powders (obtained electrochemically on Al Guefoams) were characterized.

2.6. Corrosion Tests and Electrochemical Measurements

The different samples were immersed in 3.5% NaCl for different periods of time (0, 24 h, 48 h, 72 h, 96 h, 168 h, 216 h, 336 h, 504 h, or 672 h) to perform the corrosion tests. After the different periods of exposure to the 3.5% NaCl solution, different electrochemical measurements were performed to analyze the polarization resistance (RP) and corrosion current density (icorr).
The polarization resistance measurements were made at a scan rate of 1 mV·s−1 with a perturbation of ±10 mV around the open circuit potential.
Electrochemical impedance spectroscopy (EIS) measurements were performed in the 105–10−2 Hz frequency range. The amplitude of the sinusoidal voltage was ±10 mV. Each measurement was carried out at a constant imposed potential equal to the stabilized open circuit potential (OCP) at the beginning of the experiment. The experimental results were fitted to an equivalent electrical circuit using a nonlinear least-squares regression method with the Frequency Response Analyzer software (version 4.9) from an Eco-Chemie Autolab PGSTAT302 (Metrohm, Utrecht, Netherlands) potentiostat/galvanostat. From these measurements, the polarization resistance could also be calculated.
Tafel polarization curves were constructed at a scan rate of 1 mV·s−1 with a perturbation of ±50 mV around the open circuit potential. From these measurements, the corrosion current density was calculated.
In order to evaluate the corrosion in a more realistic environment, the samples were subjected to steam generated by heating a 3.5% NaCl solution. Bare Guefoam, potentiostatic RGO-coated Guefoams, and potentiodynamic RGO-coated Guefoams were evaluated for 1190 h (~50 days). Rp, EIS, and icorr measurements were performed every 70 h.

2.7. Determination of Al Concentration after Corrosion Tests

The concentration of dissolved aluminum in the different samples that were left in contact with the corrosive medium (3.5% NaCl) for varying lengths of time was quantified using the Aluminum Cell Test 0.02–0.50 mg/L supplied by Merck and a Spectroquant® Prove 100 spectrophotometer (Merck, Burlington, MA, USA). Previously, the pH of the different solutions was adjusted to ~2 with HCl (Merck, Burlington, MA, USA) to ensure the complete dissolution of the aluminum hydroxides formed during the corrosion process. For the measurement, a 1/500 dilution of the different samples was performed.

2.8. Adsorption–Desorption Isotherms

The guest phase (in the present study, activated carbon adsorbent particles) provides functionality to the material. Therefore, it is imperative to assess whether its surface was altered by the electrochemical synthesis. For this purpose, the guest-phase particles were meticulously extracted from the RGO-coated Guefoams and subjected to gas adsorption characterization. The specific surface area and pore size distribution were determined from nitrogen adsorption–desorption isotherms at −196 °C (Quantachrome Instruments, Boynton Beach, FL, USA) using the standard BET (Brunauer–Emmet–Teller) theory. The pore size distribution of the samples was determined using the non-local density functional theory (NLDFT) of the Quantachrome’s Data Reduction 6.0 software and the nitrogen adsorption data up to a relative pressure of 0.7. The same analysis was conducted on the raw activated carbon particles to provide a basis for comparison.

3. Results

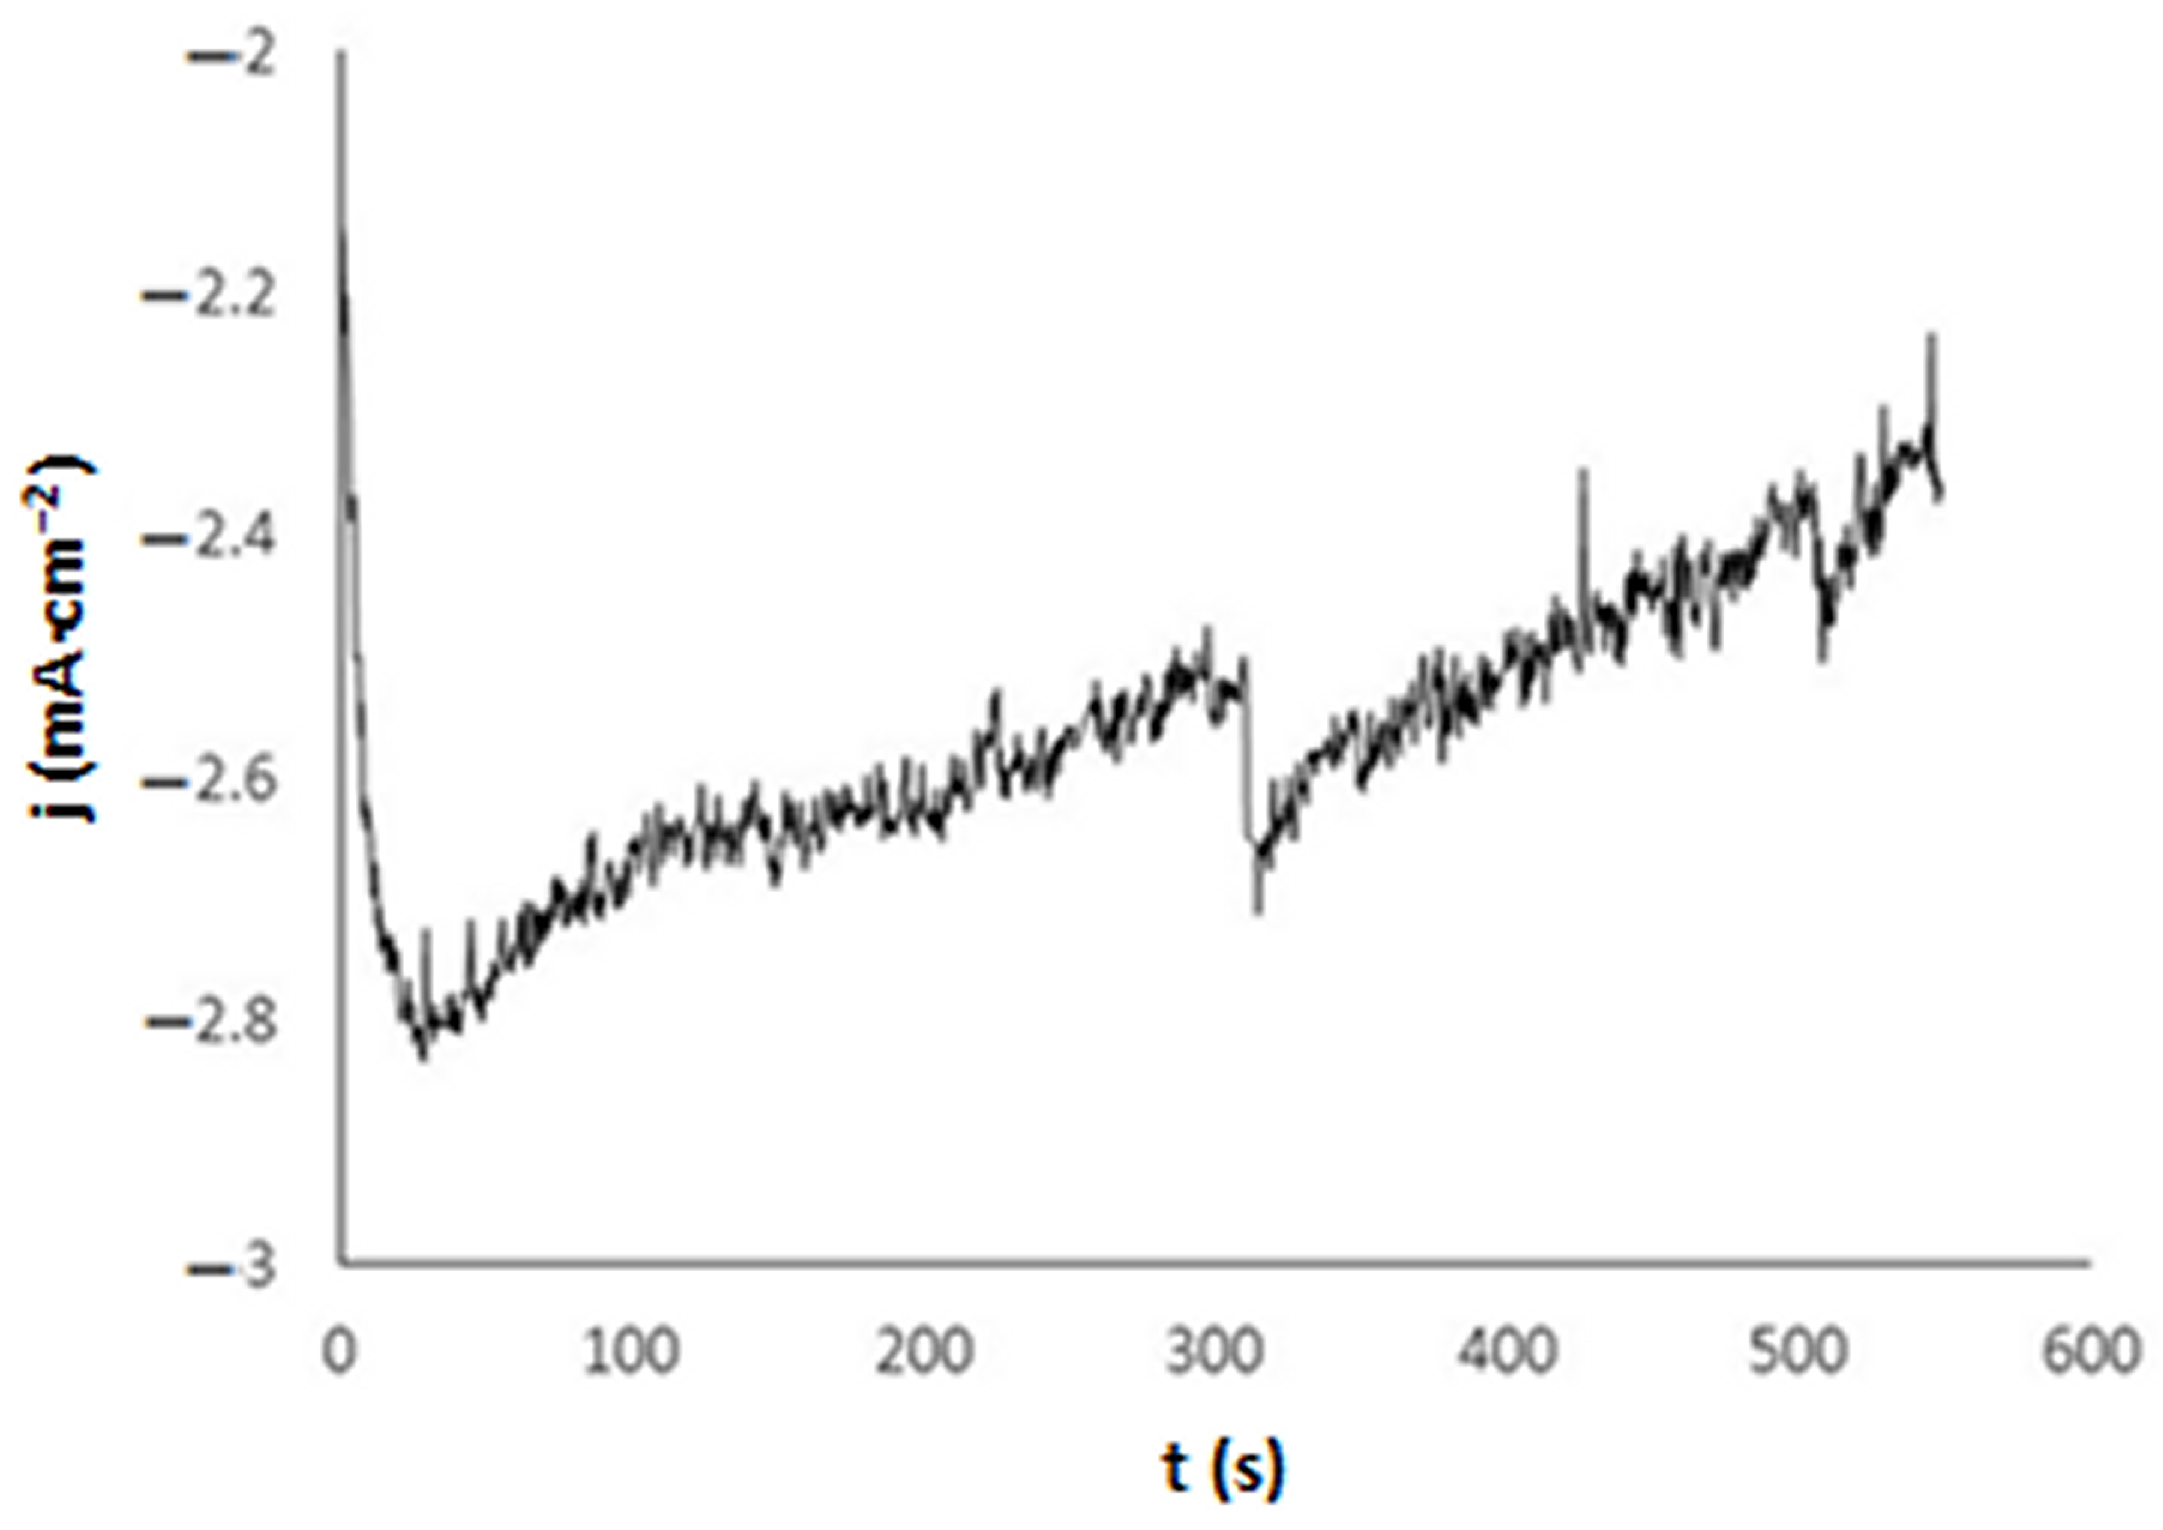
3.1. Electrochemical Synthesis

Figure 1 shows the synthesis of RGO on Al Guefoams using cyclic voltammetry. In this experiment, 48 scans were applied to achieve a similar electrical charge to that obtained by potentiostatic synthesis. During the synthesis, some nitrogen bubbling was maintained to avoid GO precipitation. GO alone is stable in solution due to its negative charge in a wide range of pH values [20]. However, when salts are added to facilitate the electrical conduction, GO tends to precipitate due to surface charge screening [30]. In the different scans, a reduction peak was observed below −1.5 V; this peak could be attributed to the reduction of graphene oxide, since the reduction peak of GO appeared at potentials below −1 V (vs. SCE) [31,32], and some hydrogen evolution cannot be discounted. It was observed that the current density decreased as the number of scans increased. This could be attributed to the formation of an oxide layer on the surface of the Al Guefoam, and it was ascertained in an experiment where the same polarization program and number of scans were applied to an Al Guefoam in a solution containing only the electrolyte (0.1 M Na2SO4). The same behavior was observed, and the current density decreased as the number of scans increased. As shown in Figure 1, at potentials above −1 V, a positive current was achieved in the voltammogram. This positive current led to the surface oxidation of the Guefoam; the formation of insulating oxides would explain the current density decrease in the voltammograms. The Guefoams obtained in this way were also observed with FESEM, and no RGO deposition on the surface could be observed. Oxide formation would destabilize the RGO deposition.
This is why, in Figure 2, the upper limit potential was decreased until reaching −1.45 V; the lower limit potential was maintained at −2 V. Since the potential scan range was decreased, the number of scans was doubled until reaching 96 scans to achieve a similar electrical charge to the one obtained in Figure 1. As can be seen, no significant current density variation was observed with an increasing number of scans. Lowering the upper potential limit avoided the oxidation of the Al surface, since no positive currents were achieved. Significant RGO deposition was obtained this time.
Figure 3 shows the current density vs. time curve obtained for the potentiostatic synthesis of RGO on the Al Guefoam. The electrical charge achieved was −2.4 C.

3.2. FESEM Characterization

Figure 4 compares the micrographs of the different Guefoams (Al, Al +RGO potentiostatic, and Al + RGO potentiodynamic) at different magnifications (×200, ×2000, and ×10,000). The Al Guefoams (Figure 4a,d,g) showed a rough surface due to the synthesis procedure, which involved melting the aluminum in a crucible. When a potentiostatic synthesis was performed, some reduced graphene oxide sheets were observed on the surface of the Guefoams. This was better observed at a higher magnification (Figure 4h), where the characteristic crumpled surface of reduced graphene oxide helped to locate them. Wrinkling in graphene materials appears due to the thermodynamical instability of 2D crystals, which cannot exist in their smooth state, and wrinkling allows a decrease in the total free energy [33]. However, the coating did not seem to be homogeneous. When the RGO synthesis was carried out using cyclic voltammetry in the potential range of −1.45 V to −2 V (Figure 4c,f,i), a thick RGO coating was observed on the surface of the Guefoam, even at a low magnification (Figure 4c). In this case, the coating was homogeneous and covered the entire surface of the Guefoam. At a higher magnification, it was seen that the reduced graphene oxide formed a three-dimensional coating with the presence of pores. At a high magnification (Figure 4i), the characteristic crumpled surface of reduced graphene oxide was observed. Some crystals of Na2SO4, which was used as the electrolyte in the electrochemical synthesis of the RGO coatings, were also observed on the surface of the RGO.
The thickness of the RGO coating on the potentiodynamically synthesized sample was determined using FIB-FESEM by producing a trench with the focused gallium ion beam. The potentiostatic coating did not show a proper distribution, as previously seen, and it was not analyzed using this technique. Figure 5a,c show the form of the trench obtained using the focused gallium ion beam in two different zones. At the top, the RGO coating can be observed. Figure 5c,d show the determination of the RGO coating thickness in different zones, where 166 nm and 125 nm were obtained, respectively. The RGO coating seemed to be well adhered to the Al, as can be seen in the interphase.

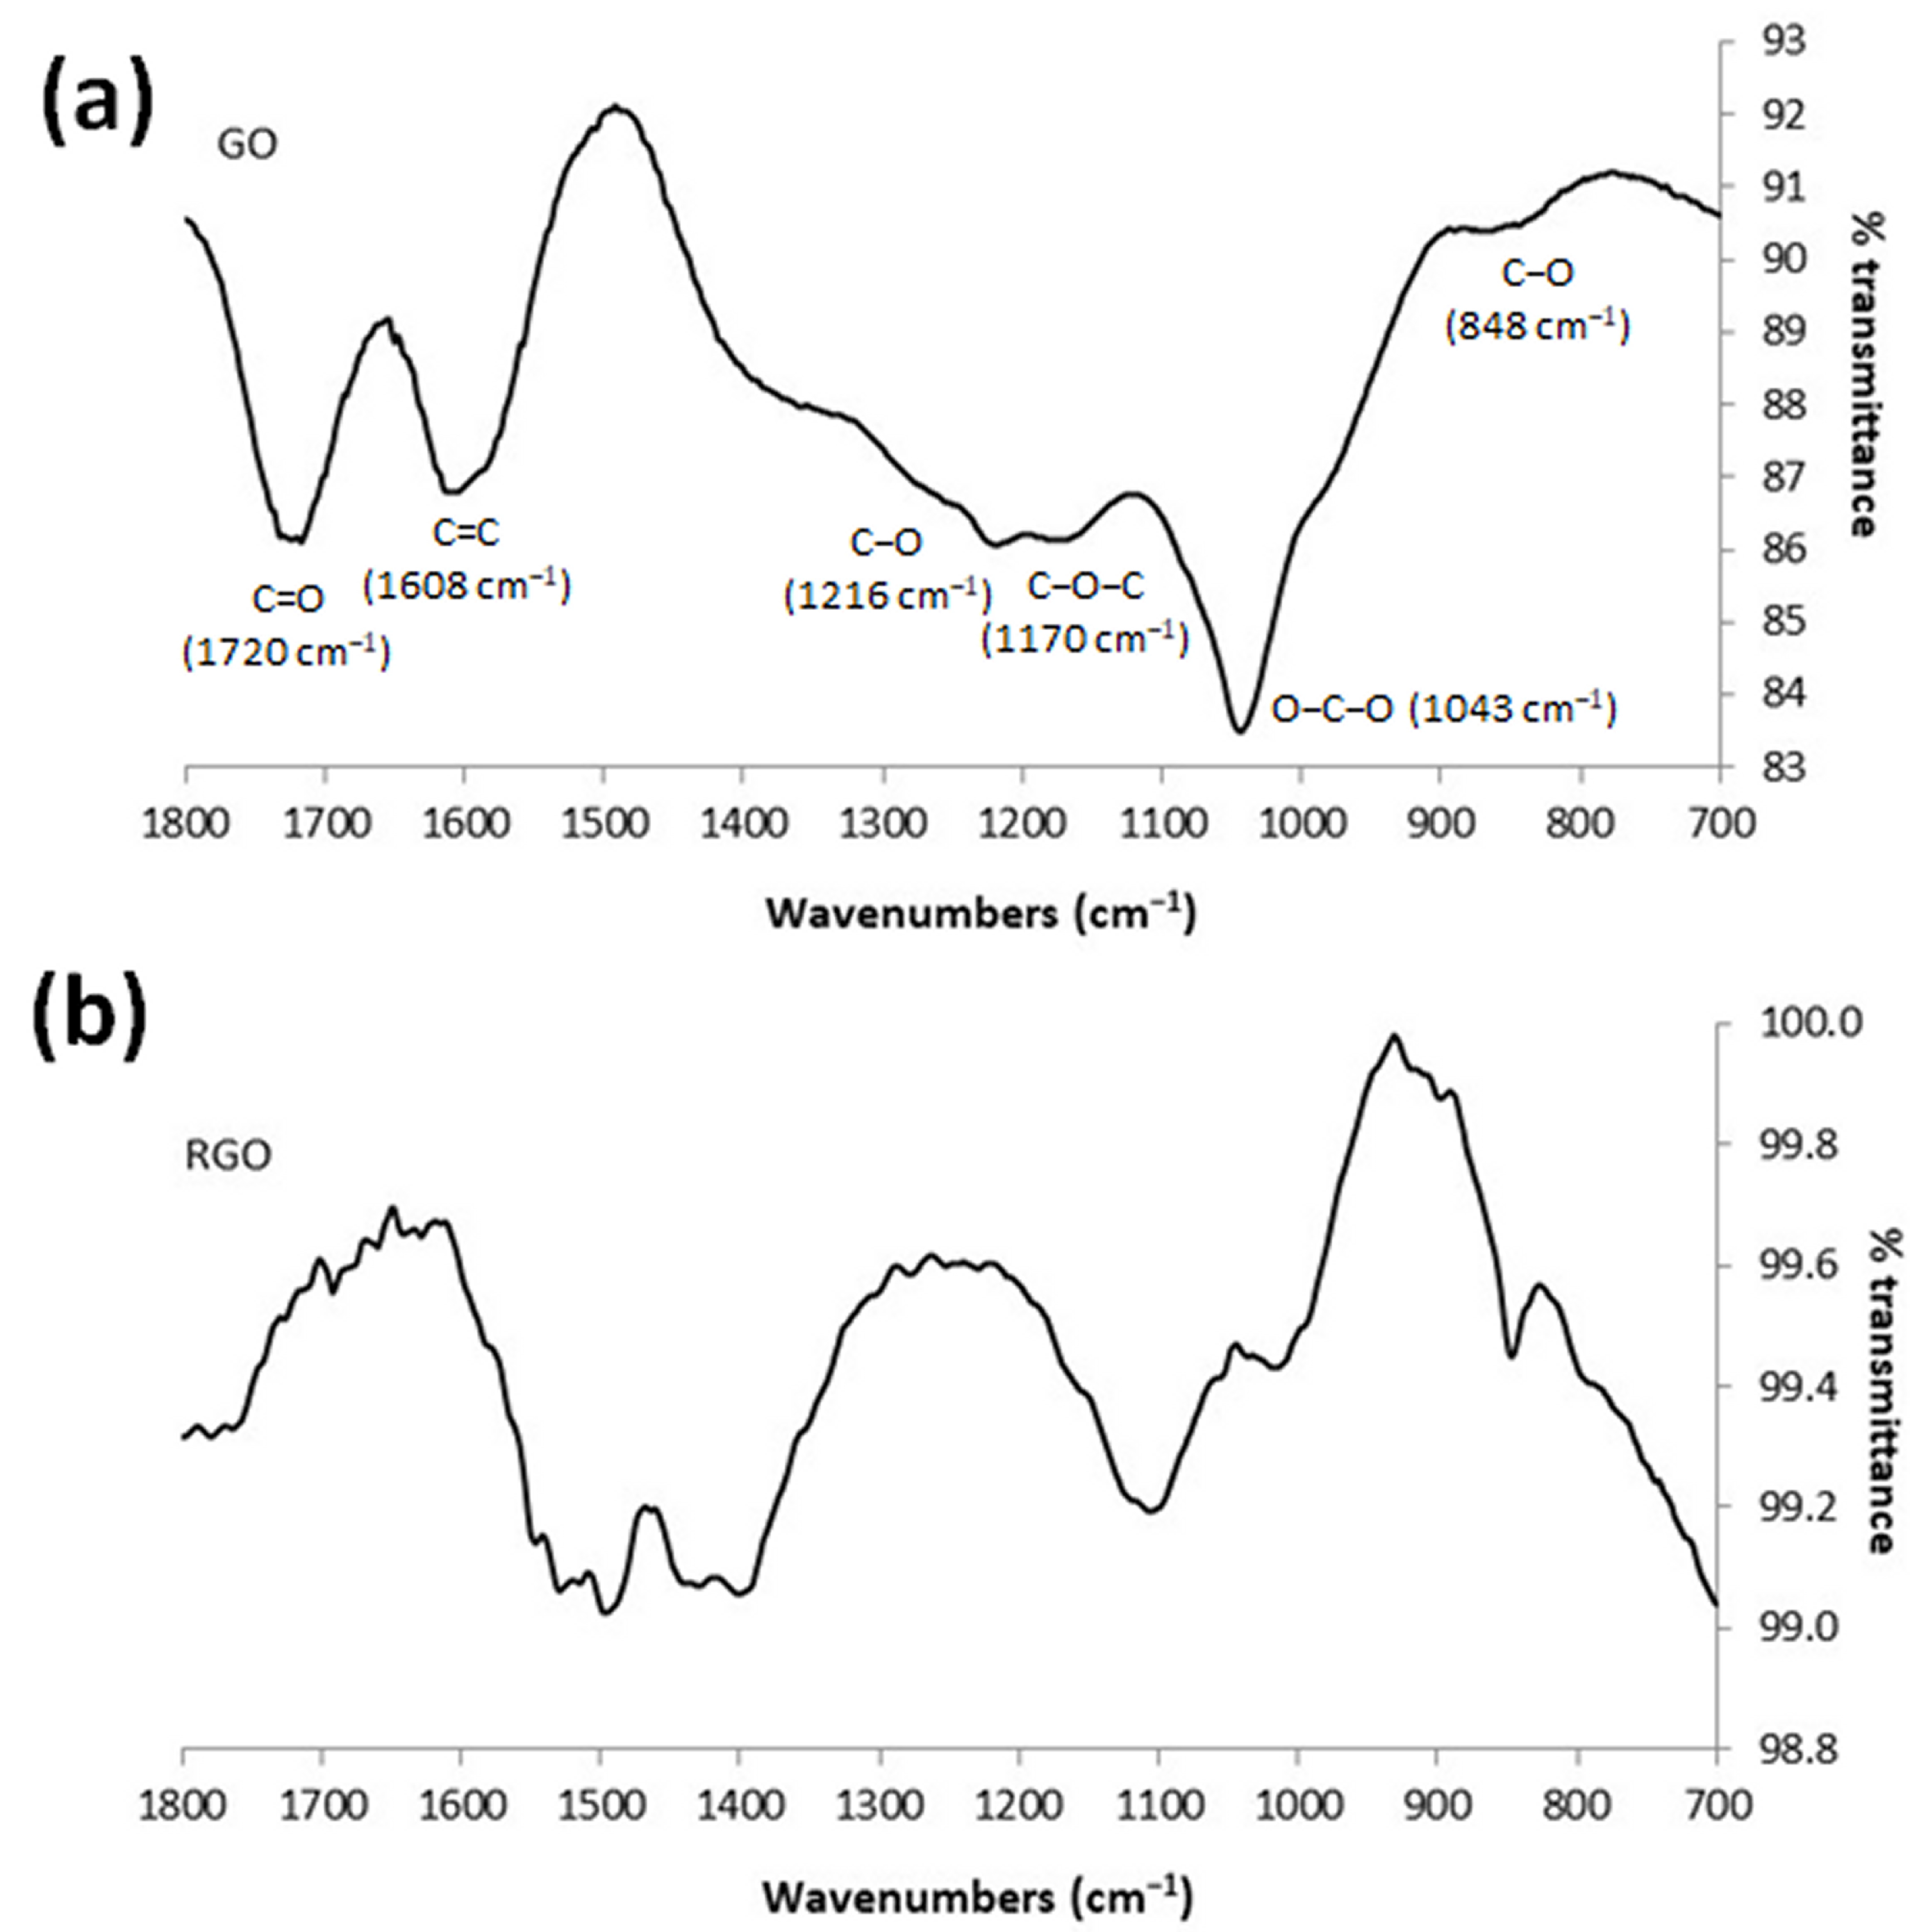
3.3. FTIR-ATR Characterization

FTIR-ATR was performed on the GO powders and electrochemically reduced graphene oxide (ERGO) powders. The ERGO powders were detached from the Al Guefoam using a blade. Figure 6a shows the spectra of the GO powders, where different bands arising from oxidized groups can be observed. The band around 1720 cm−1 was attributed to the stretching vibrations from C=O [34,35]. The peak at around 1608 cm−1 was attributed to the skeletal vibrations of unoxidized graphitic domains [34,35]. The band around 1050 cm−1 arose from the C-O stretching vibrations in O-C-O [35,36]. The band at around 1170 cm−1 was associated with the C-O-C stretching of the epoxy groups [37]. The band at 1216 cm−1 corresponded to the C-O stretching vibrations [38]. The band at around 850 cm−1 was attributed to the C-O stretching vibrations [39]. ERGO showed a substantial decrease in all the bands assigned to oxygen-containing groups (Figure 6b), demonstrating that a high degree of electrochemical reduction was achieved.

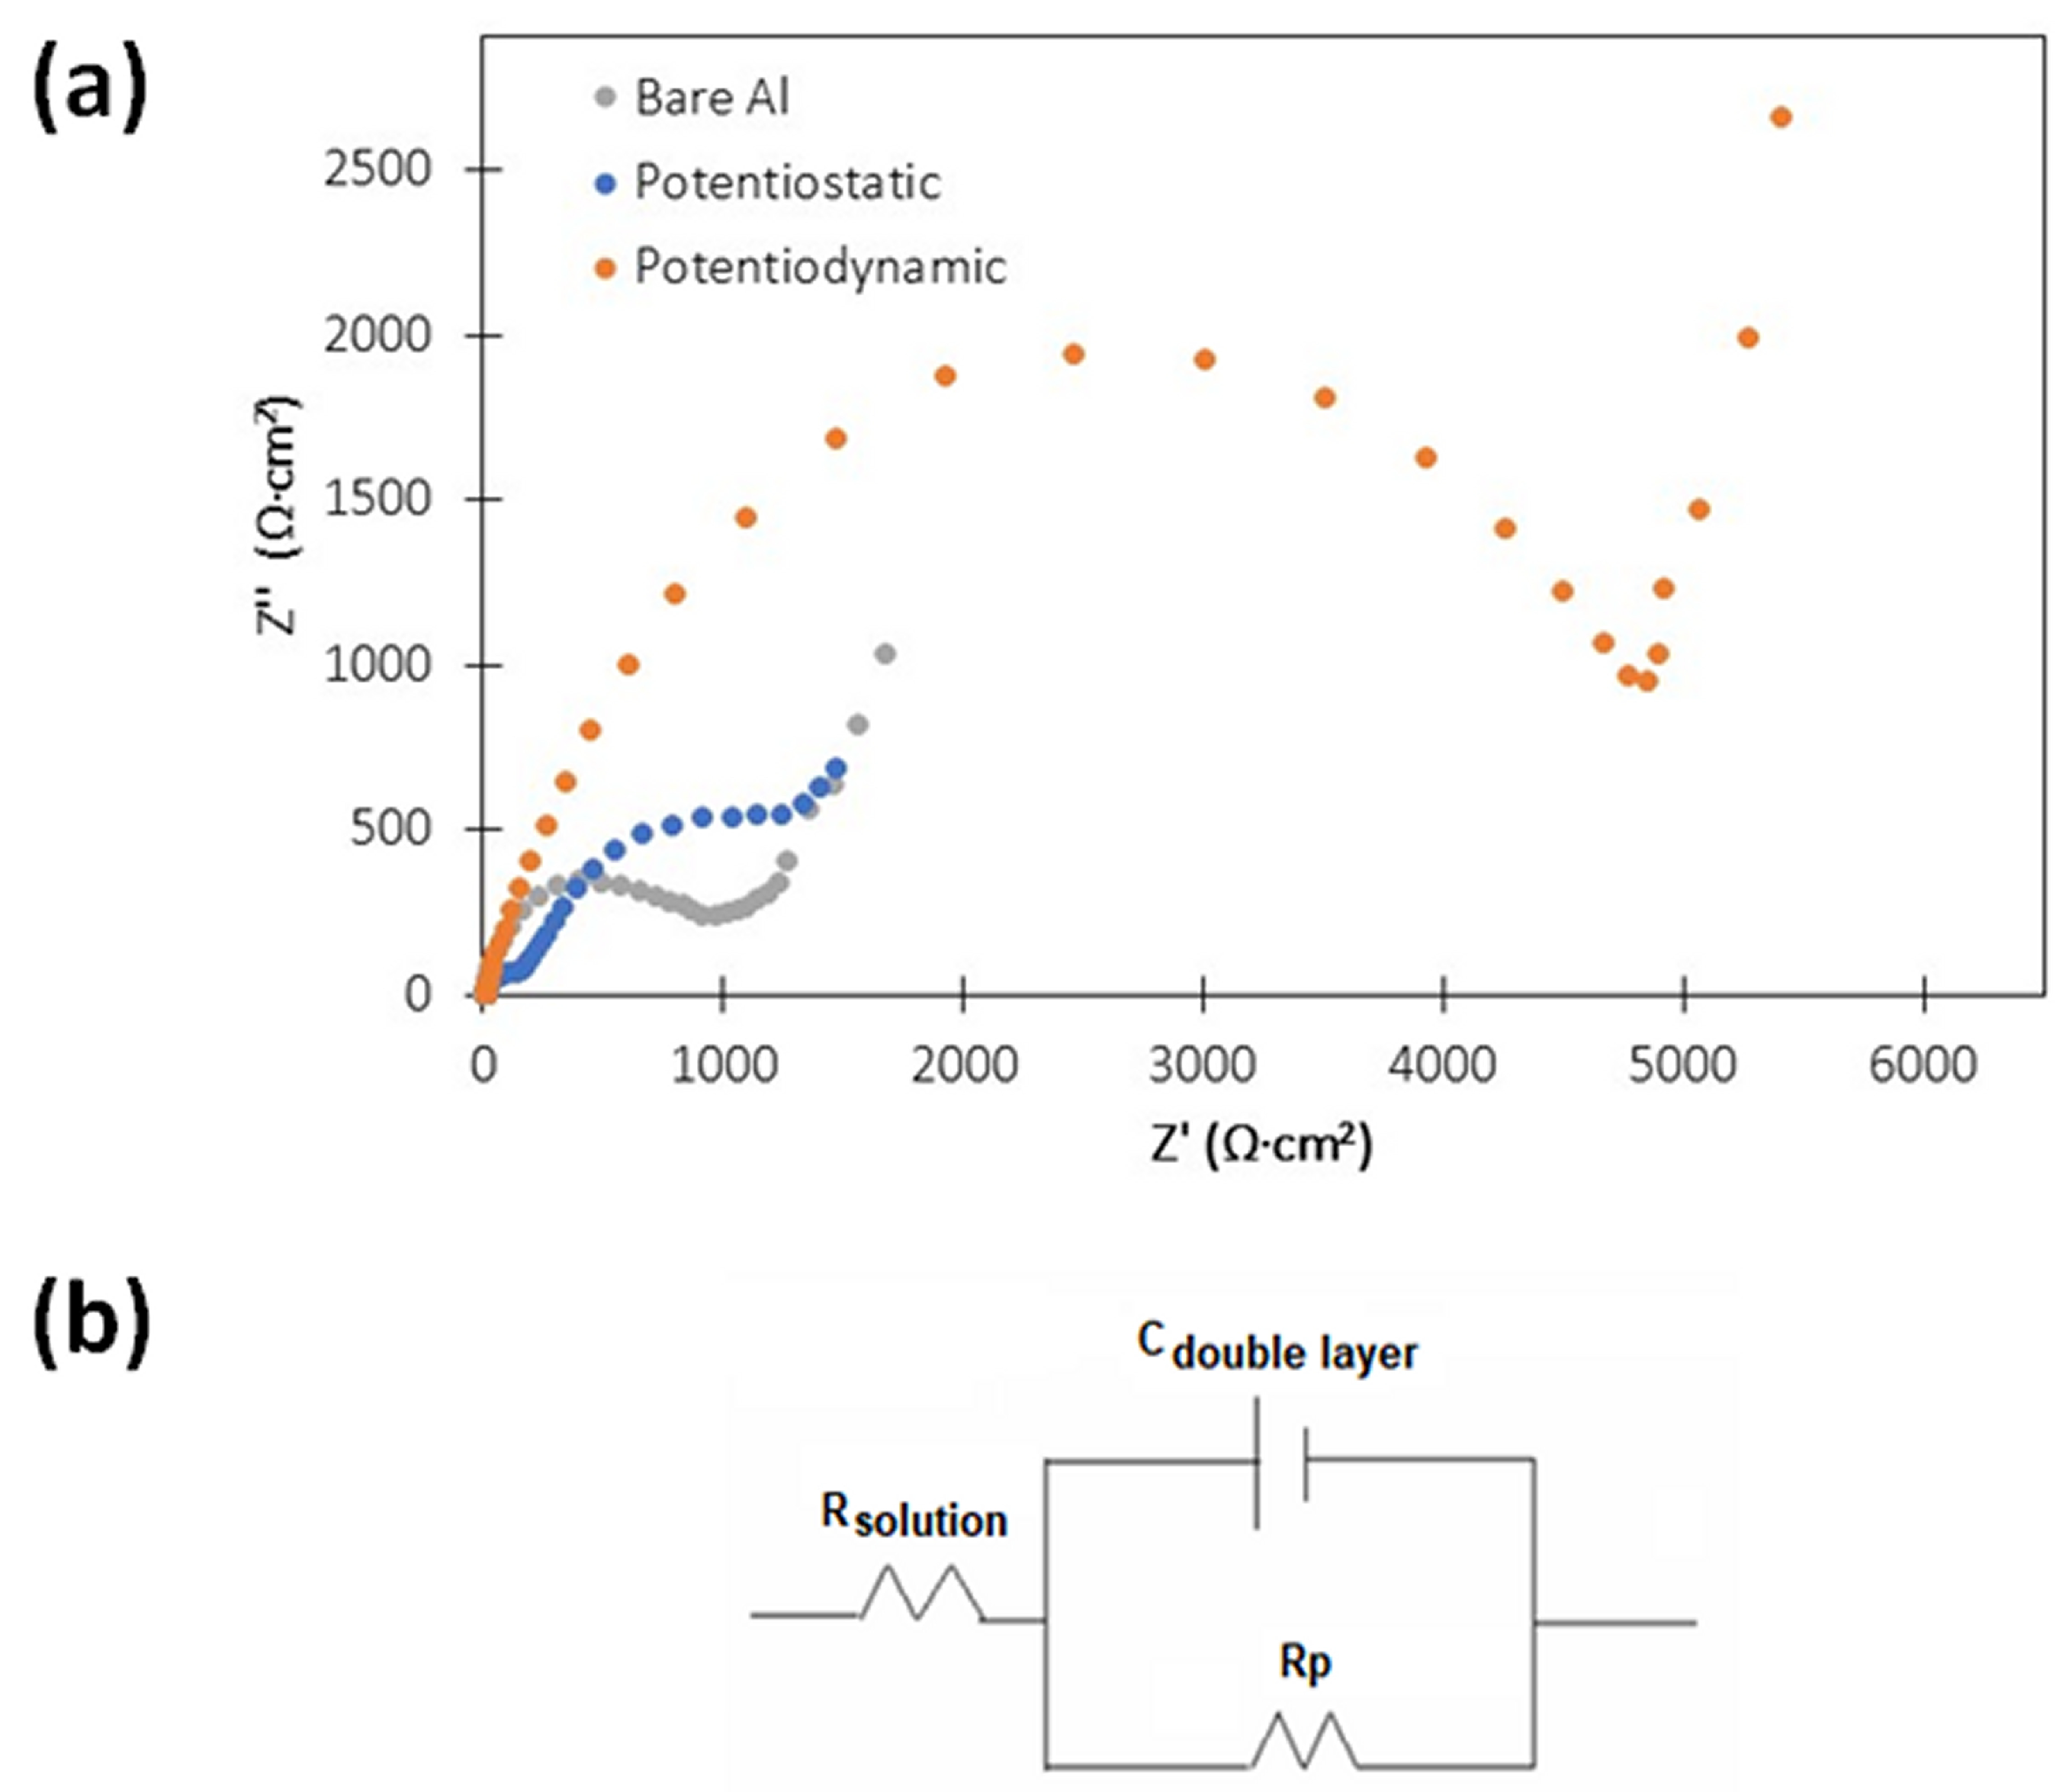
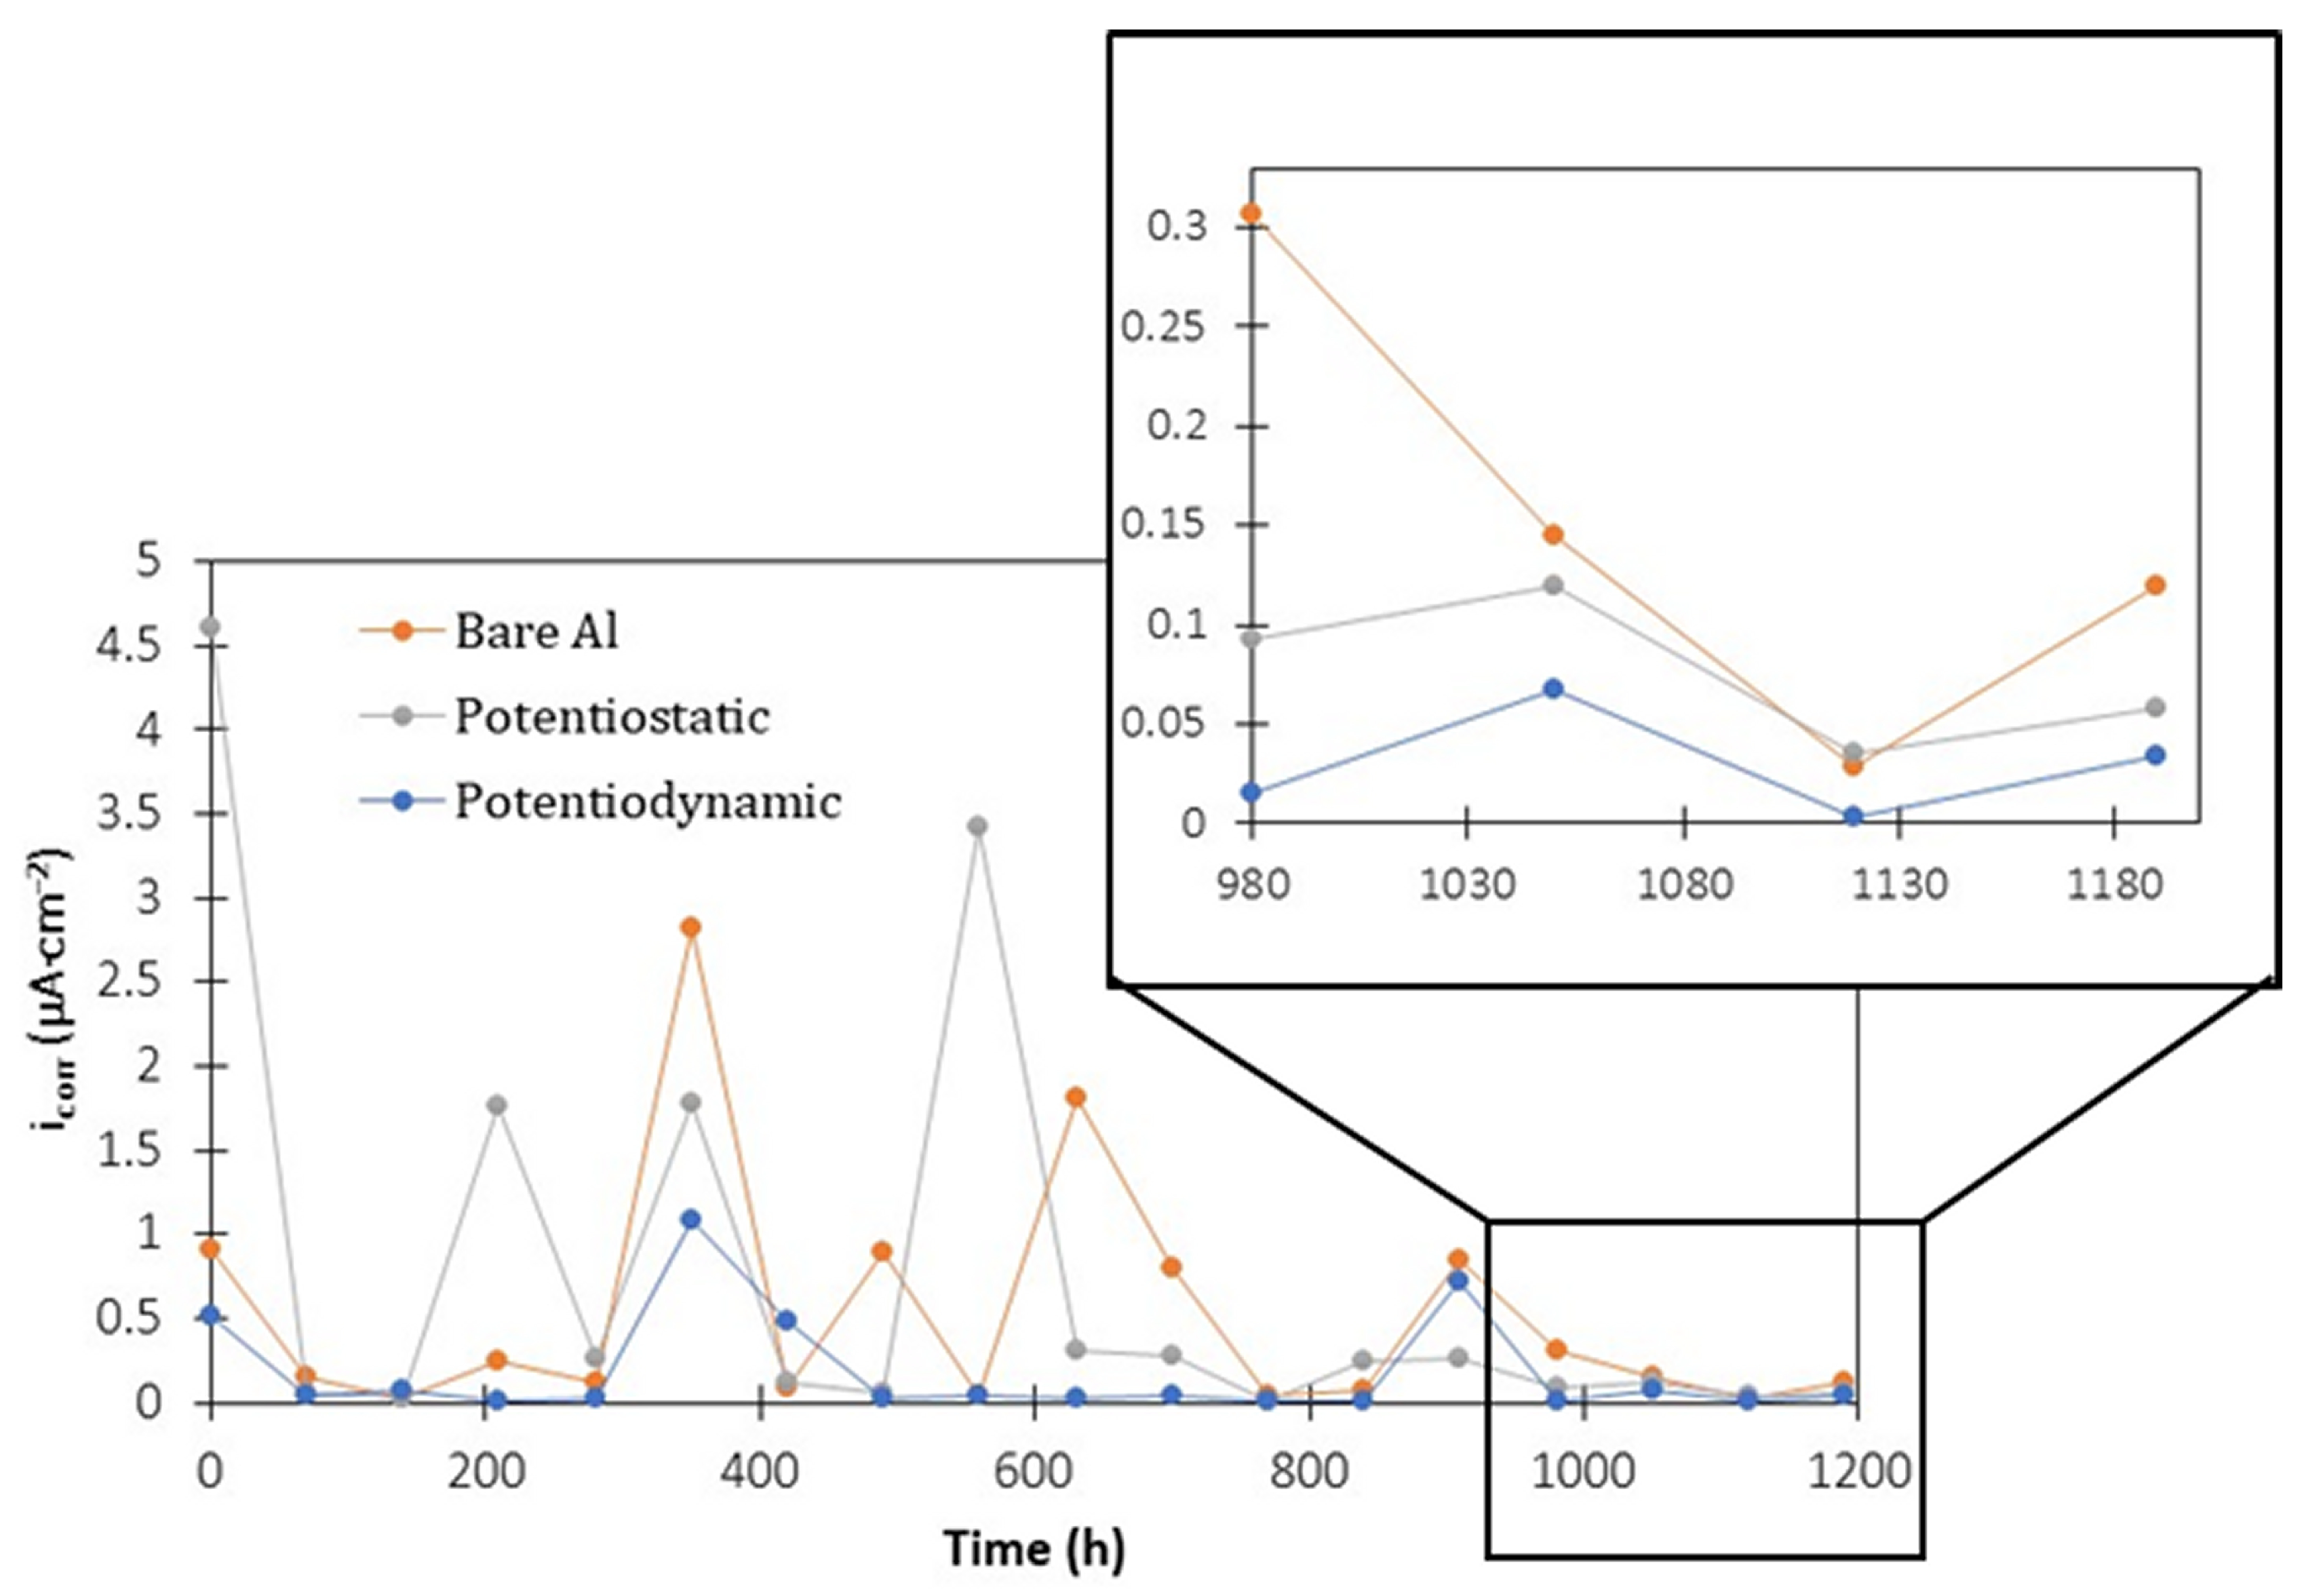
3.4. Electrochemical Measurements during Corrosion Tests

Figure 7a compares the Nyquist plots obtained using EIS for the different samples after 28 days of exposure to simulated seawater. The diameter of the semicircles corresponds to the polarization resistance Rp. The diameter of the semicircle or Rp was much higher for the potentiodynamic electrode than for the bare Al and potentiostatic electrodes. The data were fitted with the electrical equivalent circuit shown in Figure 7b to quantify the values of Rp (fitting not shown for a better view of Figure 7a). Table 1 shows how the Rp data obtained using EIS were significantly higher for the potentiodynamic electrode than for the bare Al and potentiostatic electrodes.
In addition, the icorr values were obtained using the Tafel polarization and Rp measurements (polarization resistance DC method) to corroborate the previous results obtained using EIS. Similarly, Table 1 shows how the potentiodynamic electrode presented the best values compared to those of the bare Al and potentiostatic electrodes.
In order to evaluate the corrosion in a simulated environment, the samples were subjected to steam generated by heating a 3.5% NaCl solution. Table 2 shows how the potentiodynamic samples obtained better values for the icorr and Rp measurements. Figure 8 shows the icorr measurements vs. time for the specimens. The potentiodynamic RGO-coated Guefoam presented the best values of the samples analyzed. The last four icorr measurements (enlarged image of Figure 8) for the potentiodynamic sample also showed significantly better values than the other samples. Very low icorr values for the potentiodynamic specimen were obtained throughout the test. Most of the icorr values were below 0.1 μA cm−2, which implies that the potentiodynamic sample was in the passivation zone for practically all the corrosion tests. Sudden increases in the icorr of the samples can be attributed to the appearance of pitting corrosion; these defects were later sealed, and the icorr decreased. This behavior has been observed for Al with in situ microtomography, where the death of pits was observed after 24–48 h of nucleation [40].

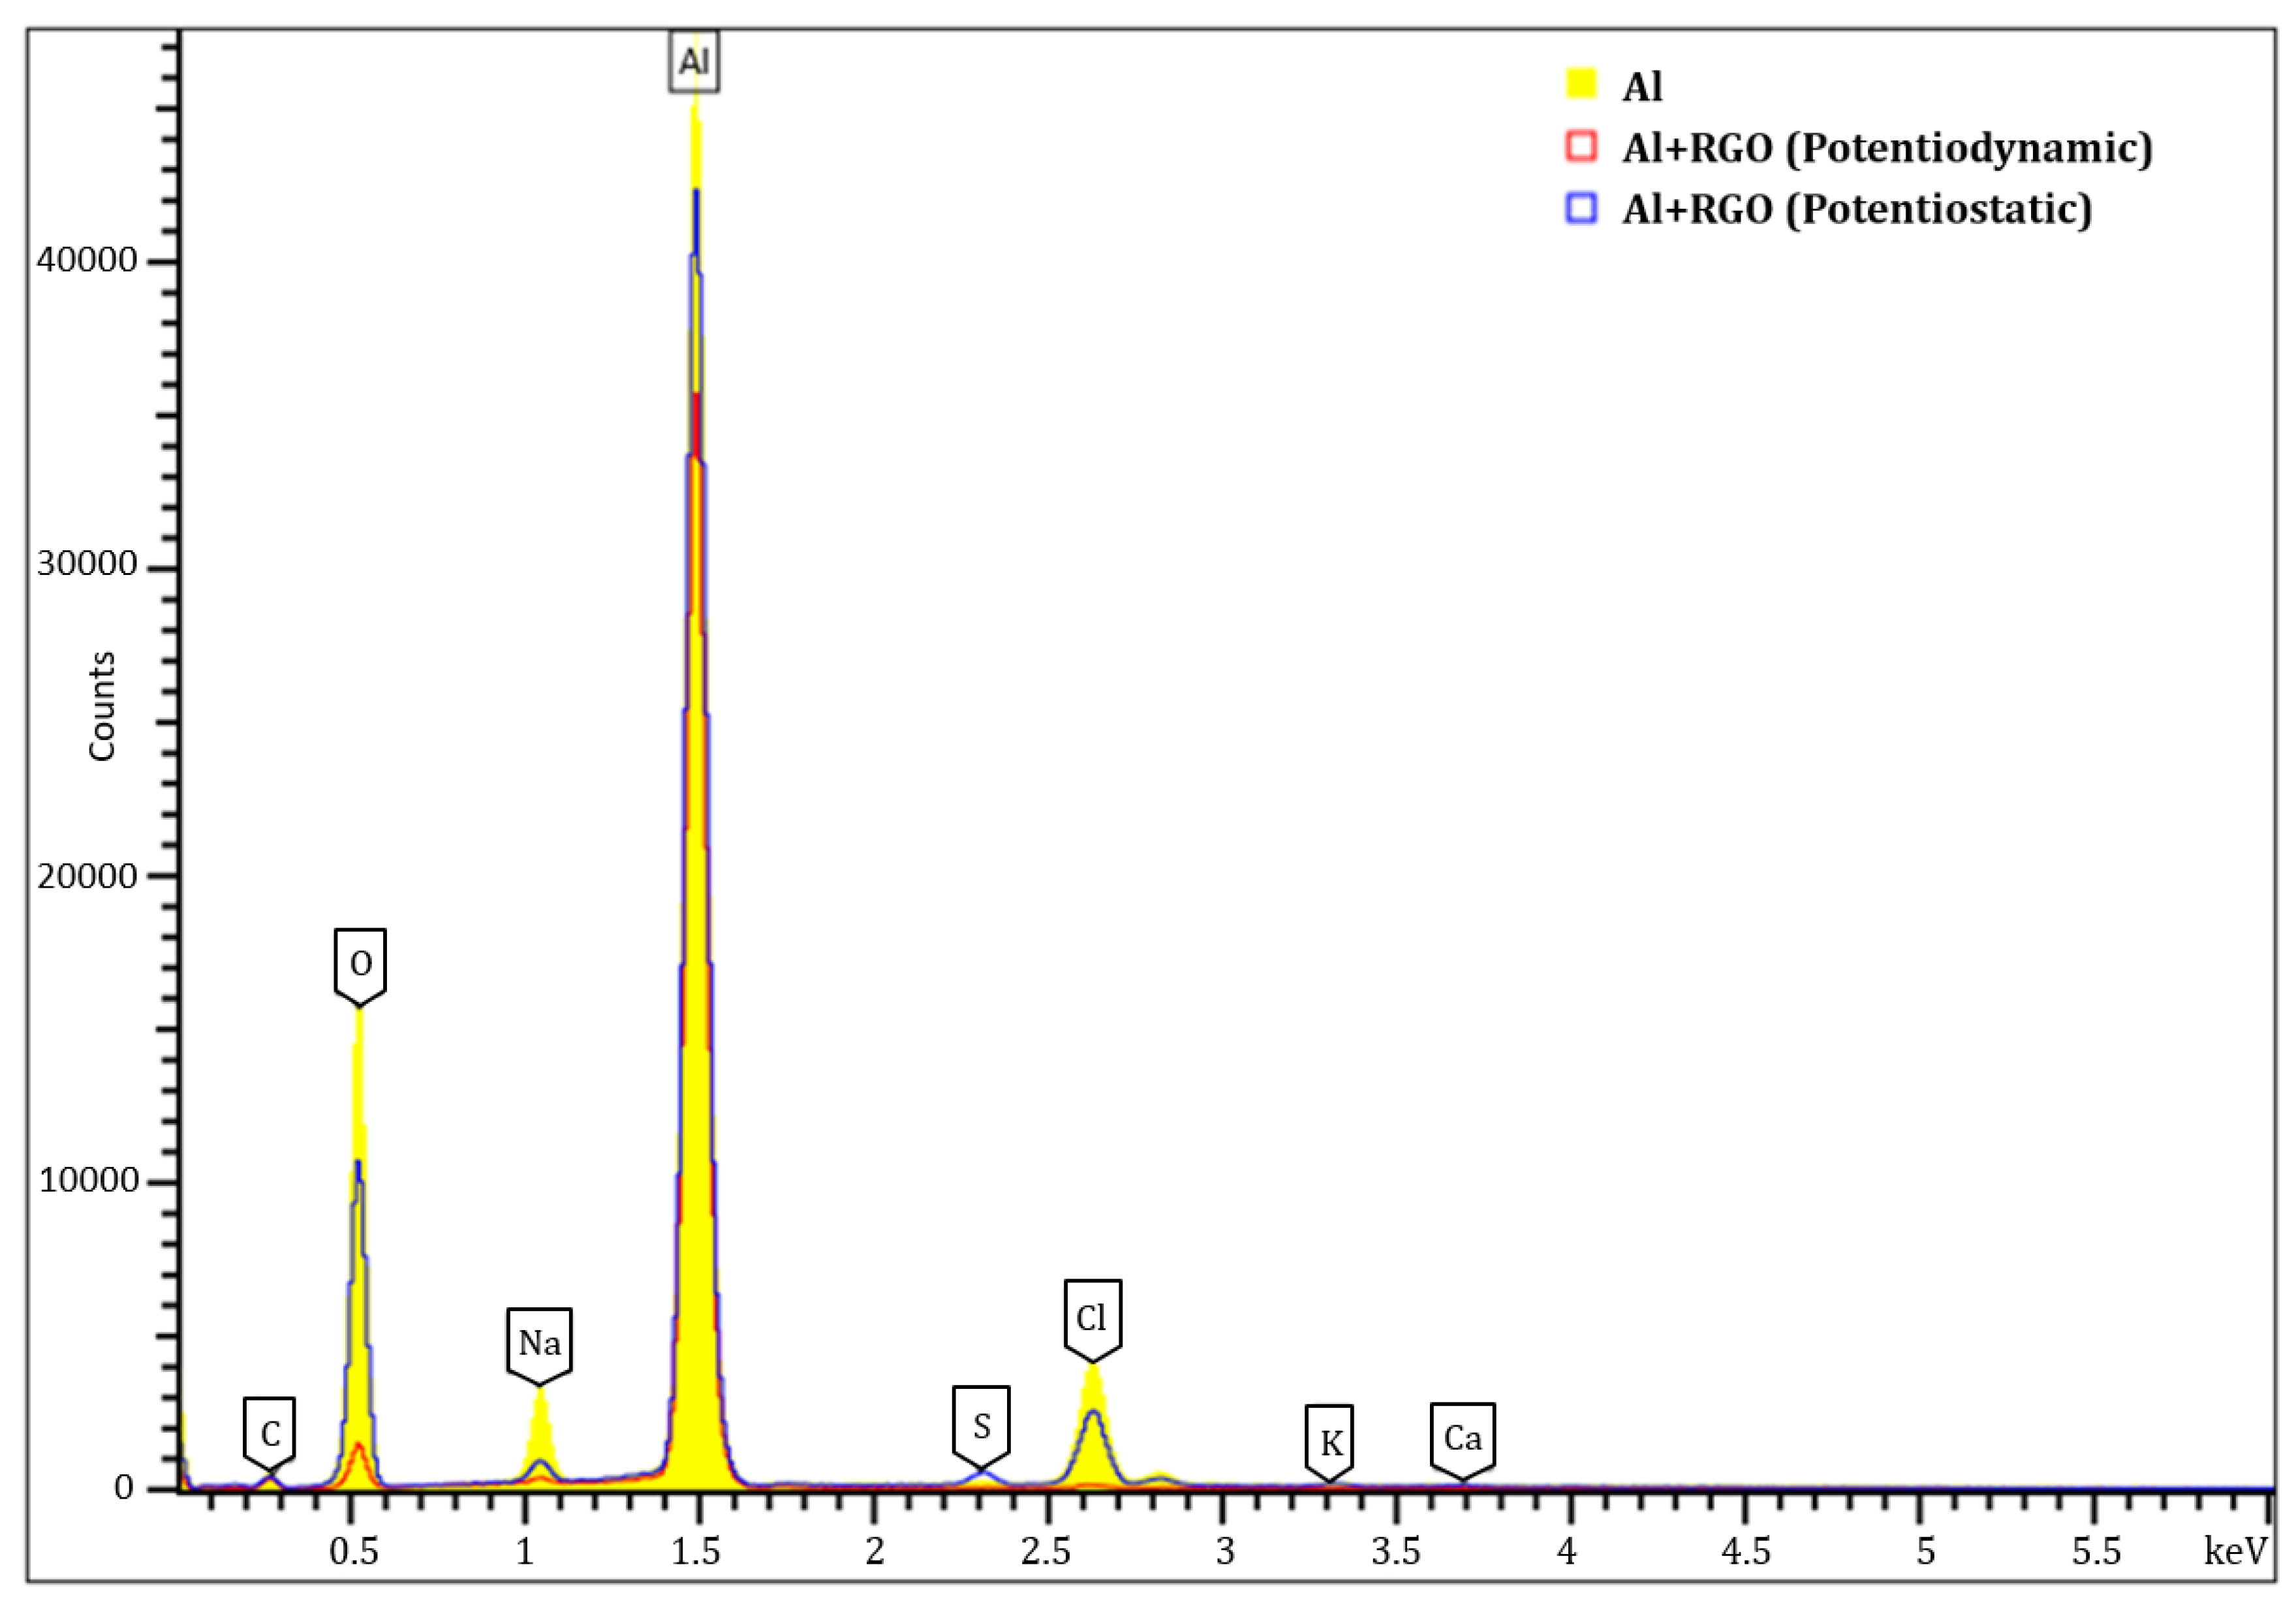
3.5. FESEM and EDX Characterization after Corrosion Tests

Figure 9 compares micrographs obtained at different magnifications (×200, ×2000, and ×10,000) of the different Guefoams after exposure to 3.5% NaCl for 28 days. In the case of bare Al Guefoam (Figure 9a,d,g), the growth of a corroded layer was observed. The white zones in the micrograph (Figure 9a) indicate a zone of electron accumulation due to the poor conductivity of the formed layer (oxides, chlorides). In the case of the RGO-coated Guefoam obtained by potentiostatic synthesis (Figure 9b,e,h), the corroded layer also formed. However, it was thinner than the one formed on bare Al (Figure 9a). In some zones, cracks in the formed layer were observed (Figure 9e). This was due to the dehydration of the film after extracting the samples from the solution. The RGO coating obtained using cyclic voltammetry showed the best corrosion protection, as can be observed in Figure 9c,f,i, where the corroded layer is barely visible. It seems that the RGO coating was progressively lost, since it could no longer be observed on the surface of the Guefoam. The accelerated corrosion test was performed in simulated salt water (3.5% NaCl), which was very aggressive and seemed to eliminate the RGO coating progressively. These Guefoams were intended for air filtration systems, where the corrosion conditions are mild.
Figure 10 shows the element distribution map of the principal elements detected during the EDX analysis of the bare Al Guefoam after 28 days of exposure to simulated seawater. Figure 10a shows the micrograph where the analysis was performed, which showed the formation of a corroded layer. Figure 10b shows the spatial distribution of aluminum, and it can be seen that aluminum was present in this layer. Figure 10c shows the location of O; it can be seen that oxygen was present in the coating, but was absent from the cracked zones, which demonstrates that the aluminum beneath was not oxidized. A similar distribution was obtained for Cl, and it was not detected in the cracked zones (Figure 10d). This demonstrates that the corroded layer was composed of Al, O, and Cl. A similar distribution was obtained for the RGO-coated Guefoams after corrosion.
Figure 11 compares the energy-dispersive X-ray spectra for the different Guefoams after 28 days of exposure to a 3.5% NaCl solution. The analysis was performed in micrographs obtained with ×500 magnification. The peak at 0.525 keV, attributed to the Kα transition of O [41], showed the lowest intensity for the Guefoam with RGO obtained potentiodynamically. The potentiostatic RGO also showed a lower intensity when compared with the bare Al Guefoam. The same trend was observed for Cl (peak at 2.621 keV due to the Kα transition) [41]. The peak at 1.486 keV, which corresponded to the Kα transition of Al [41], showed the opposite trend. The highest intensity was obtained for the bare Al Guefoam, with the intensity diminishing in the presence of a potentiostatic or potentiodynamic coating. Thus, the EDX analyses showed better protection of the RGO coating obtained using cyclic voltammetry due to the lowest presence of oxygen and chlorides on the surface of the Guefoams.

3.6. Measurement of Al Concentration

Table 3 shows the aluminum concentration in the 3.5% NaCl solutions after contact with the different Guefoams for 28 days. Some aluminum was converted to chlorides during the corrosion process, which accumulated in the solution. The pH of the different solutions was adjusted to 2 with HCl to dissolve the Al precipitates observed in the different solutions. The bare Al showed an Al concentration of 145 mg·L−1. The potentiostatically obtained RGO coating reduced the Al concentration by half (70 mg·L−1), improving the corrosion protection of the Guefoam to some extent. The potentiodynamically obtained RGO resulted in a lower Al content in the solution, thus offering the best corrosion protection.

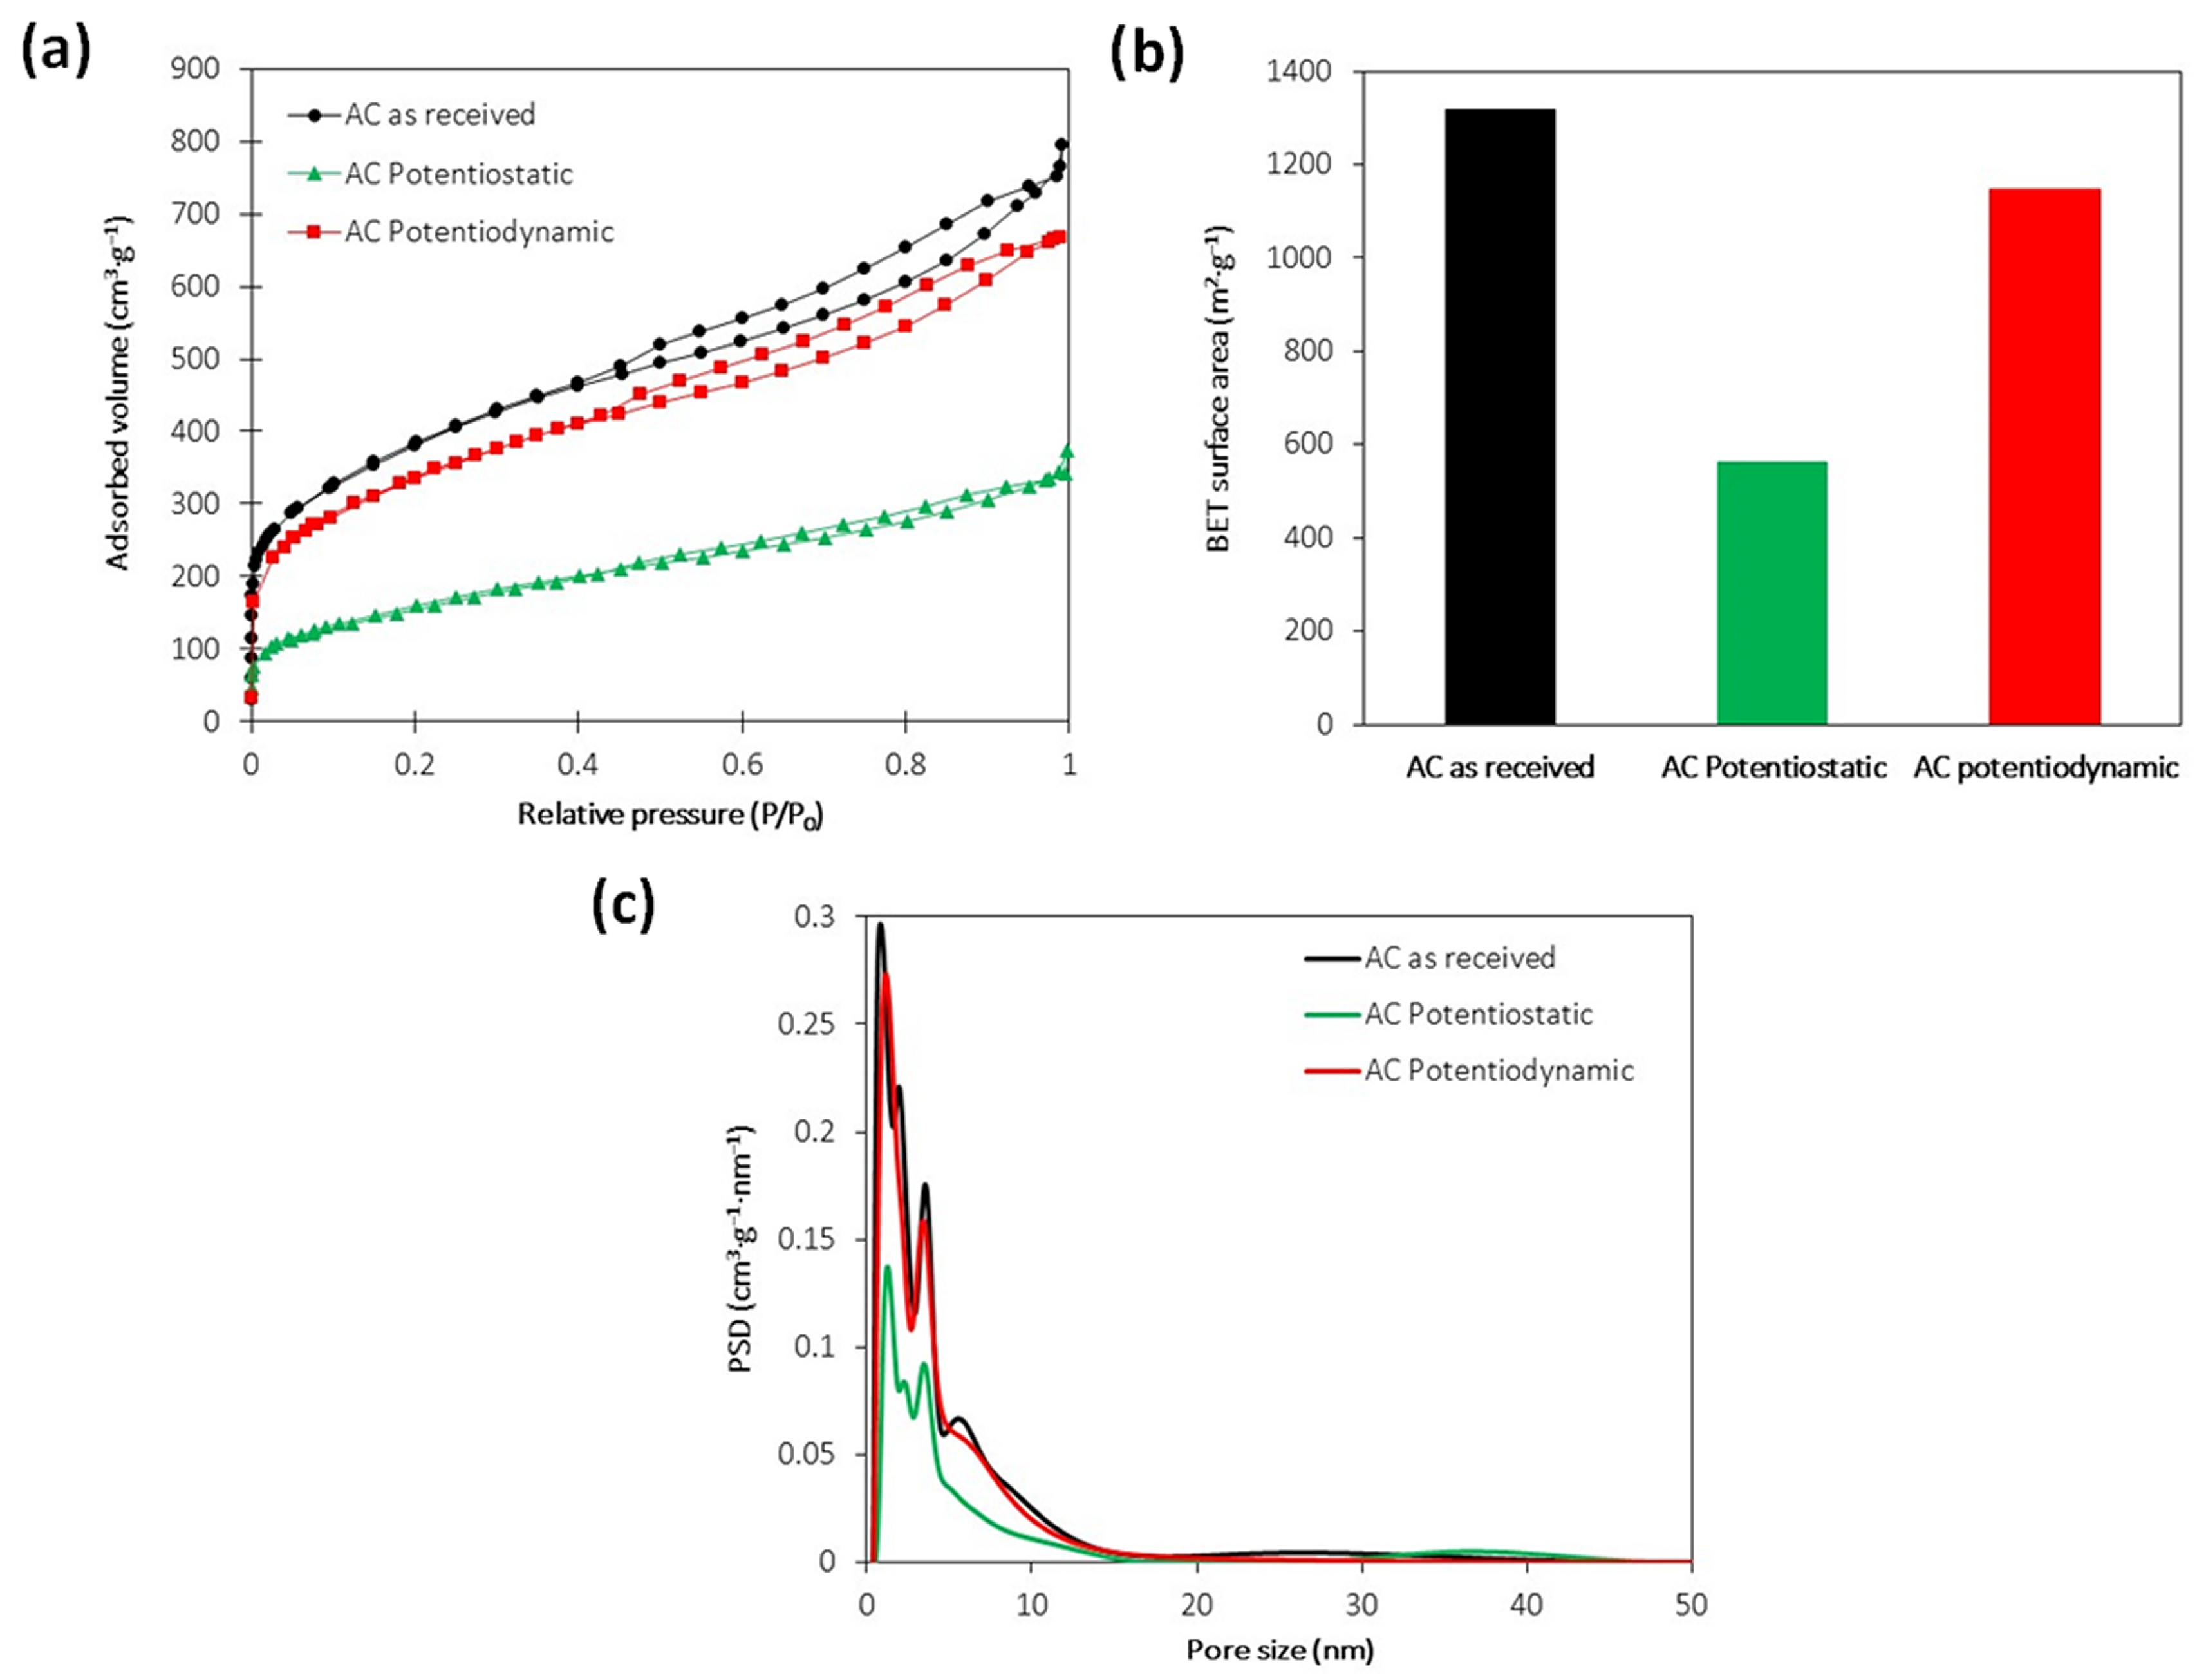
3.7. Surface Characterization of the Guest-Phase Particles

Figure 12a shows the adsorption–desorption isotherms of the activated carbon (AC) guest phases extracted from Guefoams previously coated with RGO. For comparison, the plot also contains an analysis of the as-received AC. From the isotherms, the surface area of the particles (Figure 12b) was determined using the BET theory. The results indicate that the surface area of the AC particles decreased by 57% and 13% when subjected to potentiostatic and potentiodynamic synthesis, respectively. The decrease in the BET values may be attributed to the deposition of RGO at the AC pores, with no specific preference for pore size obturation, as the pore size distributions covered all micro-to-macro size ranges in all cases (Figure 12c). The nearly equivalent results of the as-received AC and the particles extracted from Guefoams with a potentiodynamic coating suggest that the electrochemical RGO deposition occurred mainly in the metal matrix, providing better corrosion resistance, as discussed in Section 3.6.

4. Conclusions

Reduced graphene oxide (RGO) coatings electrochemically synthesized on Guefoams showed improved corrosion protection after exposure to a 3.5% NaCl solution after 28 days. Two different methods of synthesis were used: potentiostatic and potentiodynamic. Potentiodynamic deposition resulted in better coverage of the Guefoam surface by RGO, as observed using FESEM. The election of the potential limits is crucial for the deposition of RGO. If positive currents are achieved during potential cycling, the passivation of the aluminum surface occurs, hindering the deposition of RGO. Avoiding potentials where positive currents are obtained improves the deposition of the RGO coating, as observed using FESEM. The corrosion process was monitored for 28 days using electrochemical impedance spectroscopy, polarization resistance tests, and Tafel polarization curves. The best values for the polarization resistance and corrosion current density were obtained for the Guefoams coated with RGO obtained by cyclic voltammetry. In a more realistic environment (steam generated by heating a 3.5% NaCl solution), the Guefoams coated with RGO obtained by cyclic voltammetry also showed the best values for the icorr and Rp measurements. The potentiodynamic samples were in the passivation zone for practically all of the corrosion tests.
The FESEM characterization of the Guefoams after corrosion showed the growth of an oxide layer. The RGO coating reduced the formation of this layer, with the lowest formation achieved for the potentiodynamically synthesized RGO. RGO coatings reduced the Al concentration in the solution in contact with the Guefoams for 28 days. This reduction was by half in the case of the potentiostatically synthesized RGO coating and by a fourth in the case of the potentiodynamically synthesized RGO coating. The corrosion protection offered by the RGO coatings can be mainly ascribed to a barrier effect that hinders the diffusion of corrosive species such as chlorides and oxygen.

Author Contributions

R.R.: investigation and data curation. J.M.: conceptualization, methodology, supervision, writing—original draft, and writing—review and editing. J.B.: formal analysis, investigation, methodology, supervision, and writing—review and editing. L.P.M.: investigation and data curation. J.M.M.: conceptualization, formal analysis, methodology, funding acquisition, supervision, and writing—review and editing. F.C.: conceptualization, methodology, funding acquisition, supervision, writing—review and editing, and project administration. All authors have read and agreed to the published version of the manuscript.

Funding

This research is part of the Spanish R+D+i contracts PDC2021-121617-C21 and PDC2021-121617-C22, funded by MCIN/AEI/10.13039/501100011033 and by the “European Union NextGenerationEU/PRTR”. Conselleria de Innovación, Universidades, Ciencia y Sociedad Digital (Generalitat Valenciana) is gratefully acknowledged for providing funding (GVA-COVID19/2021/097). Funding for the open access charge was provided by CRUE-Universitat Politècnica de València. The funding sources had no involvement in the study design; in the collection, analysis, and interpretation of data; in the writing of the report; or in the decision to submit the article for publication.

Institutional Review Board Statement

Not applicable.

Informed Consent Statement

Not applicable.

Data Availability Statement

The data will be made available upon request. http://hdl.handle.net/10251/202369, accessed on 30 January 2024.

Acknowledgments

The Electron Microscopy Service of the UPV (Universitat Politècnica de València) is gratefully acknowledged for their help with the FESEM and EDX characterization.

Conflicts of Interest

The authors declare that they have no known competing financial interests or personal relationships that could have appeared to influence the work reported in this paper.

References

  1. Molina-Jordá, J.M. Materiales Espumados de Poro Interconectado con Fases Huésped, Procedimiento Para la Preparación de Dichos Materiales y usos de los Mismos. Spanish Patent P201730890, 6 August 2019. [Google Scholar]
  2. Molina-Jordá, J.M. Open-pore foam materials with guest phases, procedure for the preparation of these materials and uses thereof. US Patent US11623277B2, 11 April 2023. [Google Scholar]
  3. Molina-Jordá, J.M. Highly adsorptive and magneto-inductive guefoams (multifunctional guest-containing foams) for enhanced energy-efficient preconcentration and management of VOCs. ACS Appl. Mat. Interfaces 2020, 12, 11702–11712. [Google Scholar] [CrossRef] [PubMed]
  4. Molina-Jordá, J.M. Magneto-inductive open-cell cellular carbon composites with activated carbon as guest phase: Guefoams for energy-efficient VOCs management. Ceram. Int. 2022, 48, 17440–17448. [Google Scholar] [CrossRef]
  5. Maiorano, L.P.; Chaparro-Garnica, C.Y.; García, E.B.; Lozano-Castello, D.; Bueno-Lopez, A.; Molina-Jorda, J.M. Guefoams (guest-containing foams) as novel heterogeneous catalysts: Preparation, characterization and proof-of-concept testing for CO2 methanation. Mater. Des. 2022, 217, 110619. [Google Scholar] [CrossRef]
  6. Novoselov, K.S.; Fal′ko, V.I.; Colombo, L.; Gellert, P.R.; Schwab, M.G.; Kim, K. A roadmap for graphene. Nature 2012, 490, 192–200. [Google Scholar] [CrossRef] [PubMed]
  7. Cao, Y.; Fatemi, V.; Fang, S.; Watanabe, K.; Taniguchi, T.; Kaxiras, E.; Jarillo-Herrero, P. Unconventional superconductivity in magic-angle graphene superlattices. Nature 2018, 556, 43–50. [Google Scholar] [CrossRef]
  8. Ferrari, A.C.; Bonaccorso, F.; Fal’Ko, V.; Novoselov, K.S.; Roche, S.; Bøggild, P.; Borini, S.; Koppens, F.H.; Palermo, V.; Pugno, N.; et al. Science and technology roadmap for graphene, related two-dimensional crystals, and hybrid systems. Nanoscale 2015, 7, 598–4810. [Google Scholar] [CrossRef]
  9. Ambrosi, A.; Chua, C.K.; Latiff, N.M.; Loo, A.H.; Wong, C.H.A.; Eng, A.Y.S.; Bonanni, M.; Pumera, M. Graphene and its electrochemistry–an update. Chem. Soc. Rev. 2016, 45, 2458–2493. [Google Scholar] [CrossRef]
  10. Ali, M.A.; Hu, C.; Yuan, B.; Jahan, S.; Saleh, M.S.; Guo, Z.; Guellman, A.J.; Panat, R. Breaking the barrier to biomolecule limit-of-detection via 3D printed multi-length-scale graphene-coated electrodes. Nat. Commun. 2021, 12, 7077. [Google Scholar] [CrossRef]
  11. Burkholder, M.B.; Rahman, F.B.A.; Chandler Jr, E.H.; Regalbuto, J.R.; Gupton, B.F.; Tengco, J.M.M. Metal supported graphene catalysis: A review on the benefits of nanoparticular supported specialty sp2 carbon catalysts on enhancing the activities of multiple chemical transformations. Carbon Trends 2022, 9, 100196. [Google Scholar] [CrossRef]
  12. Ramalingam, G.; Perumal, N.; Priya, A.K.; Rajendran, S. A review of graphene-based semiconductors for photocatalytic degradation of pollutants in wastewater. Chemosphere 2022, 300, 134391. [Google Scholar] [CrossRef]
  13. Fei, H.; Dong, J.; Chen, D.; Hu, T.; Duan, X.; Shakir, I.; Huang, Y.; Duan, X. Single atom electrocatalysts supported on graphene or graphene-like carbons. Chem. Soc. Rev. 2019, 48, 5207–5241. [Google Scholar] [CrossRef]
  14. Seelajaroen, H.; Bakandritsos, A.; Otyepka, M.; Zboril, R.; Sariciftci, N.S. Immobilized enzymes on graphene as nanobiocatalyst. ACS App. Mater. Interfaces 2020, 12, 250–259. [Google Scholar] [CrossRef]
  15. Molina, J.; Cases, F.; Moretto, L.M. Graphene-based materials for the electrochemical determination of hazardous ions. Anal. Chim. Acta 2016, 946, 9–39. [Google Scholar] [CrossRef]
  16. Chen, D.; Feng, H.; Li, J. Graphene oxide: Preparation, functionalization, and electrochemical applications. Chem. Rev. 2012, 112, 6027–6053. [Google Scholar] [CrossRef]
  17. Safian, M.T.U.; Umar, K.; Ibrahim, M.N.M. Synthesis and scalability of graphene and its derivatives: A journey towards sustainable and commercial material. J. Clean. Prod. 2021, 318, 128603. [Google Scholar] [CrossRef]
  18. Agarwal, V.; Zetterlund, P.B. Strategies for reduction of graphene oxide–A comprehensive review. Chem. Eng. J. 2021, 405, 127018. [Google Scholar] [CrossRef]
  19. Toh, S.Y.; Loh, K.S.; Kamarudin, S.K.; Daud, W.R.W. Graphene production via electrochemical reduction of graphene oxide: Synthesis and characterisation. Chem. Eng. J. 2014, 251, 422–434. [Google Scholar] [CrossRef]
  20. Li, D.; Müller, M.B.; Gilje, S.; Kaner, R.B.; Wallace, G.G. Processable aqueous dispersions of graphene nanosheets. Nat. Nanotechnol. 2008, 3, 101–105. [Google Scholar] [CrossRef] [PubMed]
  21. Dennis, R.V.; Fleer, N.A.; Davidson, R.D.; Banerjee, S. Graphene Coatings for the Corrosion Protection of Base Metals. In Graphene Technology: From Laboratory to Fabrication, 1st ed.; Soroush, N., Stephen, R.W., Eds.; Wiley-VCH Verlag GmbH & Co. KGaA: Weinheim, Germany, 2016; pp. 155–176. [Google Scholar] [CrossRef]
  22. Yu, F.; Camilli, L.; Wang, T.; Mackenzie, D.M.; Curioni, M.; Akid, R.; Bøggild, P. Complete long-term corrosion protection with chemical vapor deposited graphene. Carbon 2018, 132, 78–84. [Google Scholar] [CrossRef]
  23. Prasai, D.; Tuberquia, J.C.; Harl, R.R.; Jennings, G.K.; Bolotin, K.I. Graphene: Corrosion-inhibiting coating. ACS Nano 2012, 6, 1102–1108. [Google Scholar] [CrossRef] [PubMed]
  24. Kirkland, N.T.; Schiller, T.; Medhekar, N.; Birbilis, N. Exploring graphene as a corrosion protection barrier. Corros. Sci. 2012, 56, 1–4. [Google Scholar] [CrossRef]
  25. Othman, N.H.; Ismail, M.C.; Mustapha, M.; Sallih, N.; Kee, K.E.; Jaal, R.A. Graphene-based polymer nanocomposites as barrier coatings for corrosion protection. Progr. Org. Coat. 2019, 135, 82–99. [Google Scholar] [CrossRef]
  26. Ramezanzadeh, B.; Niroumandrad, S.; Ahmadi, A.; Mahdavian, M.; Moghadam, M.M. Enhancement of barrier and corrosion protection performance of an epoxy coating through wet transfer of amino functionalized graphene oxide. Corros. Sci. 2016, 103, 283–304. [Google Scholar] [CrossRef]
  27. López-Oyama, A.B.; Domínguez-Crespo, M.A.; Torres-Huerta, A.M.; Onofre-Bustamante, E.; Gámez-Corrales, R.; Cayetano-Castro, N. Electrochemical alternative to obtain reduced graphene oxide by pulse potential: Effect of synthesis parameters and study of corrosion properties. Diam. Relat. Mater. 2018, 88, 167–188. [Google Scholar] [CrossRef]
  28. Zhang, H.H.; Liu, Y.W.; Bian, H.; Zhang, Y.; Yang, Z.N.; Zhang, Z.; Chen, Y. Electrodeposition of silane/reduced graphene oxide nanocomposite on AA2024-T3 alloy with enhanced corrosion protection, chemical and mechanical stability. J. Alloys Compd. 2022, 911, 165058. [Google Scholar] [CrossRef]
  29. Clavilier, J. The role of anion on the electrochemical behaviour of a {111} platinum surface; an unusual splitting of the voltammogram in the hydrogen region. J. Electroanal. Chem. 1979, 107, 211–216. [Google Scholar] [CrossRef]
  30. Hong, B.J.; Compton, O.C.; An, Z.; Eryazici, I.; Nguyen, S.T. Successful stabilization of graphene oxide in electrolyte solutions: Enhancement of biofunctionalization and cellular uptake. ACS Nano 2012, 6, 63–73. [Google Scholar] [CrossRef]
  31. Guo, H.L.; Wang, X.F.; Qian, Q.Y.; Wang, F.B.; Xia, X.H. A green approach to the synthesis of graphene nanosheets. ACS Nano 2009, 3, 2653–2659. [Google Scholar] [CrossRef]
  32. Chen, L.; Tang, Y.; Wang, K.; Liu, C.; Luo, S. Direct electrodeposition of reduced graphene oxide on glassy carbon electrode and its electrochemical application. Electrochem. Commun. 2011, 13, 133–137. [Google Scholar] [CrossRef]
  33. Bai, S.; Shen, X.; Zhu, G.; Yuan, A.; Zhang, J.; Ji, Z.; Qiu, D. The influence of wrinkling in reduced graphene oxide on their adsorption and catalytic properties. Carbon 2013, 60, 157–168. [Google Scholar] [CrossRef]
  34. Marcano, D.C.; Kosynkin, D.V.; Berlin, J.M.; Sinitskii, A.; Sun, Z.; Slesarev, A.; Alemany, L.B.; Lu, W.; Tour, J.M. Improved synthesis of graphene oxide. ACS Nano 2010, 4, 4806–4814. [Google Scholar] [CrossRef] [PubMed]
  35. Si, Y.; Samulski, E.T. Synthesis of water soluble graphene. Nano Lett. 2008, 8, 1679–1682. [Google Scholar] [CrossRef] [PubMed]
  36. Zhang, R.; Li, B.; Yang, Y.; Wu, N.; Sui, Z.; Ban, Q.; Wu, L.; Liu, W.; Liu, J.; Zeng, Z. Ultralight aerogel sphere composed of nanocellulose-derived carbon nanofiber and graphene for excellent electromagnetic wave absorption. Nano Res. 2023, 16, 7931–7940. [Google Scholar] [CrossRef]
  37. Garrote de Barros, N.; Cardoso Gonzaga Neto, A.; Bitencourt Vaccioli, K.; Vallejo Angulo, H.R.; Gondim de Andrade e Silva, L.; Toffoli, S.M.; Sanches Valera, T. Graphene Oxide: A Comparison of Reduction Methods. J. Carbon Res. 2023, 9, 73. [Google Scholar] [CrossRef]
  38. Khurshid, F.; Jeyavelan, M.; Sterlin Leo Hudson, M.; Nagarajan, S. Organic semiconductor/graphene oxide composites as a photo-anode for photo-electrochemical applications. RSC Adv. 2018, 8, 35959–35965. [Google Scholar] [CrossRef]
  39. An, S.; Zeng, Q.; Li, W.; Fortner, J. A graphene oxide Cookbook: Exploring chemical and colloidal properties as a function of synthesis parameters. J. Colloid Interface Sci. 2021, 588, 725–736. [Google Scholar] [CrossRef]
  40. Noell, P.J.; Schindelholz, E.J.; Melia, M.A. Revealing the growth kinetics of atmospheric corrosion pitting in aluminum via in situ microtomography. NPJ Mater. Degrad. 2020, 4, 32. [Google Scholar] [CrossRef]
  41. Energy Table for EDS Analysis. Available online: https://www.unamur.be/services/microscopie/sme-documents/Energy-20table-20for-20EDS-20analysis-1.pdf (accessed on 29 May 2023).
Figure 1. (a) Voltammograms of synthesis of RGO on Al Guefoam. Potential range: −0.63 V to −2 V, 48 scans, scan rate: 50 mV·s−1. Solution contained 3 g·L−1 GO and 0.1 M Na2SO4. (b) Voltammograms for Na2SO4 solution without RGO. Potential range: −2 V to 0 V, 10 scans, scan rate: 50 mV·s−1.
Coatings 14 00201 g001
Figure 2. Voltammograms of synthesis of RGO on Al Guefoam. Potential range: −1.45 V to −2 V, 96 scans, scan rate: 50 mV·s−1. Solution contained 3 g·L−1 GO and 0.1 M Na2SO4.
Coatings 14 00201 g002
Figure 3. Potentiostatic curve of electrochemical synthesis of RGO at −1.8 V and for −2.4 C.
Coatings 14 00201 g003
Figure 4. Micrographs of Al (a,d,g), Al + RGO (potentiostatic synthesis) (b,e,h) and, Al + RGO (potentiodynamic synthesis) (c,f,i). Magnification: ×200 (ac), ×2000 (df), ×10,000 (gi).
Coatings 14 00201 g004
Figure 5. Micrographs showing the determination of the RGO coating thickness on potentiodynamically synthesized sample using FIB-FESEM in zone 1 (a,b) and zone 2 (c,d).
Coatings 14 00201 g005
Figure 6. FTIR-ATR spectra of GO (a) and ERGO (b).
Coatings 14 00201 g006
Figure 7. (a) Nyquist plot for Al Guefoams without and with RGO coating (potentiostatic or potentiodynamic) after 28 days of exposure to 3.5% NaCl. (b) Electrical equivalent circuit.
Coatings 14 00201 g007
Figure 8. Icorr measurements for Al Guefoams without and with RGO coating (potentiostatic or potentiodynamic) after 1190 h subjected to steam generated by heating a 3.5% NaCl solution.
Coatings 14 00201 g008
Figure 9. Micrographs of Al (a,d,g), Al + RGO (potentiodynamic synthesis) (b,e,h), and Al + RGO (potentiostatic synthesis) (c,f,i) after 28 days of exposure to 3.5% NaCl solution. Magnification: ×200 (ac), ×2000 (df), ×10,000 (gi).
Coatings 14 00201 g009
Figure 10. Micrograph (a) and element map distribution for Al (b), O (c), and Cl (d) for the Al Guefoam after 28 days of exposure to 3.5% NaCl solution. Magnification: ×200, ×2000, ×10,000.
Coatings 14 00201 g010
Figure 11. EDX analyses of Al, Al + RGO (potentiodynamic synthesis), and Al + RGO (potentiostatic synthesis) after 28 days of exposure to 3.5% NaCl solution.
Coatings 14 00201 g011
Figure 12. Adsorption–desorption isotherms using nitrogen at −196 °C (a); specific surface area (BET) values derived from the nitrogen desorption isotherms (b); and pore size distributions calculated from the nitrogen desorption isotherms using the NLDFT method (c).
Coatings 14 00201 g012
Table 1. Results of measurements after corrosion for Al Guefoams in saline solution, 3.5% NaCl.
Bare Al PotentiostaticPotentiodynamic
Time (h)RP (Ω·cm2)icorr (µA·cm−2)RP (Ω·cm2)
Calculated by Impedance
RP (Ω·cm2)icorr (µA·cm−2)RP (Ω·cm2)
Calculated by Impedance
RP (Ω·cm2)icorr (µA·cm−2)RP (Ω·cm2)
Calculated by Impedance
049560.91313813674.61130786800.517565
2469820.64685118563.40232912,7230.357174
489524.7277967320.94433765300.677225
7211753.83122722,6610.28380759450.746953
9617542.56123831931.97600577930.566613
16813593.31140814144.46232472680.606256
21615092.98124874,4260.08237110,1290.436579
33613593.3112177858.03239255830.796460
50415182.96113915044.19229257360.775916
67214593.08123912145.19226253140.835374
Table 2. Results of measurements after corrosion for Al Guefoams subjected to steam generated by heating a 3.5% NaCl solution.
Bare Al PotentiostaticPotentiodynamic
Time (h)RP (Ω·cm2)Icorr (µA·cm−2)RP (Ω·cm2)
Calculated by Impedance
RP (Ω·cm2)Icorr (µA·cm−2)RP (Ω·cm2)
Calculated by Impedance
RP (Ω·cm2)Icorr (µA·cm−2)RP (Ω·cm2) Calculated by Impedance
049560.91313813674.61130786800.517565
7029,1810.1522,757106,6560.0620,548120,1870.0452,895
140144,0840.034390259,9200.0213,66860,9820.0780,413
21018,4380.24252,85835701.7726,4481,152,668<0.01141,236
28040,2980.1154,14824,5110.2628,088259,6920.02758,574
35015902.83478835451.78395540551.0817,131
42049,7520.09847452,2350.1280,64190800.4841,346
49050780.8988,614118,4560.0539,956189,5300.0238,134
560123,5820.04265,15918413.427071123,8550.04119,139
63024811.81493020,5540.3184,969182,2350.02156,499
70056180.80968222,2400.28111,394109,2070.0479,958
770104,9700.04168,100518,2450.01209,2621,993,478<0.01808,269
84062,5310.0785,42526,3560.2411,777359,0130.01389,538
91053530.84612124,7620.2520,18361370.7210,615
98014,6290.3114,55668,4990.0982,236302,0630.01213,676
105031,0260.1431,52852,9860.1233,71465,2870.0777,680
1120155,5870.03156,499179,5980.04267,6651,822,628<0.011,264,290
119037,5190.1261,734108,2510.06116,178130,6430.03107,066
Table 3. Aluminum concentration in the 3.5% NaCl solutions in contact with the Guefoams after 28 days of exposure.
Aluminum Concentration (mg·L−1)
Bare Al145
Al + RGO (potentiostatic)70
Al + RGO (potentiodynamic)35
Disclaimer/Publisher’s Note: The statements, opinions and data contained in all publications are solely those of the individual author(s) and contributor(s) and not of MDPI and/or the editor(s). MDPI and/or the editor(s) disclaim responsibility for any injury to people or property resulting from any ideas, methods, instructions or products referred to in the content.

