Article

Microstructure, Hardness and Corrosion Resistance of Al-TiC MMC Prepared by Laser Cladding on AZ31B Magnesium Alloy

1
School of Mechanical Engineering, Guangxi University, Nanning 530004, China
2
Second Institute of China Aerospace Science and Technology Corporation, Beijing Institute of Radio Measurement, Beijing 100854, China
*
Author to whom correspondence should be addressed.
Coatings 2024, 14(2), 211; https://doi.org/10.3390/coatings14020211
Submission received: 11 January 2024 / Revised: 31 January 2024 / Accepted: 4 February 2024 / Published: 6 February 2024
(This article belongs to the Section Corrosion, Wear and Erosion)

Abstract

:
Magnesium alloy is extensively used in aircraft, automobiles, and electronic industries due to its low density, high specific strength, and enhanced machinability. However, low hardness and poor corrosion resistance limit its application. In this work, an Al-TiC metal matrix composite (MMC) was prepared on AZ31B magnesium alloy via laser cladding. The effects of laser power and TiC content on the microstructure, hardness, and corrosion resistance of the MMC were investigated. The results showed that the MMC with 10% TiC had a hardness of 184 HV0.1, which was 3.5 times higher than 52 HV0.1 of the substrate. The current density of MMC with 10% TiC was 3.90 × 10⁻⁷ A/cm2, which was three orders of magnitude lower than 5.45 × 10⁻⁴ A/cm2 of the substrate. Due to more intermetallic compounds (IMCs) and TiC particles, the MMC with 30% TiC had higher hardness. The increased laser power would not change the phase composition, but it contributed to the formation of a concave crescent shape, promoted the diffusion of Mg, and induced the formation of a thicker Al3Mg2 transition layer. Modifications in the TiC concentration markedly influenced the coating’s microstructural characteristics.

1. Introduction

Magnesium (Mg) alloy has many advantages, such as low density, good castability, and excellent electromagnetic shielding and damping capacities, so it is widely used in the fields of aerospace, automobile, and electronic industries [1]. In practical applications, the utilization of Mg alloys is restricted due to inadequate hardness and poor corrosion resistance, thereby limiting their potential for structural usage in corrosive environments [2,3]. Addressing this challenge requires the adoption of suitable methods to enhance the application prospects of Mg alloy across various industries [4]. Diverse techniques in surface engineering have been utilized to augment the surface attributes of magnesium alloys, such as plasma electrolytic oxidation (PEO) [5], physical vapor deposition (PVD) [6], micro-arc oxidation (MAO) [7], thermal spray (TS) [8], laser cladding [9], and so on. Within these methods, laser cladding is distinguished by its exceptional precision, versatility in application, capacity for precise thickness control of coatings, and benefit of rapid processing duration [10]. Reports in recent times have identified it as a successful strategy for the enhancement of surface hardness in magnesium alloys [11,12].
Although there are many coating materials used for the laser cladding of Mg alloys, the metal matrix composite (MMC) is one of the most advanced materials with great potential to be used as coating materials that require high hardness, corrosion resistance, and strength [13].
Aluminum (Al) is extensively utilized as a matrix in laser cladding to create an MMC coating on Mg alloy, because it has similar physical and chemical properties to Mg, such as a similar melting point and coefficient of thermal expansion [14]. It can establish better bonding with the Mg substrate [14,15]. Furthermore, the addition of Al on Mg alloy can increase the electrode potential to improve the corrosion resistance of the coating. The formation of Mg-Al intermetallic compounds (IMCs) can improve the surface hardness of Mg alloys [16]. TiC has high hardness, wear resistance, and excellent thermal stability, making it an ideal particle-reinforced phase for enhancing the surface properties of Mg alloys [17].
The Al-TiC MMC is an ideal coating material on the surface of magnesium alloy to enhance the surface hardness and corrosion resistance [18]. The in situ Al-TiC MMC was laser cladded on AZ91D magnesium alloy, and the results showed that the corrosion current density of the coating is two orders of magnitude lower than that of the AZ91D magnesium alloy [19]. The surface microhardness and self-corrosion potential of the AZ31B magnesium matrix composite were significantly enhanced by preparing an Al-Ti-TiC-CNT coating using laser cladding and a high-speed friction stir processing [20]. However, the effect of process parameters on the microstructure evolution of Al-TiC MMC coating has not been clearly revealed. The effect of the TiC content on the hardness and corrosion resistance of the MMC needs to be analyzed. Furthermore, it has been found that the size of reinforced particles has a great influence on the porosity of the MMC and the interfacial bonding between the reinforced particles and the matrix [21]. The densification and microhardness of the composites increased markedly as the particle size decreased [22]. Particularly, in instances where reinforcement materials are scaled down to the nanometer range, it is inevitable that agglomeration occurs. This phenomenon can be primarily attributed to the substantial increase in specific surface area, as well as the influence of van der Waals forces at this scale [23]. Based on the above research, the TiC particles with an average size range of 2–4 μm were selected as the reinforced particles in this work.
In this work, the Al-TiC MMC coating was prepared on an AZ31B magnesium alloy via laser cladding, using pure Al powder as the matrix phase and TiC particles as the reinforced phase. The effects of laser power and TiC content on the macroscopic morphology, microstructure, hardness, and corrosion resistance of Al-TiC MMC coating were analyzed. The microstructural evolution of Al-TiC MMC with different laser power levels and TiC content is analyzed. This will support further process optimization and practical engineering applications of magnesium alloys to improve the surface performance.

2. Materials and Methods

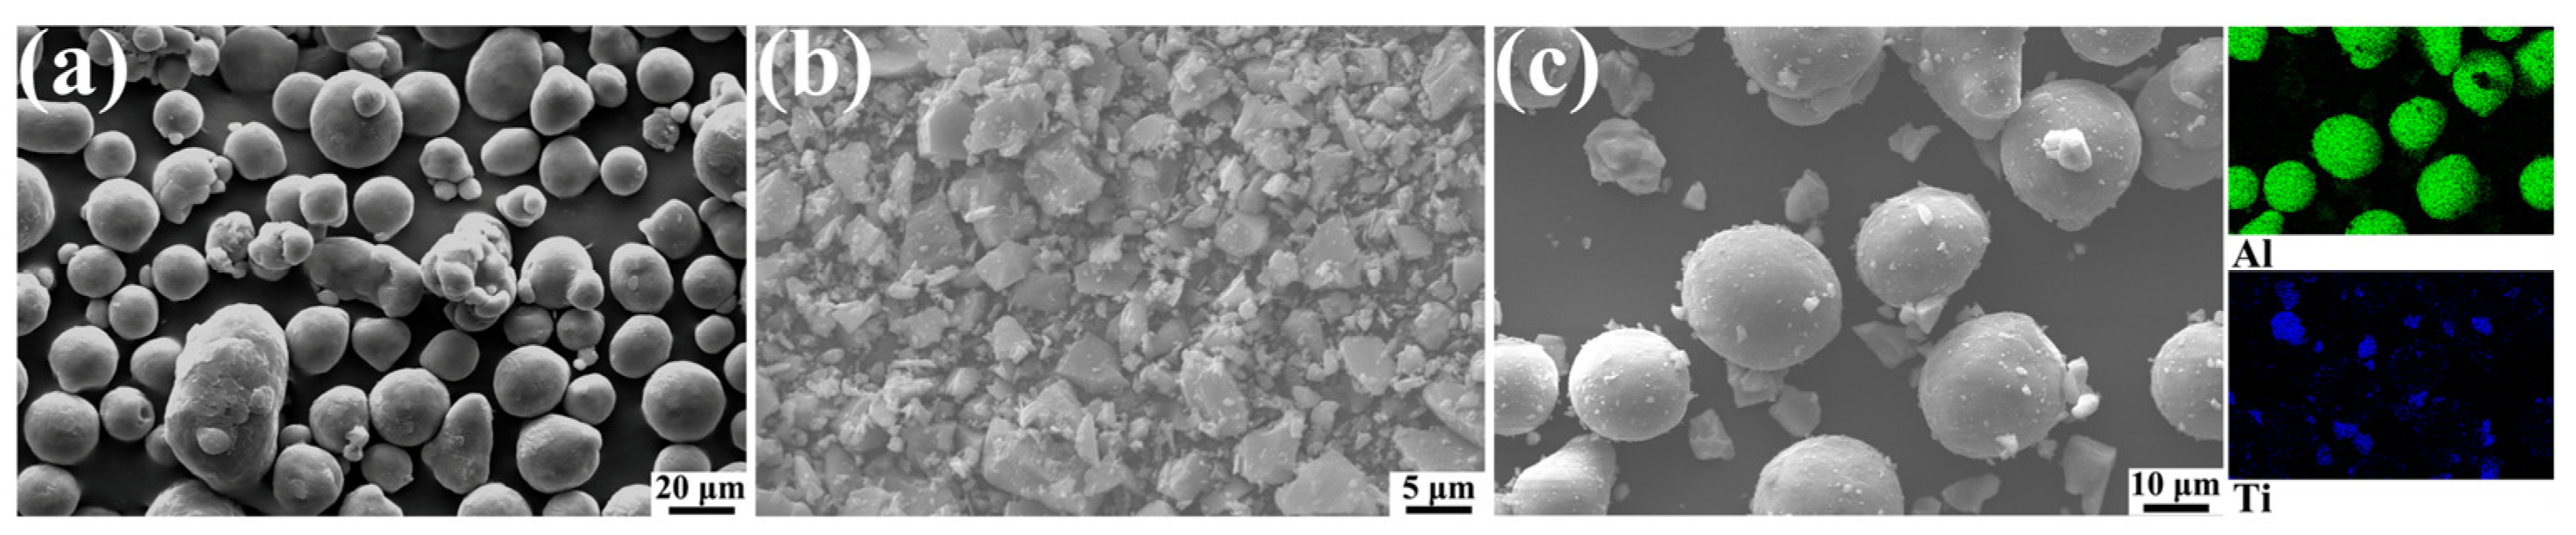
2.1. Experimental Materials

An AZ31B magnesium alloy with dimensions of 80 mm × 80 mm × 8 mm was used as the substrate. The chemical composition of the alloy is provided in Table 1. Pure Al powder (≥99.9%, diameter 15–53 µm, manufacturer datasheet) and TiC particles (≥99.9%, diameter 2–4 µm, manufacturer datasheet) were used as the MMC materials. The materials were mixed together with a TiC content of 10 wt% and 30 wt% and mechanically blended using a planetary ball mill for a duration of 6 h. The microscopic images of powders are shown in Figure 1.

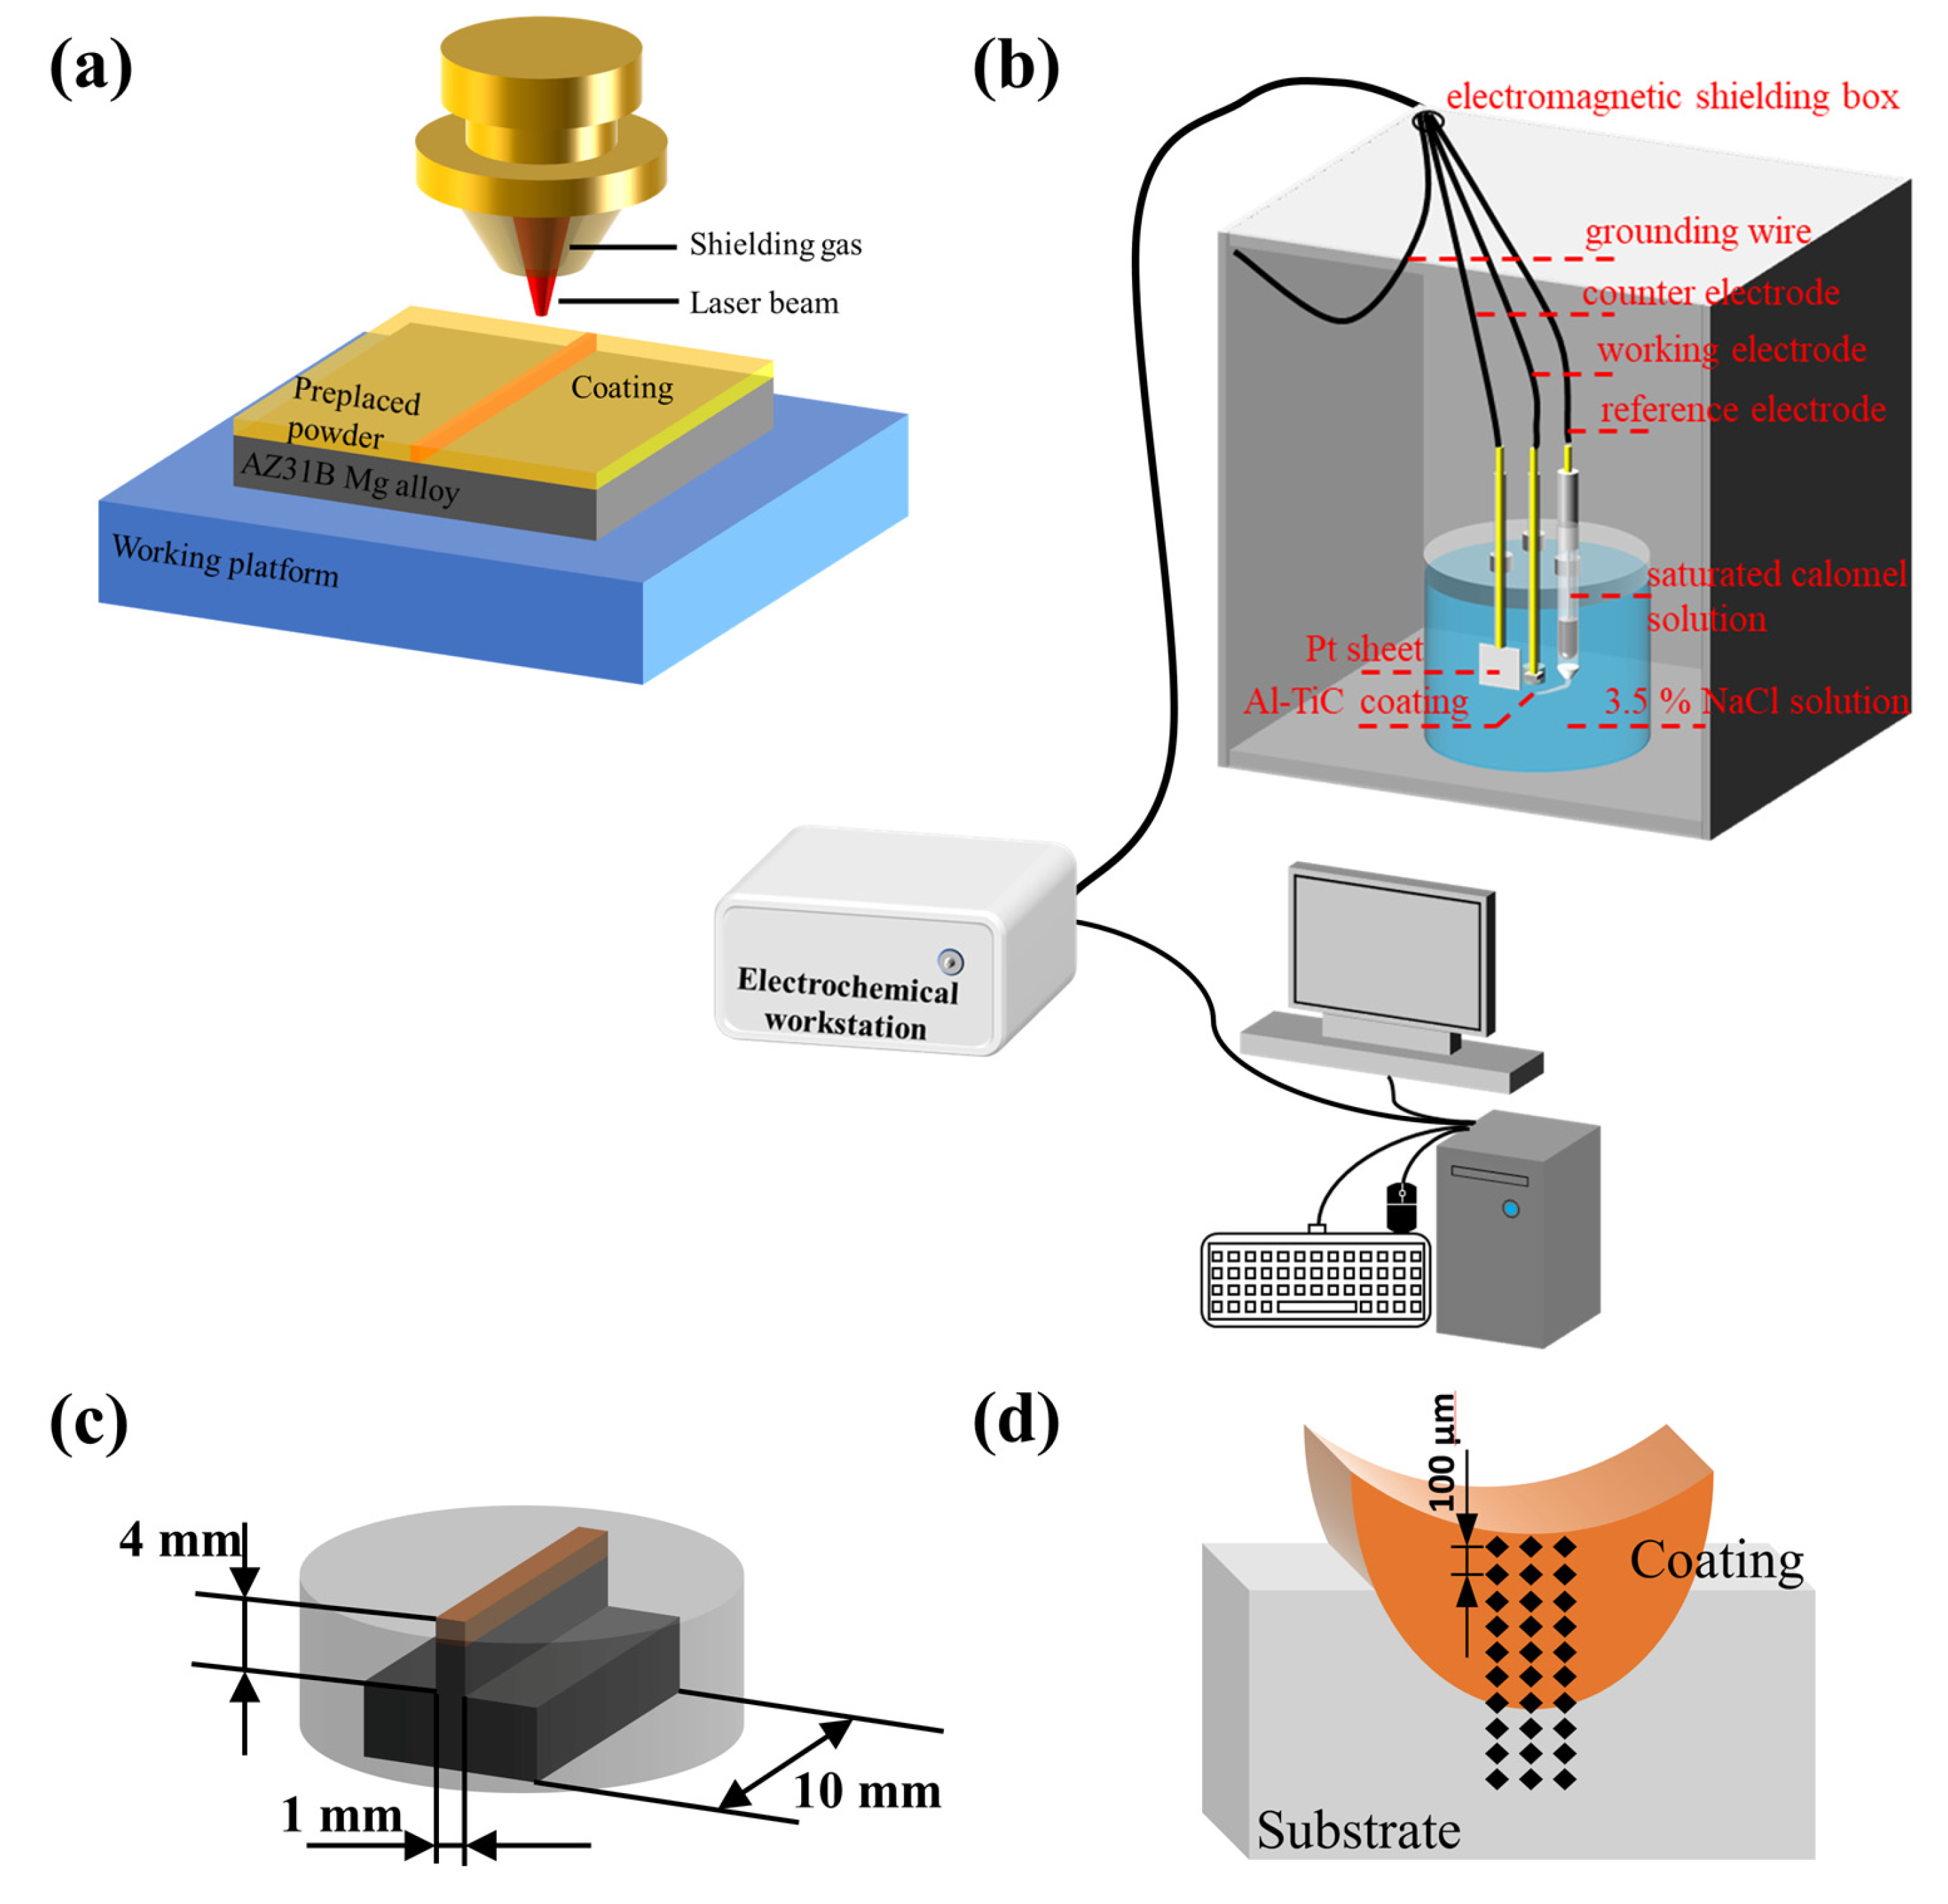
2.2. Experimental Equipment and Process Preparation

Before the laser cladding process, the AZ31B magnesium alloy needs to undergo pretreatment. The surface of the AZ31B magnesium alloy was polished using 500# metallographic sandpaper to remove surface oxides. The substrate underwent ultrasonic cleaning using anhydrous ethanol, followed by a drying process within an oven at 40 °C for a duration of 30 min. Thermal conductive tape with a thickness of 0.5 mm was applied to both sides of the AZ31B magnesium alloy substrate. Al-TiC powder was mixed with polyvinyl alcohol (PVA) to form a paste and uniformly applied to the substrate. The paste was then spread with a ceramic rod and compacted to make it dense. The excess paste above the height of the thermal conductive tape was scraped off with a ceramic blade to ensure that the thickness of paste was very close to 0.5 mm. It was placed in a vacuum drying oven and then dried under vacuum conditions at a temperature of 60 °C for a duration of 4 h.
A schematic illustration of the laser cladding process is shown in Figure 2a. A semiconductor laser machine was used to fabricate an Al-TiC MMC coating on an AZ31B magnesium alloy. The laser generator is an RFL-A3000D (Wuhan, China) fiber laser with a maximum laser power of 3 kW, a laser wavelength of 915 nm, a spot diameter of 1.8 mm, and a focal length of 300 mm.
The process parameters for the preparation of single-track Al-TiC MMC with 10% TiC and 30% TiC via laser cladding were as follows: laser power of 1500 W, 1700 W, 1900 W, 2100 W, and 2300 W; scan speed of 10 mm/s; and the use of argon gas with a purity of 99.99% to prevent oxidation of the coating during the laser cladding process.

2.3. Microstructure Characterization

The coating samples were sliced using electrical discharge machining to obtain cross-sectional slices. A standard metallographic preparation procedure was carried out on the sample sections. To expose the microstructure of the coating, samples were etched using Keller’s Reagent (2.5 mL HNO3, 1.5 mL HCl, 1 mL HF, and 95 mL deionized water) with a corrosion time of 40 s. After the etching process, the microstructures of the samples were examined using an optical microscope (Keyence VHX-7000, Shanghai, China). The scanning electron microscope (SEM, EVO 10, Zeiss, Oberkochen, Germany) with energy dispersive spectroscopy (EDS, X-Flash 630 detector, Bruker, Billerica, MA, USA) and X-ray diffractometer (XRD, D8 Discover, Bruker, Billerica, MA, USA) were utilized for an additional analysis of the microstructure.

2.4. Microhardness and Corrosion Properties

The HVS-1000 A Vickers (Shandong, China) microhardness tester was used to measure the microhardness of the coating cross-section from the surface to inner substrate, using a 100 g load and 15 s dwell time with a test pitch of 100 µm, as shown in Figure 2d. The electrochemical corrosion testing was carried out in a 3.5 wt% NaCl solution, using three-electrode cells (Interface 1010), as shown in Figure 2b. Experiments are conducted in an electromagnetically shielded box to ensure the precision and reliability of experimental data and signals. The reference electrode is a saturated calomel electrode, the auxiliary electrode is a Pt sheet, and the working electrode is Al-TiC MMC and AZ31B magnesium alloy. Due to the limited fusion width and depth of the MMC, there was a risk of exposing the substrate when grinding the surface of the coating. To avoid this, a section of coating was left intact, with the bottom part maintained at 0.5 mm on both sides. A perpendicular cut was then made 4 mm below the lowest point of the coating, as shown in Figure 2c. The surplus coating was then removed parallel to the substrate surface, leaving a 1 mm × 10 mm coating surface for electrochemical corrosion testing. The specimen was immersed in a 3.5 wt% NaCl solution until an open-circuit potential (OCP) was reached for testing. The potentiodynamic polarization curves were measured with a potential variation range of −0.6 V to + 0.6 V (vs. OCP) at a scan rate of 1 mV/s.

3. Results and Discussion

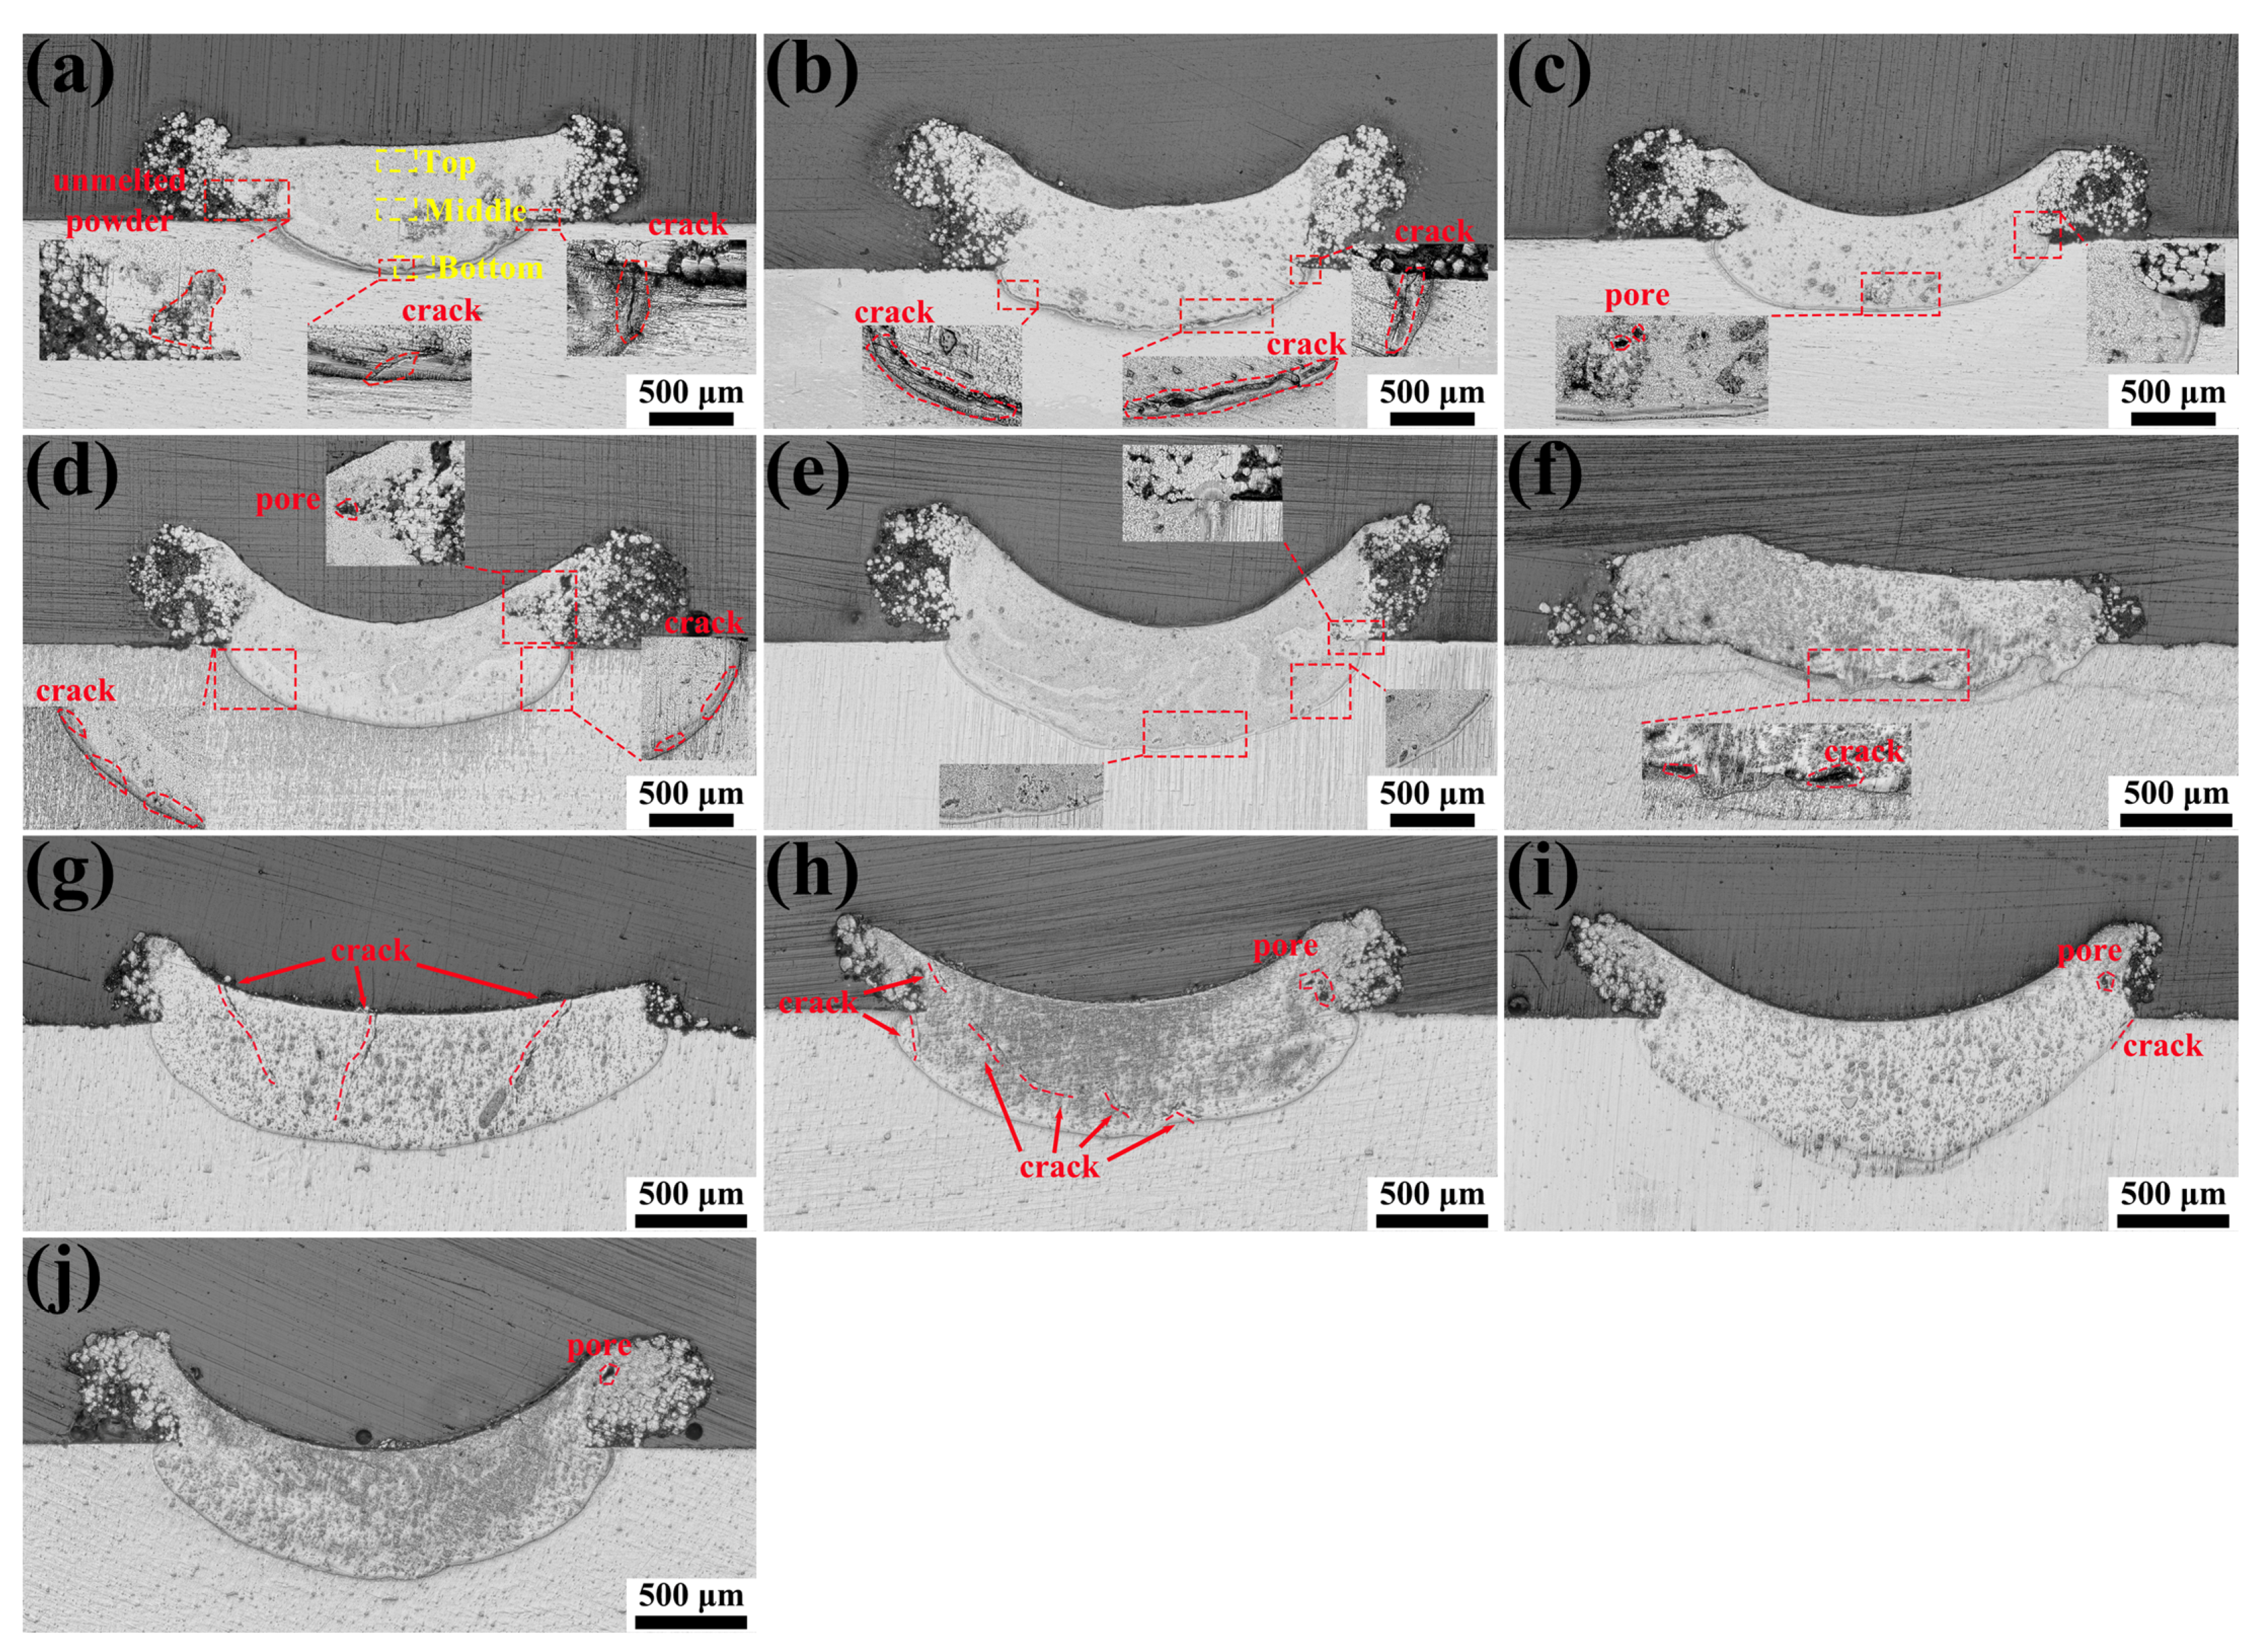
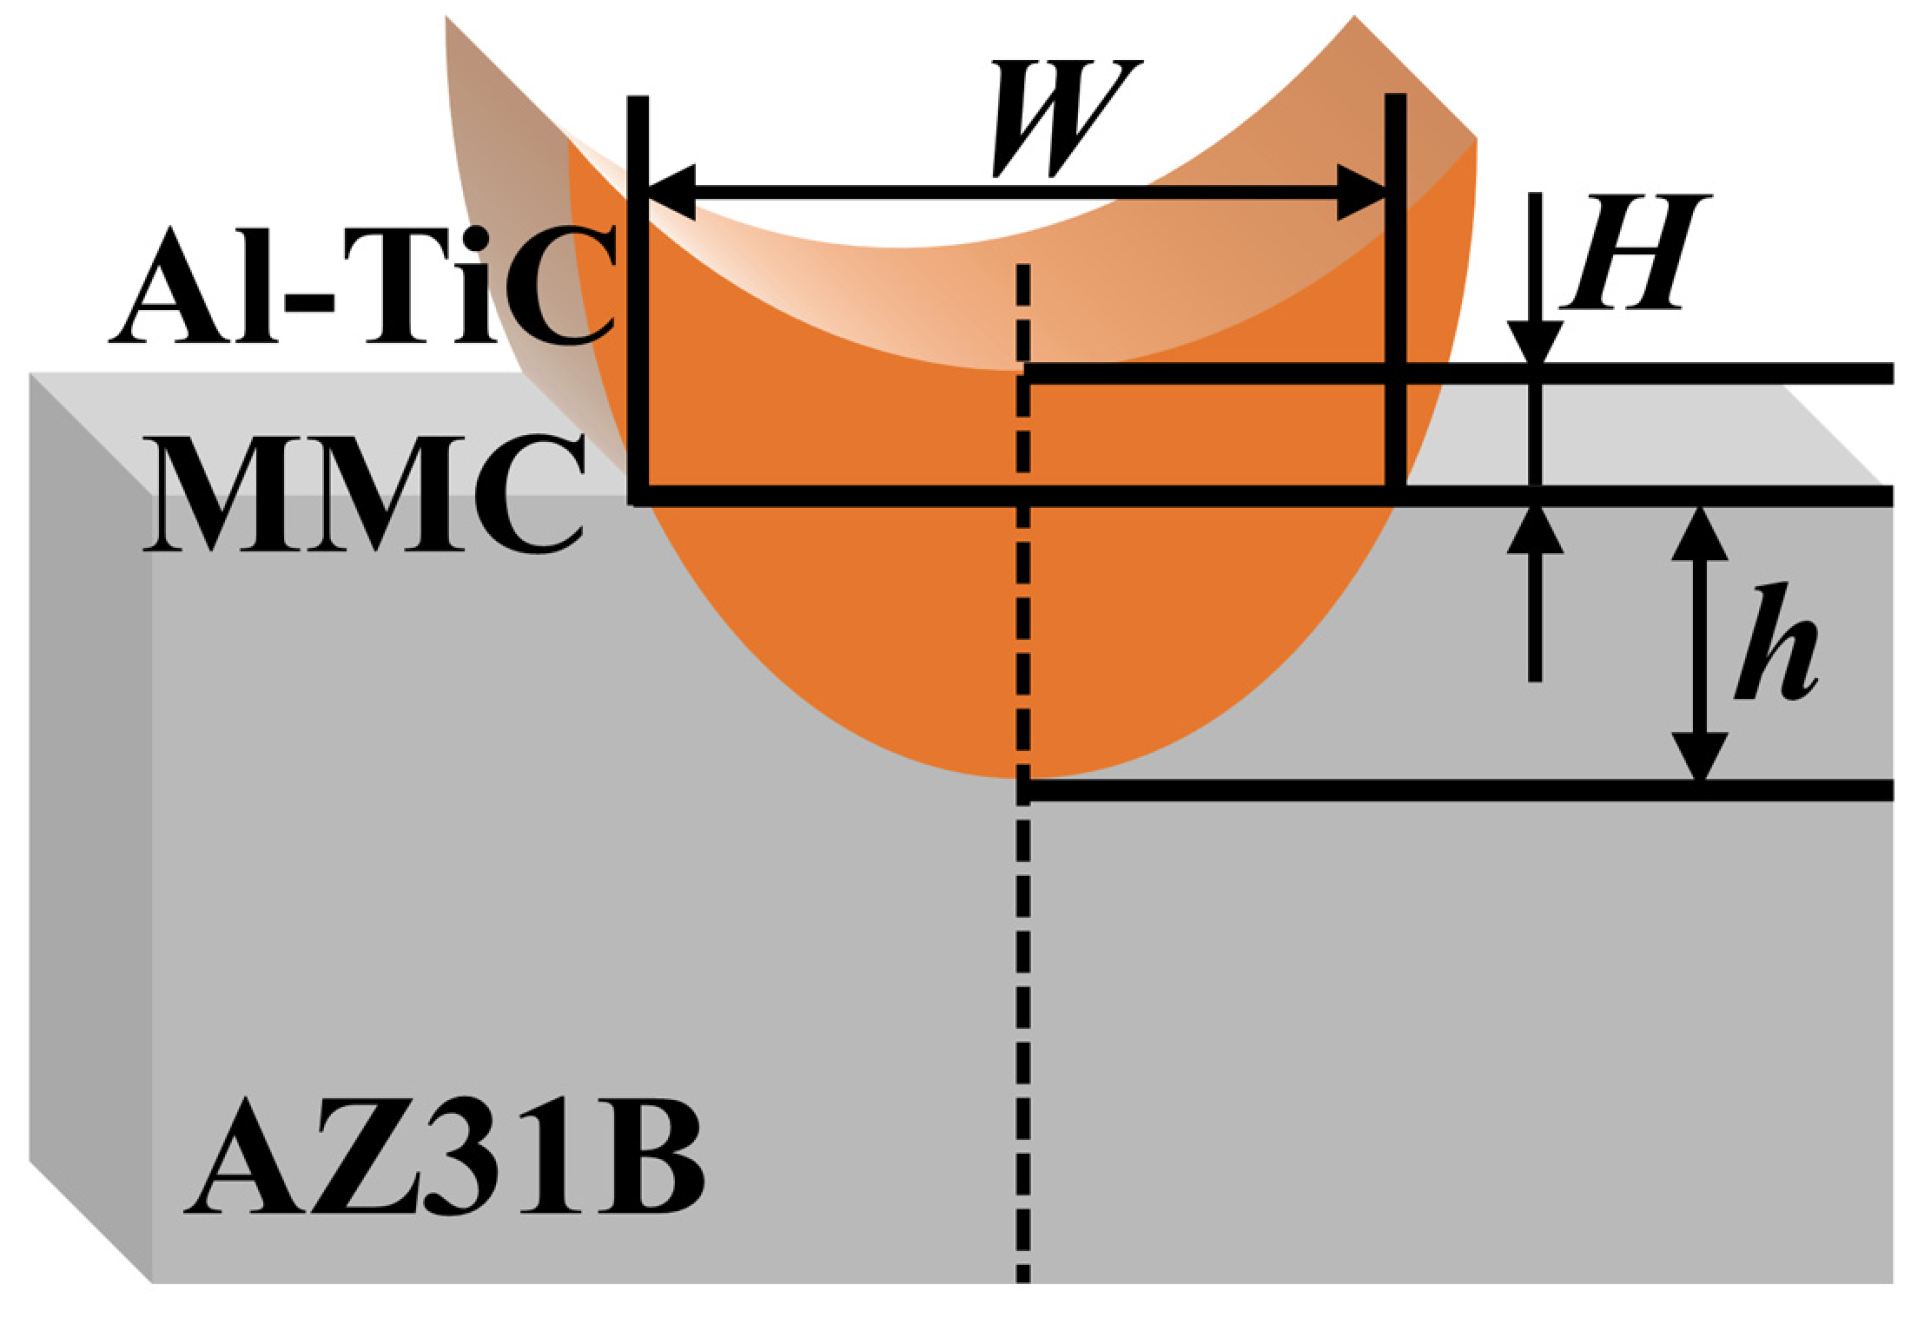
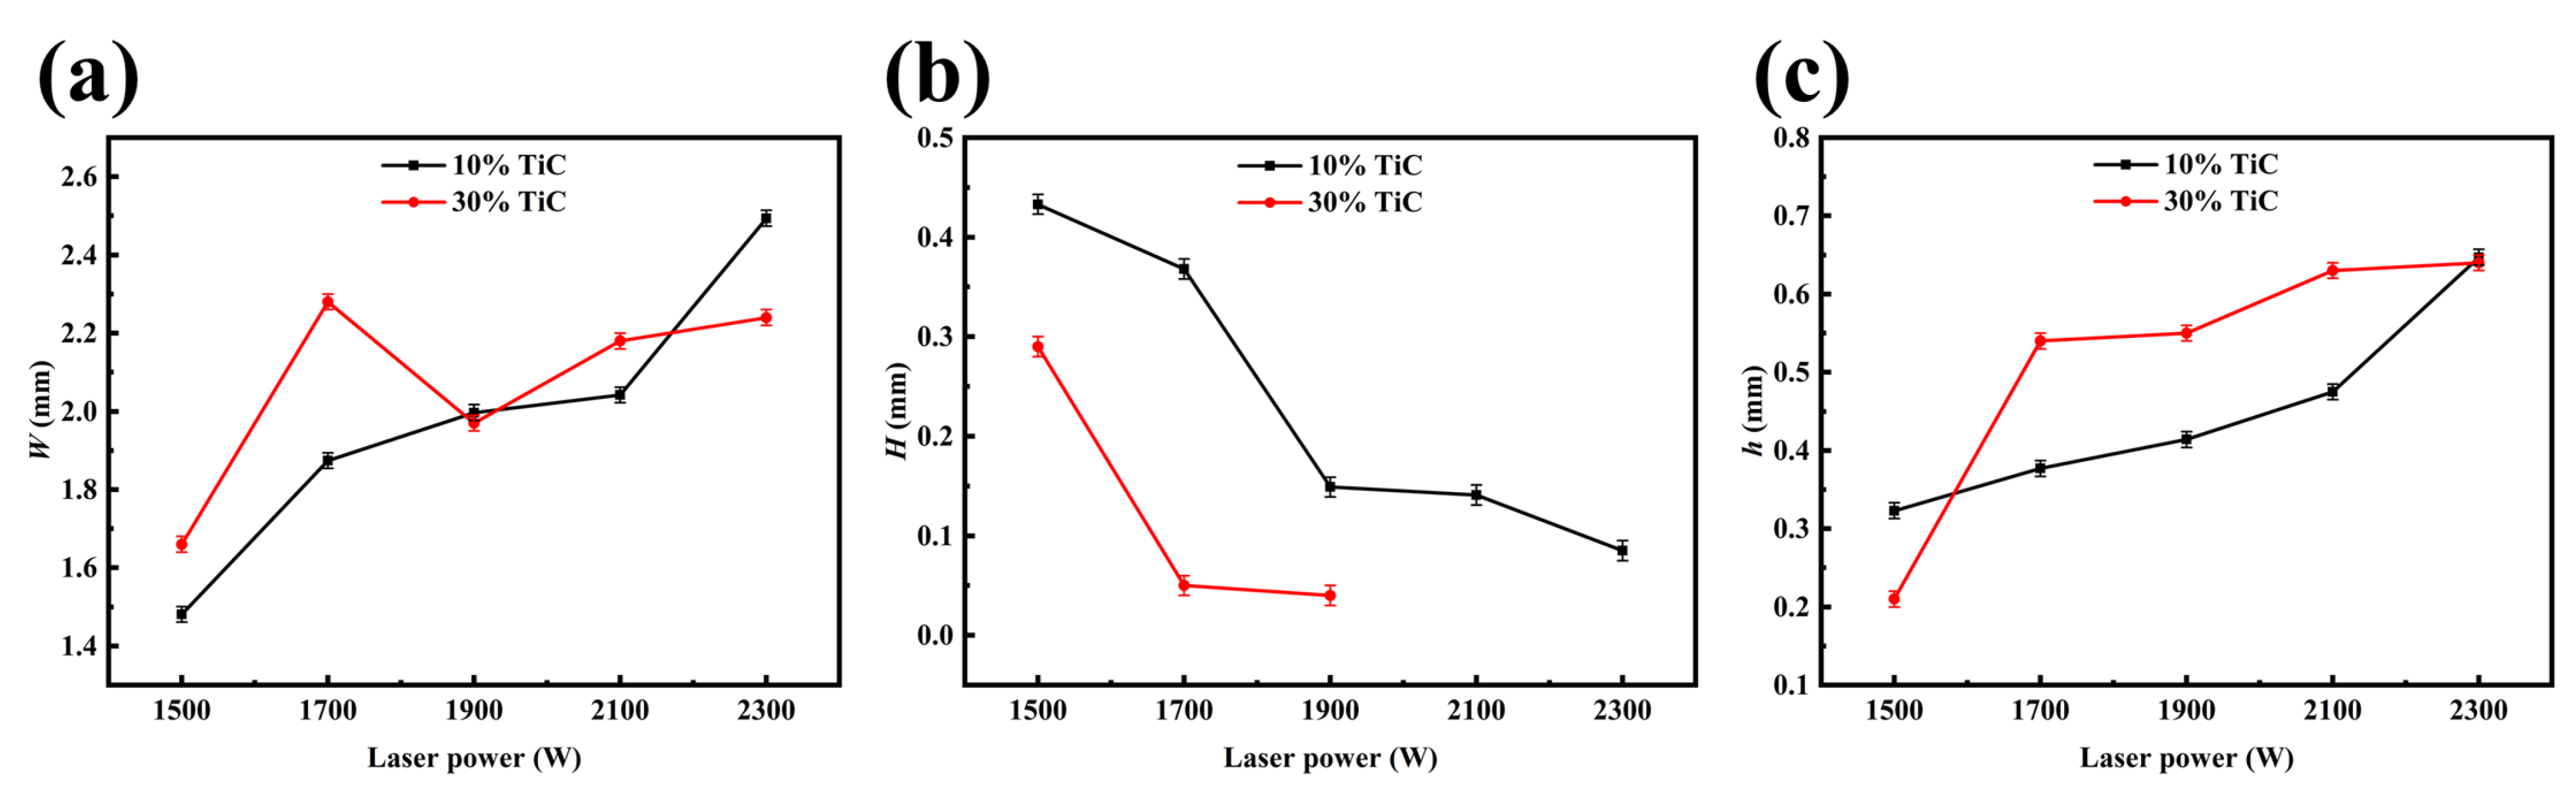
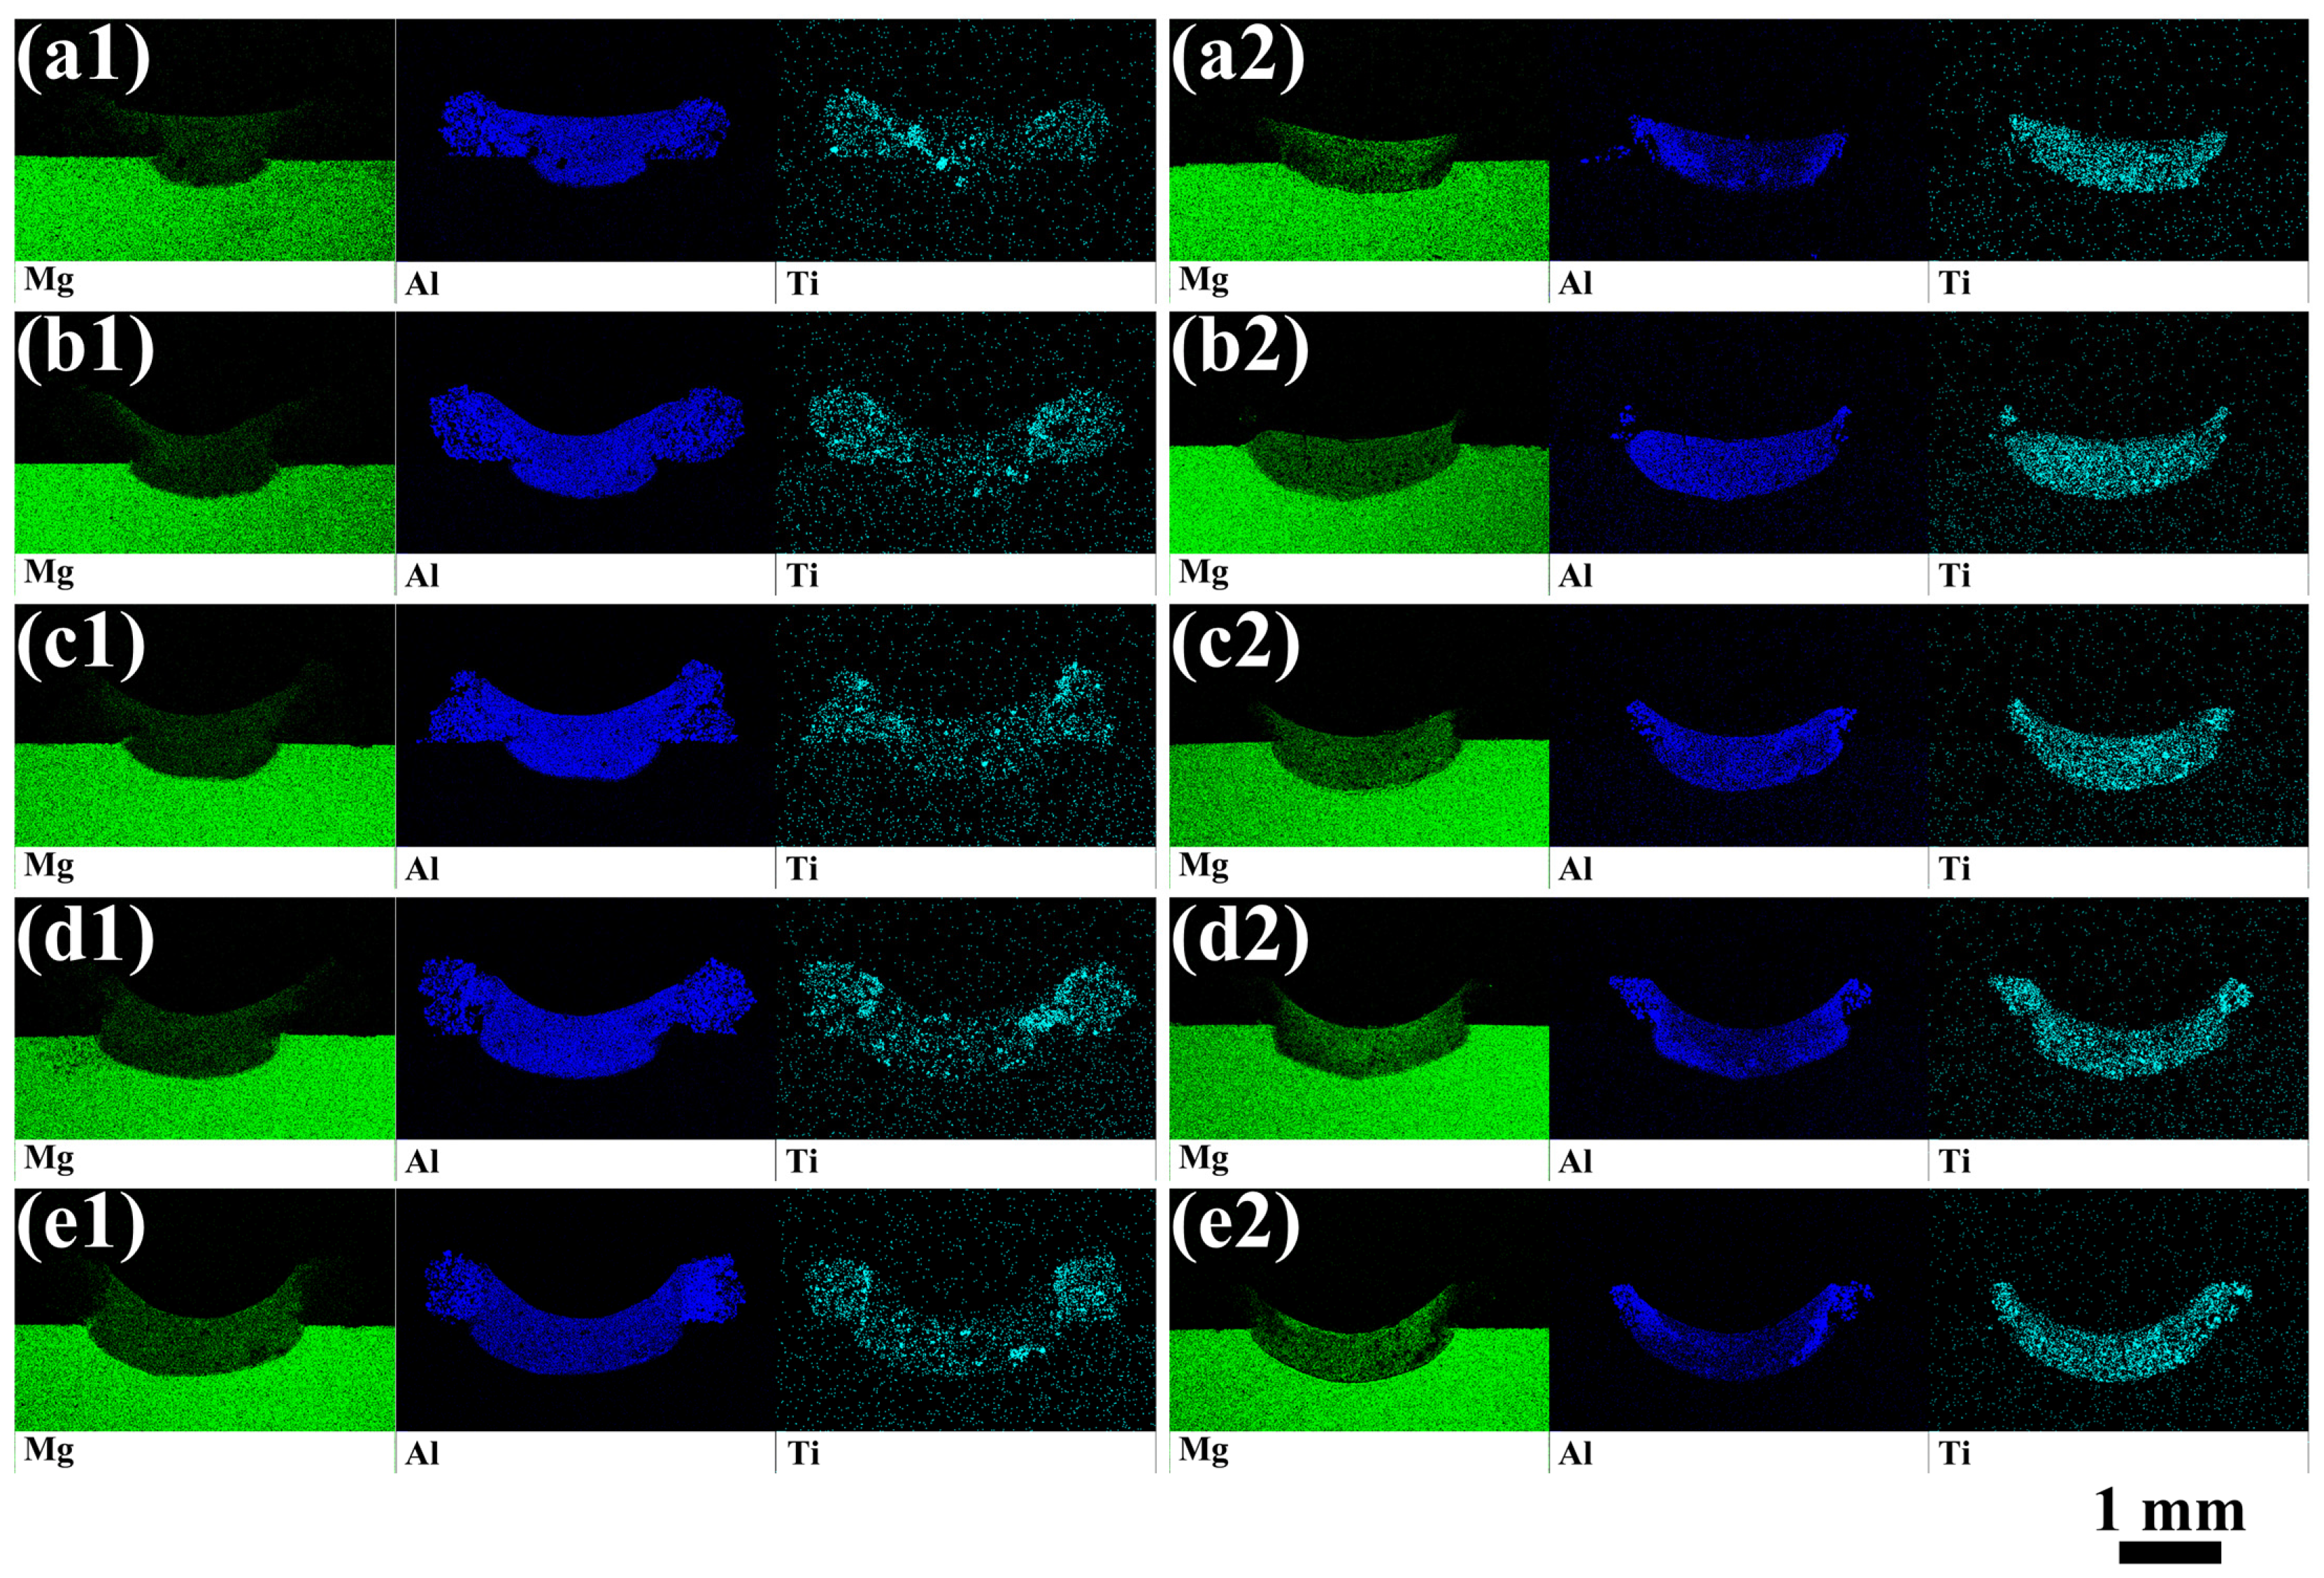
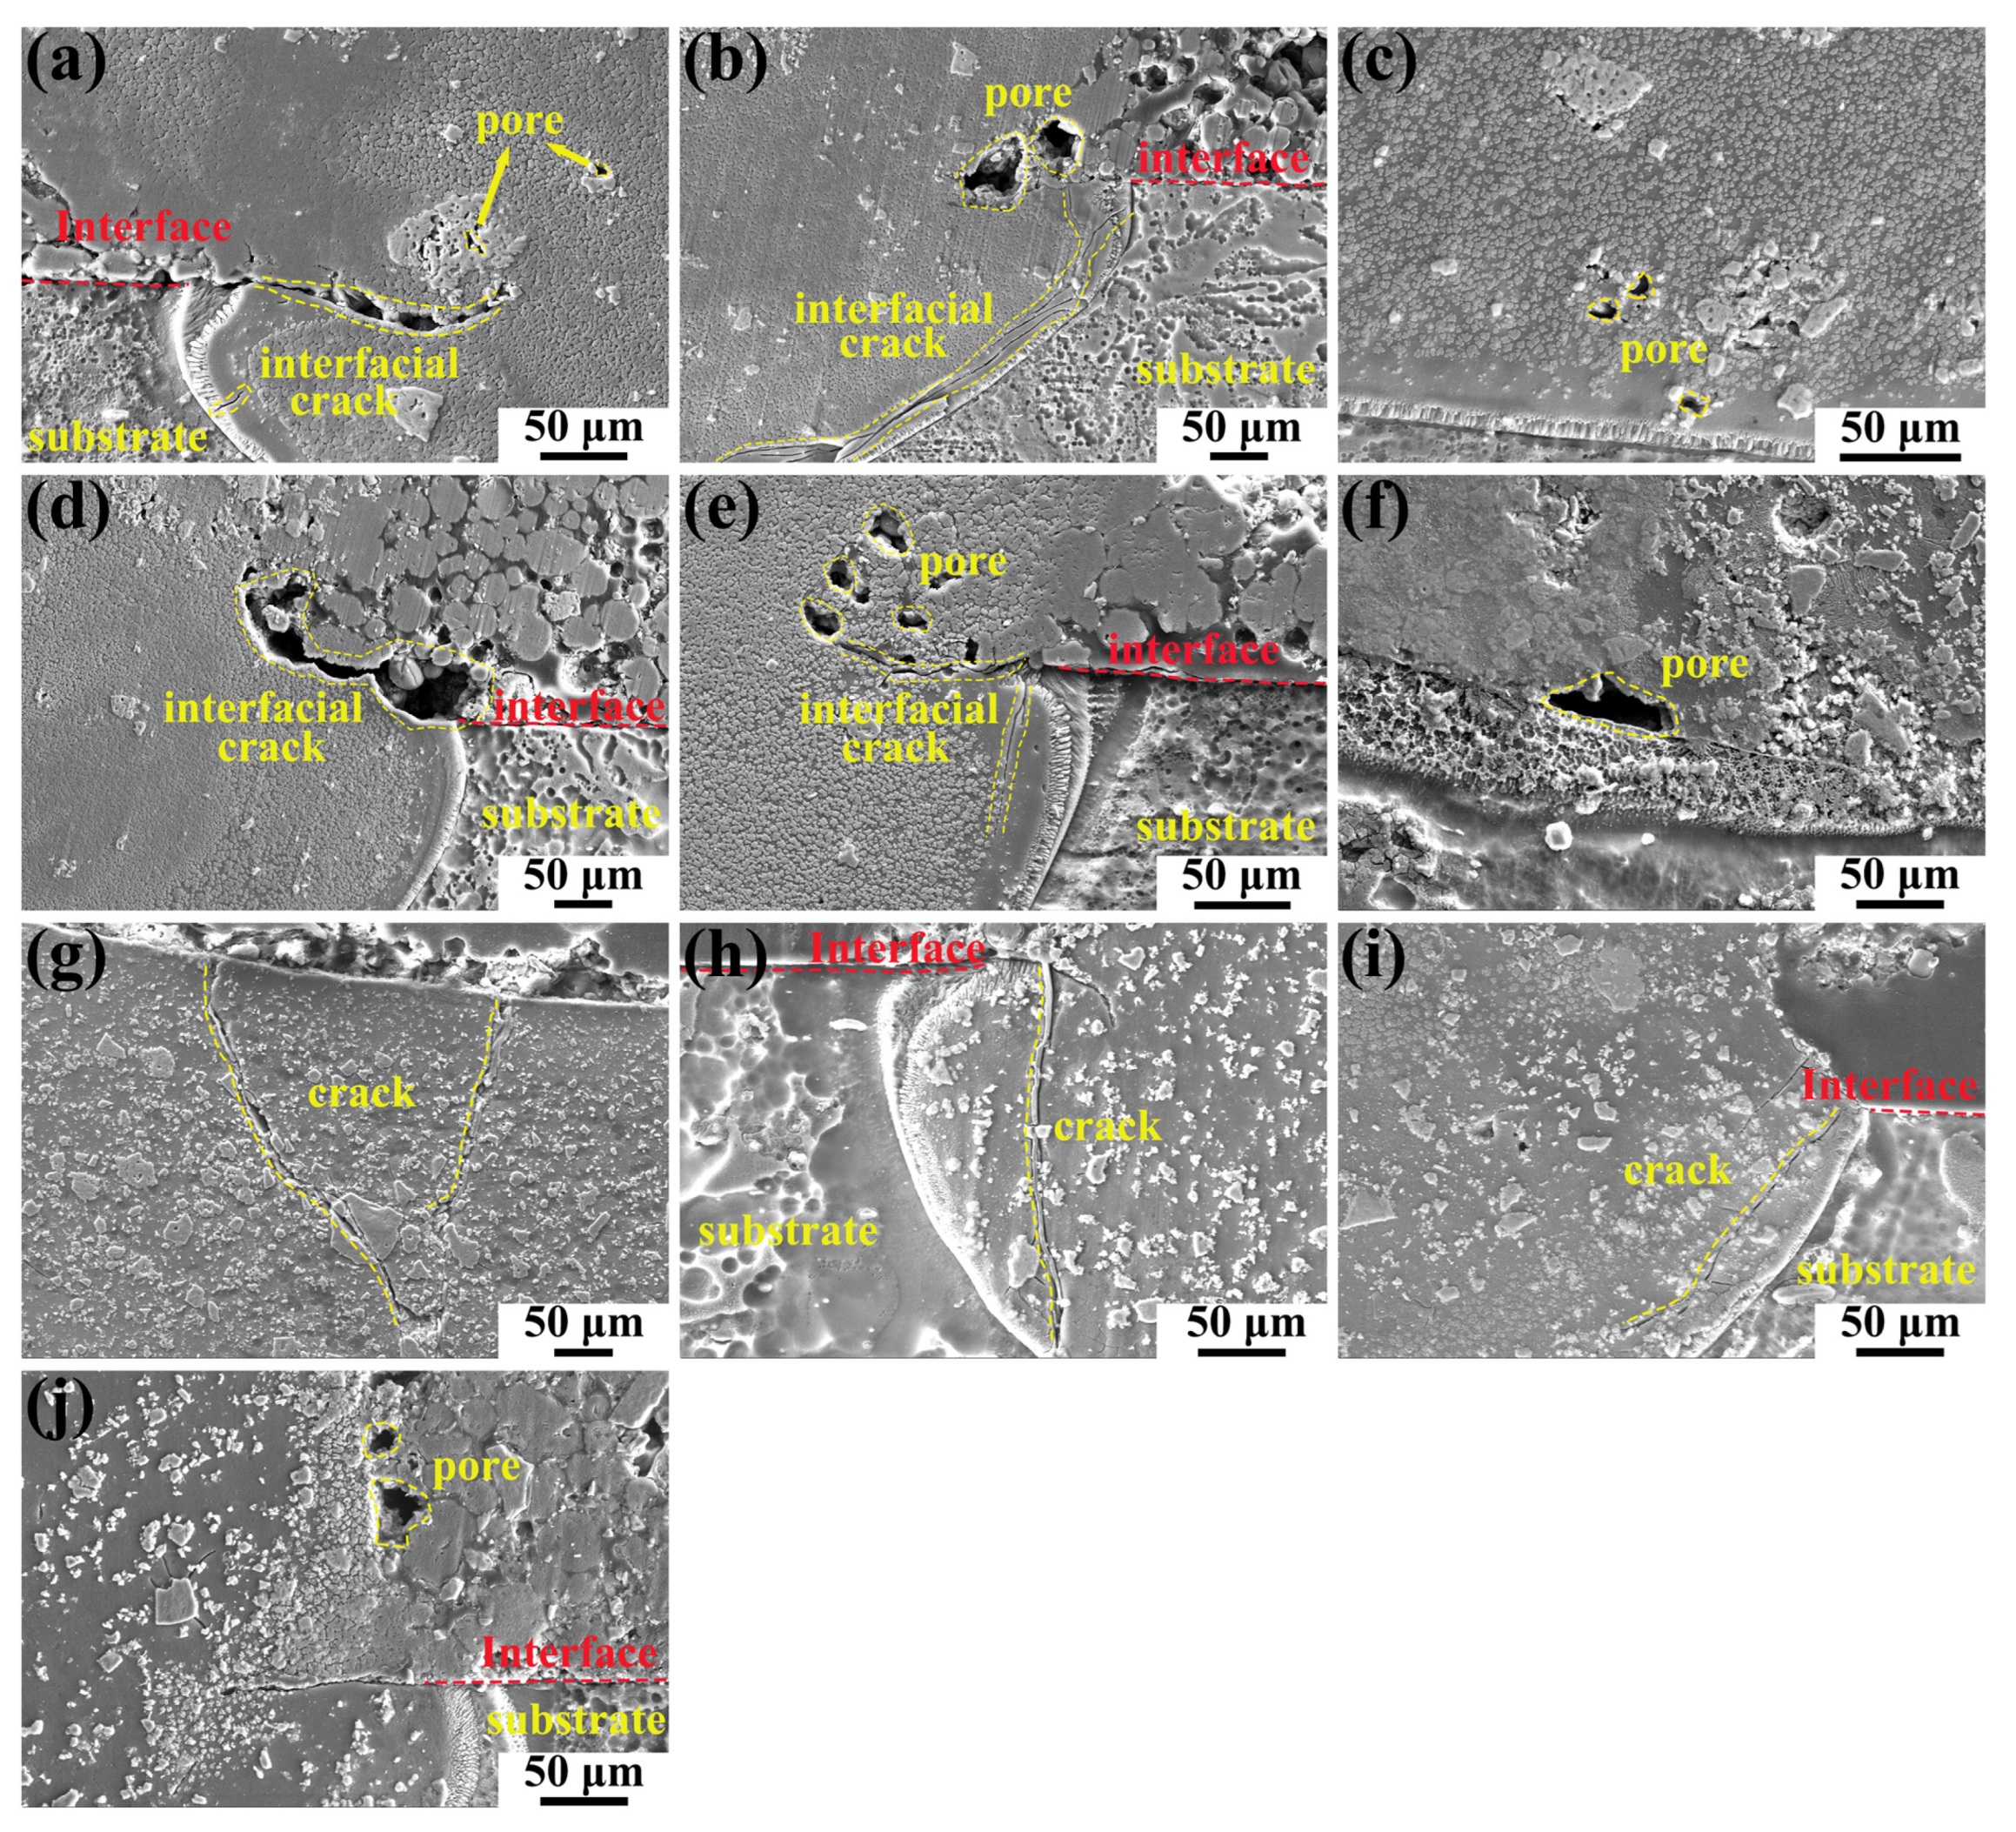
3.1. Cross-Sectional Morphology of Single-Track Coating

Cross-sectional macrographs of single-track coating with different laser power levels are shown in Figure 3. The quality of the coating at different laser power levels can be initially assessed based on the presence of cracks and pores in the coating and the bonding of the coating to the substrate. It clearly shows a well-defined boundary between the coating and substrate, indicating a strong metallurgical bond between the two. In the case of the MMC with 10% TiC, at the laser power of 1500 W, the heat input is low and just enough to melt the powder and melt a small area of the substrate, as shown in Figure 3a. Some unmolten powder particles are found at the edges of the coating. As the laser power increases, the phenomenon of unmolten powder in the molten pool is significantly improved. At the laser power of 1900 W, no unmolten powder is observed in the molten pool, as shown in Figure 3c. Furthermore, cracks are found between the coating and substrate bond, as shown in Figure 3b,d. In the case of the MMC with 30% TiC, cracks nucleate at the surface of the coating and grow to the substrate [24], as shown in Figure 3g.
The schematic diagram of the coating is shown in Figure 4, and the results of the coating width (W), height (H), and depth (h) of each sample are shown in Figure 5. The values of W, H, and h were measured three times. In the case of the MMC with 10% TiC, the minimum value of W is 1.48 mm when the laser power is 1500 W, as shown in Figure 5a. As the laser power increases, the value of W also increases. At 2300 W, W reaches its maximum value of 2.49 mm. It can be found that the trend of h is the same as that of W, while the trend of H is opposite to that of W, as shown in Figure 5b,c. With the other parameters kept constant, the laser power of 1500 W provides the lowest energy input per unit time, which minimizes the molten area of the substrate, resulting in smaller values for W and h. H is minimally affected, and therefore larger coating height values can be obtained. As the laser power increases, the heat input increases, and the melting region of the substrate increases significantly. W and h increase significantly, while H decreases, resulting in a concave crescent shape. It can be seen that the trends of W, H, and h with laser power for the MMC with 30% TiC are similar to those for the MMC with 10% TiC. In the case of the MMC with 30% TiC, the most concave part of the coating is lower than the surface of the substrate, so these two points are not shown at the laser power of 2100 W and 2300 W in Figure 5b. Furthermore, the value of H for 30% TiC is smaller than that for 10% TiC for the same laser power. When the laser power is 1700 W or higher, the value of h for 30% TiC is larger than that of 10% TiC. This indicates that, at the same laser power level, the amount of melting of the substrate increases slightly with the increase in TiC content, leading to an increase in the values of W and h of the MMC.

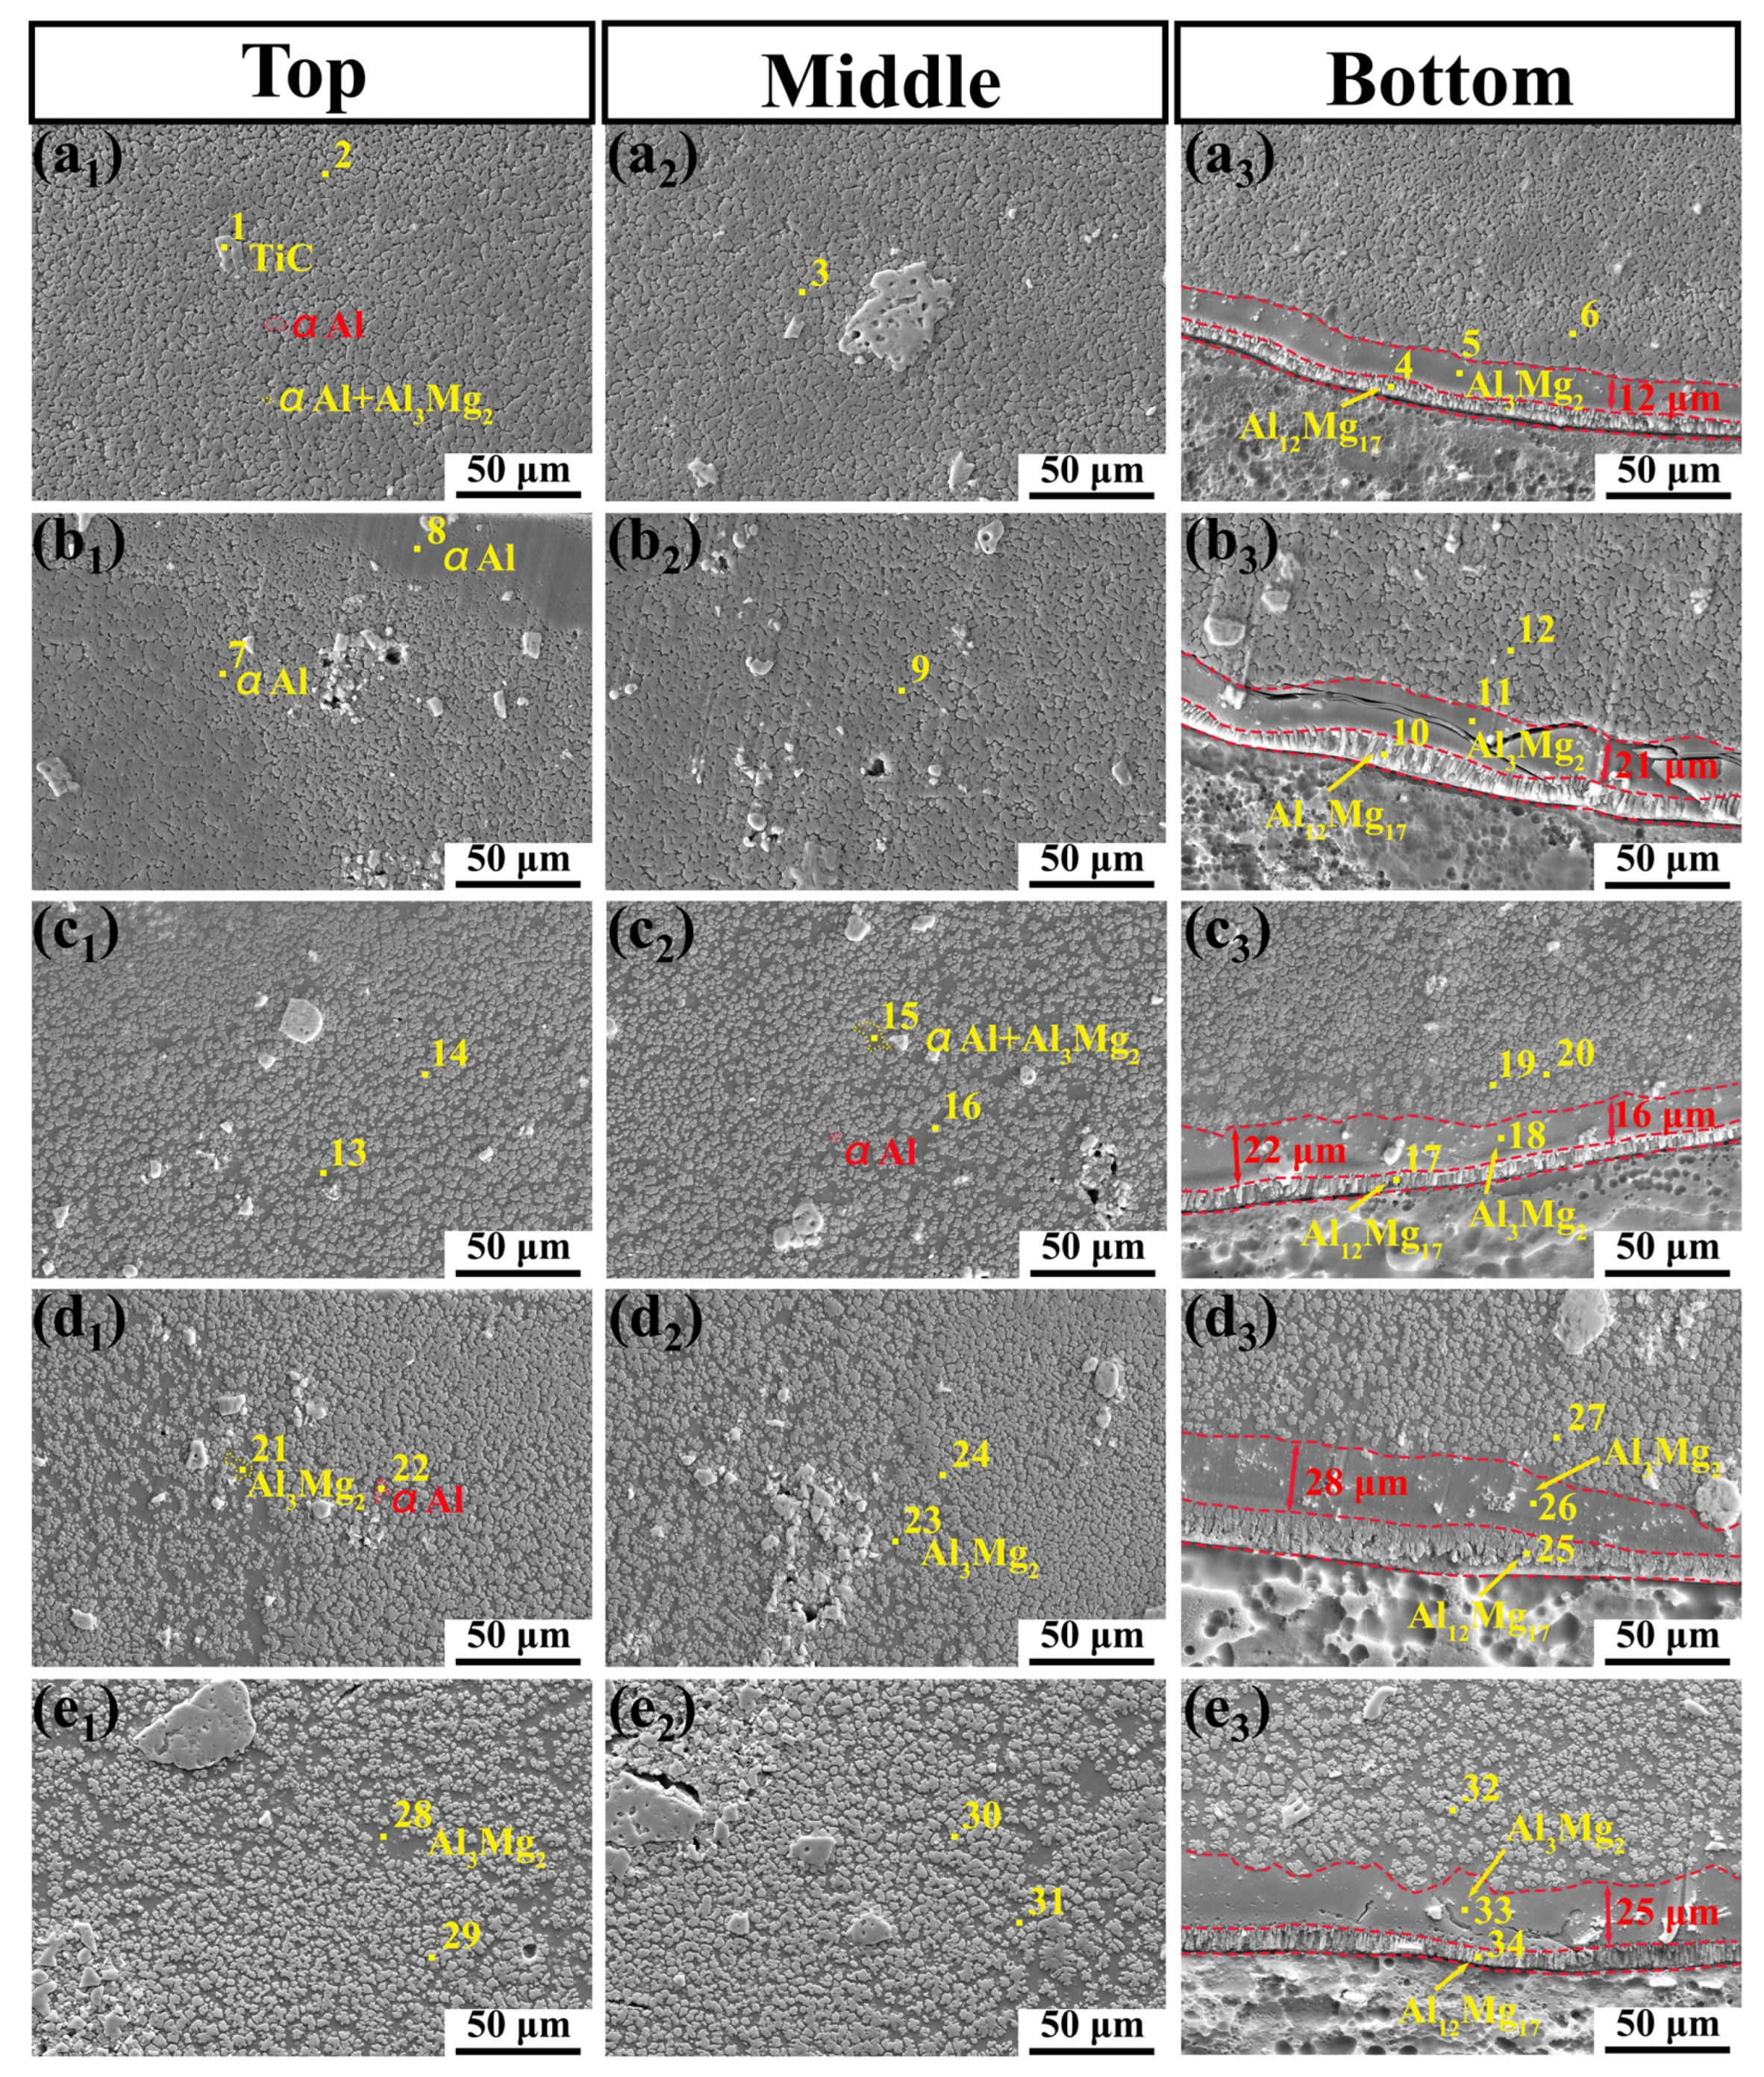
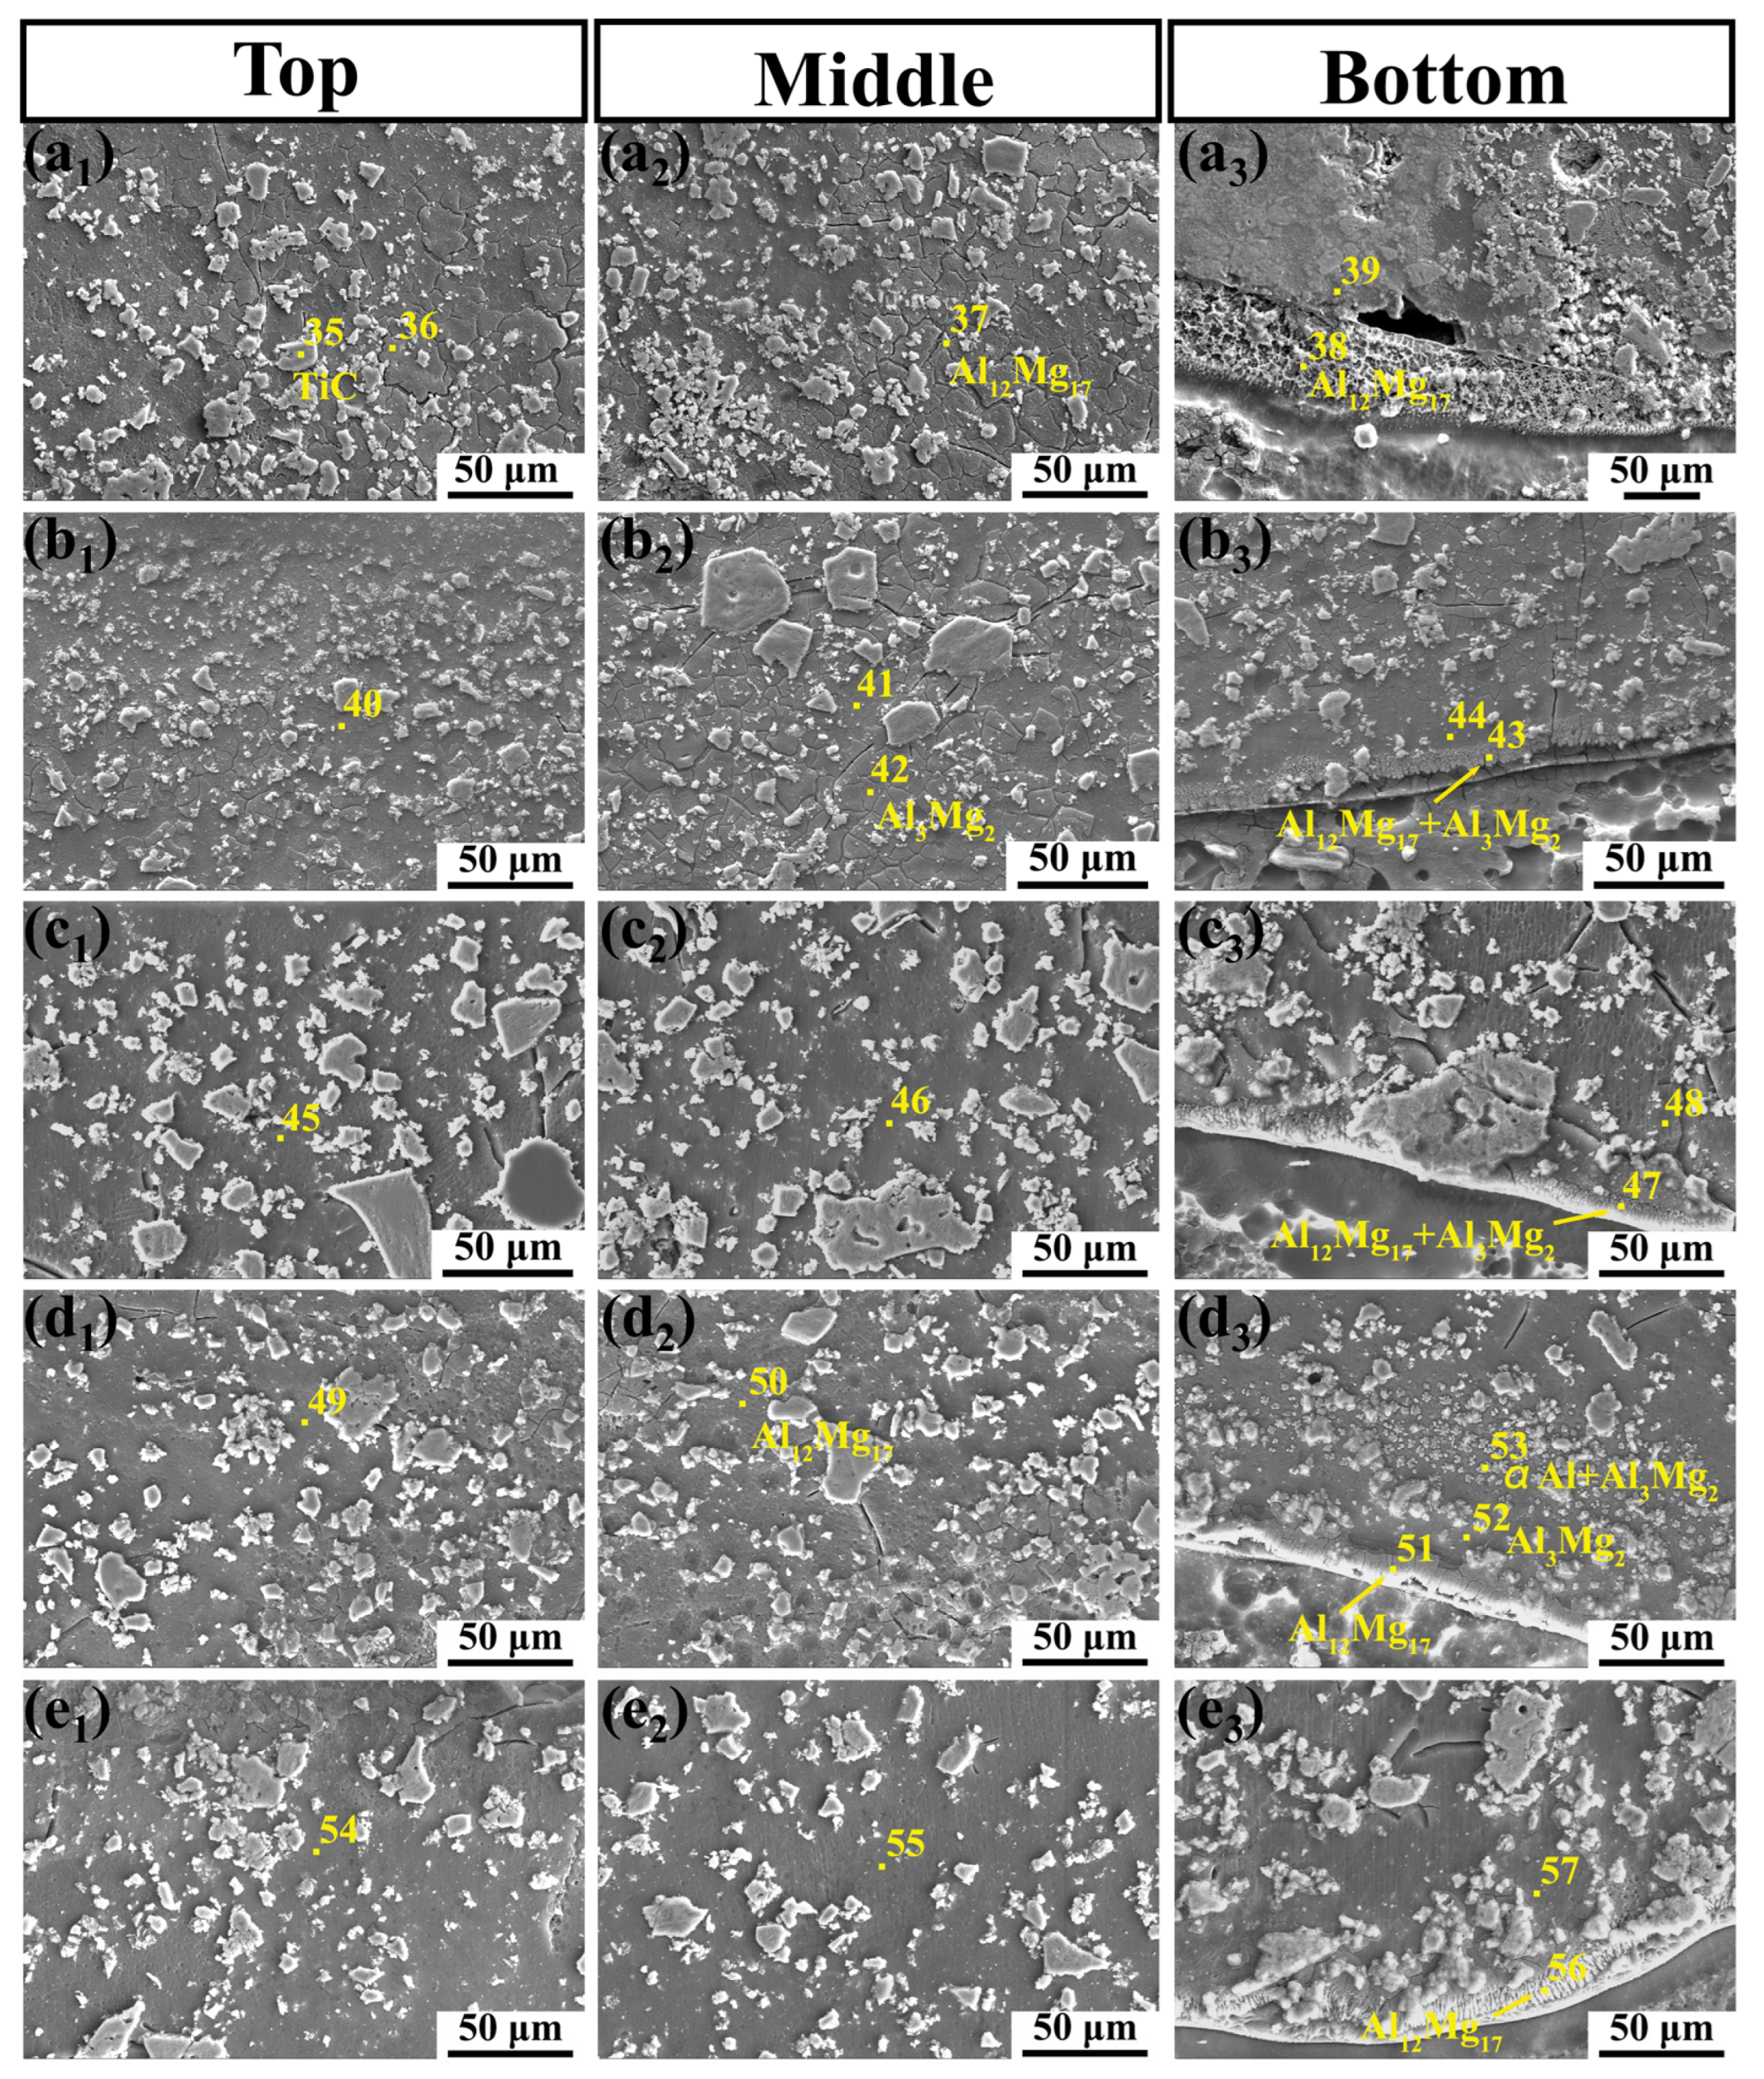
3.2. Microstructural Characteristic
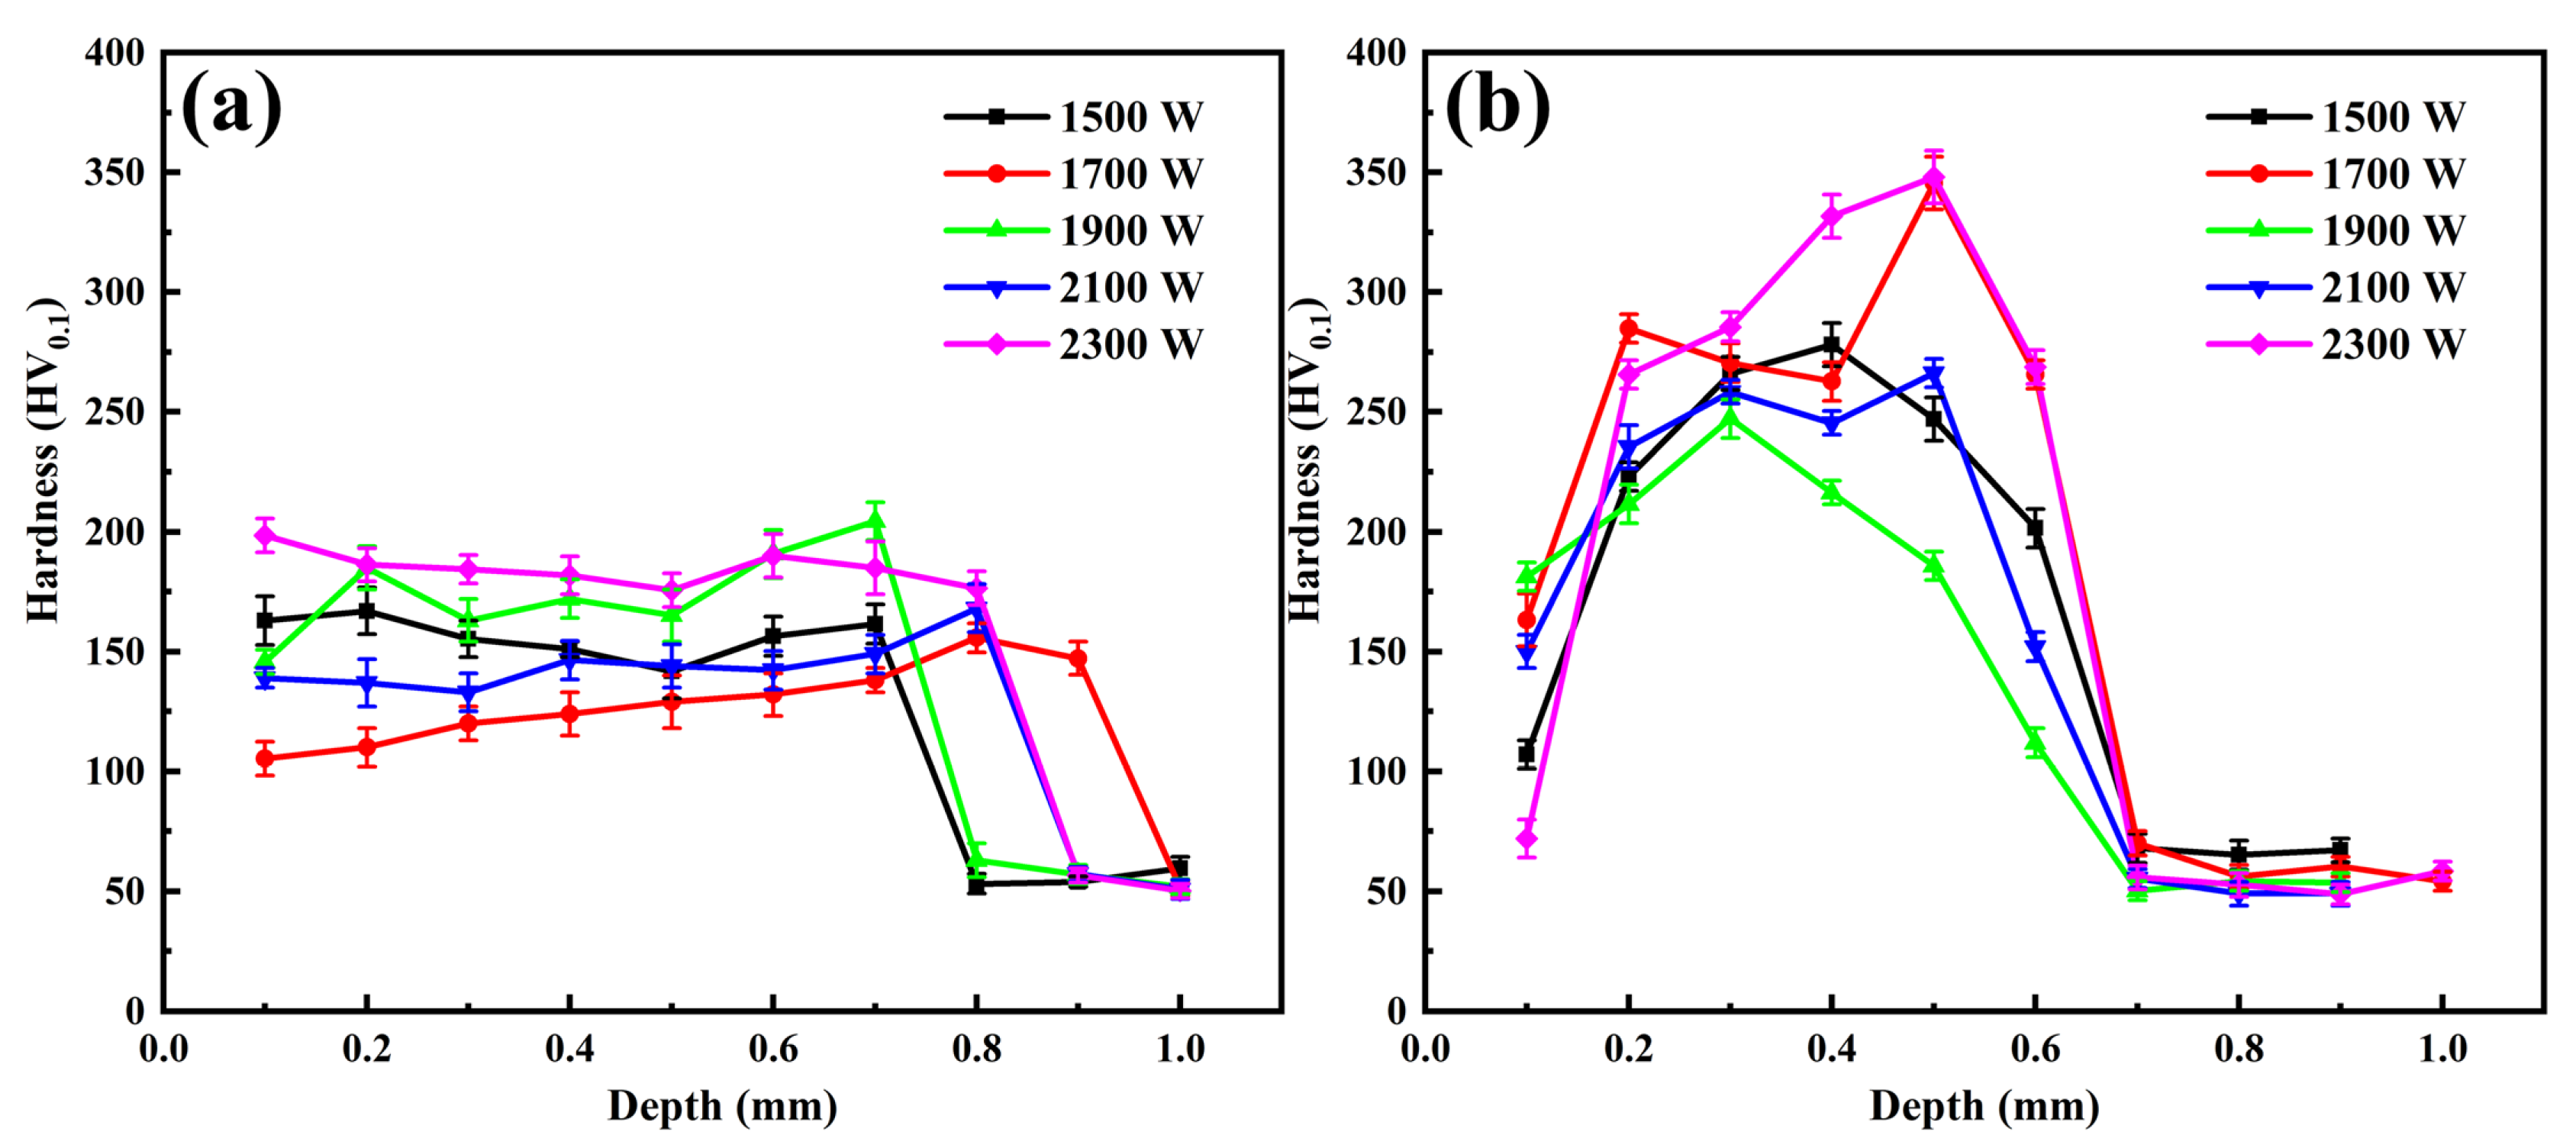
The XRD diagram of the MMC with different TiC contents is shown in Figure 6. In the MMC with 10% TiC, the phase composition is Al12Mg17, α-Al, Al3Mg2, and TiC. In the MMC with 30% TiC, the phase composition is Al12Mg17, Al3Mg2, and TiC.
The EDS maps of the MMC with different TiC contents are shown in Figure 7. As shown in Figure 7(a1–e1), in the MMC with 10% TiC, the coating contains mainly Al and Ti and small amounts of Mg elements. TiC particles are diffusely distributed in the MMC [25]. In contrast, in the MMC with 30% TiC, the Mg and Ti elements are brighter, indicating a higher content of Mg and Ti elements in the MMC, as shown in Figure 7(a2–e2). TiC particles are more densely distributed in the MMC. This is due to the fact that the total content of Al in the powder is reduced compared to that of the MMC with 10% TiC. The total content of Mg and TiC particles in the molten pool is larger than that of the MMC with 10% TiC.
The top, middle, and bottom regions of the MMC are marked in Figure 3a. Figure 8 shows the microstructure of the top, middle, and bottom regions of the MMC with 10% TiC. An EDS analysis was performed to detect the distribution of elements at the marked positions in Figure 8. At least three different positions were taken to confirm the EDS analysis, and the results (at. %) are listed in Table 2. Due to the limited accuracy of EDS measurements in quantifying light elements such as C and O, the elemental content (at. %) of Mg, Al, and Ti was determined [26]. Ti elemental content is used as an approximation for the TiC content in the sample. Combining with Figure 8 and Table 2, the bright white phase with sharp edges is TiC particle (site 1), as shown in Figure 8(a1). At the bottom of MMC, the boundary of molten pool is a bright white columnar phase (site 4) with approximately 60% Mg and 40% Al element content (Figure 8(a3)). According to the phase diagram of the Al-Mg binary alloy, this region is mainly composed of Al12Mg17 [27]. Immediately above the columnar phase, there is a wider section of light gray transition zone (site 5) with approximately 45% Mg and 55% Al element content, as shown in Figure 8(a3). This region is considered to be mainly composed of Al3Mg2 [28]. Furthermore, with the increase in laser power, the thickness of the transition layer increases from 12 µm to 25 µm. This indicates that the increase in laser power increases the diffusion of Mg from the substrate to the coating. When the laser power is 1500 W, the middle and top of the coatings has approximately 13% Mg and 87% Al element content (site 3), which is considered to be mainly α-Al phase, as shown in Figure 8(a2). When the laser power is 1900 W, the amount of substrate molten increases, and the Mg element content in the molten pool increases. The Mg element content of the black phase is 34% (site 13), which is presumed to be mainly the Al3Mg2 phase, as shown in Figure 8(c1). The surrounding bright phase has a Mg element content of 25% (site 16), which is inferred to be α-Al + Al3Mg2, as shown in Figure 8(c2).
Figure 9 shows the microstructure images of the top, middle, and bottom regions of the coatings with 30% TiC. The EDS analysis was applied to detect the distribution of elements at the marked positions in Figure 9, and the corresponding results (at. %) are listed in Table 3. No significant α-Al phase is found in the MMC with 30% TiC. The main phases at the top and middle of the coating are TiC (site 35) and Al3Mg2 + Al12Mg17 (sites 40 and 49). Furthermore, no significant Al3Mg2 transition layer is found at the bottom of the coating, which is quite different from the bottom of the MMC with 10% TiC. This is because the total content of Al in the powder is reduced. The total content of Mg in the molten pool is much larger than that of the MMC with 10% TiC.
Figure 10 shows the defects, such as the cracks and pores, of the Al-TiC MMC coating. Defects are the important factor that reduces the mechanical properties of the coating. Cracks are found at the interface between the coating and substrate bond, as shown in Figure 10a. The bonding zone is the transition zone between the liquid molten pool and the solid substrate. Some microscale solidification cracks will be formed during solidification, as shown in Figure 10b. During the laser cladding process, thermal stresses are generated due to the different coefficients of thermal expansion between the coating and substrate materials. During cooling, the temperature drops rapidly; the difference in shrinkage between the materials then leads to a concentration of thermal stresses, especially at the bonding interface, and contributes to the formation of cracks [29]. The rapid cooling process of laser cladding leads to temperature variations between the coating and substrate, resulting in different shrinkage rates and tensile or shear stresses that tend to produce cracks near the bonding region between the coating and substrate [30]. Furthermore, pores are found at the edges of the coating near the surface of the substrate, as shown in Figure 10b,e. During the laser cladding process, the powder at the periphery of the coating absorbs less energy in the outermost zone of laser irradiation. Insufficient energy absorption leads to the incomplete melting and insufficient fusion of powder particles, resulting in voids or pores [31].

3.3. Microhardness

The microhardness test results of coatings are presented in Figure 11. The results show that the average hardness of the MMC is higher than that of the substrate, and the average hardness of the MMC increases with the increase in laser power. As shown in Figure 11a, in the case of the MMC with 10% TiC, the average hardness value of substrate is approximately 52 HV0.1, while the average hardness values of the MMC samples with laser power levels of 1500 W, 1700 W, 1900 W, 2100 W and 2300 W are 162 HV0.1, 128 HV0.1, 174 HV0.1, 144 HV0.1, and 185 HV0.1, respectively. This indicates that the formation of Mg-Al IMCs during laser cladding significantly enhances the hardness of the MMC. In particular, the transition zone within the coating demonstrates a slightly elevated hardness compared to the remaining portion of the MMC, as shown in Figure 8(a3–e3). This can be attributed to the composition of the transition zone, which consists of approximately 60% Mg and 40% Al element content, almost forming Al3Mg2. The other areas of the MMC have a higher Al content than 60%, resulting in a solid solution of α-Al + Al3Mg2. Since the hardness of α-Al is lower, the overall hardness of coatings is slightly lower than that of the transition zone. However, when significant cracks are present (1700 W and 2100 W, as shown in Figure 3b,d), the average hardness of the MMC decreases. Because the formation of more IMCs, TiC particles and a few α-Al phases in the MMC. Thus, the MMC with 30% TiC has better hardness than the MMC with 10%, as shown in Figure 11b.

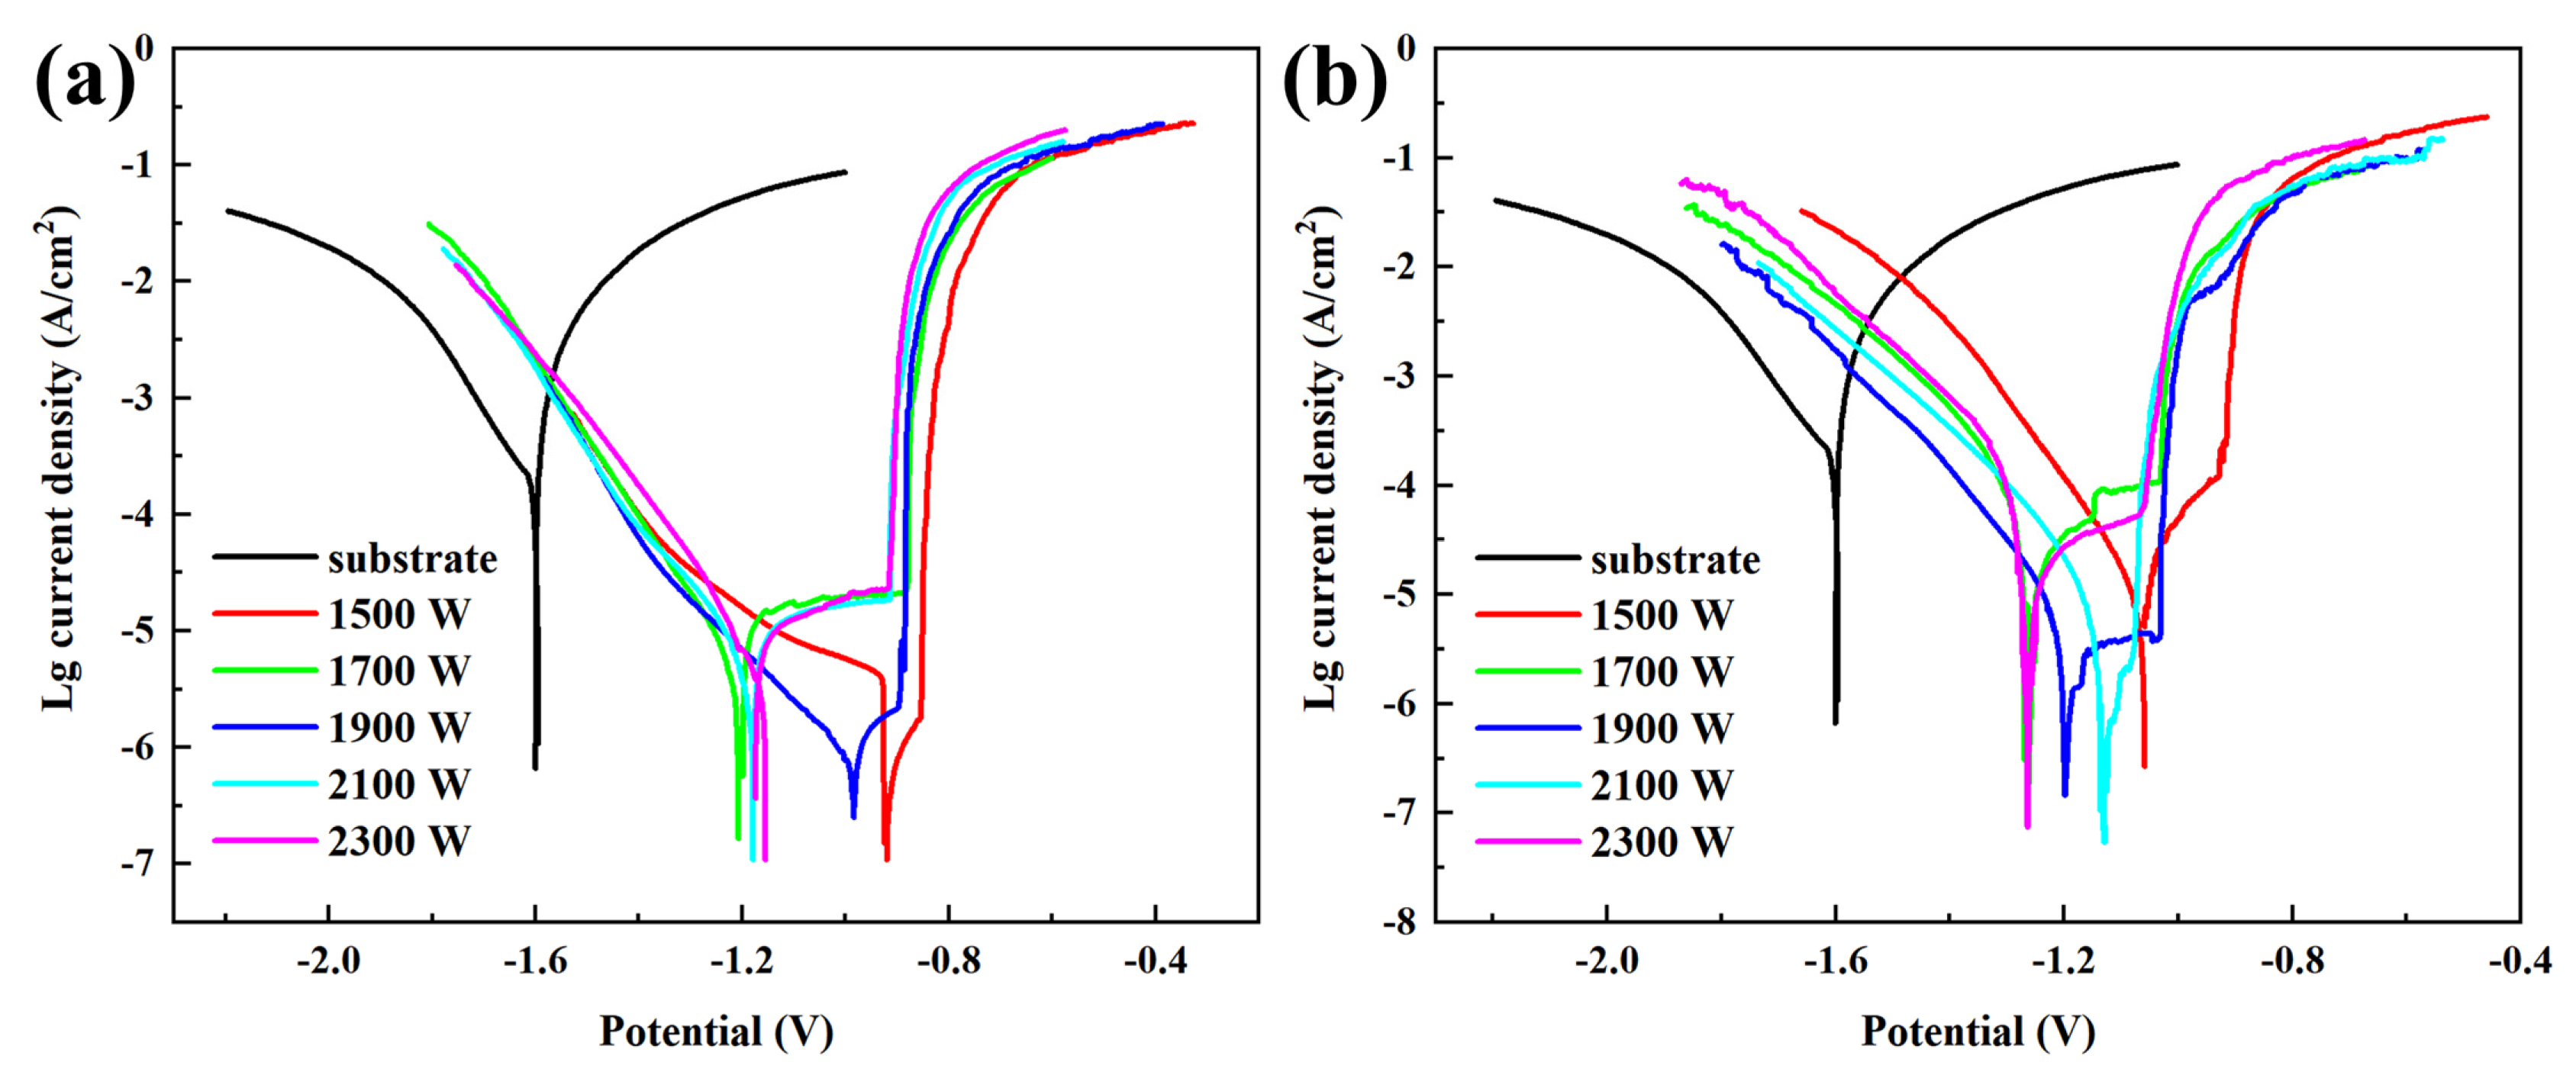
3.4. Corrosion Resistance

The potentiodynamic polarization curves of the coatings and AZ31 magnesium alloy substrate are shown in Figure 12. It is evident that the curves of the MMC are shifted to the left and above compared to those of the substrate. This indicates that the corrosion resistance of the coating is superior to that of the substrate. The corrosion potentials (Ecorr) and corrosion current densities (Icorr) are listed in Table 4. Ecorr reflects the tendency of material to corrode, and the higher the corrosion potential, the lower the possibility of corrosion [12]. In the case of the MMC with 10% TiC, the value of Ecorr of the MMC is up to −0.89 V and down to −1.248 V, which is significantly higher than that of the substrate (−1.68 V), indicating that the MMC has a lower corrosion tendency than the substrate, as shown in Figure 12a. Icorr reflects the corrosion rate of the material, where a lower corrosion current density signifies a slower corrosion rate. The values of Icorr of the MMC are up to 1.00 × 10⁻⁵ A/cm2 and down to 3.90 × 10⁻⁷ A/cm2, which is 1–3 orders of magnitude lower than that of substrate (5.45 × 10⁻⁴ A/cm2), indicating that the MMC exhibits superior corrosion resistance. Among these MMC coatings, the one formed at the 1900 W laser power level exhibits the lowest Icorr value, i.e., 3.90 × 10⁻⁷ A/cm2, indicating that it has an optimal corrosion resistance. In the case of the MMC with 30% TiC, the value of Ecorr of the MMC is significantly higher than that of substrate, and the values of Icorr of the MMC are lower than those of the substrate, indicating that the MMC exhibits superior corrosion resistance, as shown in Figure 12b. However, at the same laser power, the values of Icorr of the MMC with 30% TiC are higher than those of the MMC with 10% TiC, indicating that the corrosion resistance of the MMC decreases when the TiC content increases.
The corrosion morphology of the MMC coating is shown in Figure 13. In the case of the MMC with 10% TiC, the pitting pits of the coating were smaller at 1500 W and 1900 W, as shown in Figure 13a,c. When the laser power is 1700 W, the pitting pit is large, as shown in Figure 13b, indicating that the corrosion resistance is lower than that of the other coatings [10]. This is consistent with the results obtained from the polarization curves in Figure 12. Furthermore, at the same laser power, the size of pitting pits in the coating of 30% TiC is larger than that of the MMC with 10% TiC, indicating that the corrosion resistance of the MMC with 30% TiC is lower than that of the MMC with 10% TiC.

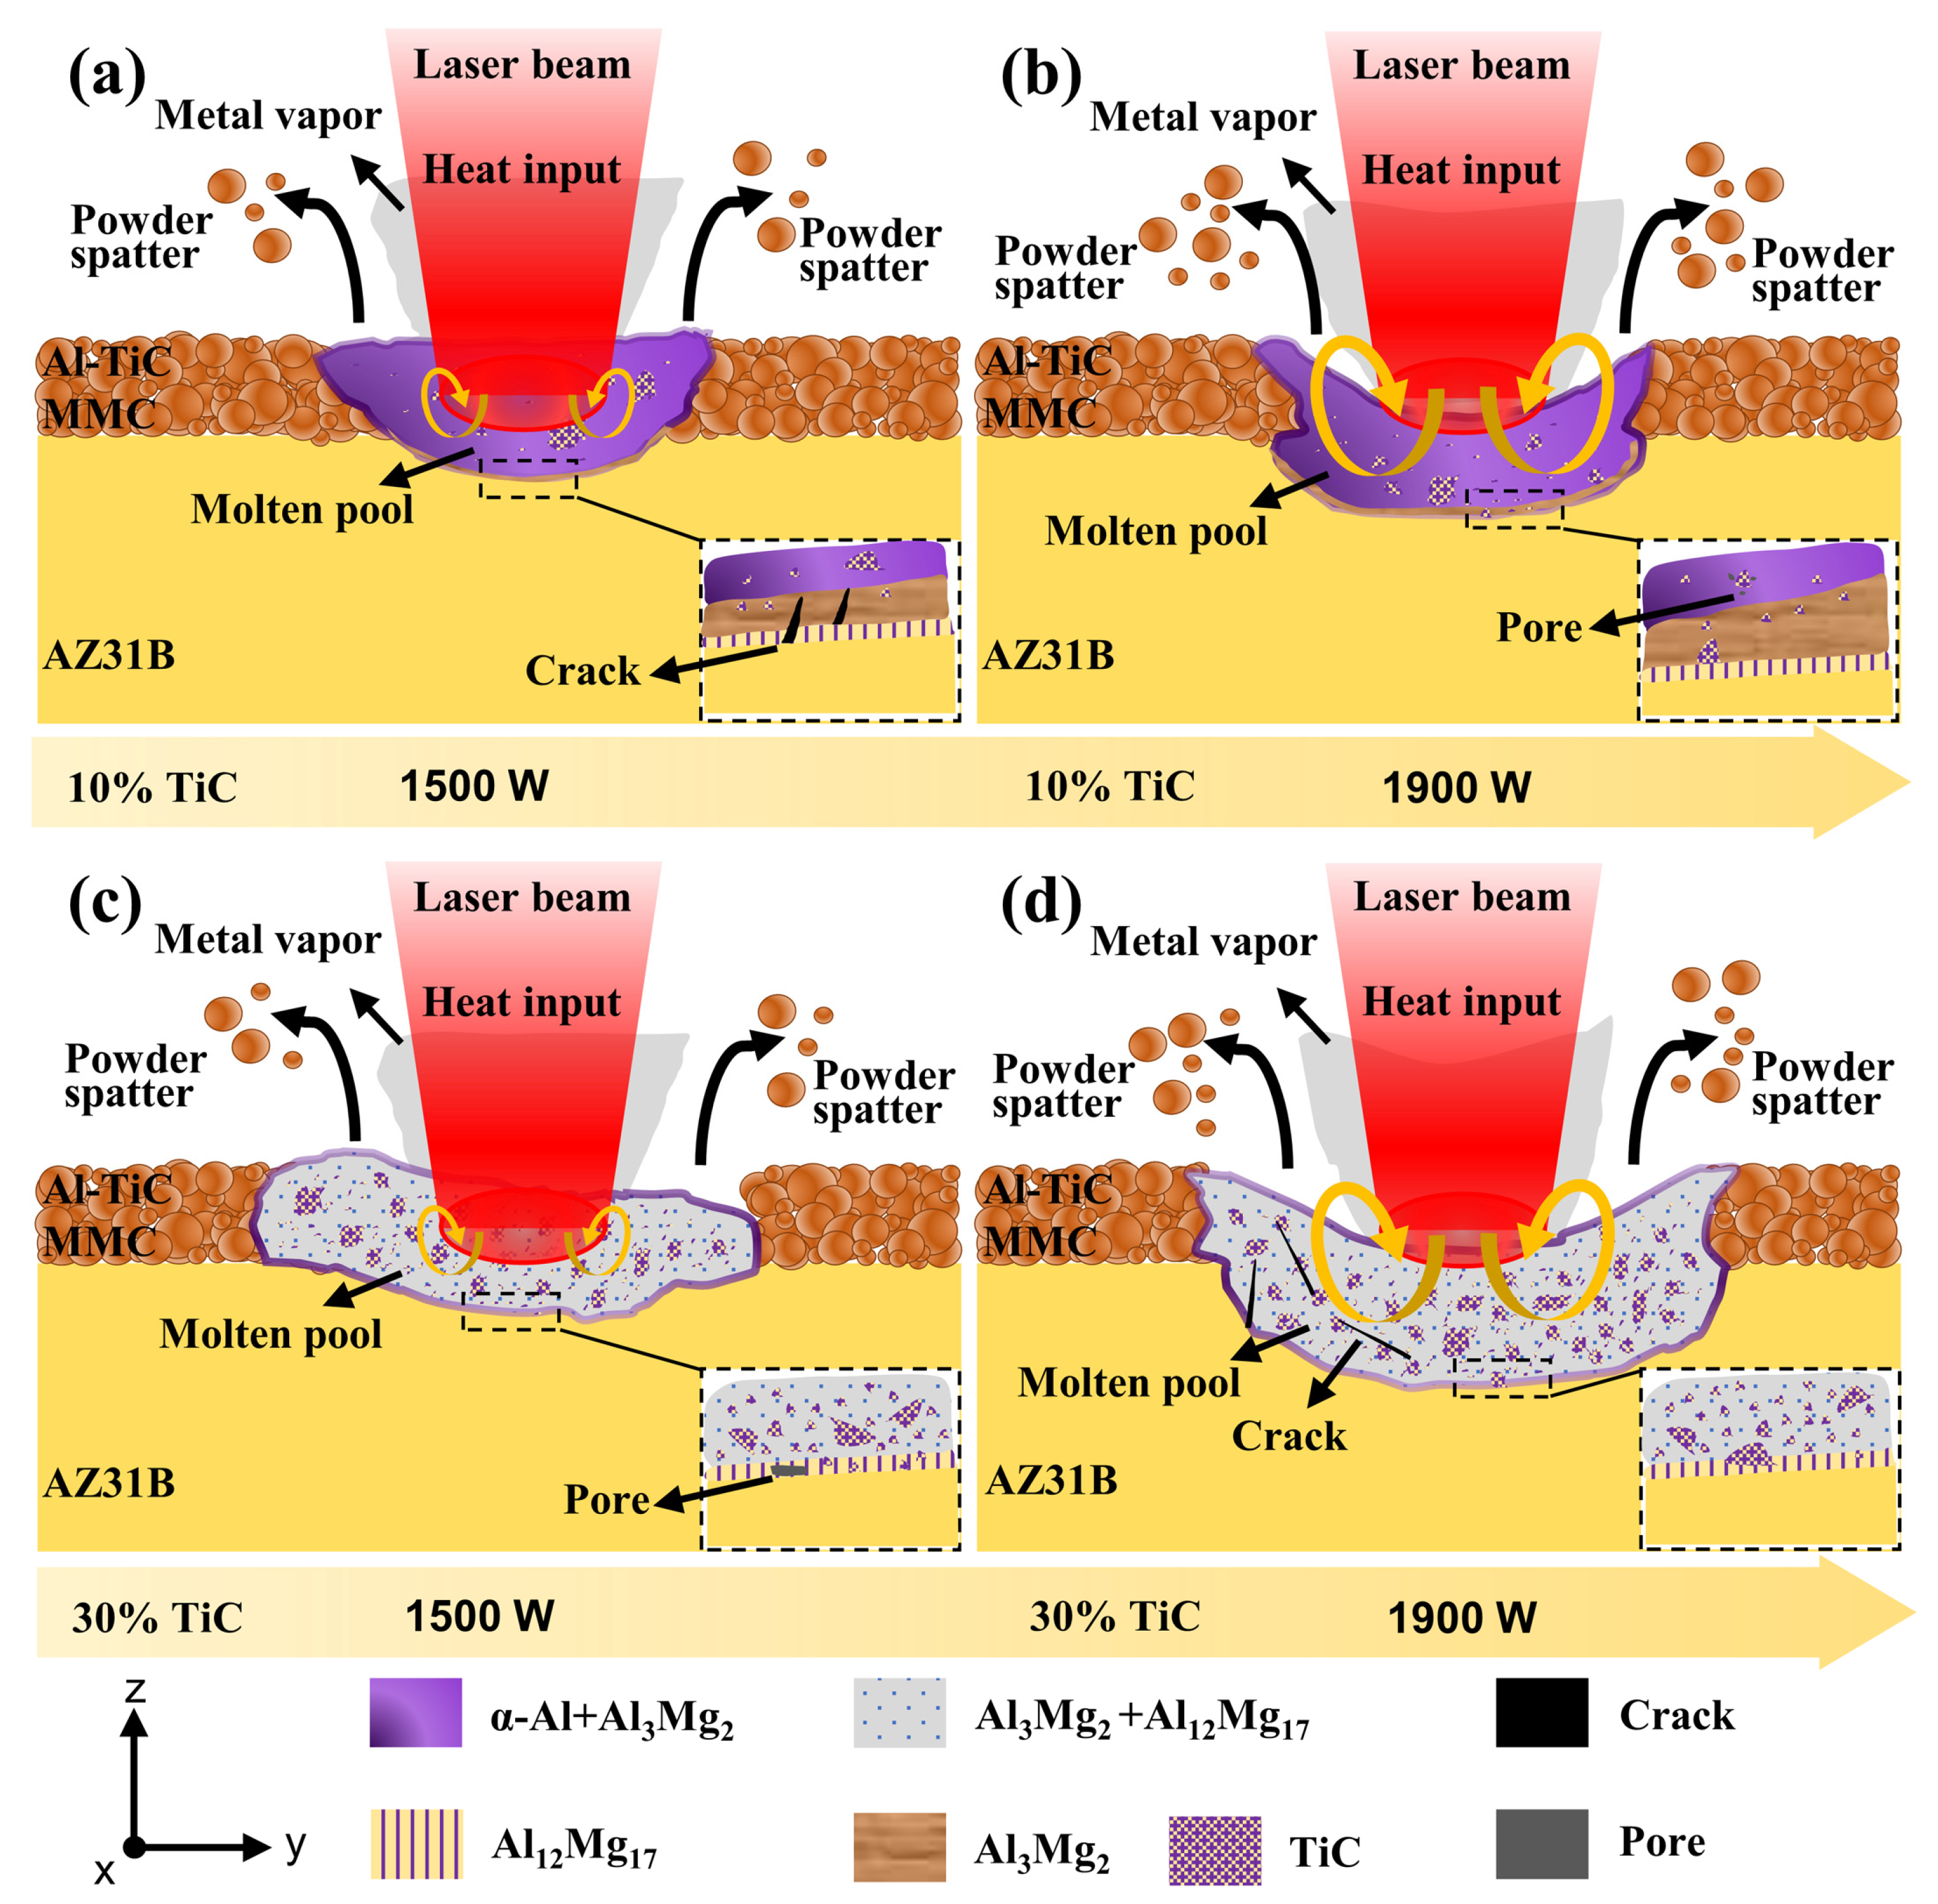
3.5. Microstructure Evolution

The microstructural evolution of Al-TiC MMC with different laser power and TiC content levels is shown in Figure 14, where the cases for laser powers of 1500 W and 1900 W are presented. In the MMC with 10% TiC, the heat input is low when the laser power is 1500 W, just enough to melt the powder and melt a small area of the substrate, as shown in Figure 14a. During the laser cladding process, only a small amount of both powder spatter and the shape of the coating is flat [32]. The total content of Mg in the molten pool in this case is very low. Due to the rapid melting and solidification of the molten pool, a good metallurgical bond is formed with the substrate at the interface. Due to the diffusion of Mg in the molten pool, the further away from the substrate, the lower the Mg content in the molten pool [33]. Thin Al12Mg17 and Al3Mg2 transition layers (with a thickness of 12 μm, as shown in Figure 8(a3)) were formed sequentially above the interface. Above the Al3Mg2 transition layer are α-Al + Al3Mg2 phase and TiC particles. Due to the difference in thermal expansion coefficients between Al-TiC and the substrate, a few cracks were formed at the interface.
When the laser power is increased to 1900 W, the heat input increases, and the melting region of the substrate increases significantly, as shown in Figure 14b. During the laser cladding process, the powder splattering increases, and the coating takes on a concave crescent shape. In this case, the total content of Mg increases in the molten pool. Al12Mg17 and Al3Mg2 transition layers were formed sequentially above the interface. However, the thickness of the Al3Mg2 transition layer is 22 μm, which is larger than that of the MMC with 10% TiC, as shown in Figure 8(c3).
Combined with Figure 14a,b, the MMCs all contain Al12Mg17, Al3Mg2, and α-Al + Al3Mg2 phases and TiC particles, suggesting that the change in laser power cannot change the phase composition of the MMC. However, the increase in laser power can contribute to the formation of a concave crescent shape. It can promote the diffusion of Mg and induce the formation of a thicker Al3Mg2 transition layer.
In the MMC with 30% TiC, the heat input is low when the laser power is 1500 W, as shown in Figure 14c. Since there is only a small amount of powder splatter, the coating has a flat shape. Compared to the MMC with 10% TiC, the total content of Al in the powder is reduced. The total content of Mg in the molten pool is much larger than that of the MMC with 10% TiC. A thin Al12Mg17 phase is formed at the interface bond, but no continuous Al3Mg2 transition layer is found above it. Furthermore, the α-Al phase is hardly found in the coating. There are a large number of TiC particles in the molten pool, while most of the other areas have a Mg and Al content of about 40% to 60%, which is presumed to be a mixed phase of Al3Mg2+ Al12Mg17.
When the laser power is increased to 1900 W, the heat input increases, and the melting region of the substrate increases significantly, as shown in Figure 14d. During the laser cladding process, the powder splattering increases, and the coating takes on a concave crescent shape. The phase composition of the coating is not changed. Compared to the MMC with 10% TiC, due to the increased content of TiC, the difference in thermal expansion between the coating and the substrate is greater, and long cracks are found in the coating.
The above analysis shows that the change in TiC content has a significant effect on the microstructure of the coating. As the TiC content increases, the total content of Al in the molten pool decreases, and the total content of Mg increases significantly. With the rapid melting and solidification of the molten pool, a large amount of Al3Mg2 + Al12Mg17 mixed phase is formed. And the α-Al phase is hardly found in the coating.

4. Conclusions

In this work, the effects of the laser power and TiC content on the microstructure, hardness, and corrosion resistance of an Al-TiC MMC coating that was added to an AZ31B magnesium alloy via laser cladding were explored. The conclusions are as follows:
(1)
The Al-TiC MMC coating was prepared on the AZ31B magnesium alloy via laser cladding. A good metallurgical bonding between the coating and substrate was obtained. The shape of the coating is not the typical up-convex shape but rather a concave crescent shape.
(2)
The hardness of the MMC was significantly improved compared to the AZ31B magnesium alloy. The average hardness of the MMC with 10% TiC is 184 HV0.1, which is 3.5 times higher than that of the AZ31B magnesium alloy (52 HV0.1). Because the formation of more IMCs, TiC particles and a few α-Al phases in the MMC. Thus, the MMC with 30% TiC has better hardness than the MMC with 10%.
(3)
The corrosion resistance of the MMC was significantly improved compared to that if the AZ31B magnesium alloy. The current density of the MMC with 10% TiC is 3.90 × 10⁻⁷ A/cm2, which is three orders of magnitude lower than that of the AZ31B magnesium alloy (5.45 × 10⁻⁴ A/cm2). At the same laser power, the corrosion resistance of the MMC with 30% TiC is lower than that of the MMC with 10% TiC.
(4)
The microstructural evolution of the MMC with different laser power and TiC content levels was analyzed. The increase in laser power cannot change the phase composition of the MMC, but it can contribute to the formation of a concave crescent shape and can induce the formation of a thicker Al3Mg2 transition layer. The change in TiC content has a significant effect on the microstructure of the coating.

Author Contributions

Investigation, writing—original draft preparation, data curation, and writing—review and editing, H.P.; data curation, G.Z.; data curation, writing—review and editing, C.C.; data curation and writing—review and editing, C.L.; conceptualization, methodology, investigation, writing—review and editing, and supervision, J.Z.; data curation and writing—review and editing, Y.L. All authors have read and agreed to the published version of the manuscript.

Funding

This work was supported by the National Key R&D Program of China (Grant No. 2021YFE0203500 and No. 2022YFB4601601), the Special Fund for Local Scientific and Technological Development guided by the Central Government (Grant No. GKZY21195029), and the Key R&D Program of Guangxi Province (Grant No. GKAB23026101).

Institutional Review Board Statement

Not applicable.

Informed Consent Statement

Not applicable.

Data Availability Statement

Data are contained within the article.

Conflicts of Interest

Geng Zhi was employed by the company Second Institute of China Aerospace Science and Technology Corporation. The remaining authors declare that the research was conducted in the absence of any commercial or financial relationships that could be construed as a potential conflict of interest.

References

  1. Liu, J.L.; Yu, H.J.; Chen, C.Z.; Weng, F.; Dai, J.J. Research and development status of laser cladding on magnesium alloys: A review. Opt. Lasers Eng. 2017, 93, 195–210. [Google Scholar] [CrossRef]
  2. Li, N.; Ling, N.; Fan, H.Y.; Wang, L.; Zhang, J.L. Self-healing and superhydrophobic dual-function composite coating for active protection of magnesium alloys. Surf. Coat. Technol. 2023, 454, 11. [Google Scholar] [CrossRef]
  3. Guo, Y.; Zhang, Y.Q.; Li, Z.Y.; Wei, S.Z.; Zhang, T.; Yang, L.Q.; Liu, S.Y. Microstructure and properties of in-situ synthesized ZrC-Al3Zr reinforced composite coating on AZ91D magnesium alloy by laser cladding. Surf. Coat. Technol. 2018, 334, 471–478. [Google Scholar] [CrossRef]
  4. Zhang, C.H.; Li, Z.; Zhang, J.K.; Tang, H.B.; Wang, H.M. Additive manufacturing of magnesium matrix composites: Comprehensive review of recent progress and research perspectives. J. Magnes. Alloys 2023, 11, 425–461. [Google Scholar] [CrossRef]
  5. Pak, S.N.; Jiang, Z.H.; Yao, Z.P.; Ju, J.M.; Ju, K.S.; Pak, U.J. Fabrication of environmentally friendly anti-corrosive composite coatings on AZ31B Mg alloy by plasma electrolytic oxidation and phytic acid/3-aminopropyltrimethoxysilane post treatment. Surf. Coat. Technol. 2017, 325, 579–587. [Google Scholar] [CrossRef]
  6. Taha, M.A.; El-Mahallawy, N.A.; Hammouda, R.M.; Nassef, S.I. PVD Coating of Mg-AZ31 by Thin Layer of Al and Al-Si. J. Coat. Technol. Res. 2010, 7, 793–800. [Google Scholar] [CrossRef]
  7. Ezhilselvi, V.; Nithin, J.; Balaraju, J.N.; Subramanian, S. The influence of current density on the morphology and corrosion properties of MAO coatings on AZ31B magnesium alloy. Surf. Coat. Technol. 2016, 288, 221–229. [Google Scholar] [CrossRef]
  8. Morelli, S.; Rombola, G.; Bolelli, G.; Lopresti, M.; Puddu, P.; Boccaleri, E.; Seralessandri, L.; Palin, L.; Testa, V.; Milanesio, M.; et al. Hard ultralight systems by thermal spray deposition of WC-CoCr onto AZ31 magnesium alloy. Surf. Coat. Technol. 2022, 451, 26. [Google Scholar] [CrossRef]
  9. Pei, X.L.; Li, Z.Y.; Zhang, Y.Q.; Wei, S.Z.; Yang, L.Q.; Wang, Y.J. A gradient Al/Ni-Cr-Al layer formed by direct current pulse metal inert gas welding combined laser cladding on AZ91D magnesium alloy. Vacuu 2019, 165, 86–95. [Google Scholar] [CrossRef]
  10. Jiang, L.P.; Cui, X.F.; Jin, G.; Tian, Z.M.; Wen, X.; Tian, H.L.; Liu, E. Design and characterization of a novel Cu 2.3 Al 1.3 Ni 1.7 SnCr 0.3 multi-principal element alloy coating on magnesium alloy by laser cladding. J. Mater. Sci. Technol. 2023, 152, 220–236. [Google Scholar] [CrossRef]
  11. Jiang, L.P.; Cui, X.F.; Jin, G.; Tian, Z.M.; Wen, X.; Tian, H.L.; Wang, S. Design and characterization of in-situ TiB reinforced TiB/Ti50Zr25Al15Cu10 non-equiatomic medium-entropy alloy composite coating on magnesium alloy by laser cladding. Opt. Laser Technol. 2022, 156, 15. [Google Scholar] [CrossRef]
  12. Zhang, Y.Q.; Guo, J.; Xu, G.D.; Li, Z.Y.; Wei, S.Z. Effect of Nd2O3 on microstructure, corrosion and wear properties of laser cladding Zr-based amorphous composite coatings on AZ91D magnesium alloy. Appl. Surf. Sci. 2023, 611, 11. [Google Scholar] [CrossRef]
  13. Bhatnagar, S.; Magham, H.S.; Mullick, S.; Gopinath, M. Evaluation of microstructure and thermal history for TiC/Inconel 625 MMC deposition through pre-placed laser cladding method with and without the application of ultrasonic vibration. CIRP J. Manuf. Sci. Technol. 2023, 41, 453–464. [Google Scholar] [CrossRef]
  14. Lin, P.Y.; Zhang, Z.H.; Ren, L.Q. The mechanical properties and microstructures of AZ91D magnesium alloy processed by selective laser cladding with Al powder. Opt. Laser Technol. 2014, 60, 61–68. [Google Scholar] [CrossRef]
  15. Zheng, B.J.; Chen, X.M.; Lian, J.S. Microstructure and wear property of laser cladding Al plus SiC powders on AZ91D magnesium alloy. Opt. Lasers Eng. 2010, 48, 526–532. [Google Scholar] [CrossRef]
  16. Ignat, S.; Sallamand, P.; Grevey, D.; Lambertin, M. Magnesium alloys laser (Nd:YAG) cladding and alloying with side injection of aluminium powder. Appl. Surf. Sci. 2004, 225, 124–134. [Google Scholar] [CrossRef]
  17. Zhao, D.C.; Kong, D.C.; Huang, J.; Wang, M.L.; Yamaguchi, T.; Wang, H.W. Achieving the lightweight wear-resistant TiC reinforced AlFeCrCo medium-entropy alloy coating on Mg alloy via resistance seam processing. Scr. Mater. 2022, 210, 5. [Google Scholar] [CrossRef]
  18. Das, A.K. Recent trends in laser cladding and alloying on magnesium alloys: A review. In Proceedings of the 1st International Conference on Computations in Materials and Applied Engineering (CMAE), Uttarakhand, India, 1–2 May 2021; pp. 723–727. [Google Scholar]
  19. Yang, L.; Li, Z.; Zhang, Y.; Wei, S.; Liu, F. Al-TiC in situ composite coating fabricated by low power pulsed laser cladding on AZ91D magnesium alloy. Appl. Surf. Sci. 2018, 435, 1187–1198. [Google Scholar] [CrossRef]
  20. Liu, F.J.; Li, A.D.; Shen, Z.K.; Chen, H.Y.; Ji, Y. Microstructure and corrosion behavior of Al-Ti-TiC-CNTs/AZ31 magnesium matrix composites prepared using laser cladding and high speed friction stir processing. Opt. Laser Technol. 2022, 152, 11. [Google Scholar] [CrossRef]
  21. Fang, Y.; Kim, M.K.; Zhang, Y.; Duan, Z.; Yuan, Q.; Suhr, J. Particulate-reinforced iron-based metal matrix composites fabricated by selective laser melting: A systematic review. J. Manuf. Process. 2022, 74, 592–639. [Google Scholar] [CrossRef]
  22. AlMangour, B.; Grzesiak, D.; Jenn, M. Selective laser melting of TiC reinforced 316L stainless steel matrix nanocomposites: Influence of starting TiC particle size and volume content. Mater. Des. 2016, 104, 141–151. [Google Scholar] [CrossRef]
  23. Wei, W.H.; Zhang, Q.; Wu, W.J.; Cao, H.Z.; Shen, J.; Fan, S.Q.; Duan, X.M. Agglomeration-free nanoscale TiC reinforced titanium matrix composites achieved by in-situ laser additive manufacturing. Scr. Mater. 2020, 187, 310–316. [Google Scholar] [CrossRef]
  24. Gao, Z.A.N.; Wang, L.L.; Wang, Y.N.; Lyu, F.Y.; Zhan, X.H. Crack defects and formation mechanism of FeCoCrNi high entropy alloy coating on TC4 titanium alloy prepared by laser cladding. J. Alloys Compd. 2022, 903, 19. [Google Scholar] [CrossRef]
  25. Cai, Y.C.; Luo, Z.; Chen, Y.; Ma, C.Y.; Song, R.F. Influence of coating thickness on the morphology of TiC particles. Surf. Eng. 2017, 33, 521–528. [Google Scholar] [CrossRef]
  26. Zhang, B.; Wang, H.M.; Zhang, S.Q.; He, B. Optimization of the dilution parameters to improve wear resistance of laser cladding 15-5PH steel coating on U75V pearlitic steel. Surf. Coat. Technol. 2023, 465, 12. [Google Scholar] [CrossRef]
  27. Wang, Y.J.; Li, Z.Y.; Zhang, Y.Q.; Wei, S.Z.; Yang, L.Q.; Yang, K. Segregation in the magnesium/aluminum composites formed by cold arc cladding. MCP 2021, 266, 14. [Google Scholar] [CrossRef]
  28. Ao, S.S.; Wang, T.; Huang, Y.Z.; Dai, Y.; Cai, Y.C.; Luo, Z. The Wear Properties of TiC/Al-Based Composite Coating Applied by Laser Cladding. Metals 2018, 8, 975. [Google Scholar] [CrossRef]
  29. Ya, W.; Pathiraj, B.; Matthew, D.T.A.; Bright, M.; Melzer, S. Cladding of Tribaloy T400 on steel substrates using a high power Nd:YAG laser. Surf. Coat. Technol. 2018, 350, 323–333. [Google Scholar] [CrossRef]
  30. Cen, L.; Du, W.B.; Gong, M.C.; Lu, Y.; Zhang, C.; Gao, M. Effect of high-frequency beam oscillation on microstructures and cracks in laser cladding of Al-Cu-Mg alloys. Surf. Coat. Technol. 2022, 447, 10. [Google Scholar] [CrossRef]
  31. Chu, F.Z.; Li, E.L.; Shen, H.P.; Chen, Z.E.; Li, Y.X.; Liu, H.; Min, S.L.; Tian, X.N.; Zhang, K.; Zhou, Z.Y.; et al. Influence of powder size on defect generation in laser powder bed fusion of AlSi10Mg alloy. J. Manuf. Process. 2023, 94, 183–195. [Google Scholar] [CrossRef]
  32. Qi, Z.W.; Chen, C.Y.; Wang, C.Y.; Zhou, Z.K.; Zhou, J.; Long, Y. Effect of different laser wavelengths on laser cladding of pure copper. Surf. Coat. Technol. 2023, 454, 11. [Google Scholar] [CrossRef]
  33. Zhou, J.; Chen, C.Y.; Zhou, Z.K.; Long, H.Y.; Jia, J.; He, L.G.; Long, Y. Dissimilar laser lap welding of Mg and Al alloys using a CoCrFeNi medium-entropy alloy interlayer. Opt. Laser Technol. 2023, 157, 16. [Google Scholar] [CrossRef]
Figure 1. SEM morphology of MMC powders: (a) Al, (b) TiC, and (c) Al-TiC and EDS mapping of elements.
Coatings 14 00211 g001
Figure 2. (a) Schematic diagram of the laser cladding process, (b) electrochemical corrosion testing, (c) electrochemical test specimen, and (d) schematic diagram of hardness tests.
Coatings 14 00211 g002
Figure 3. Cross-sectional macrographs of the single-track coating with different laser power levels: the MMC with 10% TiC at (a) 1500 W, (b) 1700 W, (c) 1900 W, (d) 2100 W, and (e) 2300 W; the MMC with 30% TiC at (f) 1500 W, (g) 1700 W, (h) 1900 W, (i) 2100 W, and (j) 2300 W; the top, middle, and bottom regions of the MMC are marked in (a).
Coatings 14 00211 g003
Figure 4. Schematic diagram of cladding cross-section.
Coatings 14 00211 g004
Figure 5. Cross-sectional parameters of each coating: (a) W, (b) H, and (c) h.
Coatings 14 00211 g005
Figure 6. The XRD diagram of the MMC with different TiC contents.
Coatings 14 00211 g006
Figure 7. The EDS maps of the coatings: (a1e1) the MMC with 10% TiC; (a2e2) the MMC with 30% TiC, (a1,a2) 1500 W, (b1,b2) 1700 W, (c1,c2) 1900 W, (d1,d2) 2100 W, and (e1,e2) 2300 W.
Coatings 14 00211 g007
Figure 8. Microstructure of the (top), (middle), and (bottom) regions of the MMC with 10% TiC: (a1a3) 1500 W, (b1b3) 1700 W, (c1c3) 1900 W, (d1d3) 2100 W, (e1e3) 2300 W, (a1e1) the top region of the coatings, (a2e2) the middle region of the coatings; and (a3e3) the bottom region of the coatings.
Coatings 14 00211 g008
Figure 9. Microstructure of the (top), (middle), and (bottom) regions of the MMC with 30% TiC: (a1a3) 1500 W, (b1b3) 1700 W, (c1c3) 1900 W, (d1d3) 2100 W, (e1e3) 2300 W, (a1e1) the top region of the coatings, (a2e2) the middle region of the coatings, and (a3e3) the bottom region of the coatings.
Coatings 14 00211 g009
Figure 10. The cracks and pores of the MMC: the MMC with 10% TiC of (a) 1500 W, (b) 1700 W, (c) 1900 W, (d) 2100 W, and (e) 2300 W; the MMC with 30% TiC of (f) 1500 W, (g) 1700 W, (h) 1900 W, (i) 2100 W, and (j) 2300 W.
Coatings 14 00211 g010
Figure 11. Microhardness of the coatings: (a) the MMC with 10% TiC and (b) the MMC with 30% TiC.
Coatings 14 00211 g011
Figure 12. Potentiodynamic polarization curves: (a) the MMC with 10% TiC and (b) the MMC with 30% TiC.
Coatings 14 00211 g012
Figure 13. Corrosion morphology in a 3.5 wt% NaCl solution: the MMC with 10% TiC of (a) 1500 W, (b) 1700 W, (c) 1900 W, (d) 2100 W, and (e) 2300 W; the MMC with 30% TiC of (f) 1500 W, (g) 1700 W, (h) 1900 W, (i) 2100 W, and (j) 2300 W.
Coatings 14 00211 g013
Figure 14. The microstructural evolution of Al-TiC MMC with different laser power and TiC content levels: the MMC with 10% TiC of (a) 1500 W and (b) 1900 W; the MMC with 30% TiC of (c) 1500 W and (d) 1900 W.
Coatings 14 00211 g014
Table 1. AZ31B magnesium alloy chemical composition (wt%, manufacturer datasheet).
AlZnMnSiFeCuNiMg
3.020.650.350.160.0030.010.001Bal.
Table 2. The EDS analysis results (at. %) of the sites marked in Figure 8.
SiteMgAlTiSiteMgAlTi
1001001849.5750.390.04
213.9485.850.211926.0773.750.17
313.1786.670.162033.9167.930.16
460.7239.240.042138.5261.420.06
544.6854.930.382222.3177.590.10
618.2581.600.152336.9862.800.22
79.3690.420.222412.8786.790.34
810.6789.050.282563.6036.390.01
916.7082.180.122646.3453.630.03
1062.5237.4802723.8976.020.09
1145.5954.380.032840.5159.430.06
1213.7186.110.182920.1779.550.28
1333.6966.270.043020.3779.400.23
1422.3977.510.103123.8176.060.13
1528.6468.892.473225.0474.910.05
1624.7775.100.133346.4253.540.04
1760.9239.050.033464.0535.930.02
Table 3. The EDS analysis results (at. %) of the sites marked in Figure 9.
SiteMgAlTiSiteMgAlTi
35001004749.8350.080.09
3646.2450.663.104853.7746.000.23
3755.4544.220.334950.8348.830.34
3867.3132.420.275056.8142.950.24
3952.4845.651.875155.1944.600.21
4048.1851.500.325242.1857.520.30
4147.1352.650.475320.7376.662.61
4243.8855.650.475444.6555.030.31
4351.6947.970.345553.9945.820.19
4447.4452.340.225664.8335.070.10
4549.6649.930.415753.9745.780.25
4647.0752.680.25
Table 4. Analysis results of potentiodynamic polarization curves.
10% TiCIcorr (A/cm2)Ecorr (V)Epit (V)30% TiCIcorr (A/cm2)Ecorr (V)Epit (V)
substrate5.45 × 10−4−1.68-substrate5.45 × 10−4−1.68-
1500 W4.02 × 10−6−0.89−0.851500 W1.90 × 10−5−1.07−0.92
1700 W1.00 × 10−5−1.25−0.881700 W2.88 × 10−5−1.24−1.03
1900 W3.90 × 10−7−0.90−0.891900 W3.23 × 10−6−1.16−1.04
2100 W9.33 × 10−6−1.22−0.912100 W1.09 × 10−5−1.14−1.08
2300 W8.12 × 10−6−1.20−0.922300 W1.99 × 10−5−1.26−1.06
Disclaimer/Publisher’s Note: The statements, opinions and data contained in all publications are solely those of the individual author(s) and contributor(s) and not of MDPI and/or the editor(s). MDPI and/or the editor(s) disclaim responsibility for any injury to people or property resulting from any ideas, methods, instructions or products referred to in the content.

