Abstract
This paper reports on the bond behavior of glass fine aggregate reinforced concrete (GFARC) under chloride erosion, considering the chloride solution and glass fine aggregate (GFA) exchange rates as variable parameters. The 16 groups of specimens are designed to conduct central pull-out tests after chloride erosion. The experimental results are analyzed, such as the τ–s curve, ultimate bond strength, peak slip, and bond stiffness. The results indicated that the degree of reinforcement corrosion in GFARC is low under the action of chloride corrosion. Compared with natural aggregate-reinforced concrete (NARC), the ultimate bond strength and bond stiffness of GFARC improve under the same chloride corrosion. The ultimate bond strengths of 25% GFARC, 50% GFARC, and 75% GFARC increased by 7%, 7.85%, and 17.31%, respectively, under natural conditions. Under 3.5% chlorine erosion, the GFARC group increased by 4.67%, 4.83%, and 13.53%, respectively. Under 5% chlorine erosion, the GFARC group increased by 5.54%, 6.24%, and 12.64%, respectively. Glass fine can improve the bonding performance between concrete and steel bars, and its effect is related to the replacement rate. The shape and chemical characteristics of glass sand play an important role in this process and became more prominent with the deepening of the effect. Through the analysis of the experimental results, this paper further elaborated on the bonding mechanism of GFARC under the influence of chloride corrosion. The research indicates that the use of GFA has a great advantage in improving the bond performance under chloride erosion.
1. Introduction
In recent years, the types and quantity of glass products have increased each year, and the problem of waste recycling has become increasingly serious [1]. Moreover, undecomposed glass waste leads to environmental hazards and a waste of land resources [2,3].
The application of glass waste as concrete aggregate is feasible [4]. Owing to the unique chemical composition and physical characteristics of glass waste, the effect of replacing cement fine and coarse aggregates with broken glass differs. The study found that the small-particle size glass aggregate (d < 3.8 mm) had pozzolanic properties, which became more significant with the decrease in particle size [5]. So, the glass powder has good pozzolanic properties (high silicon content and high surface area) and can be used as a substitute and additive for Portland cement [6]. However, the range of replacement rates should be controlled. The use of waste glass as a partial substitute for cement and natural sand can effectively improve the mechanical properties and durability of concrete. The optimal ratio of waste glass in different ways to cement-based building materials was critically discussed. It is found that the properties of glass powder-blended cement mortar or concrete mainly depend on several factors, such as particle size, replacement level, color and type of glass, curing age, and curing temperature [5,7,8]. Glass sand is considered a potential substitute material for concrete fine aggregates owing to its multi-sharpness, high hardness, small fineness modulus, and low water absorption [1,9]. Owing to the influence of particle size and particle type, there is no unified view of the influence of glass sand on the basic mechanical properties of concrete [10]. For example, Taha showed that the addition of glass sand does not have a significant effect on the compressive properties of concrete [11]. Du reported that glass sand has a small optimization effect on the mechanical properties of concrete when the replacement rate reaches 100% [12]. However, Wang found that the changing trend of the compressive strength of concrete increases and then decreases as the replacement rate of the aggregate increases from 0% to 100%, whereas the splitting strength does not change significantly [10]. Coarse glass aggregates are unsuitable as a replacement for natural coarse aggregates because of the existence of internal microcracks and smooth surfaces [2]. In addition, a large number of studies have shown that the size of the glass aggregate has a significant effect on the ASR and that reducing the size of the aggregate can help inhibit the ASR reaction [13].
A complex working environment often has a negative impact on the concrete structure, which cannot be ignored. Chlorion penetration, which is one of the most common and serious durability factors, leads to irreversible damage to the performance of reinforced concrete structures. The damage to durability caused by chloride erosion is particularly prominent in coastal and northern areas. Chloridion enters the concrete from macro- and micro-defects through immersion, convection, and electromigration and diffuses in concrete, driven by the uneven distribution of Cl−, water diffusion, and potential gradient [14]. Therefore, the internal compactness of concrete has a decisive influence on its resistance to Chloridion penetration. It was found that the appropriate addition of a fine glass aggregate can improve the compactness and durability of concrete [4,12].
Chloride erosion can induce corrosion of the internal reinforcement, which affects the bond performance between the concrete and reinforcement, causing damage to the reinforced concrete structure. The accumulation of rust on the surface of the steel bars leads to a slight increase in the bar volume, which gives additional radial pressure to the surrounding concrete and enhances the clamping of concrete to the bars [15]. In addition, the surface roughness of the steel bars is further improved. Therefore, the bond strength of the reinforced concrete improves slightly in the early stages of reinforcement corrosion [16]. According to Tondolo, it reaches its peak value when the reinforcement corrosion rate is approximately 2% [17]. However, the radial pressure causes the annular tension of concrete to exceed the limit when the rust accumulates to a certain extent, which eventually leads to cracking of the concrete cover [18]. In addition, corrosion of the reinforcement weakens the transverse ribs of the deformed reinforcement. Auyeung found that the bond strength deteriorates significantly when the steel corrosion rate reaches 5.2% [19]. Fang also reached the same conclusion when the steel corrosion rate was 6% [20]. When the steel bar and concrete slide relative to one another, the bond performance depends on the dynamic friction of the contact surface between the steel bar and concrete and the mechanical interlocking between the concrete and transverse rib. Thus, the aggregate characteristics also have a significant influence on the bond performance of reinforced concrete [21]. Fine glass aggregates have sharp edges and high hardness, which can improve the mechanical interlocking and friction between the concrete and reinforcement [10].
To sum up, the existing research mainly focuses on the durability (such as chloride corrosion and freeze-thaw cycles) and mechanical properties (such as compressive strength and tensile strength) of glass fine aggregate concrete (GFAC) [22]. Therefore, although the research on GFAC has become more and more perfect in recent years, the research on the bonding performance of GFARC is still insufficient. The discussion on the bond behavior of GFARC is still in the blank stage in a complex environment. The pozzolanic characteristics and low water absorption of glass sand help it to easily react with alkaline substances in concrete to form cementitious polymers. The hydration reaction is more complete, which can optimize the compactness. The positive effect of glass sand is greater than the negative influence on bond behavior. The addition of glass sand delayed and extended the positive effect of the chloride ion on bond strength, rather than weakened the effect. And the use of glass sand can magnify the positive effect of chloride ion erosion. Based on the existing research on GFAC, this paper starts with the influence of chlorine salt erosion and glass sand replacement on the bonding performance of reinforced concrete, summarizes the advantages and disadvantages of GFARC, and deeply discusses the bonding mechanism of GFARC in this environment. Therefore, this paper is a preliminary exploration in the research field of the bond performance of GFARC in complex environments and has reference significance for the application of GFARC in complex environments.
2. Experimental Procedure
2.1. Materials
The concrete mixtures (C30) used in the pull-out specimens were made using ordinary cement conforming to IS 8112-1989 [23]. The graded macadam (maximum aggregate diameter = 20 mm) was used as the primary coarse aggregates, and river sand (maximum aggregate diameter = 5 mm and fineness modulus = 2.65) was used as the primary fine aggregates. Crushed glass sand (maximum aggregate diameter = 5 mm, fineness modulus = 2.55, and continuous grading) was used as the alternative fine aggregate, which was obtained from the secondary crushing of waste glass during the production process. A deformed steel bar (diameter = 16 mm, yield strength = 460 MPa, and elastic modulus = 2 × 10⁵ MPa) was selected as the test bar. The water–cement ratio (w/c) across all mixtures was nominally kept equal to 0.54. The broken glass aggregate is sieved and replaced by a part of fine aggregate with the same quality, and the dosage is set at 0%, 25%, 50%, and 75%. The preparation of GFAC is shown in Table 1.

Table 1.
Concrete mixture proportions.
2.2. Items of Investigation
2.2.1. Chloride Erosion Tests
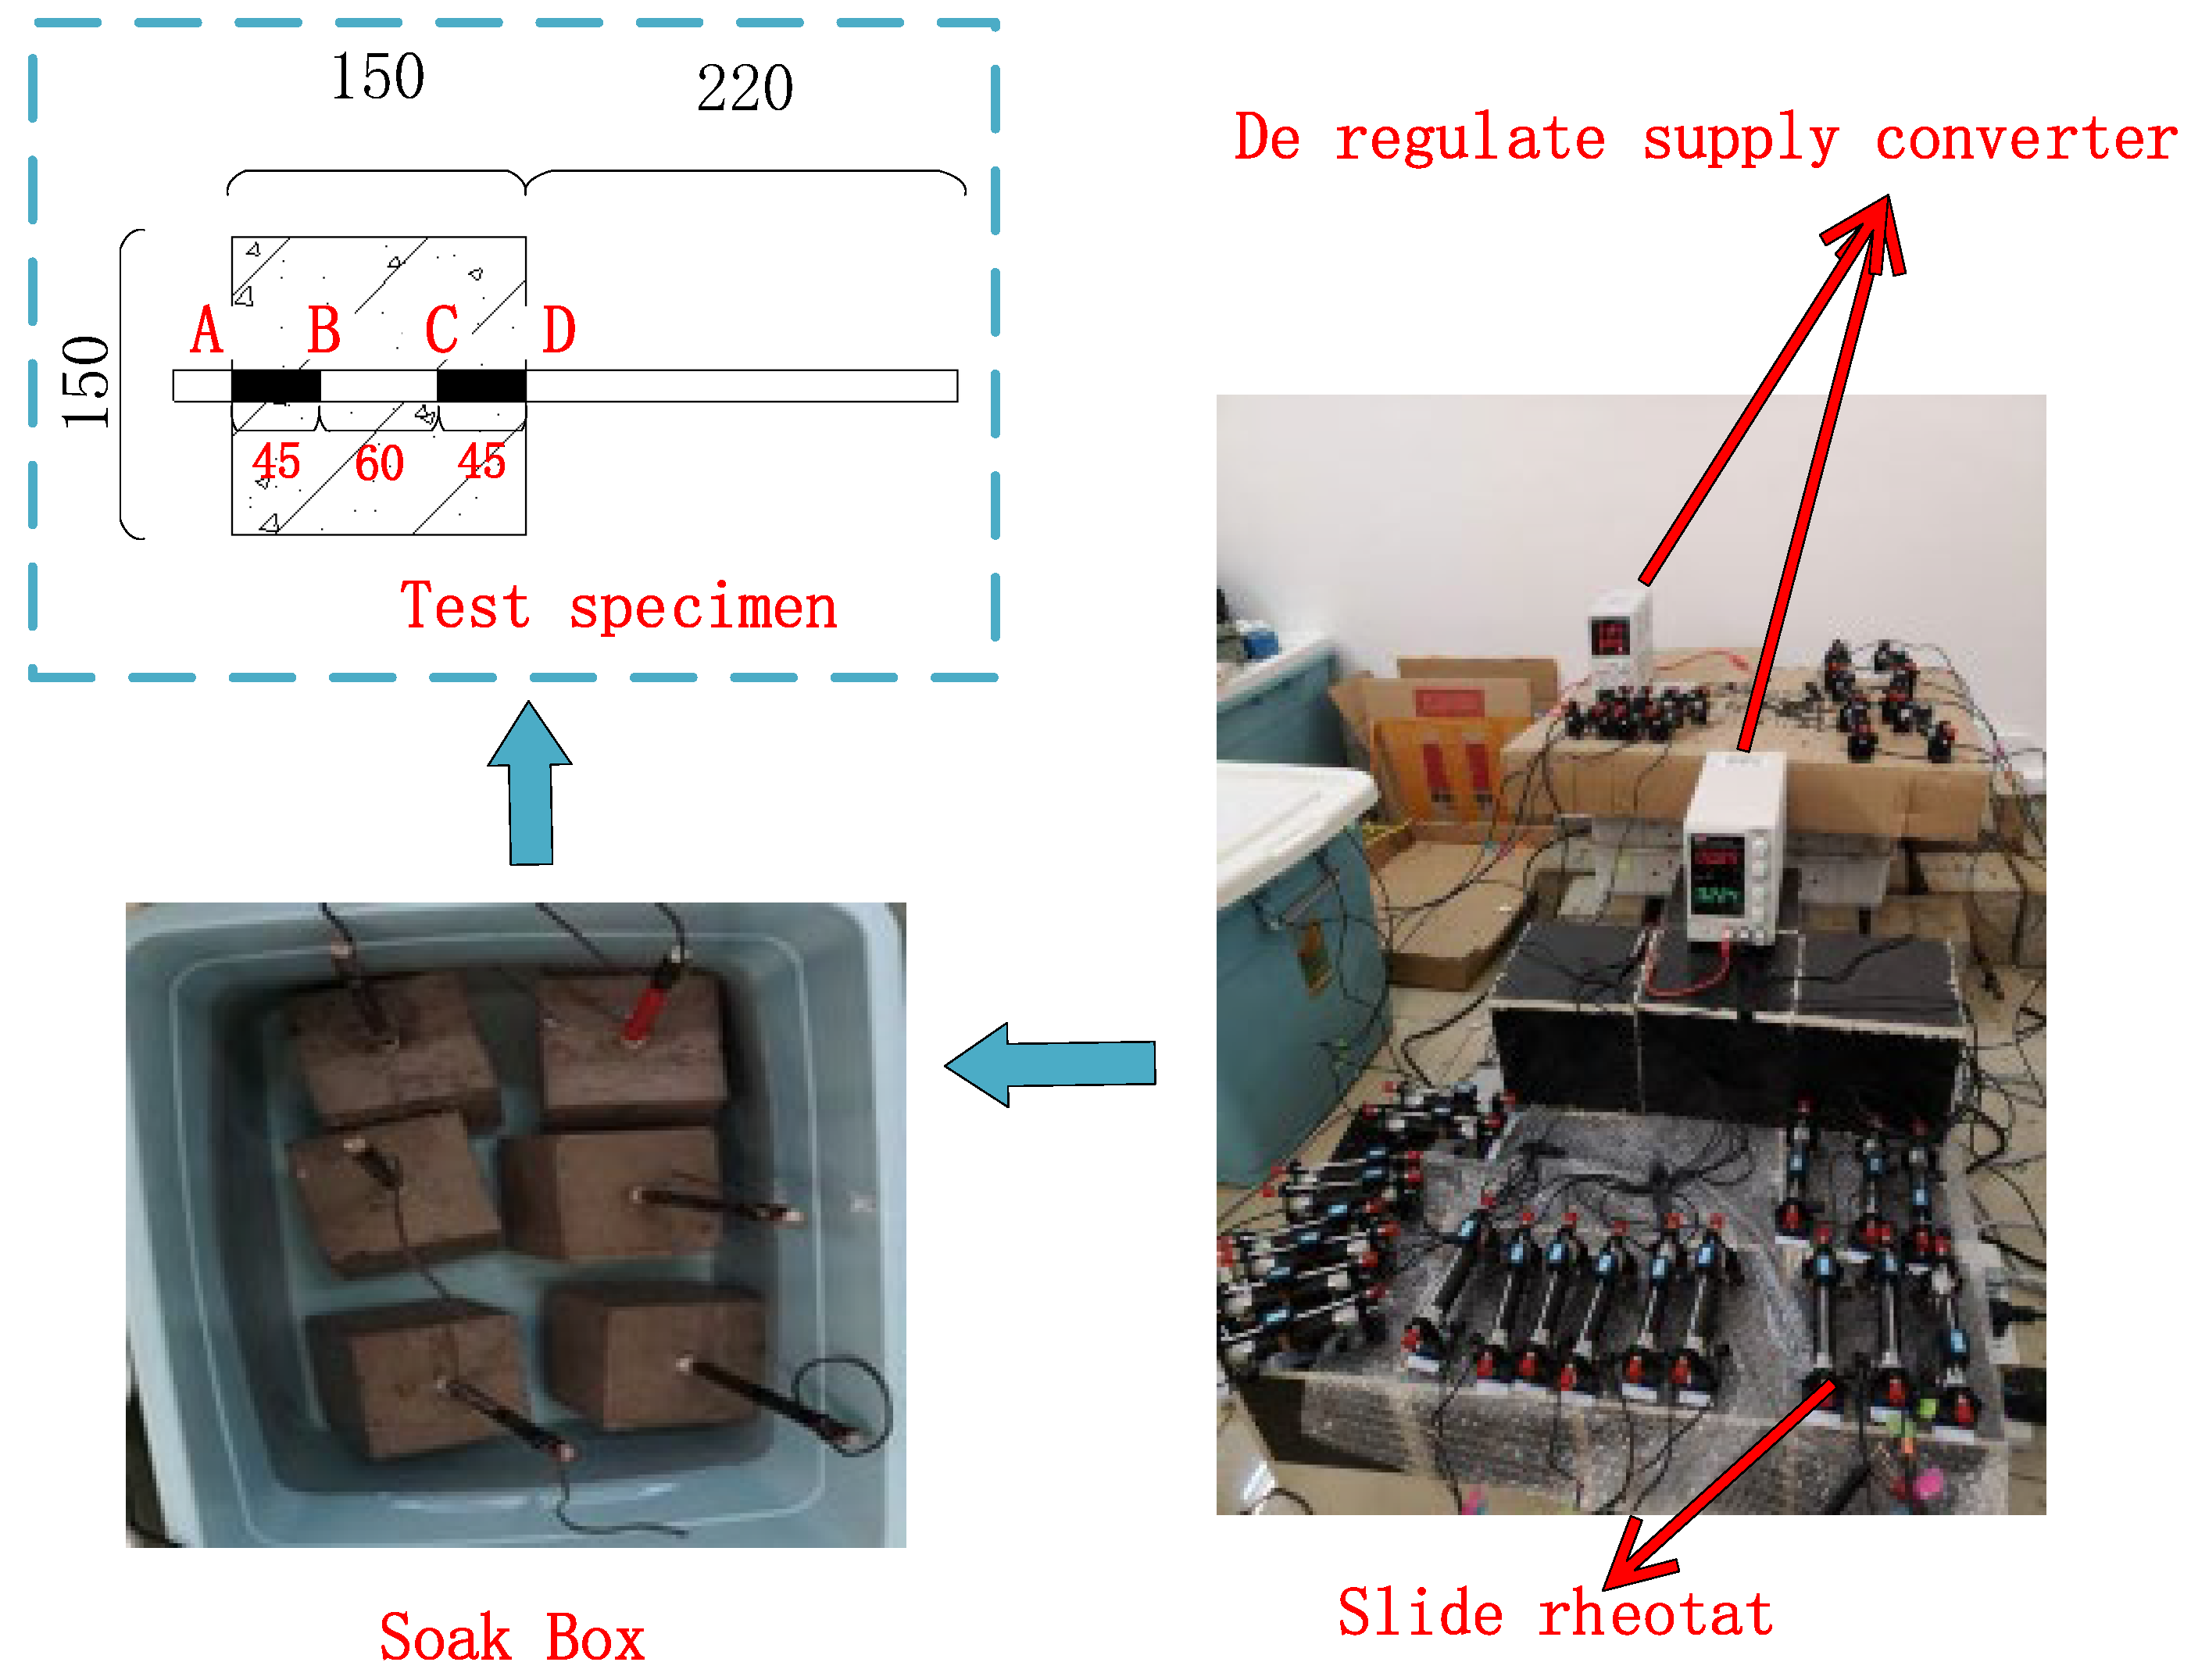
The accelerated wet electrified method is used as the chloride erosion test, as shown in Figure 1. A pad is added to the bottom of the concrete test block so that the bottom of the concrete is exposed to the sodium chloride solution and the bottom of the steel bar is not exposed to the solution. The exposed steel bar is sealed with glass glue, and one end of the wire is welded to the steel bar, and the other end is led out and connected to the DC power supply. To prevent the influence of disorderly current on the test process, all test blocks and sodium chloride solution in this test are placed in a plastic basin, and current loss can be avoided at the same time. By combining a universal meter with a sliding rheostat, the regulated power supply and sliding rheostat are adjusted to the appropriate gear to ensure that the current density is stable at 0.8 ma/cm2. Dry concrete has a large resistance, and the power process is prone to exceeding that range. Therefore, before the test began, the specimen was soaked in a 15% sodium chloride solution for three days to make the solution fully enter the pores of the concrete and reduce the resistance of the concrete. After soaking, the concrete test block is placed in the solution, and the steel bar that needs to accelerate corrosion is connected to the DC power anode through a wire; The stainless steel bar is connected to the DC power supply cathode and placed in the sodium chloride solution. To avoid overrange, first adjust the DC power supply voltage to the maximum range, adjust the current to the minimum range, and then turn on the switch and slowly fine-tune to the design voltage. Owing to the accumulation of rust, the electric resistance of the specimen is in a state of change. Thus, the electric current through the specimen is measured regularly during the test, and the sliding rheostat is adjusted to ensure that the electric current cannot fluctuate over a large range.
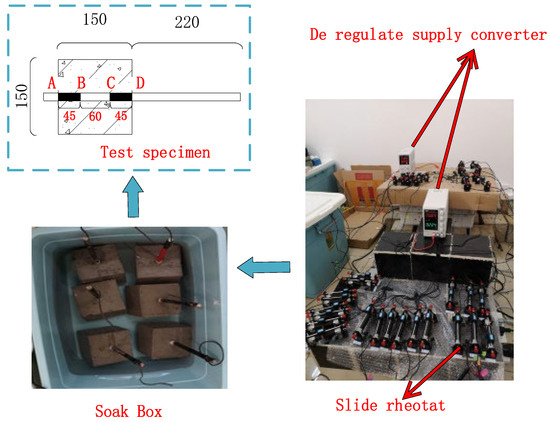
Figure 1.
Circuit connection diagram.
2.2.2. Center Pull-Out Tests
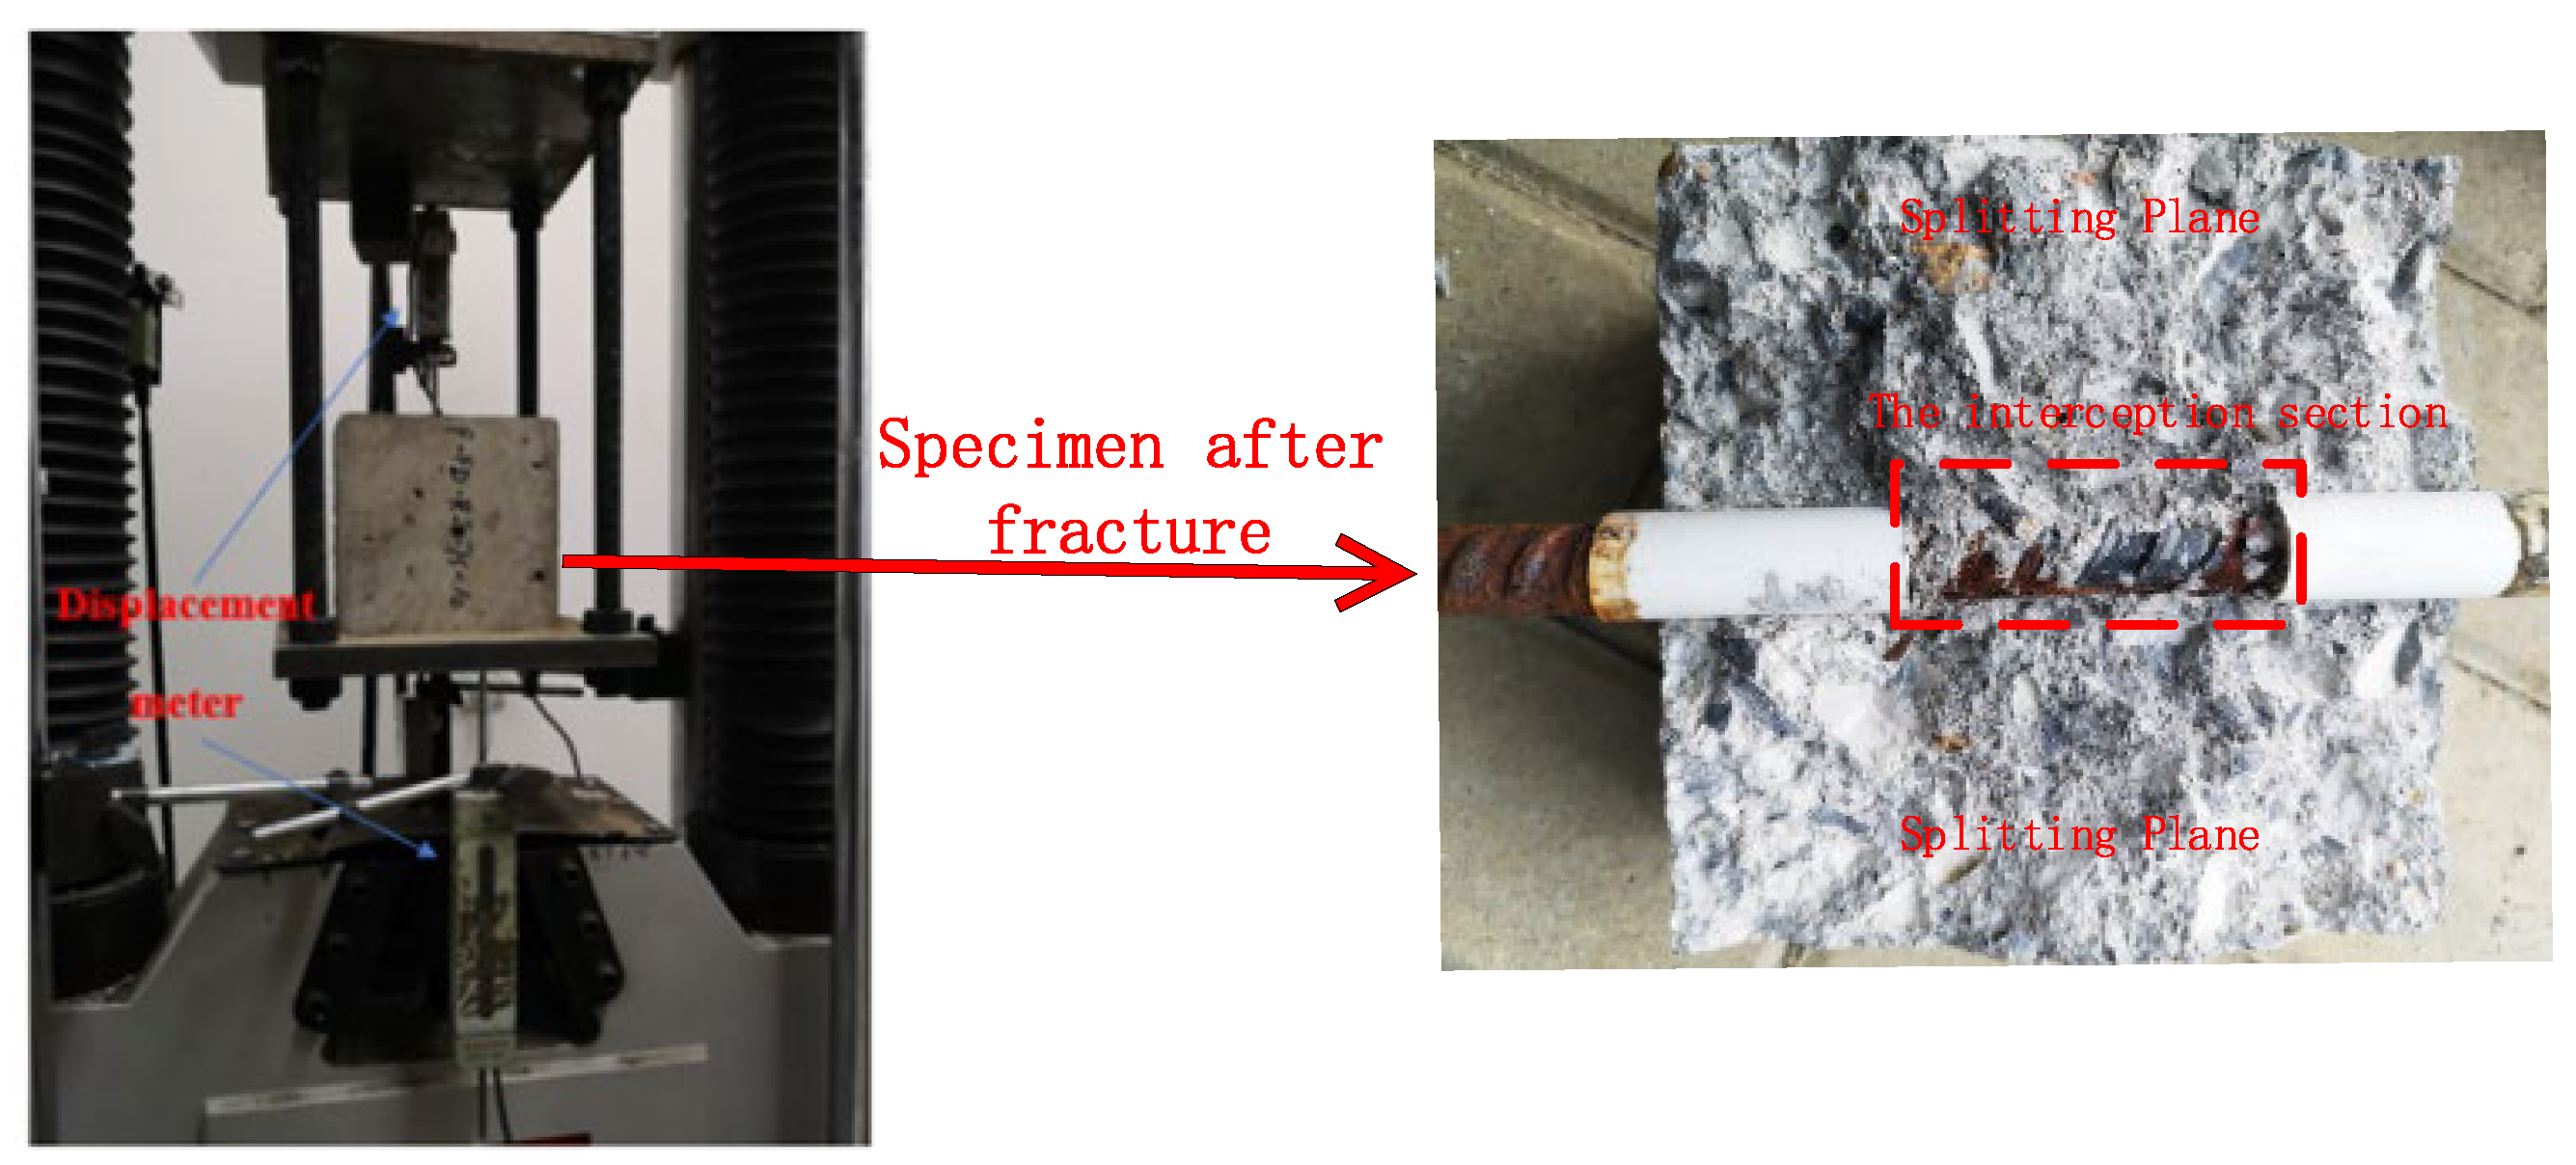
A pull-out test method was adopted for the bond performance test. The device was a WAW-600C electro-hydraulic servo universal testing machine (BEJING TIME HIGH TECHNOLOGY CO., Beijing, China), and the test steel jig (counterforce frame) was composed of upper and lower steel boards, threaded rods, and matching nuts, as depicted in Figure 2. The recommended loading rate was 0.1 kN/s, and the test data were collected using a DH3816 static strain test system.
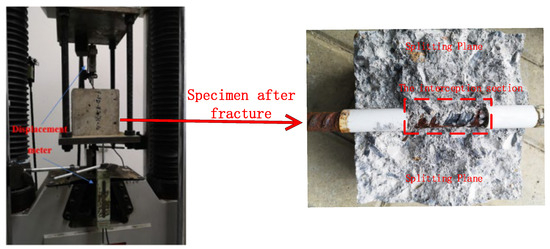
Figure 2.
Schematic diagram of the center pull-out test device.
3. Experimental Results and Discussion
3.1. Chloride Erosion Test
Corrosion Rate of Reinforcement
In this paper, the concrete pavement in winter in China is subjected to ice and snow disasters all year round, and the use of deicing salt causes erosion damage to the pavement. Different concentrations of deicing salt (3%, 5%, and 7.5%) are selected as the test environment category. The steel corrosion rate was measured using the weighing method. The change in steel quality before and after rust removal was used as the measurement index. After the pull-out test, the corroded steel bars were removed from the failure specimens and cut off. The bonded steel bars were used as the test objects.
First, the residual concrete was removed from the surface of the corroded steel bar. Second, the corroded steel bar was placed in the rust remover for acid pickling. After the rust on the steel bar surface was cleaned, the test object was transferred to the neutralization solution (Ca(OH)2). After 10 min, the steel bar was removed and washed with clean water.
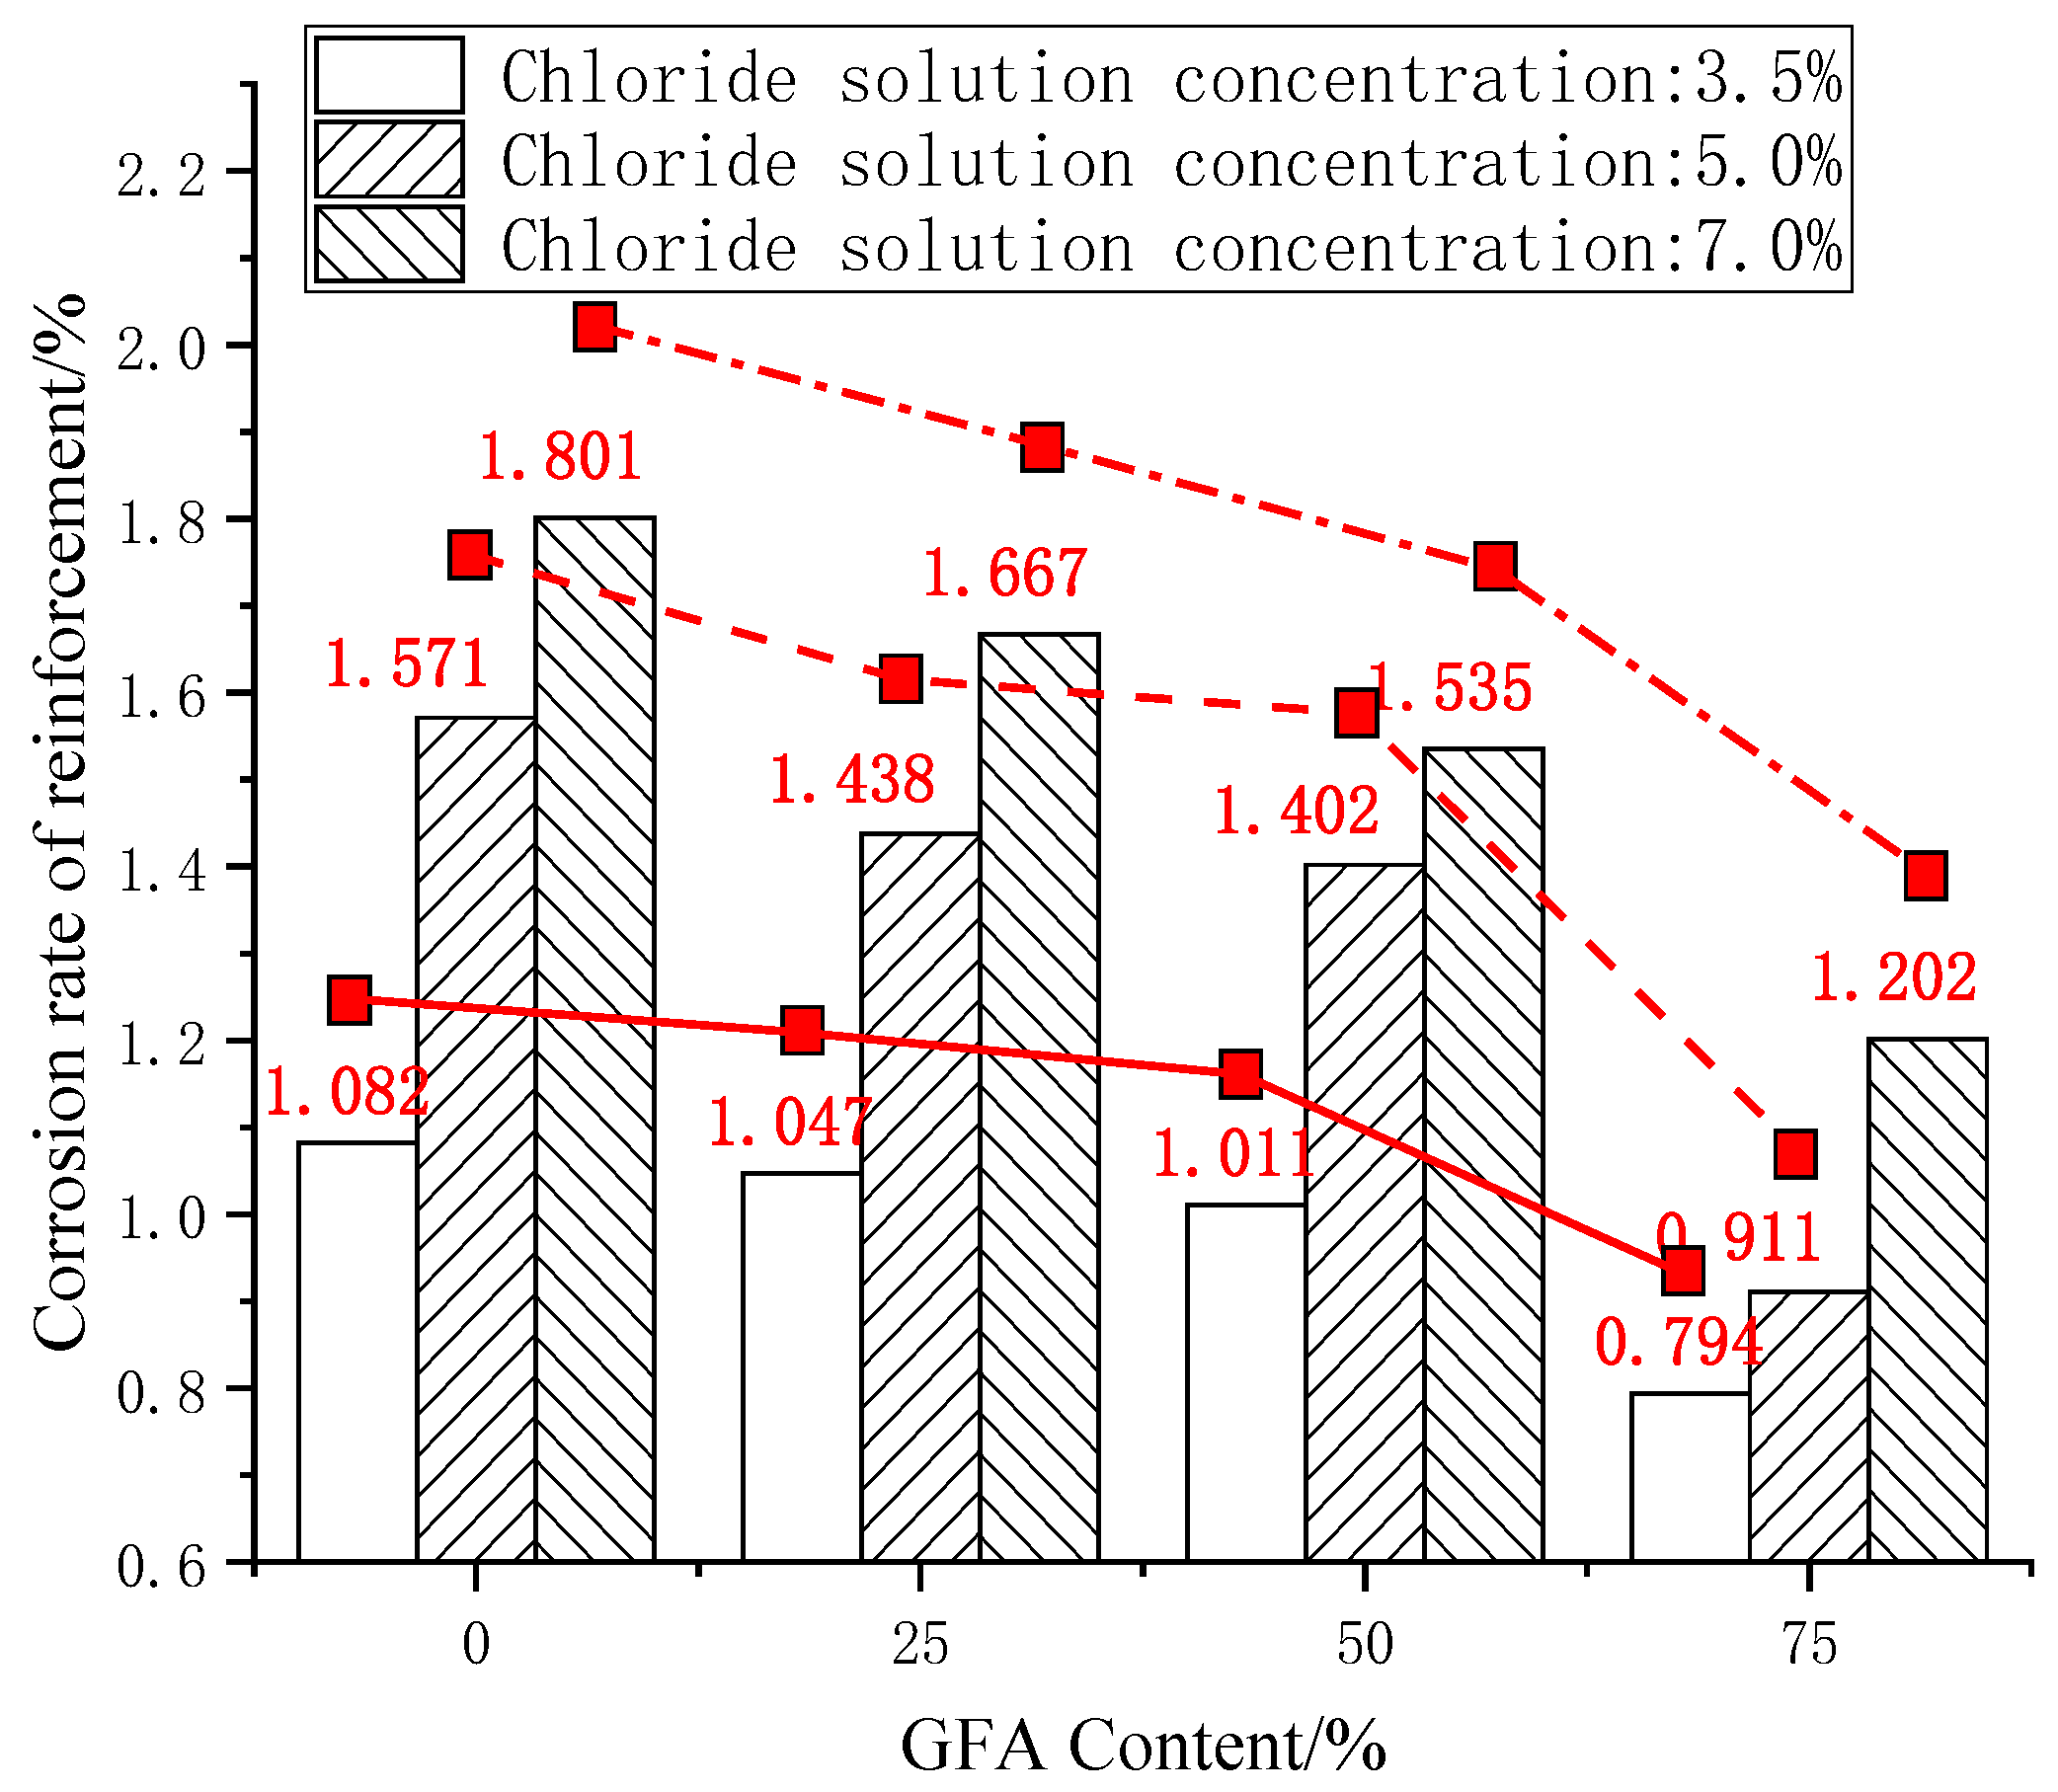
The steel bar corrosion rate γ of each test group was calculated according to (1). The results are shown in the histogram in Figure 3.
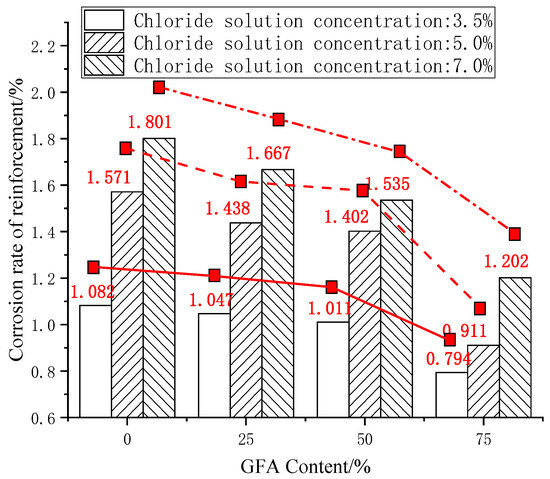
Figure 3.
Comparison of reinforcement corrosion rates.
As shown in Figure 3, the corrosion rate of the reinforcement decreases with the replacement, while the rate of fine aggregate increases, which shows a nonlinear downward trend. The corrosion degree of the steel bars in the GFARC is lighter than that in the NARC. This phenomenon shows that the use of glass sand affects the invading ability of chloride ions in concrete. In a chloride environment, the compactness of the concrete structure is one of the main factors affecting the corrosion of reinforcements under chloride corrosion. Therefore, it is preliminarily concluded that the use of glass sand is helpful to improve the compactness of concrete. For instance, the study by Kim found that the low water absorption of the glass sand ensured the complete hydration reaction in concrete [4]. Meanwhile, the small-sized glass sand particles with a rich Si content show pozzolanic characteristics, which improve the compactness of the concrete [5].
3.2. Center Pull-Out Test
3.2.1. Failure Mode Analysis
The failure modes of the central pull-out tests of the test groups under different chloride concentrations are listed in Table 2. When the chloride concentration was low, the failure mode of each test group was mainly a splitting failure. The frequency of a splitting failure decreases with an increase in the chloride solution concentration. Based on this phenomenon, it can be preliminarily inferred that chloride intrusion into concrete has an impact on the contact surface between reinforcement and concrete.
Table 2.
Failure modes of specimens under chloride corrosion.
3.2.2. Bond-Slip Curve
- (a)
- Test data processing
In this study, the widely accepted bond force assumption is adopted, in which the bond force between the reinforcement and concrete is evenly distributed along the interface of the anchorage section. Based on this assumption, the bond strength of each experimental group was calculated using Equation (2).
The measurement of the slip value of the reinforcement in the anchorage section adopts the alternative point measurement method, as shown in Figure 1. During the loading process, the deformation of the steel bar at the free end is slightly smaller. The slip value measured at A can be replaced by B (SLB). If the slip value at C is replaced by the slip value at D, the axial deformation of the steel bar at the CD section should be eliminated. The calculation of the axial phase variable of the reinforcement (ΔSL) is shown in Equation (3). The actual slip (SLC) at C can be calculated according to Equation (4), and the average relative slip of reinforcement in the anchorage section can be calculated according to Equation (5).
- (b)
- τ–s curve
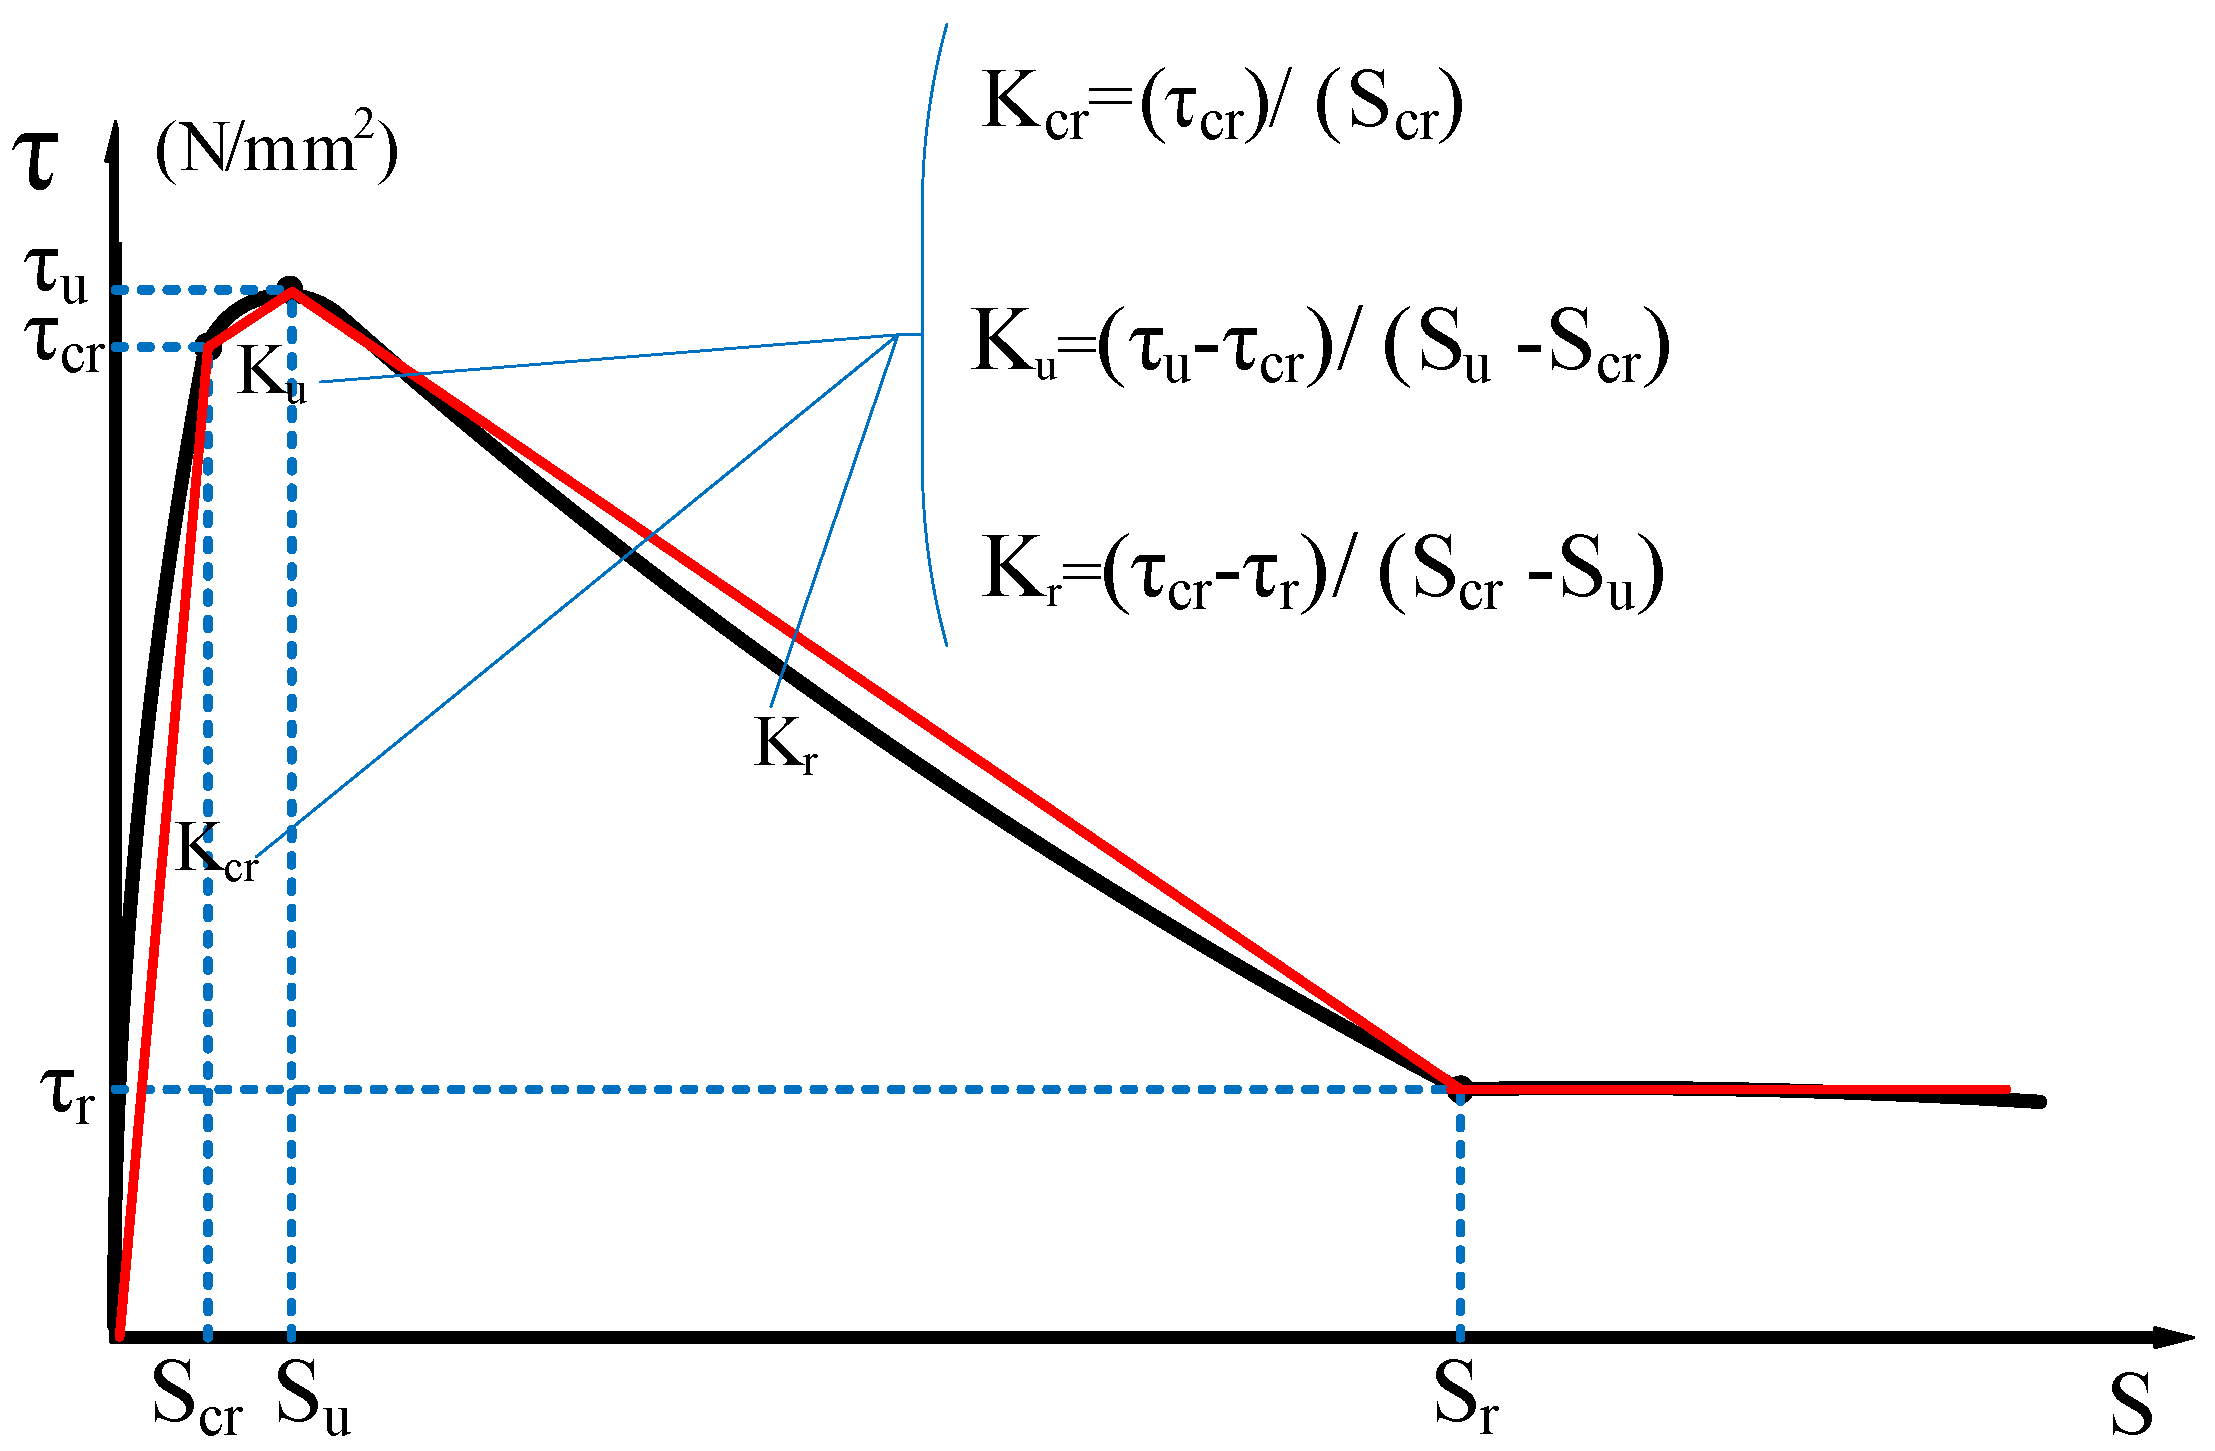
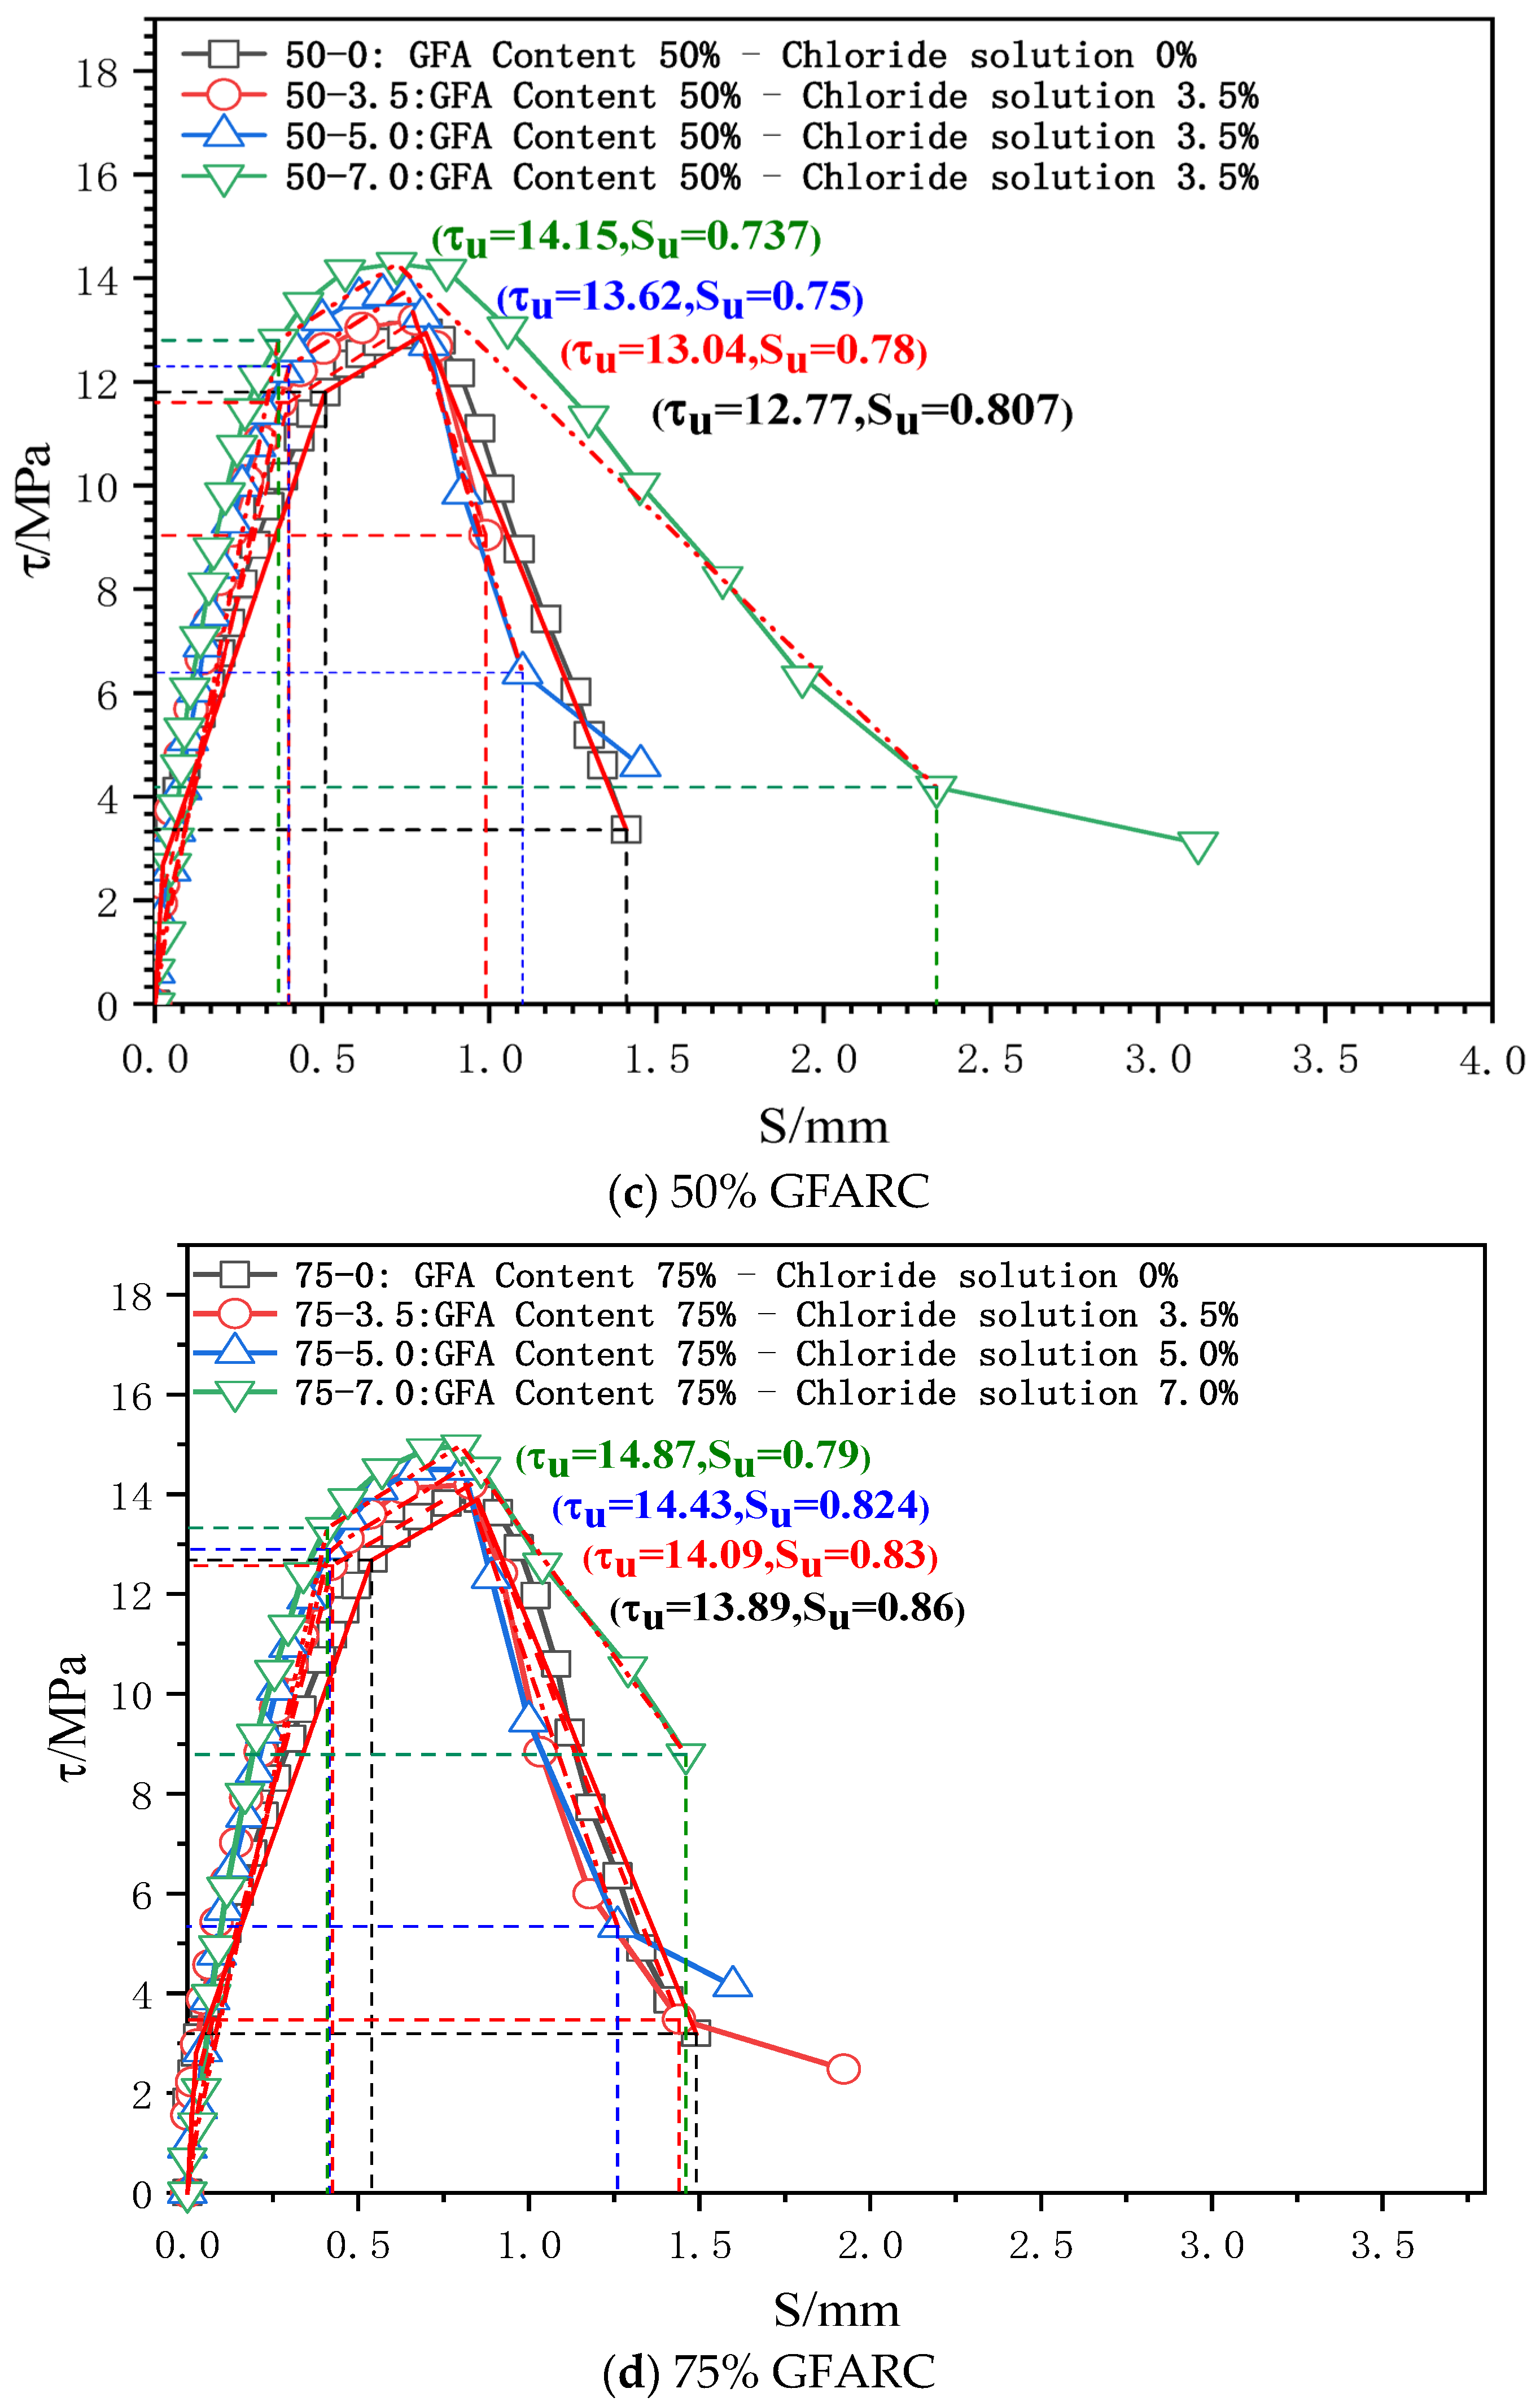
The characteristic points (τs, SS), (τcr, Scr), (τu, Su), and (τr, Sr) are used to divide the τ–s curve into a microslip section, an internal crack slip section, a splitting section, a descending section, and a residual section. The secant modulus between the characteristic points of the τ–s curve is the bond stiffness of each stage (Kcr, Ku, and Kr are the internal crack slip stiffness, splitting slip stiffness, and descending section stiffness, respectively), as shown in Figure 4 [24]. Taking the τ–s curve model proposed by Xu [25] as a reference, the τ–s curve of each group is shown in Figure 5.
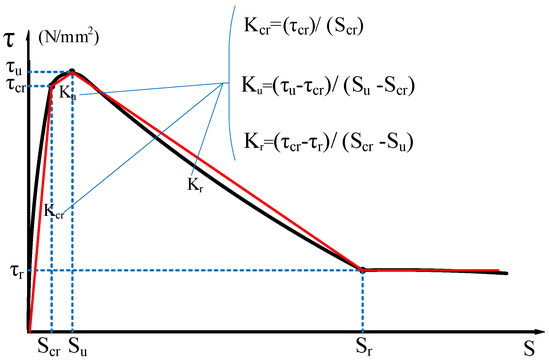
Figure 4.
Bond characteristic curve of reinforced concrete.
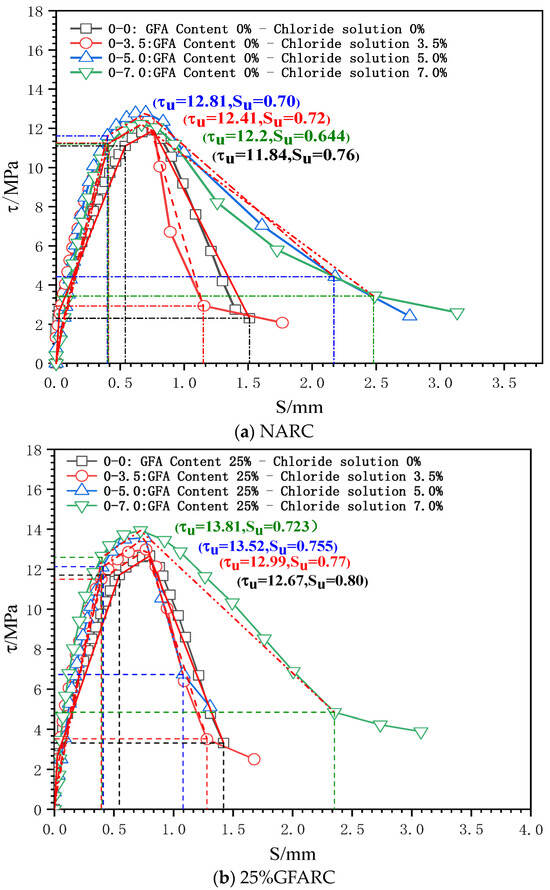
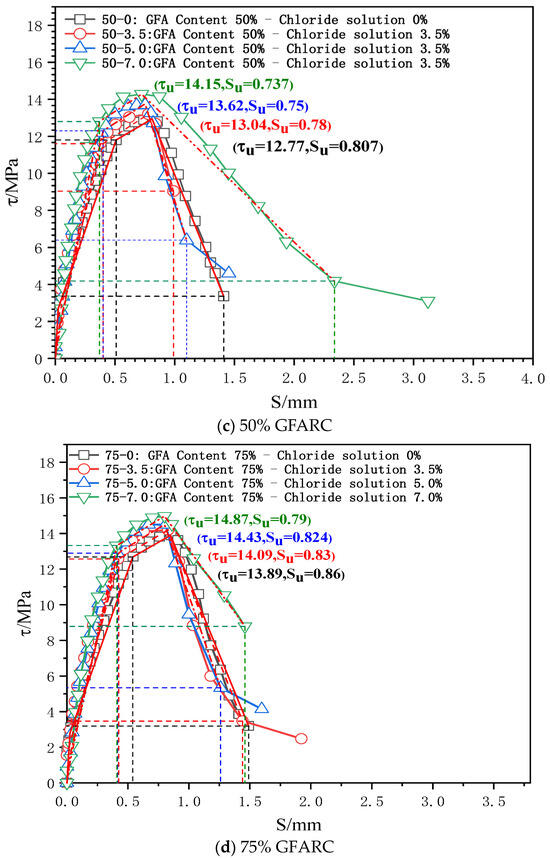
Figure 5.
τ–s curves of the test group under chlorine salt erosion.
0 < S ≤ SS (microslip stage): With the occurrence of a relative slip, the adhesive force provided by the chemical adhesive force gradually decreases, but a relative slip at the free end does not appear. Thus, the τ–s curve develops linearly. However, the microslip stage of each experimental group gradually decreases as the chloride concentration gradually increases. This phenomenon confirms that chloride ion intrusion has a deterioration effect on the contact surface between reinforcement and concrete.
SS < S ≤ Scr (internal crack sliding stage): When the relative sliding between the steel bar and concrete spreads to the free end, the friction and mechanical interaction completely replace the chemical adhesive force. The mutual extrusion between the steel bar transverse rib and concrete becomes increasingly obvious, which promotes the development of an inclined crack in the rib top. The τ–s curve enters the nonlinear development stage.
As the chloride concentration increases, the Kcr of the GFARC group increases gradually, whereas the NARC group shows a trend of first increasing and then decreasing. From this phenomenon, it can be inferred that chloride ions have an optimal effect on the reinforced concrete contact surface at this stage. Moreover, the glass sand inside the concrete further magnifies the influence.
Scr < S ≤ Su (splitting stage): When the loading gradually approaches the peak point, the inclined crack expands rapidly, and the mechanical bite teeth are crushed one after another. Although concrete debris has a blocking effect, the bond stiffness decreases significantly.
The ultimate bond strength increases with an increase in chloride concentration from 0% to 5%. When the concentration was 7%, the ultimate bond strength of the NARC test group decreased, which was different from that of the GFARC test group. From this phenomenon, it can be inferred that mild (suitable concentration range) chloride erosion is helpful to improve the bonding performance between reinforcement and concrete. But the addition of glass sand can lead to the expansion of the suitable concentration range, in which the chloride ion has a positive effect on bond properties.
Su < S (descending section and residual stress): After the peak point was exceeded, the restraint effect of concrete on the reinforcement decreased significantly, and only the rest of the restraint effect continued. The τ–s curve entered the descending section.
3.3. Bond Performance Analysis of GFARC
3.3.1. Ultimate Bond Strength
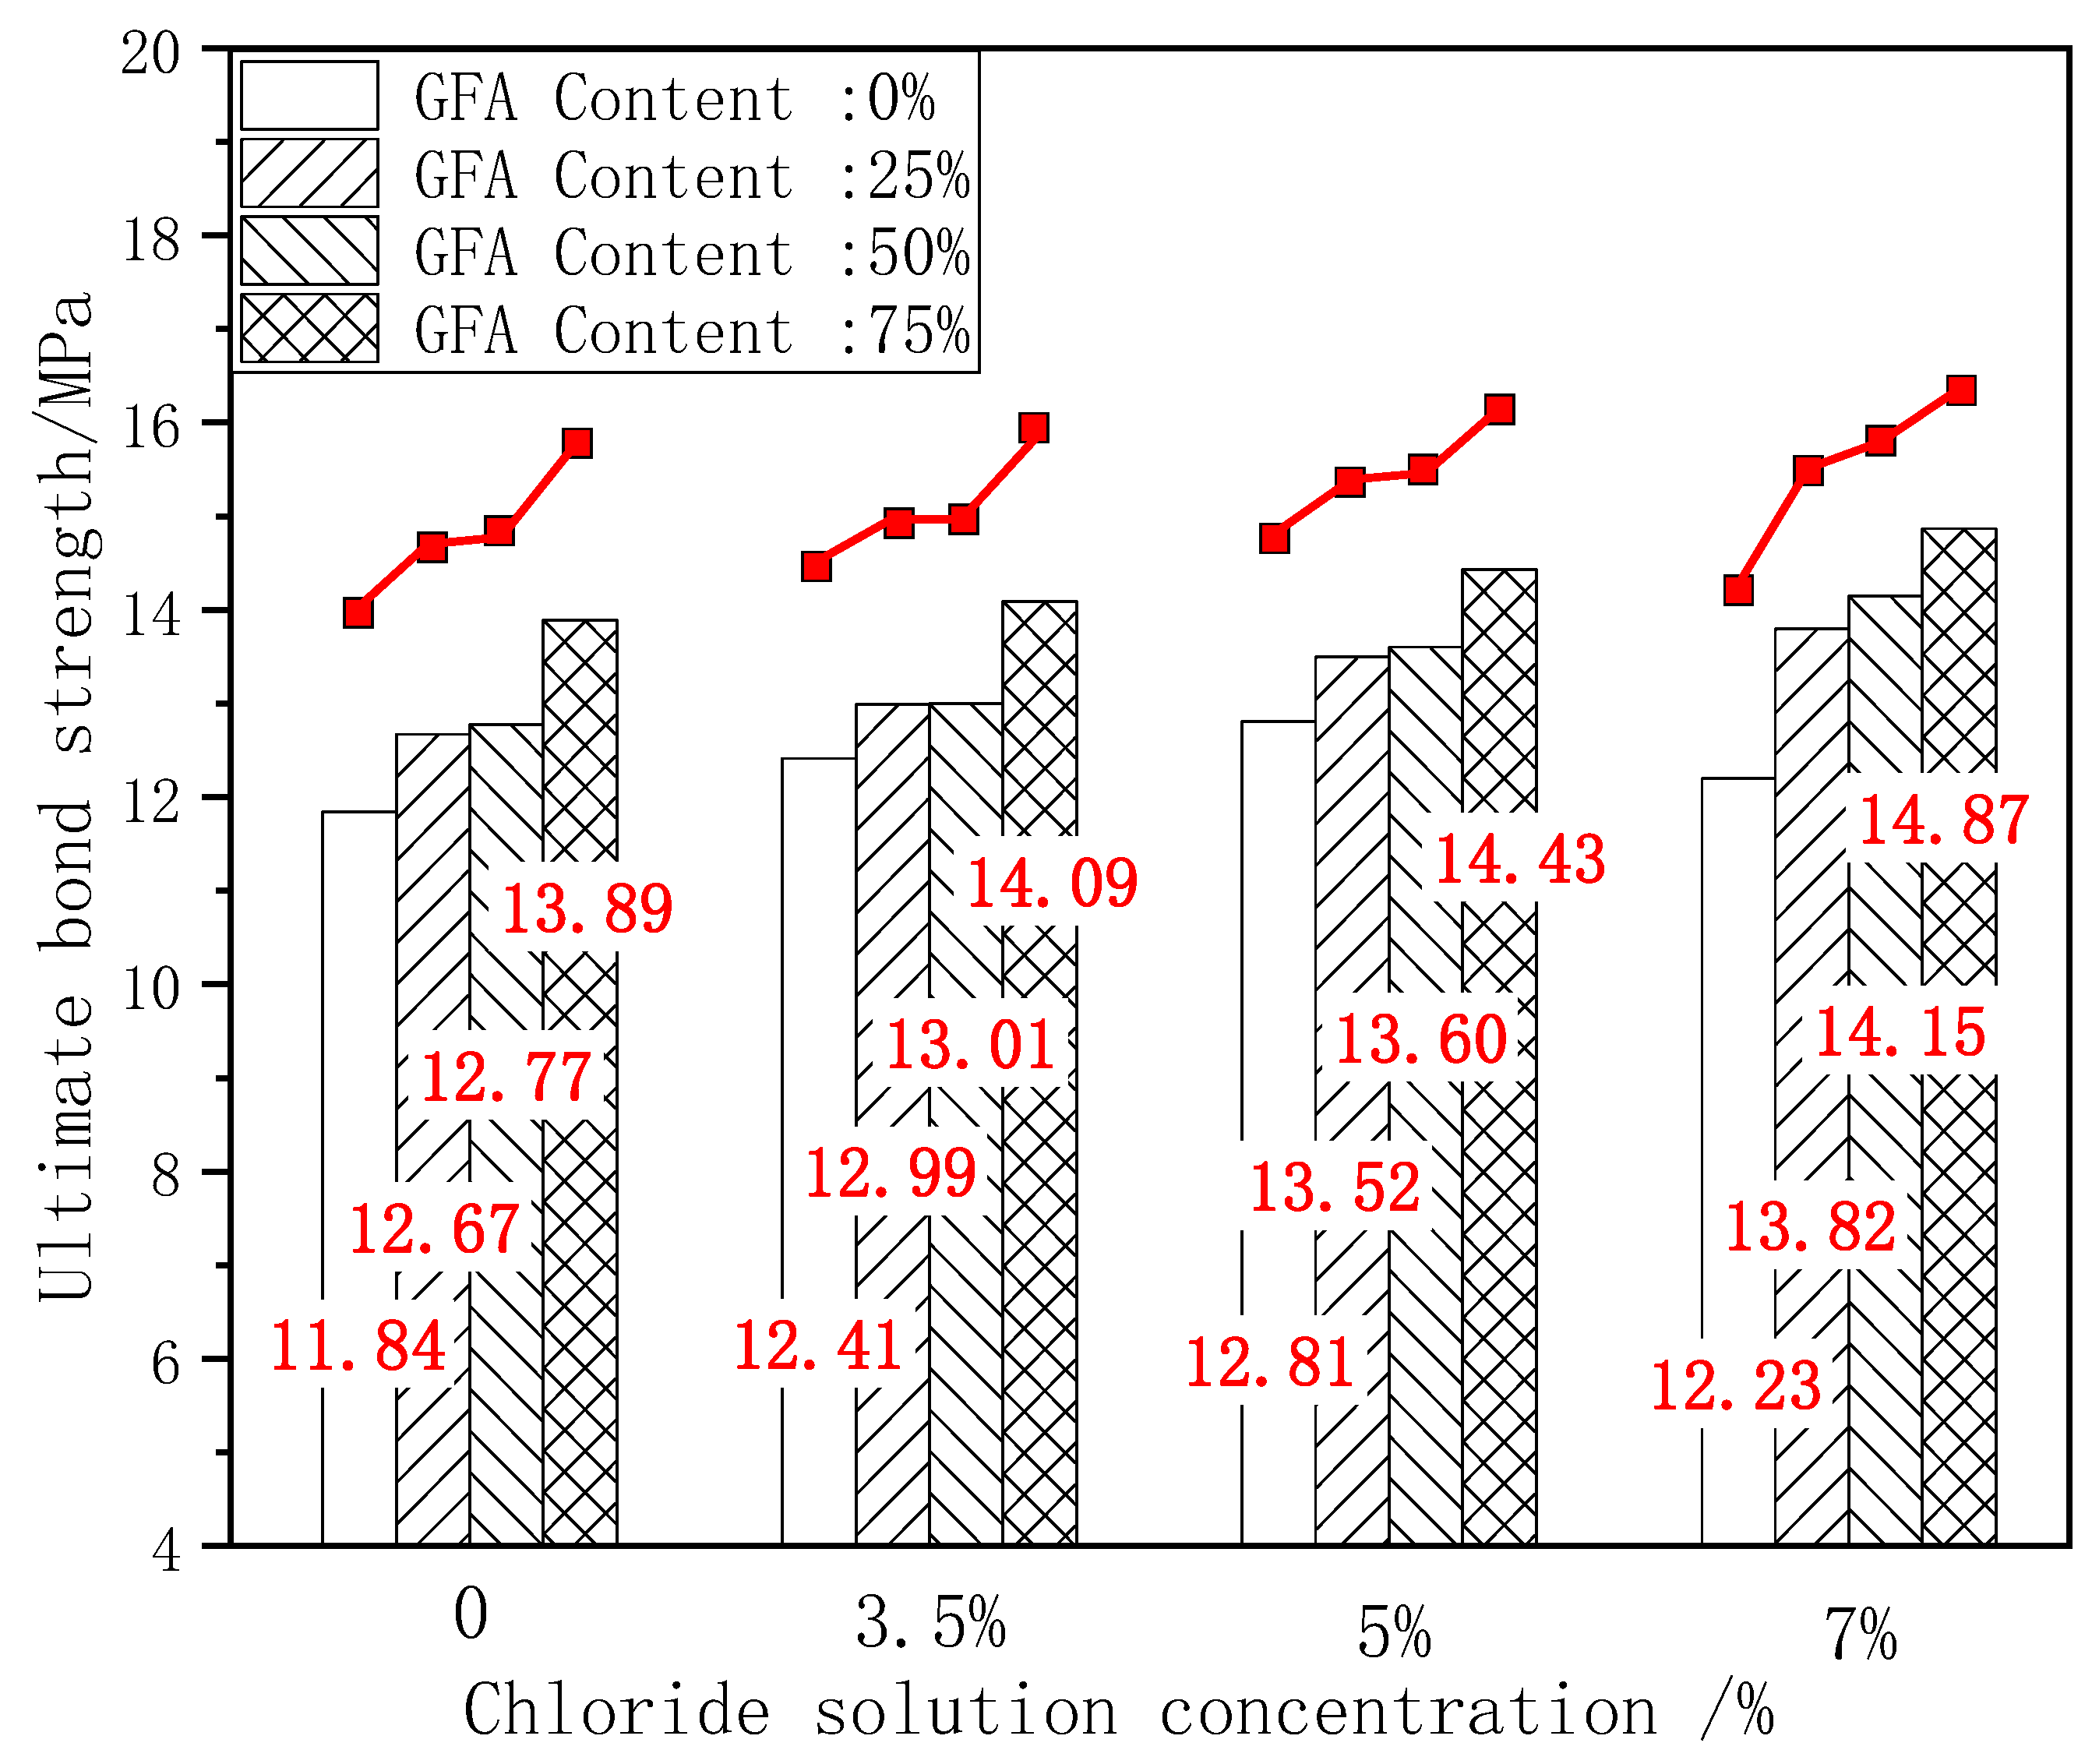
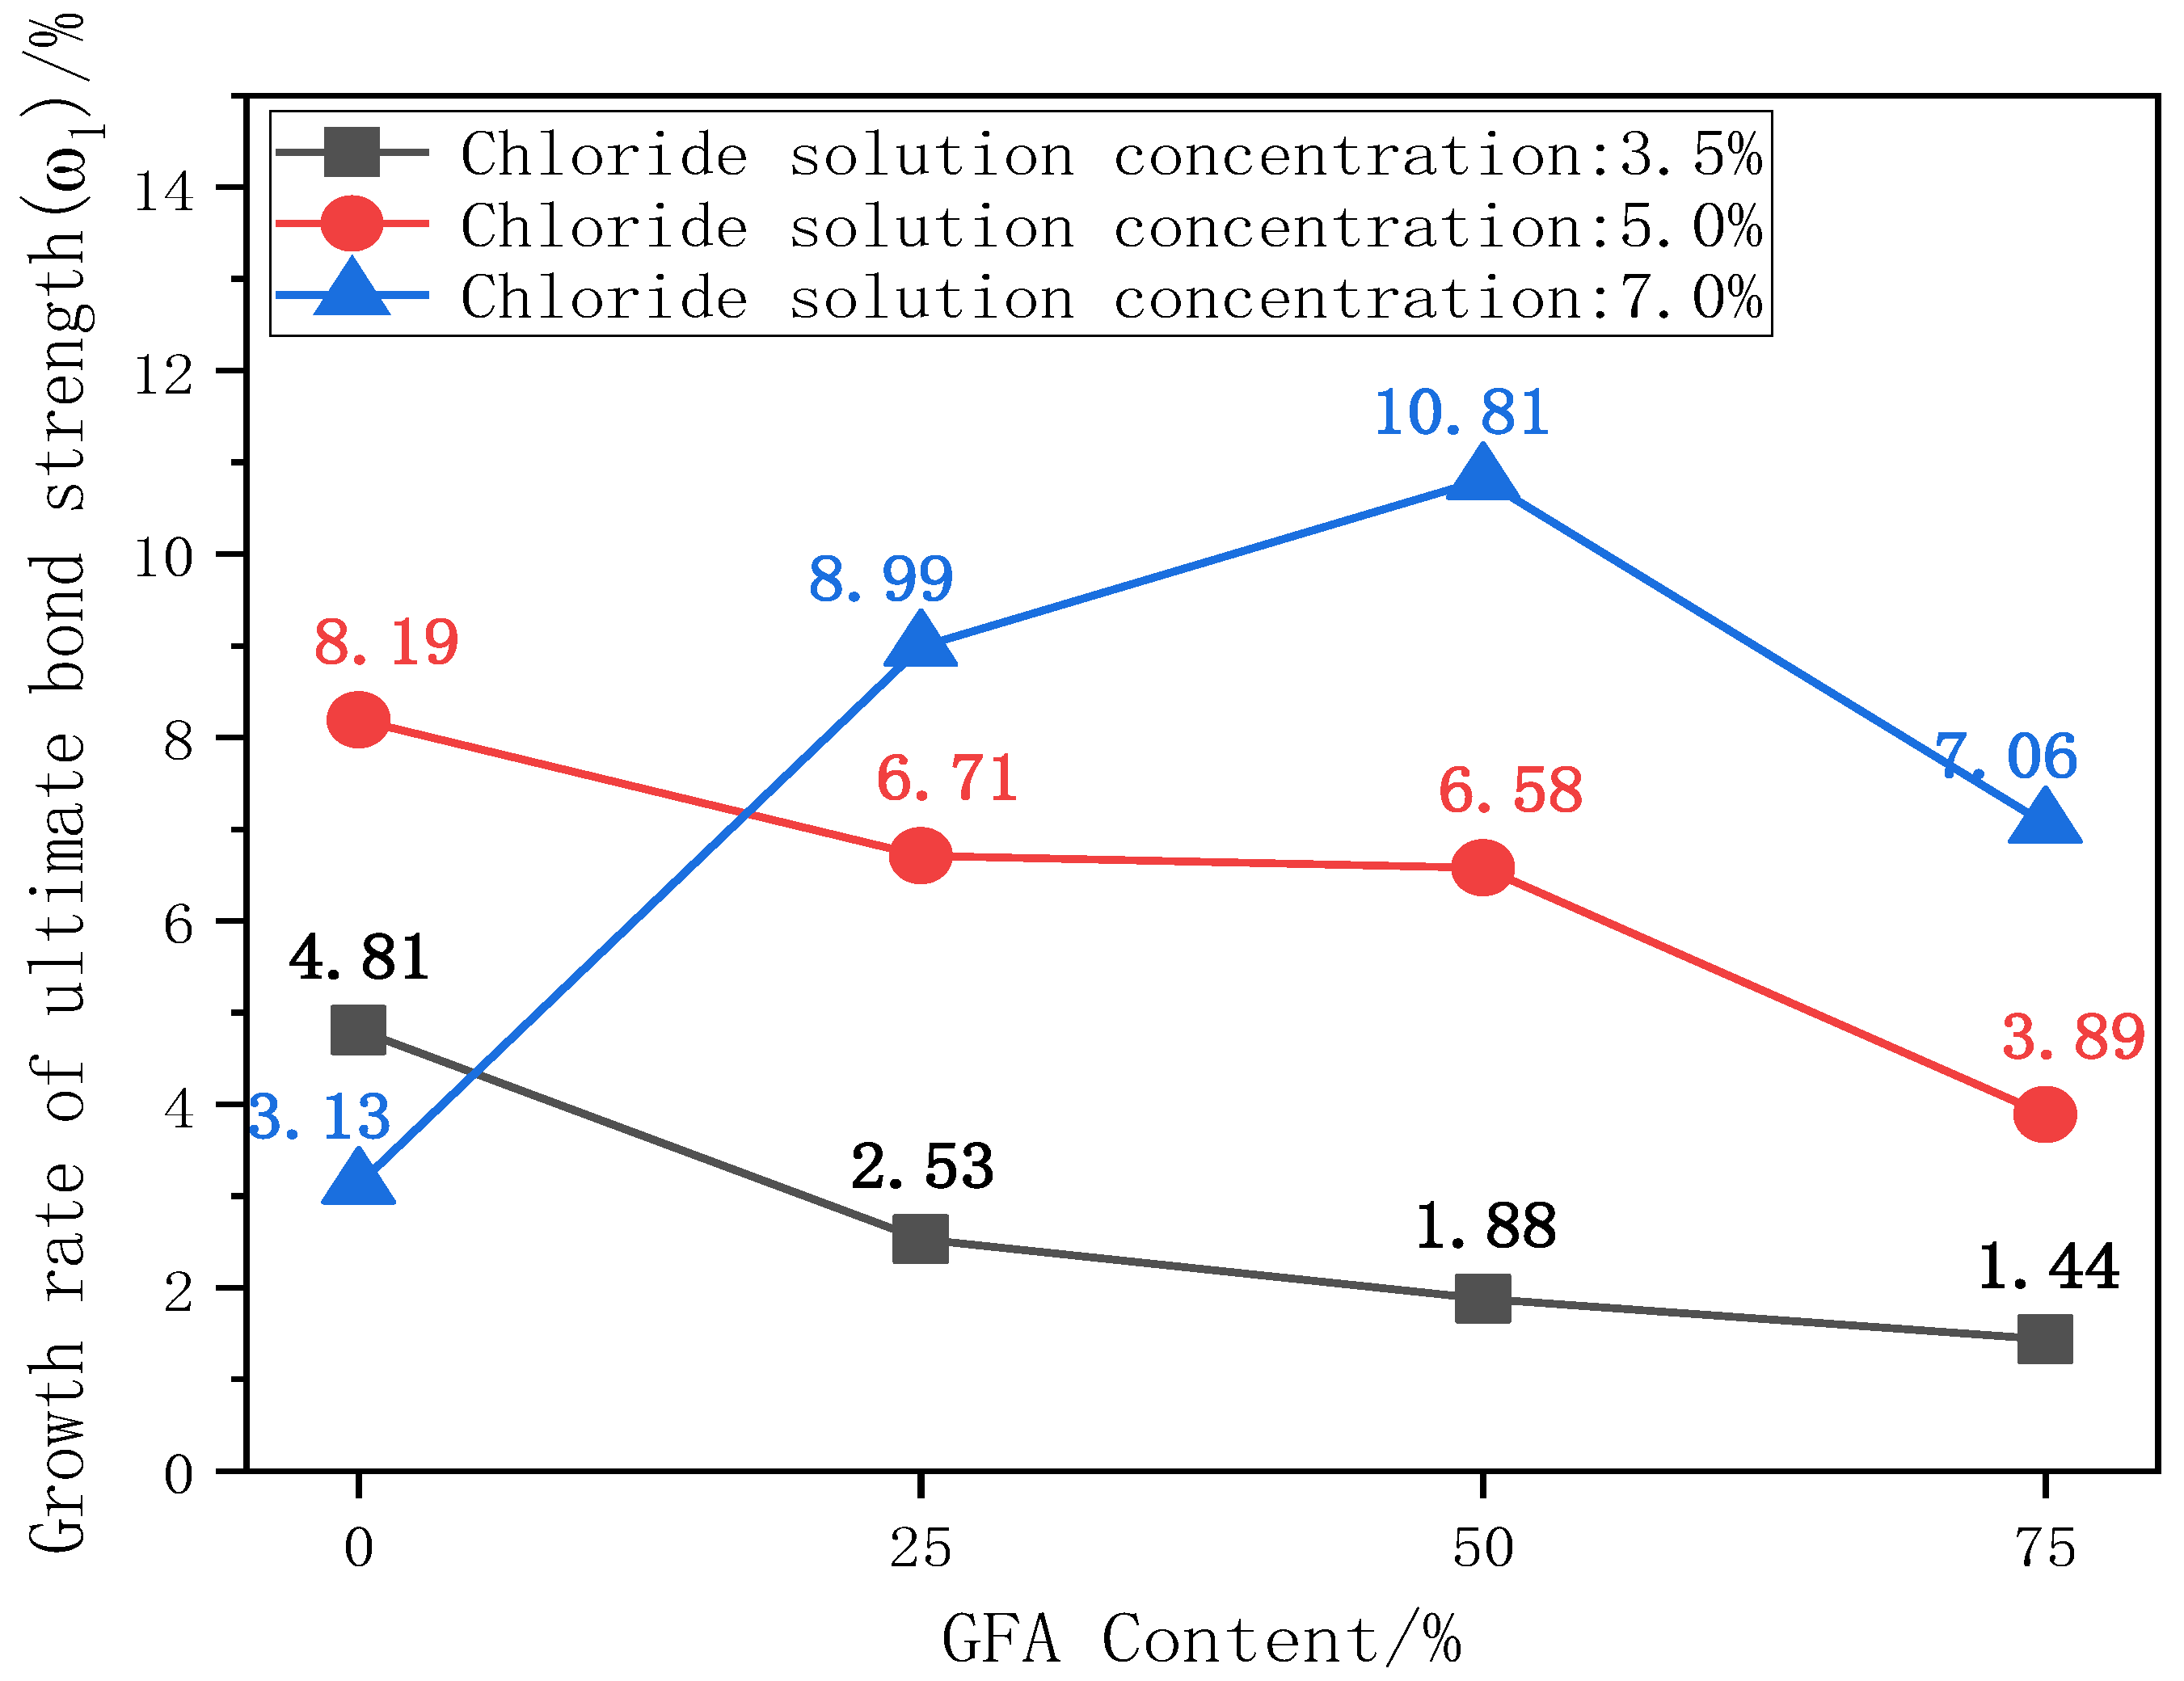
The ultimate bond strength directly affects the service life and safety of the material [10]. The existence of the bond force is the basis for the joint action of steel and concrete. The ultimate bond strength is the peak stress during the test. The change in bond strength can reflect the degree of influence of various factors on bond performance. Figure 6 shows the comparison histogram of the ultimate bond strength of each test group under different chloride concentrations and the change curve with the aggregate replacement rate. Figure 7 shows the change curve of the ultimate bond strength growth rate ω1 of each test group with the aggregate replacement rate, where ω1 is the growth rate of the ultimate bond strength of each test group under chloride corrosion compared with the initial state.
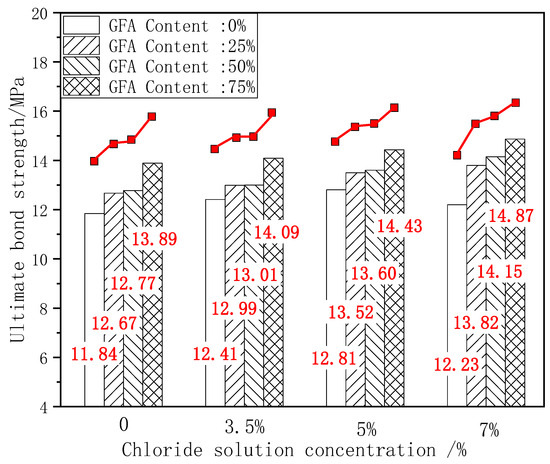
Figure 6.
Comparison of τu under erosion.
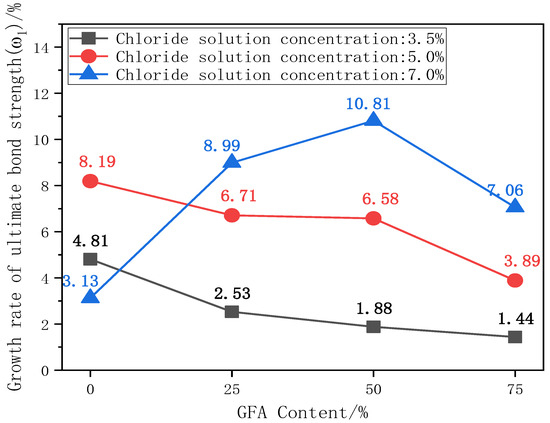
Figure 7.
Curve of ω1 with replacement rate.
As shown in Figure 6, taking the ultimate bond strength of NARC as the benchmark value, 25%GFARC, 50%GFARC, and 75%GFARC increased, respectively, by 7%, 7.85%, and 17.31% under the natural condition. With 3.5%–7% chloride corrosion, the ultimate bond strength of the GFARC test group is always superior to that of the NARC test group, and increases with an increase in the replacement rate. The GFARC groups increased, respectively, by 4.67%, 4.83%, and 13.53% under 3.5% chlorine erosion. The GFARC groups increased, respectively, by 5.54%, 6.24%, and 12.64% under 5% chlorine erosion. From this phenomenon, it can be inferred that the use of glass sand can ameliorate the bond property between the concrete and reinforcement, and the effect is related to the substitution rate. Due to the low concentration of chloride salt, the corrosion rate of steel bars is low. The rust on the surface of the steel bar increases the radial pressure and the roughness of the contact surface. Therefore, the friction and bite force between the steel bar and the concrete at the initial stage of corrosion are slightly improved, which is beneficial to the increase in bond strength.
ω1 is the growth rate of the ultimate bond strength of each aggregate replacement rate test group under chloride salt erosion compared with the initial state. The ω1 growth rate of glass aggregate concrete specimens increases with an increase in chloride concentration. It can be seen from Figure 7 that ω1 exhibits a downward trend with the replacement rate of aggregate under 3.5% and 5% chlorine erosion. It can be seen that the addition of glass sand seems to weaken the positive effect of chloride ions on bonding properties.
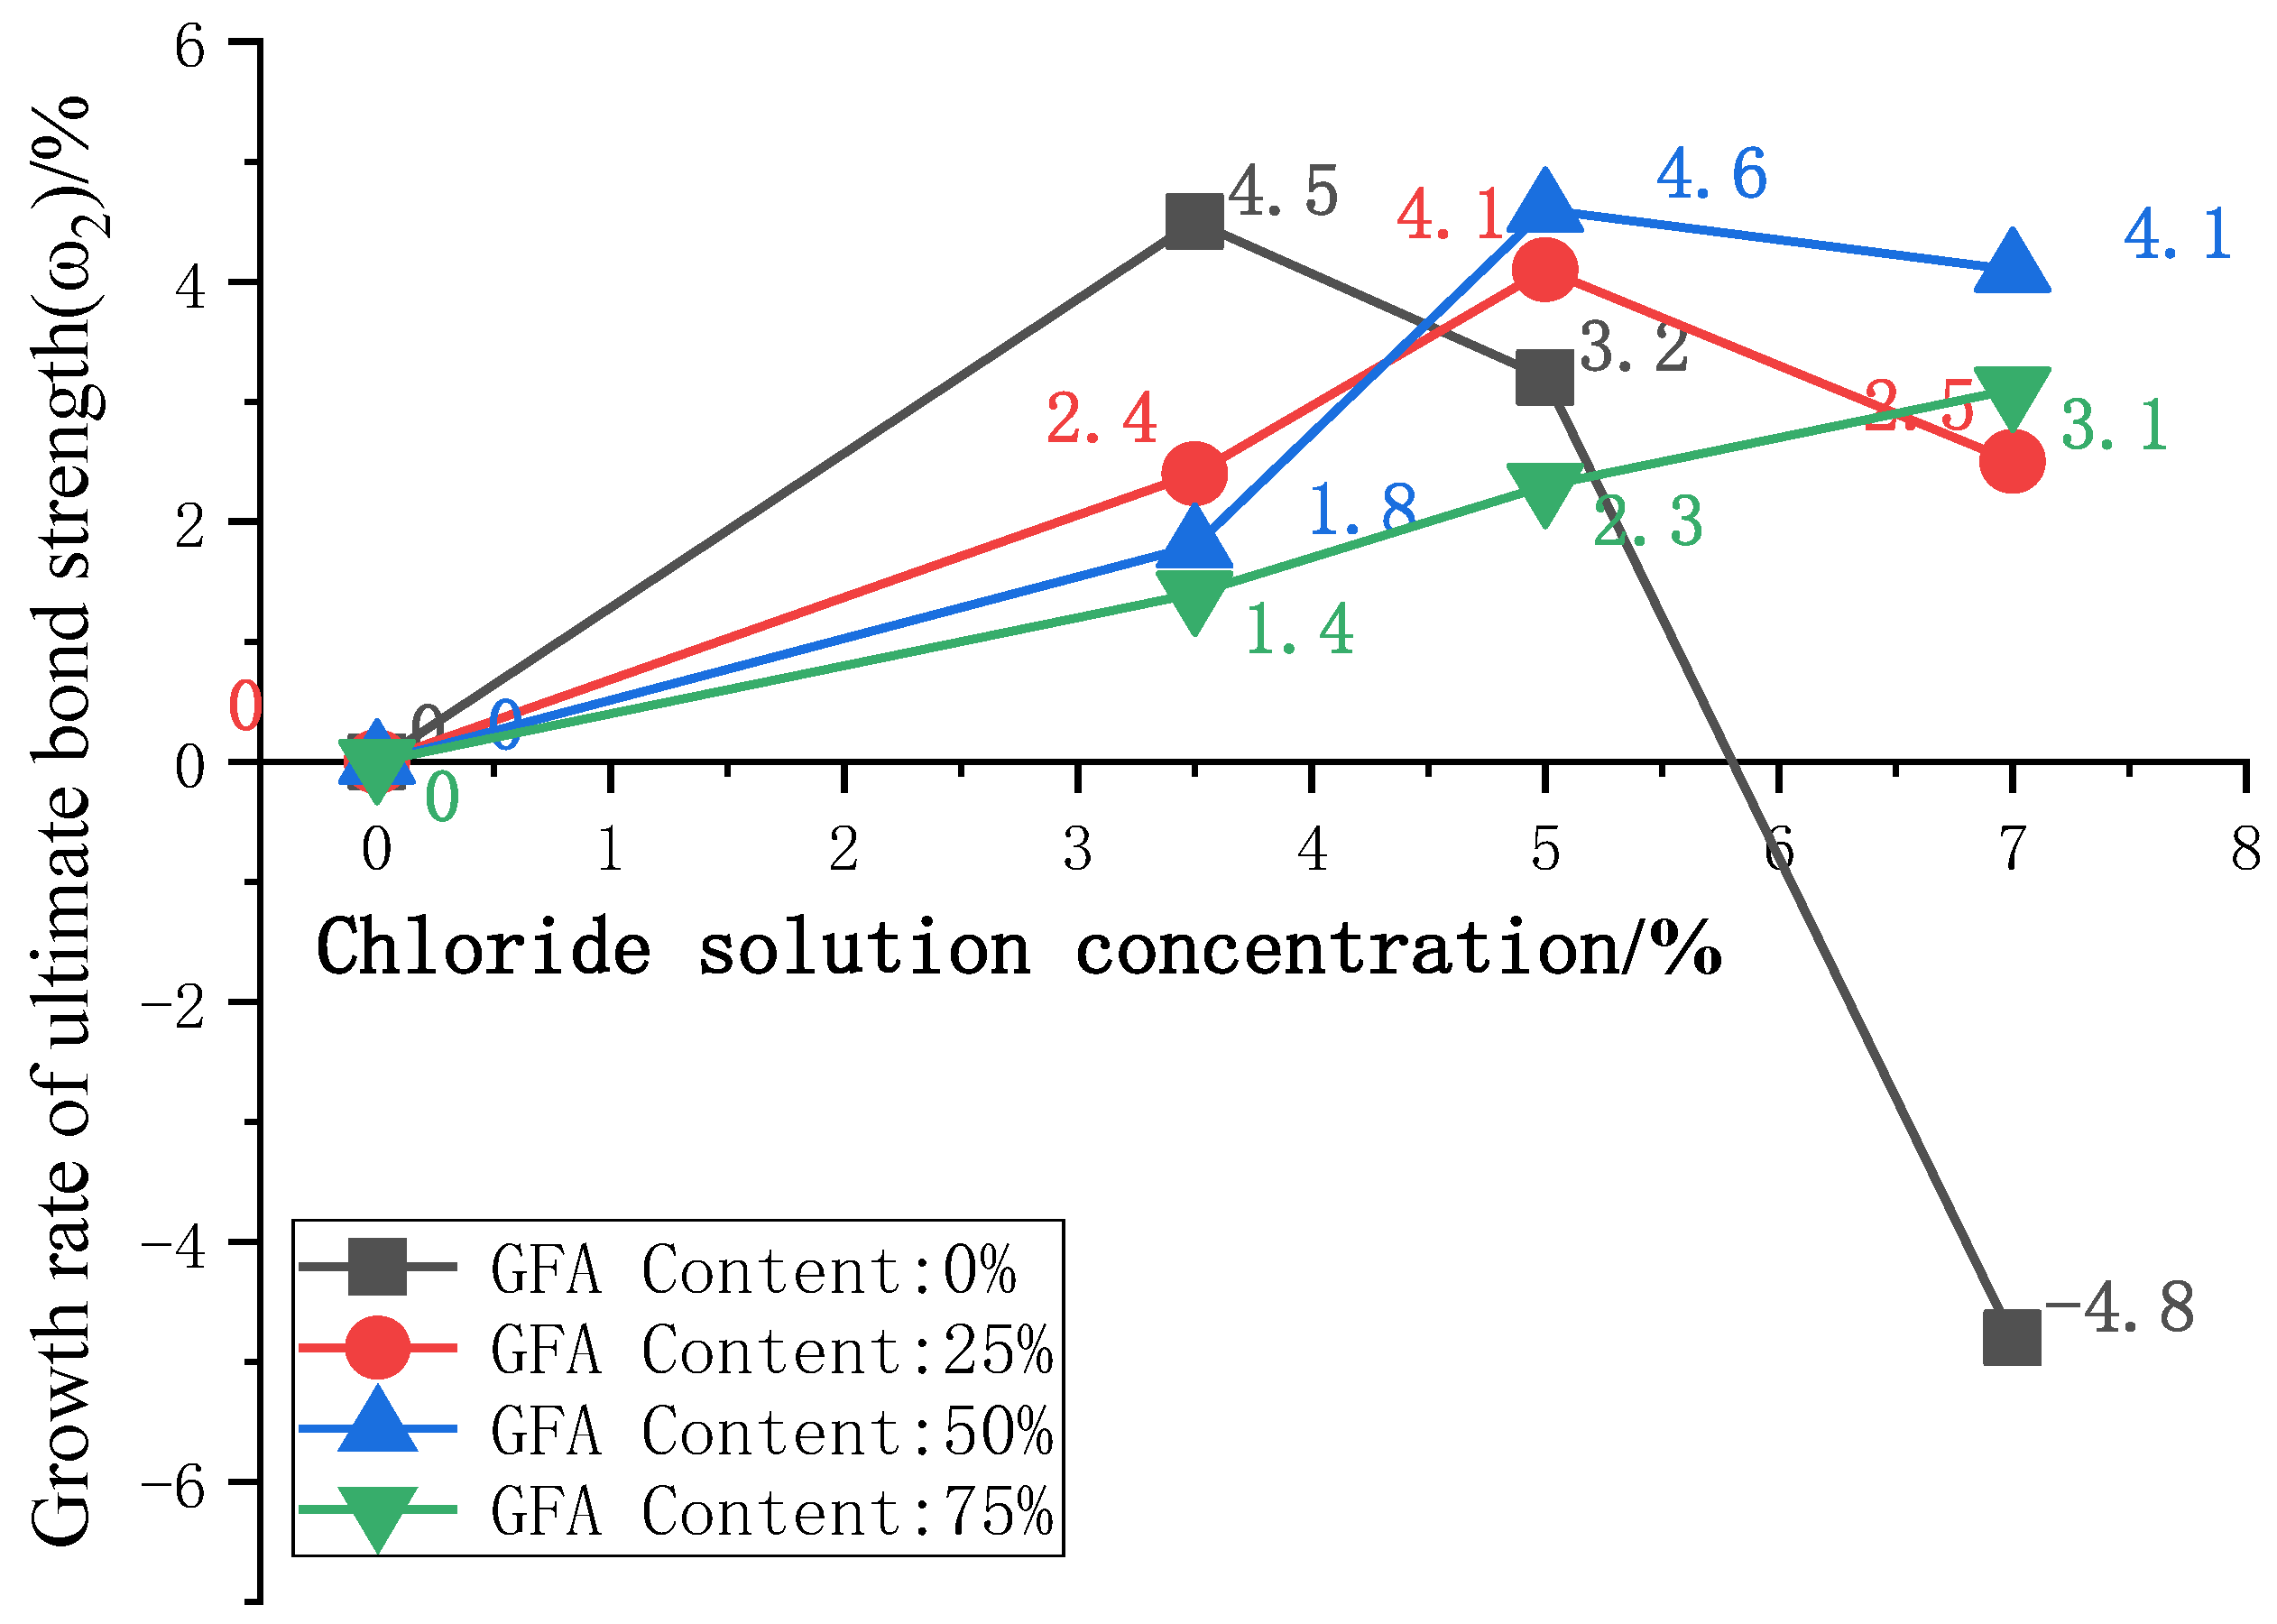
To further analyze the influence of the glass sand on the bond strength under a chloride attack, the curves of the ultimate bond strength growth ω2 with chloride concentration are plotted in Figure 8, where ω2 is the ultimate bond strength growth rate between adjacent chloride concentrations.
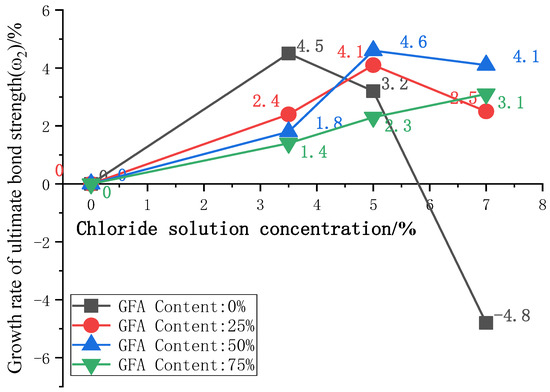
Figure 8.
Curve of ω2 with concentration of Cl−.
The ω2 of GFARC maintains positive growth with an increase in chloride concentration of 0%–7%. The NARC group showed a negative growth in chloride concentration of 7%. With the solution concentration gradually increasing, the bond strength growth rate ω2 of the three test groups with aggregate replacement rates of 0%, 25%, and 50% increased first and then decreased, while the bond strength growth rate of the 75% aggregate replacement rate group increased. From this phenomenon, we can deduce that the addition of glass sand delayed the positive effect of the chloride ion on bond strength rather than weakening the effect. And glass sand can enhance the positive effect. The detailed analysis of this phenomenon is as follows:
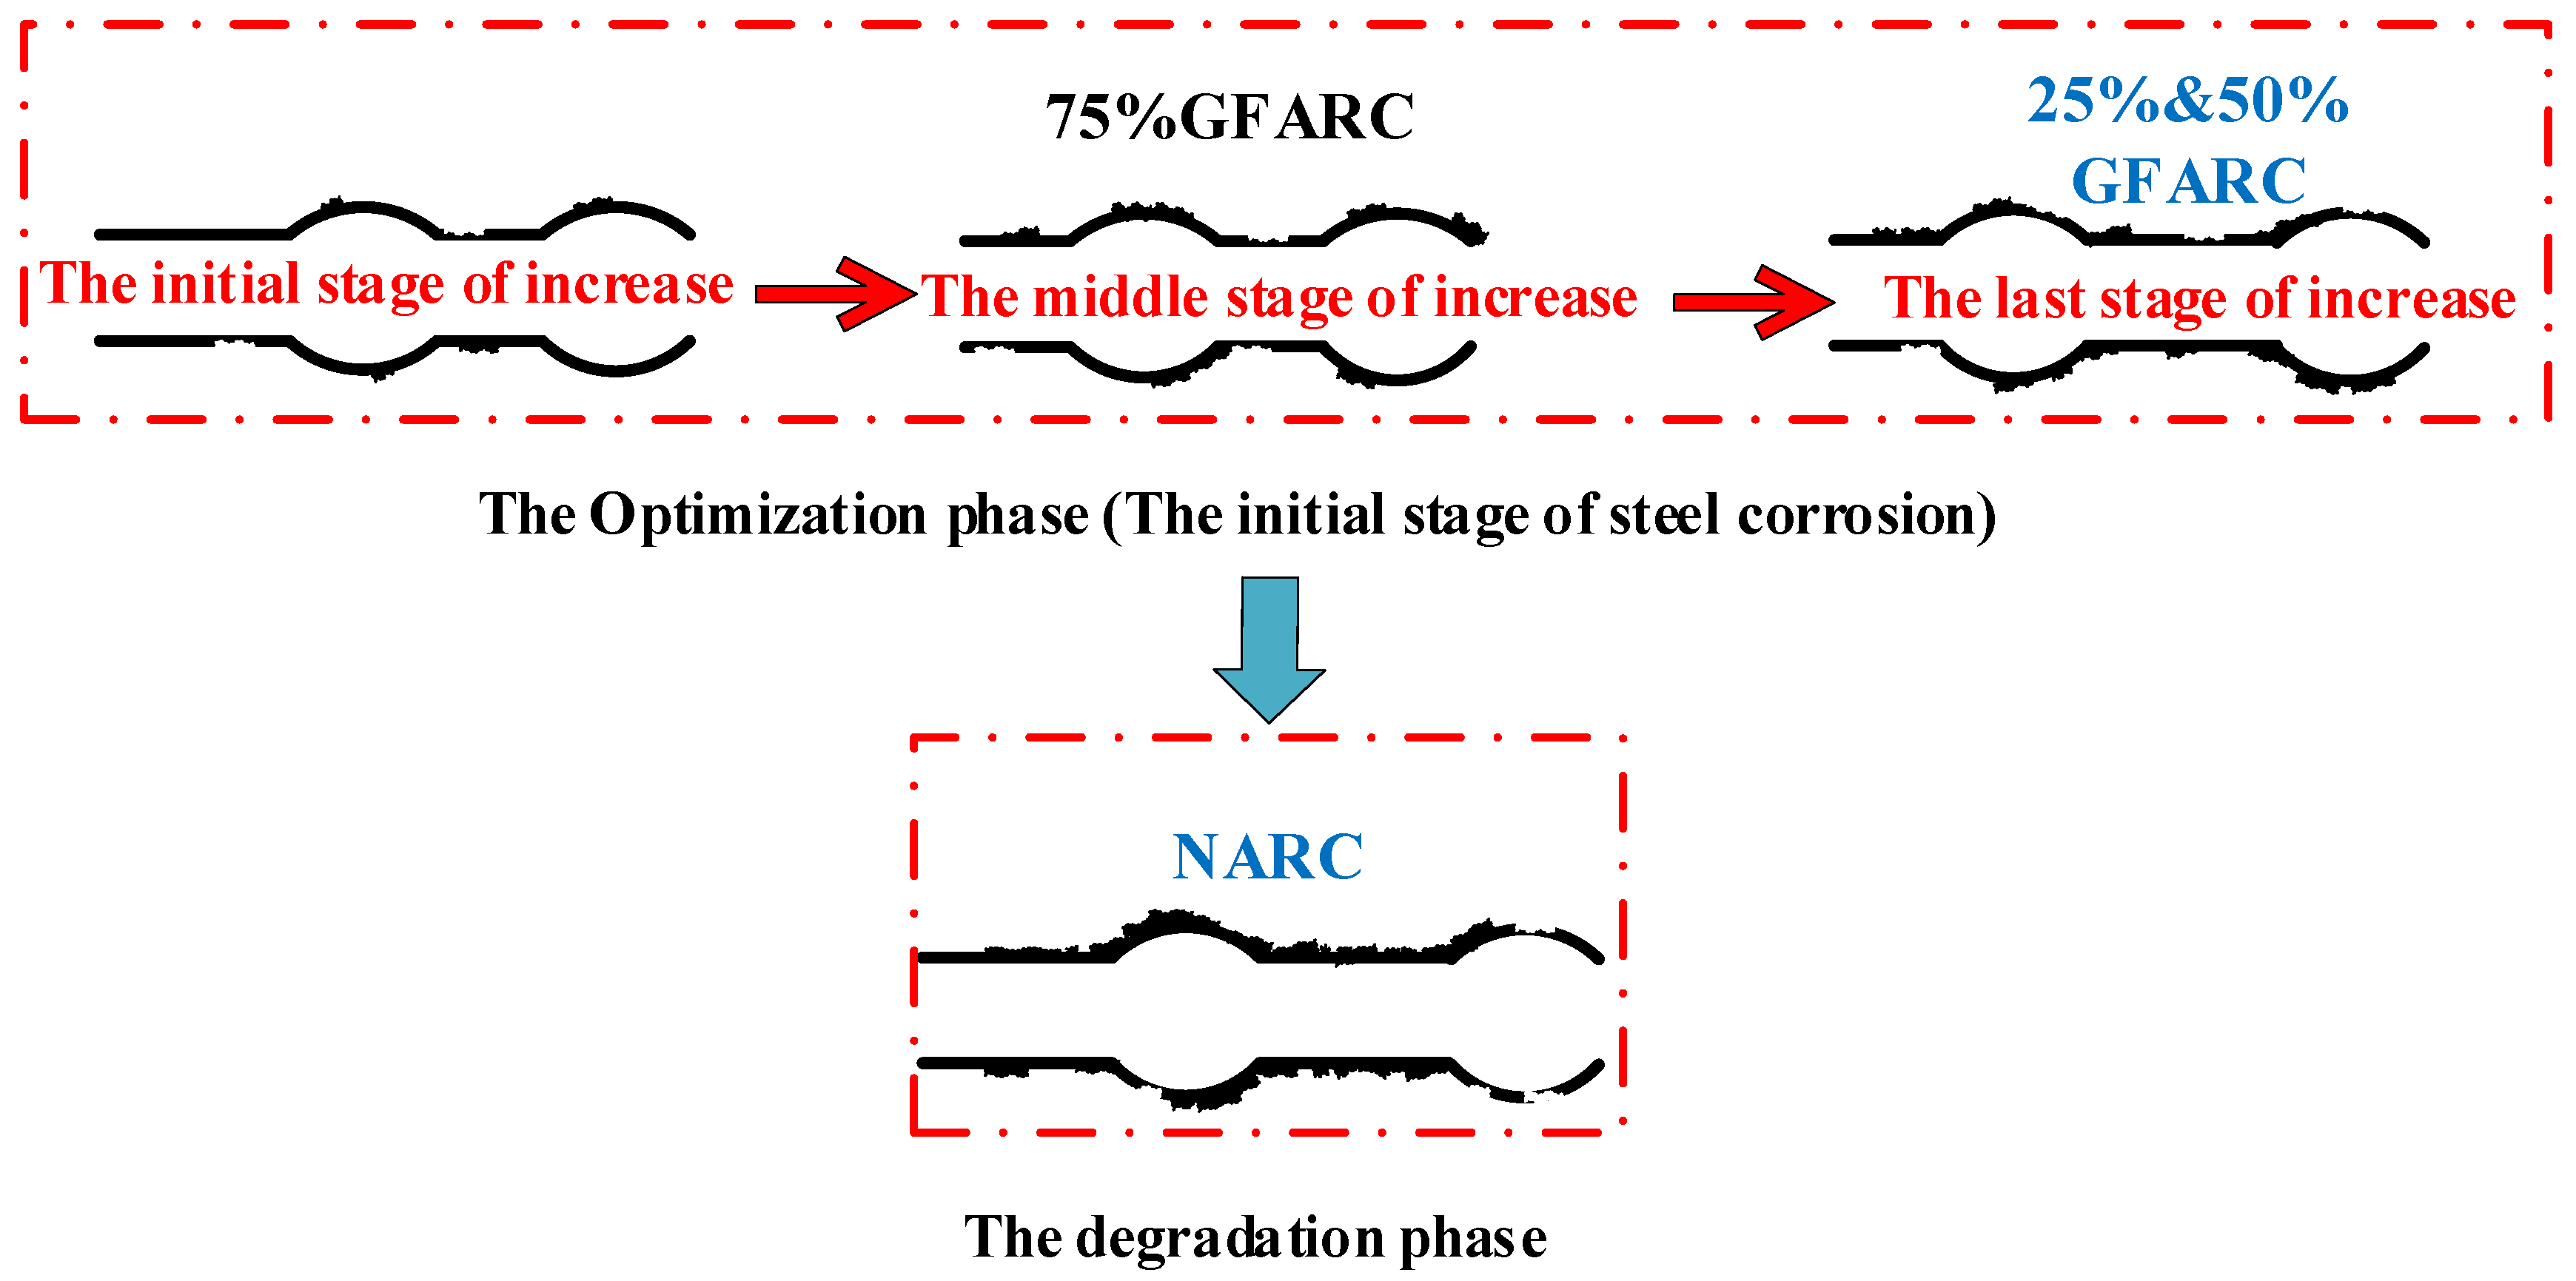
(1) According to the growth characteristics of the bond strength at the initial stage of corrosion, this stage can be divided into three stages: the initial stage of increase (the increase in bond strength is small), the middle stage of increase (the increase is large), and the late stage of increase (the increase is attenuated). Finally, the increase in bond strength stops, and the optimization period of the bond strength caused by steel corrosion ends. As shown in Figure 9.
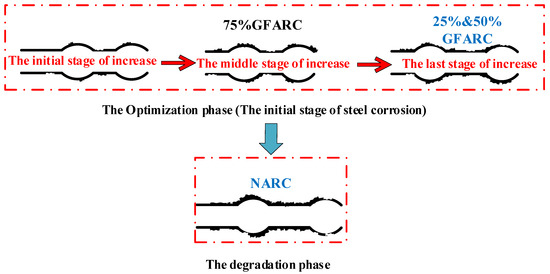
Figure 9.
Division diagram of the initial stage of corrosion.
(2) According to the analysis in Figure 7 and Figure 8, when the concentration of chloride solution reaches 7%, the GFARC groups are in the bond performance optimization stage. The 25% and 50% groups are in the late stages of increasing under the 7% chloride solution. The 75% groups should be in the early stages of increasing under the 7% chloride solution, as shown in Figure 9. This phenomenon is due to the different chloride corrosion resistances of GFARC under different replacement rates. The results show that the addition of glass sand delays and prolongs the positive effect of chloride ions on bond strength rather than weakening this effect.
3.3.2. Peak Slip and Bond Stiffness
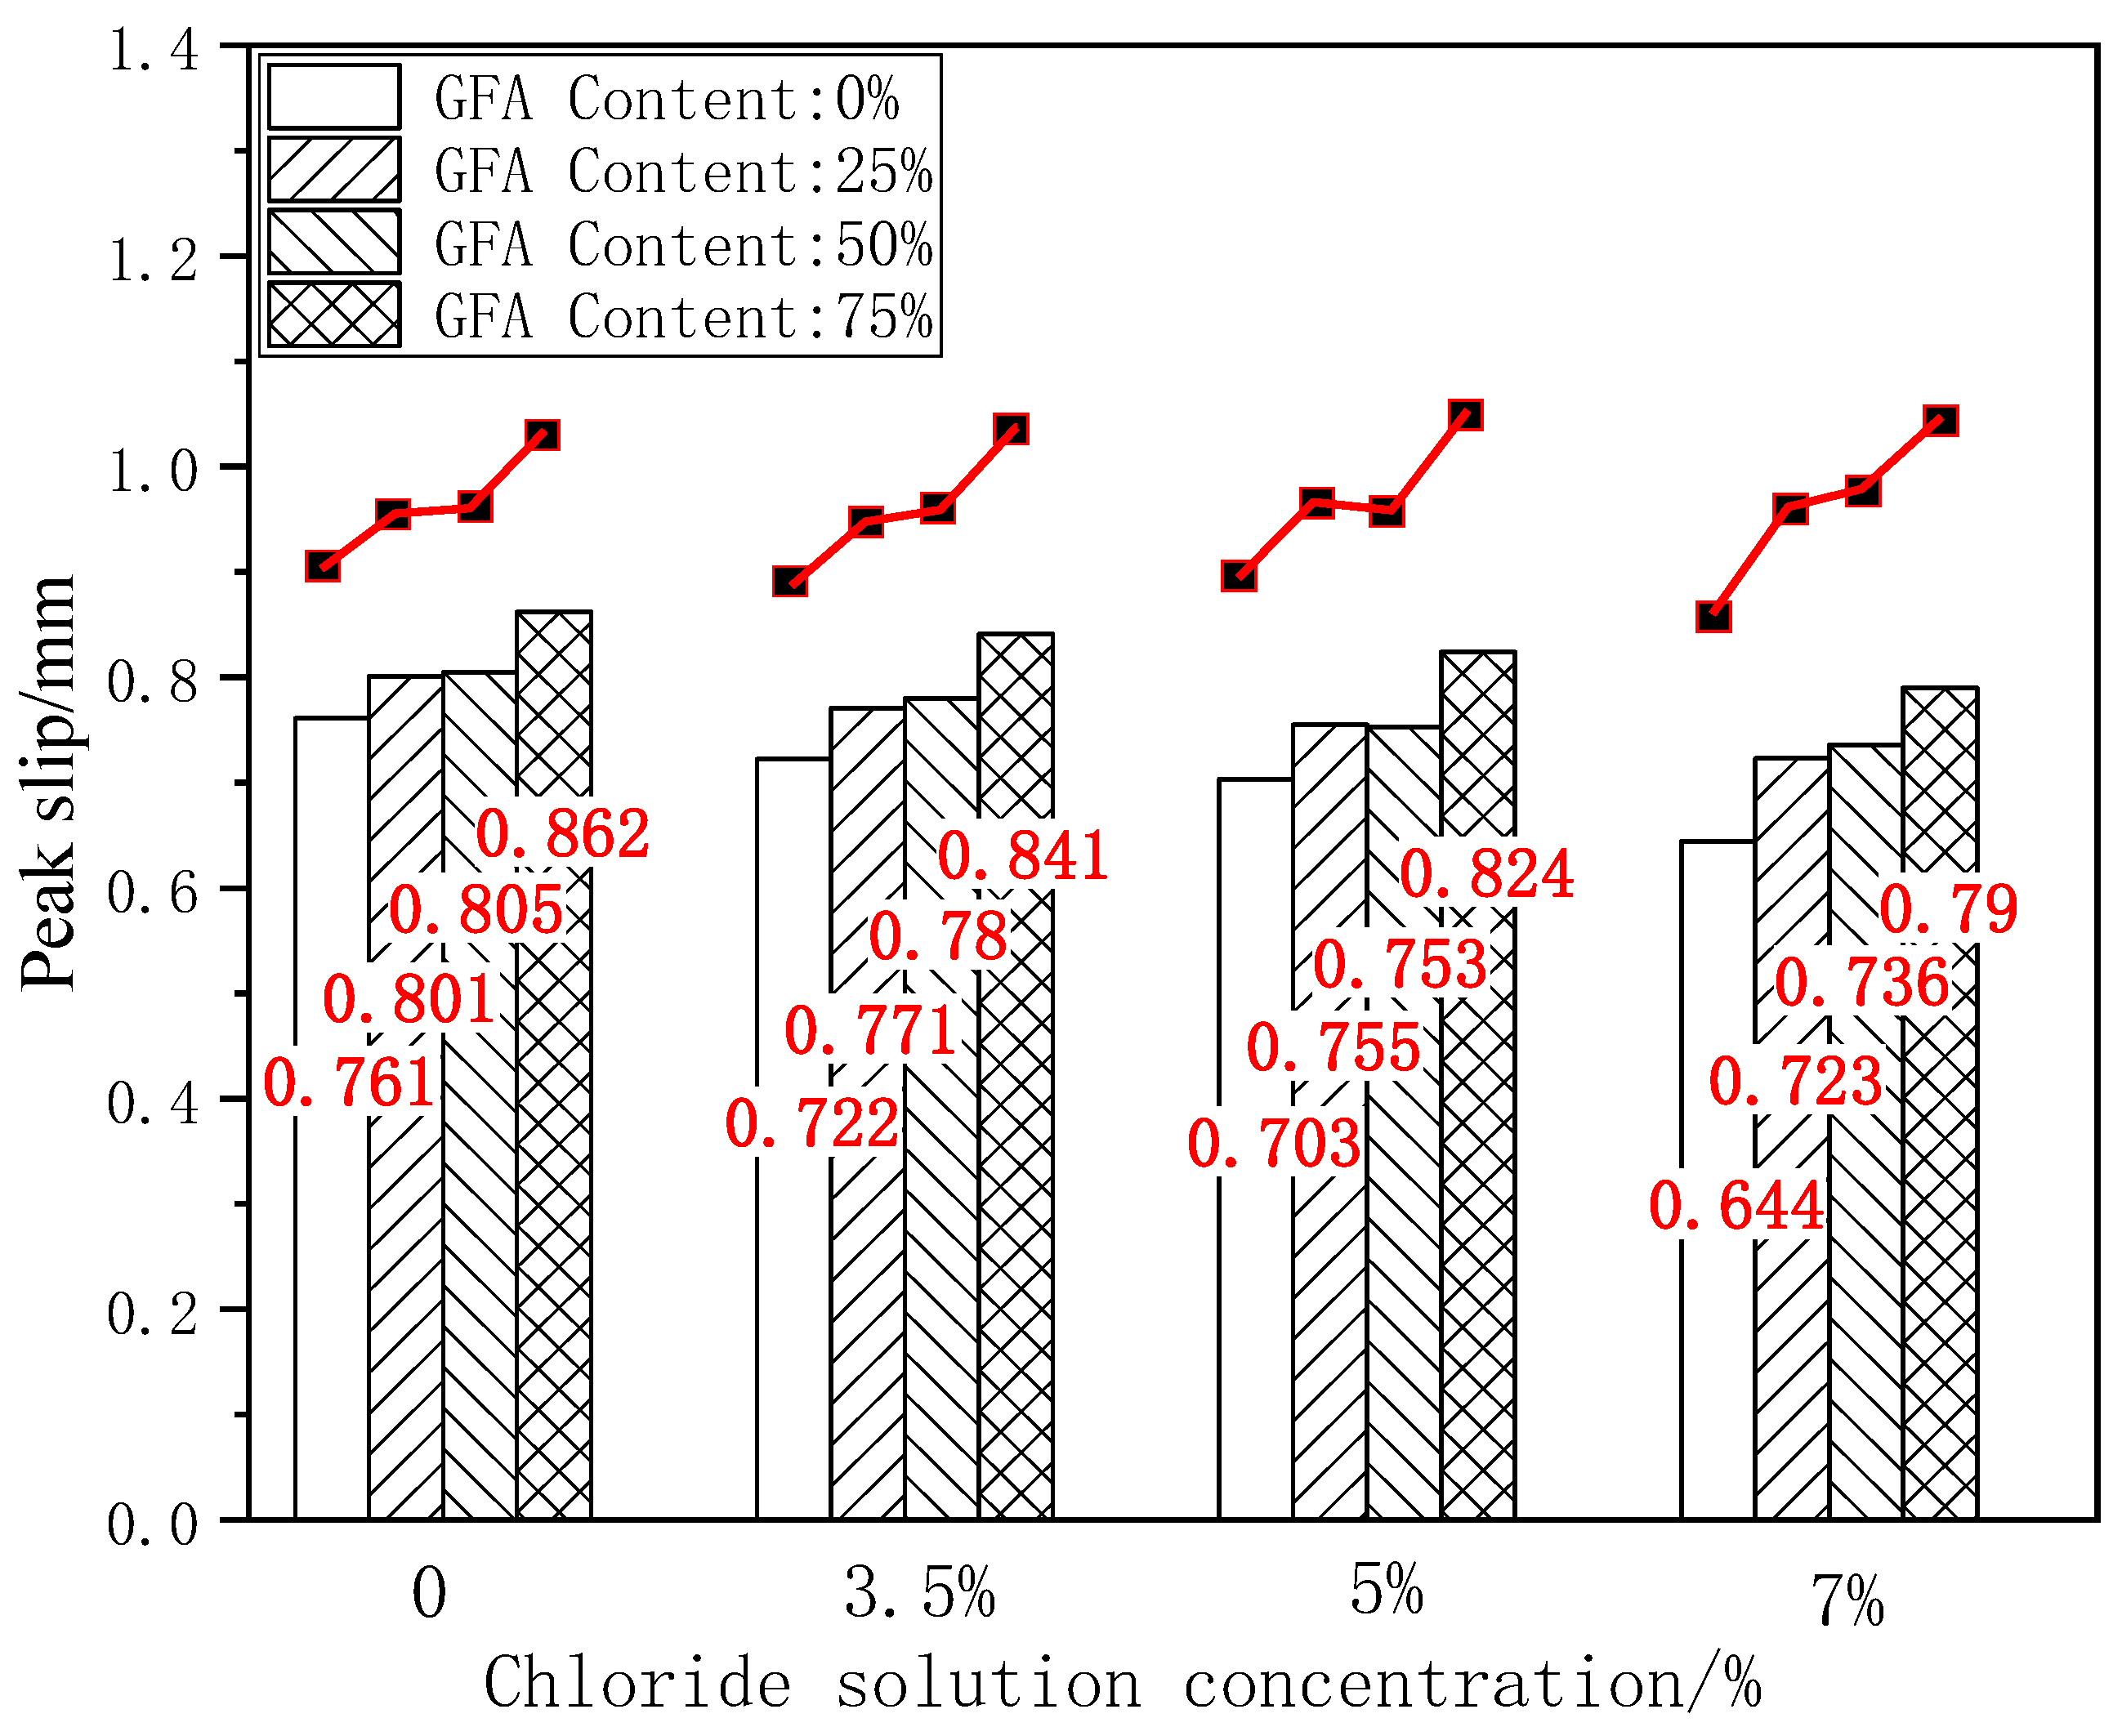
The peak slip is the relative slip value between reinforced concrete when the load reaches the ultimate bond strength, which is an important index for evaluating the bond ductility of reinforced concrete. As an important index of the bond performance evaluation, bond stiffness shows the resistance of the reinforced concrete anchoring force to a relative slip. Figure 10 shows the histogram of the peak slip for each test group under different chloride concentrations.
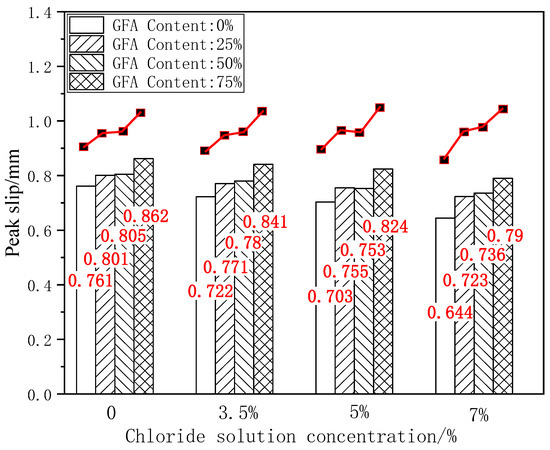
Figure 10.
Comparison of Su under chloride erosion.
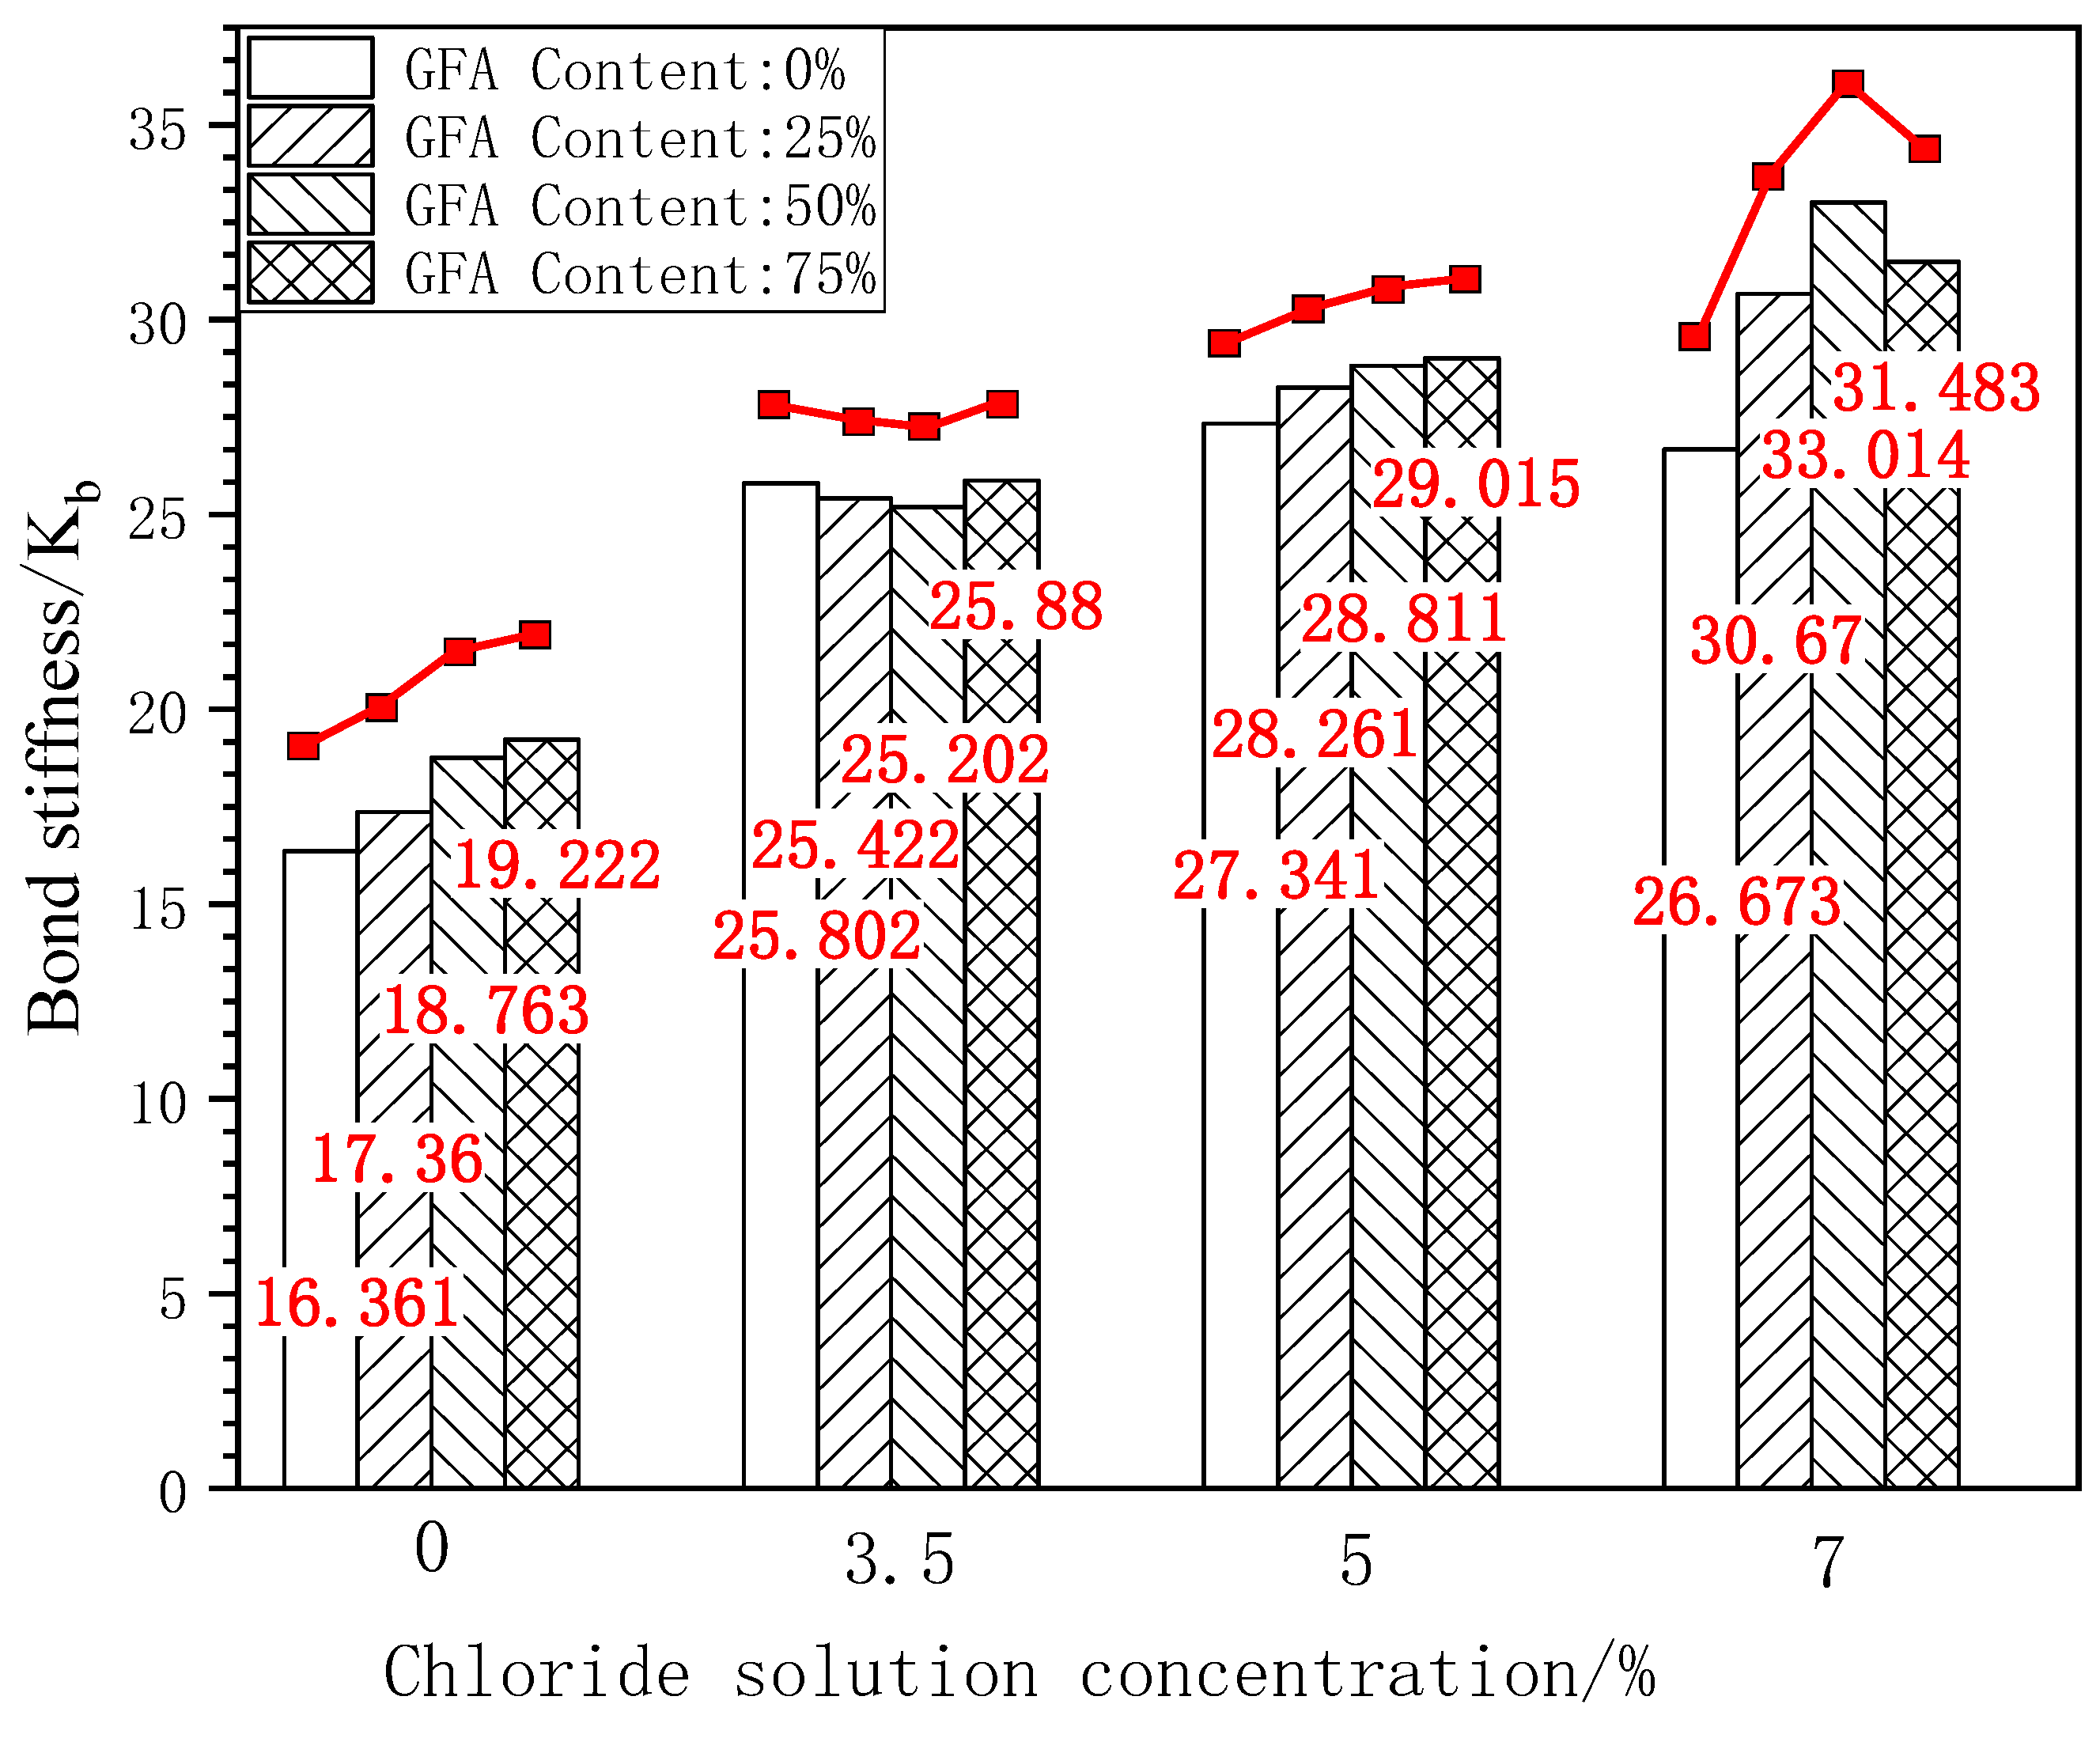
Figure 11 shows the bar chart and change curve of the bond stiffness of each test group under different concentrations of chloride erosion.

Figure 11.
Comparison of Kb under freeze-thaw cycles.
As shown in Figure 10, it can be seen that the peak slip of the GFARC test group is greater than that of the NARC test group under the initial state and chloride corrosion at various concentrations, which is consistent with the comparison results of the ultimate bond strength. Taking the ultimate bond strength of NARC as the benchmark value, 25%GFARC, 50%GFARC, and 75%GFARC increased, respectively, by 5.25%, 5.78%, and 13.27% under the control condition. The GFARC groups increased, respectively, by 6.78%, 8.03%, and 16.48% under 3.5% chlorine erosion. The GFARC groups increased, respectively, by 7.39%, 7.11%, and 17.21% under 5% chlorine erosion. It can be concluded that glass sand has a significant effect on the bond ductility of reinforced concrete. And the influence of glass sand on the bonding property is more and more obvious with the deepening of erosion.
According to Figure 11, the bond stiffness of the GFARC test group is significantly improved under the initial condition, which is 6%–17% higher than that of NARC. Compared with the initial state, the bond stiffness of NARC corroded by 3.5% chloride was better than that of 25% GFARC and 50% GFARC, which is 1.47% and 2.32%, respectively. When the concentration reached 5% and 7%, the bond stiffness of the GFARC test group was higher than that of the NARC test group. Taking the ultimate bond strength of NARC as the benchmark value, 25%GFARC, 50%GFARC, and 75%GFARC increased, respectively, by 3.36%, 5.37%, and 6.12% under 5% chlorine erosion. The three groups of GFARC increased, respectively, by 16.76%, 25.68%, and 16.48% under 7% chlorine erosion. Compared with natural river sand, the contact between multi-angular glass sand and the rough surface of corroded steel bars can provide a higher friction force, so its addition enhances the bonding stiffness of reinforced concrete.
The addition of glass sand optimizes the compactness of the concrete structure and can resist chloride ion penetration. It can be inferred that NARC is more sensitive to chloride ion erosion than GFARC, and low-concentration chloride ion erosion can greatly improve bonding performance. In contrast, the GFARC groups showed a certain insensitivity to chloride ion erosion. But the increased range of bond stiffness is greater in the GFARC groups. The use of glass sand can magnify the positive effect of chloride ion erosion.
3.4. Analysis of the Bond Mechanism of GFARC
The bond force between the deformed steel and concrete is composed of a chemical adhesive force, friction resistance, and a mechanical interaction force. As shown in Figure 12 [24], the wedge effect of the transverse rib becomes more obvious with the increase in the relative dislocation between the reinforcement and concrete, which leads to an increase in the oblique pressure. The chemical adsorption force fails, and the friction resistance at the interface and the mechanical interaction force of reinforced concrete become the main components of the bond force. Glass products can replace natural fine aggregate to prepare concrete at a low substitution amount because of their own crushing index, density, and other properties close to those of natural sand and gravel. Although the surface of glass particles is smooth and the bonding force with cement is weak, this defect can be ignored when the substitution amount is small. The surface roughness of the broken glass fine aggregate increases, and the glass material itself has the properties of high hardness and high durability, so that the glass fine aggregate can make up for its own defects at a low amount. Glass sand possesses the characteristics of an irregular shape and multiple edges. Therefore, the addition of glass sand can help increase the roughness of the interface between steel and concrete, which improves the friction coefficient and thus enhances the friction resistance [10]. Glass sand with multiple edges and high hardness formed an interlocking system to significantly improve the mechanical bite effect. There is an interlocking effect between the glass sand, which is mainly caused by the shape characteristics of the glass sand. In addition, the shape of glass sand is narrower than that of natural river sand, so it has a certain inhibitory effect on the development of diagonal cracks [5].
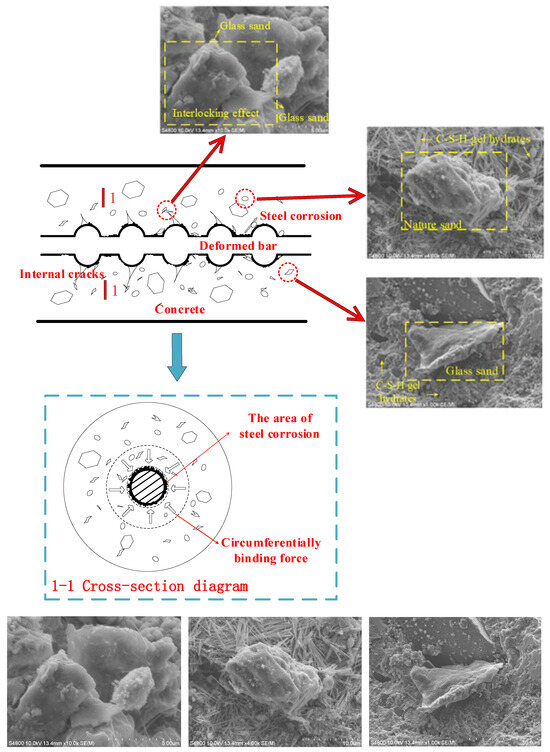
Figure 12.
Schematic of extrusion and cracking of GAC and reinforcement corrosion. The three images at the bottom are enlargements of the three images at the top.
In addition, relative sliding causes the high-toughness river sand to peel off the concrete. The part scattered on the surface of the reinforcement will form a “ball effect”, which promotes the relative sliding between the concrete and reinforcement. The glass sand with high hardness is easily broken into smaller and angular glass sand, which not only enhances the “blocking effect” but also further increases the friction between the reinforcement and concrete.
As shown in Figure 12, the C-S-H gel hydrates of 75% GFARC show high-density cotton flocculation. The excellent durability of GFAC has been confirmed by the sub-microstructure. The extremely low water absorption of glass sand is conducive to the promotion of the hydration reaction. Compared with the NARC group, the density is greatly improved. So GFARC has a high resistance to chloride-ion corrosion.
At the initial stage of corrosion, the surface roughness of the reinforcement is improved, which enhances the friction between the contact surface of the reinforcement and concrete and enhances the mechanical interaction between the transverse rib and concrete. Meanwhile, the volume of reinforcement slightly increased owing to the accumulation of rust. The hoop restraint effect of concrete on the reinforcement is enhanced, which improves the “gripping effect”. The irregular glass fine aggregate can significantly improve the bond performance of reinforced concrete, which enhances the bond strength and bond stiffness of GFARC. The range of increase is greater than that of NARC.
In addition, owing to the brittleness of the fine glass aggregate, the ductility of the GFA decreases further, and the failure suddenly increases.
4. Conclusions
1. GFARC has excellent resistance to chloride ion erosion. The pozzolanic characteristics and low water absorption of glass sand help it to easily react with alkaline substances in concrete to form cementitious polymers. The hydration reaction is more complete, which can optimize the compactness. Hence, compared with NARC, GFARC is more suitable for environments with a high chloride content.
2. The positive effect of glass sand is greater than the negative influence on bond behavior. The addition of glass sand delayed and extended the positive effect of the chloride ion on bond strength, rather than weakening the effect. And the use of glass sand can magnify the positive effect of chloride ion erosion. So that the increase in bond behavior is greater in the GFARC, and the positive effect lasts longer. Under the effect of chloride erosion, the bond performance of GFARC is better than that of NARC. And the degree of impact is related to the GFA content.
3. The influence of GFAC on the bond performance of reinforced concrete under chloride corrosion is the result of the joint influence of the physical and chemical properties of the glass sand. The pozzolanic characteristics and low water absorption of glass sand can improve its compactness. The glass sand has clear edges and corners, which improve the friction force and mechanical interaction and inhibit crack development to a certain extent. Glass sand formed an interlocking system to significantly improve the mechanical bite effect. And the broken fine glass aggregate on the reinforced concrete interface not only enhances the friction effect but also strengthens the blocking effect. So the use of glass sand can magnify the positive effect of mild chloride ion erosion. However, glass sand has the characteristics of high fragility and poor ductility, which may lead to the smaller peak slip of the GFARC and the sudden failure of the bond. In the process of using it, we need to be vigilant about this.
4. Glass aggregate reinforced concrete has good anchorage ductility. In the glass fine aggregate concrete specimen, the relative slip between the steel bar and the concrete, when the ultimate bond stress is reached, is similar to that of ordinary aggregate concrete. In the glass coarse aggregate concrete specimen, the relative slip between the steel bar and the concrete when the ultimate bond stress is reached is greater than that of the ordinary aggregate concrete.
To sum up, this indicates that the use of glass sand instead of natural sand in reinforced concrete structure is not only feasible but also has a great advantage in improving bond performance.
Author Contributions
Conceptualization, J.L. and H.G.; Methodology, J.L. and F.W.; Software, J.L.; Validation, H.G., F.W. and Y.L.; Formal analysis, J.L. and H.G.; Investigation, Y.L.; Data curation, J.L. and Y.L.; Writing—original draft, J.L. and H.G.; Supervision, F.W. All authors have read and agreed to the published version of the manuscript.
Funding
This research received no external funding.
Institutional Review Board Statement
Not applicable.
Informed Consent Statement
Informed consent was obtained from all subjects involved in the study.
Data Availability Statement
Data used to support the findings of this study are available from the corresponding author upon request.
Conflicts of Interest
The authors declare that there are no conflict of interest regarding the publication of this paper.
Glossary
| ρ | density of the steel bars/% (ρ = 7.78 g/cm3) |
| L | length of the interception segment/mm |
| M | mass of steel bar/Kg |
| S | sectional area/mm2 |
| τ | average bond stress/MPa, |
| P | bond force/kN |
| d | reinforcement diameter/mm |
| anchorage length/mm | |
| P1 | tensile force at the end of the loading |
| Es | elastic modulus of reinforcement |
| As | cross-sectional area of the reinforcement |
| LS | original length of the CD section |
References
- Khan, N.N.; Saha, A.K.; Sarker, P.K. Reuse of waste glass as a supplementary binder and aggregate for sustainable cement-based construction materials: A review. J. Build. Eng. 2019, 28, 101052. [Google Scholar] [CrossRef]
- Topcu, I.B.; Canbaz, M. Properties of concrete containing waste glass. Cem. Concr. Res. 2004, 34, 267–274. [Google Scholar] [CrossRef]
- Khmiri, A.; Chaabouni, M.; Samet, B. Chemical behaviour of ground waste glass when used as partial cement replacement in mortars. Constr. Build. Mater. 2013, 44, 74–80. [Google Scholar] [CrossRef]
- Kim, I.S.; Choi, S.Y.; Yang, E.I. Evaluation of durability of concrete substituted heavyweight waste glass as fine aggregate. Constr. Build. Mater. 2018, 184, 269–277. [Google Scholar] [CrossRef]
- Shao, Y.; Lefort, T.; Moras, S.; Rodriguez, D. Studies on concrete containing ground waste glass. Cem. Concr. Res. 2000, 30, 91–100. [Google Scholar] [CrossRef]
- Dyer, T.D.; Dhir, R.K. Chemical Reactions of Glass Cullet Used as Cement Component. J. Mater. Civ. Eng. 2001, 13, 412–417. [Google Scholar] [CrossRef]
- Shayan, A.; Xu, A. Performance of Glass Powder as a Pozzolanic Material in Concrete. Cem. Concr. Res. 2002, 36, 457–468. [Google Scholar] [CrossRef]
- Saha, A.K.; Khan, M.; Sarker, P.K.; Shaikh, F.A.; Pramanik, A. The ASR mechanism of reactive aggregates in concrete and its mitigation by fly ash: A critical review. Constr. Build. Mater. 2018, 171, 743–758. [Google Scholar] [CrossRef]
- Du, H.; Tan, K.H. Waste Glass Powder as Cement Replacement in Concrete. J. Adv. Concr. Technol. 2014, 12, 468–477. [Google Scholar] [CrossRef]
- Wang, F.; Wu, X.; Guo, C.; Song, W. Experimental Study on Bond Strength of Deformed Steel Bars in Recycled Glass Aggregate Concrete. KSCE J. Civ. Eng. 2018, 9, 3409–3418. [Google Scholar] [CrossRef]
- Taha, B.; Nounu, G. Utilizing Waste Recycled Glass as Sand/Cement Replacement in Concrete. J. Mater. Civ. Eng. 2009, 21, 709–721. [Google Scholar] [CrossRef]
- Du, H.; Tan, K.H. Concrete with Recycled Glass as Fine Aggregates. ACI Mater. J. 2014, 111, 47–58. [Google Scholar]
- Cota, F.P.; Melo, C.C.D.; Panzera, T.H.; Araújo, A.G.; Borges, P.H.R.; Scarpa, F. Mechanical properties and ASR evaluation of concrete tiles with waste glass aggregate. Sustain. Cities Soc. 2015, 16, 49–56. [Google Scholar] [CrossRef]
- Ababneh, A.; Benboudjema, F.; Xi, Y. Chloride Penetration in Nonsaturated Concrete. J. Mater. Civ. Eng. 2003, 15, 183–191. [Google Scholar] [CrossRef]
- Zhu, W.; François, R. Experimental investigation of the relationships between residual cross-section shapes and the ductility of corroded bars. Constr. Build. Mater. 2014, 69, 335–345. [Google Scholar] [CrossRef]
- Lee, H.-S.; Noguchi, T.; Tomosawa, F. Evaluation of the bond properties between concrete and reinforcement as a function of the degree of reinforcement corrosion. Cem. Concr. Res. 2002, 32, 1313–1318. [Google Scholar] [CrossRef]
- Tondolo, F. Bond behavior with reinforcement corrosion. Constr. Build. Mater. 2015, 93, 926–932. [Google Scholar] [CrossRef]
- Coccia, S.; Imperatore, S.; Rinaldi, Z. Influence of corrosion on the bond strength of steel rebars in concrete. Mater. Struct. 2016, 49, 537–551. [Google Scholar] [CrossRef]
- Auyeung, Y.B.; Balaguru, P.; Chung, L. Bond behavior of corroded reinforcement bars. ACI Mater. J. 2000, 97, 214–220. [Google Scholar]
- Fang, C.; Lundgren, K.; Plos, M.; Gylltoft, K. Bond behavior of corroded reinforcing steel bars in concrete. Cem. Concr. Res. 2006, 36, 1931–1938. [Google Scholar] [CrossRef]
- Alhawat, M.; Ashour, A. Bond strength between corroded steel reinforcement and recycled aggregate concrete. Structures 2019, 19, 369–385. [Google Scholar] [CrossRef]
- Wang, Q.; Dai, R.; Wang, S.; Wang, Y. Prediction Algorithm and Interpretation for Autogenous Shrinkage of Concrete Based on Machine Learning. J. Shenyang Jianzhu Univ. 2023, 39, 1050–1057. [Google Scholar]
- IS 8112:1989; Specification for 43 Grade Ordinary Portland Cement. Bureau of Indian Standards (BIS): New Delhi, India, 1989.
- Wang, F.; Guo, H.; Lin, Z.; Zhao, H. Bond Properties of Glass Aggregate–Reinforced Concrete after Freeze–Thaw Cycles. J. Cold Reg. Eng. 2024, 38, 04023025. [Google Scholar] [CrossRef]
- Xu, Y. Experimental Study on Bond Anchorage Behavior of Deformed Bar and Concrete. Ph.D. Thesis, Tsinghua University, Beijing, China, 1990. (In Chinese). [Google Scholar]


Disclaimer/Publisher’s Note: The statements, opinions and data contained in all publications are solely those of the individual author(s) and contributor(s) and not of MDPI and/or the editor(s). MDPI and/or the editor(s) disclaim responsibility for any injury to people or property resulting from any ideas, methods, instructions or products referred to in the content. |
© 2024 by the authors. Licensee MDPI, Basel, Switzerland. This article is an open access article distributed under the terms and conditions of the Creative Commons Attribution (CC BY) license (https://creativecommons.org/licenses/by/4.0/).